Embed Size (px)
Citation preview
Paper No. 70
IMPACTS OF PARENTAL EDUCATION ON SUBSTANCE USE:DIFFERENCES AMONG WHITE, AFRICAN-AMERICAN, AND HISPANIC
STUDENTS IN 8TH, 10TH, AND 12TH GRADES (1999–2008)
Jerald G. BachmanPatrick M. O’MalleyLloyd D. Johnston
John E. Schulenberg


Impacts of Parental Education on Substance Use: Differences among White, African-American, and Hispanic Students
in 8th, 10th, and 12th Grades (1999–2008)
Monitoring the Future Occasional Paper No. 70
Jerald G. Bachman Patrick M. O’Malley Lloyd D. Johnston
John E. Schulenberg
Institute for Social Research University of Michigan
Ann Arbor, MI 2010

The data used in this study were collected under Grant Number R01DA01411 from the National Institute on Drug Abuse. The content is solely the responsibility of the authors. Recommended Citation:
Bachman, J. G., O’Malley, P. M., Johnston, L. D., & Schulenberg, J. E. (2010). Impacts of parental education on substance use: Differences among White, African-American, and Hispanic students in 8th, 10th, and 12th grades (1999–2008) (Monitoring the Future Occasional Paper No. 70). Ann Arbor, MI: Institute for Social Research. Available: http://www.monitoringthefuture.org/
ii
Occasional Paper No. 70

TABLE OF CONTENTS
Introduction ......................................................................................................................................1
Background ................................................................................................................................1
Methods............................................................................................................................................1
Samples ......................................................................................................................................1
Measures of Race-Ethnicity and Parental Education .................................................................2
Measures of Substance Use .......................................................................................................3
Analysis Approach .....................................................................................................................4
Results ..............................................................................................................................................4
Cigarette Use ..............................................................................................................................4
Heavy Drinking ..........................................................................................................................5
Marijuana Use ............................................................................................................................6
Use of Illicit Drugs other than Marijuana ..................................................................................6
Discussion ........................................................................................................................................6
References ........................................................................................................................................8
Impacts of Parental Education on Substance Use
iii
iv
Occasional Paper No. 70

INTRODUCTION The Monitoring the Future (MTF) project reports annually on levels and trends in self-reported substance use by secondary school students (e.g., Johnston, O’Malley, Bachman, & Schulenberg, 2009). The reports include subgroup comparisons, and these have revealed substantial differences among race/ethnicity groups, as well as some differences linked to parental education (as the available indicator of socioeconomic level). These comparisons are complicated by the substantial differences in racial/ethnic composition across levels of parental education. The present paper disentangles the confounding of race/ethnicity with parental education by examining the three largest race/ethnicity groups separately, showing and comparing how parental education is related to three common forms of substance use/abuse among adolescents. We show important interaction effects: The negative relationship between parental education and substance use is more pronounced among White adolescents than among those who are African American or Hispanic. We also unmask relationships between parental education and substance use that are clearer for White adolescents than for the total sample. Background In addition to the annual reports cited above, there have been a number of articles over the years presenting MTF findings on racial/ethnic subgroups. The first of these was Bachman et al. (1991), reporting differences in smoking, drinking, and illicit drug use among high school seniors in the classes of 1976–1989; a later report by Wallace et al. (2002) extended the coverage to the senior classes of 1976–2000; another report (Wallace et al., 2003) extended coverage to include 8th and 10th graders as well as seniors. Wallace and Muroff (2002) examined a wide range of risk factors for substance use, and found that among 12th graders African Americans were more likely than whites to experience economic deprivation, but economic disadvantage was a stronger predictor of substance use among whites. Wallace and Bachman (1991) also examined background factors, including parental education, as potential explanations of racial/ethnic differences in adolescent drug use; they concluded that controlling for background alone did not account for most such differences. A recent report by Wallace et al. (2009) examined a number of indicators of socioeconomic status (SES) as they related to smoking among 8th-grade girls, and found that parental education was a particularly strong predictor of smoking. The present paper focuses on a single indicator of SES (parental education), and extends coverage to include both genders, all three grades covered by MTF in-school surveys (8th, 10th, and 12th), and the three most frequently used substances (cigarettes, alcohol, and marijuana). Most important, as urged by Wallace and Muroff (2002), the present analyses are “race-specific,” examining patterns separately for race/ethnic subgroups of African-American, Hispanic, and White adolescents.
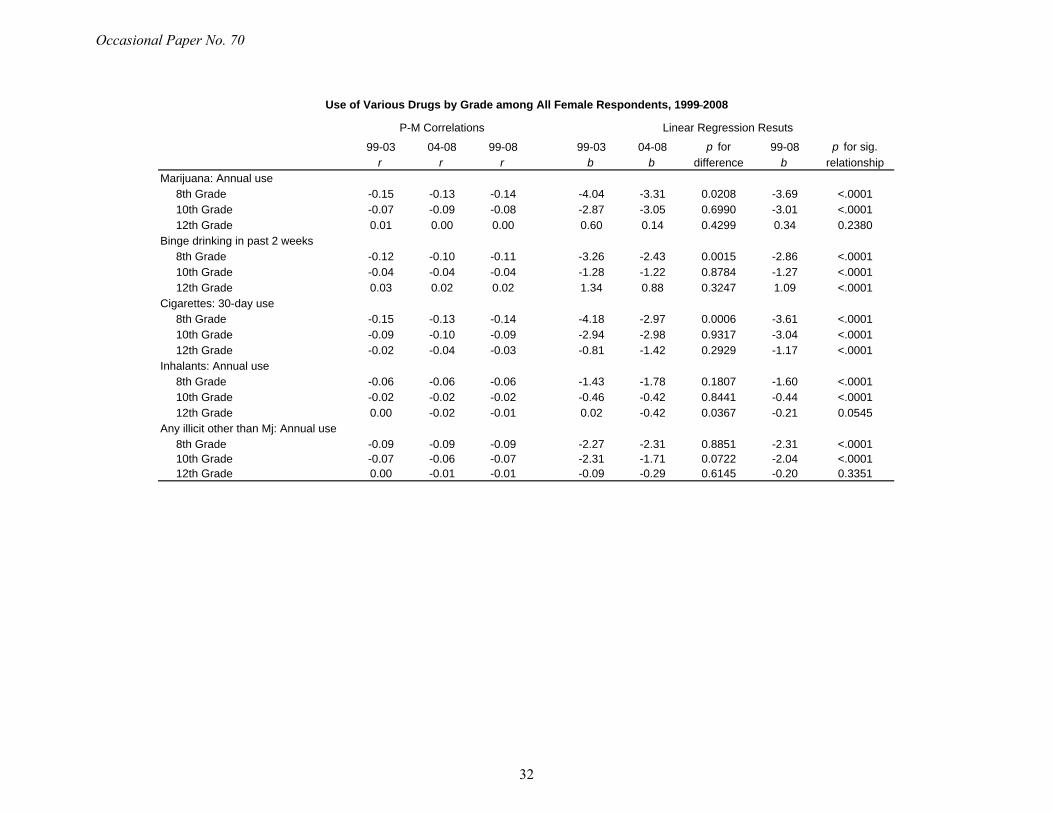
METHODS Samples In order to provide sufficiently large numbers of cases for the subgroups shown here, we combine findings across the 10 most recent available MTF surveys of 8th-, 10th-, and 12th-grade students—1999–2008. Although prevalence rates for substance use have
1
Impacts of Parental Education on Substance Use

changed during that decade, the patterns of relationship reported here have not shifted markedly. The appendix to this occasional paper compares product-moment correlations and linear regression results for five-year intervals (1999–2003 vs. 2004–2008), and shows that very few regression coefficients differ significantly. Specifically, for total samples of males and females, 4 out of 30 comparisons show differences significant at the .05 level (2-tailed), and in each of these the product-moment correlations differ by only 0.02; for comparisons showing the three racial/ethnic subgroups separately, only 7 out of 90 comparisons are significant, and none is large or important. MTF sampling and data collection methods are described in detail elsewhere (Bachman, Johnston, O’Malley, & Schulenberg, 2006; Johnston et al., 2009). Briefly, the study uses a multistage sampling procedure to obtain nationally representative samples of 8th, 10th, and 12th graders from the 48 contiguous states. Stage 1 is the selection of geographic region; Stage 2 is the selection of specific schools—approximately 420 each year; and Stage 3 is the selection of students within each school. This sampling strategy has been used to collect data annually from high school seniors since 1975 and from 8th and 10th graders since 1991. Sample weights are assigned to each student to take into account differential probabilities of selection. Students complete self-administered, machine-readable questionnaires during a normal class period. Student response rates average about 90% for 8th graders, 86% for 10th graders, and 84% for 12th graders. Absence on the day of data collection is the primary reason that students are missed; it is estimated that less than one percent of students refuse to complete a questionnaire. Measures of Race/Ethnicity and Parental Education These measures are described in greater detail in Johnston et al. (2009, pp. 497–498):
Race/Ethnicity. In the early MTF surveys, respondents were presented with a list of various racial/ethnic categories. General instructions told the respondents to mark only one answer. In 2005 a random half of the respondents were presented with the list of racial/ethnic categories and instructed to “select one or more responses”; relatively few respondents (about 6%) selected more than one category. In 2006 and thereafter the revised instruction was used in all forms. For the original question, respondents were assigned to the racial/ethnic group specified in their response. For the revised question, those checking only White and no other racial/ethnic group were categorized as White; those checking Black or African American and no other racial ethnic group were categorized as African American; and those checking Mexican American or Chicano, Cuban American, Puerto Rican, or other Hispanic or Latino and no other racial/ethnic group were categorized as Hispanic Those checking multiple racial/ethnic groups or one of the other specified groups are omitted from the reporting on race/ethnicity in this article, because of the small numbers of cases. White: Consists of those respondents who describe themselves as White or Caucasian
in 1975–2004. In 2005 the unchanged questionnaire forms were treated in a similar manner and the changed forms were treated in the manner described above. Beginning in 2006 all forms were treated in the manner described above.
2
Occasional Paper No. 70
African American: Consists of those respondents who in 1975–1990 describe themselves as Black or Afro-American or who, in 1991–2004, describe themselves as Black or African American. In 2005 the unchanged questionnaire forms were treated in a similar manner and the changed forms were treated in the manner described above. Beginning in 2006 all forms were treated in the manner described above.
Hispanic: Consists of those respondents who in 1975–1990 describe themselves as Mexican American or Chicano, or Puerto Rican or other Latin American. After 1990 this group includes those respondents who describe themselves as Mexican American or Chicano, Cuban American, Puerto Rican American, or other Latin American. After 1994, the term “Puerto Rican American” was shortened to “Puerto Rican.” In 2005 the unchanged questionnaire forms were treated in a similar manner and the changed forms were treated in the manner described above. Beginning in 2006 all forms were treated in the manner described above.
Parental Education. This is an average of mother’s education and father’s education based on the respondent’s answers about the highest level of education achieved by each parent, using the following scale: (1) completed grade school or less, (2) some high school, (3) completed high school, (4) some college, (5) completed college, (6) graduate or professional school after college. Missing data was allowed on one of the two variables. The respondent is instructed, “If you were raised mostly by foster parents, stepparents, or others, answer for them. For example, if you have both a stepfather and a natural father, answer for the one that was most important in raising you.”
Measures of Substance Use Five dichotomous measures are shown in the figures reporting substance use prevalence. These include any use of cigarettes during the past 30 days, consumption of five or more alcoholic drinks in a row on at least one occasion during the past two weeks, and any use of marijuana during the past 12 months. These three measures are identical across all surveys and are described in detail in other publications (Bachman et al., 2006; Johnston et al., 2009). Analyses of MTF panel data have found that patterns of cross-time correlations for these substance use measures, including estimates of reliability, have been largely consistent over several decades (Bachman, Wadsworth, O’Malley, Johnston, & Schulenberg, 1997; Bachman et al., 2002). The fourth measure is any inhalant use during the past 12 months; the question asks, “On how many occasions (if any) have you sniffed glue, or breathed the contents of aerosol spray cans, or inhaled any other gases or sprays in order to get high?” The fifth measure is any use during the past 12 months of an illicit drug other than marijuana; the drugs include LSD, other hallucinogens, crack, other cocaine, heroin, any narcotics other than heroin, amphetamines, sedatives (barbiturates), or tranquilizers not used under a doctor’s orders (however, for the 8th and 10th graders, the use of sedatives and the use of narcotics other than heroin have been excluded from this measure because younger respondents appear to overreport such use—perhaps because they sometimes include the use of nonprescription drugs in their answers).
3
Impacts of Parental Education on Substance Use

Analysis Approach Our reporting here is descriptive. For each type of substance use we provide figures showing prevalence rates (percentages reporting use) at each level of parental education, with patterns shown separately for total samples of males and females, and for three subgroups of male adolescents (White, African American, and Hispanic) and the corresponding three subgroups of female adolescents. The figures also include unstandardized linear regression coefficients, with any that fall short of significance at the .05 level (2-tailed) indicated as ns. (As noted above, the unstandardized regression coefficients, as well as product-moment correlations, are presented also in the appendix; included there are complete p-values—i.e., 2-tailed probabilities that the relationship occurred by chance.) The calculations were done with the SURVEYREG procedure in SAS version 9, and p-values incorporated appropriate adjustments for clustered sample designs.
RESULTS The distributions of (weighted) cases by race/ethnicity and parental education are shown in Table 1 (males and females combined). The table clearly indicates that the parents of Hispanic adolescents have much lower than average educational levels. The row percentages in Table 1 show that 29–33% of Hispanic respondents had parents in the lowest education category, contrasted with only 8–9% of African-American respondents and less than 5% of White respondents. Turning to the column percentages in Table 1, we can see that nearly half (42–46%) of all adolescents with parents in the bottom category of parental education are Hispanic, about one third (32%) are White, and 12–13% are African American, with the remaining 10–13% spread across all other race/ethnicity subgroups. The column percentages also show that Whites comprise fully two thirds of the 8th graders and nearly three quarters of 10th and 12th graders with parents in the top two categories of educational attainment. The next sections show how this heavy proportion of Hispanic students and relatively low proportion of White students in the bottom category of parental education can produce somewhat misleading patterns of drug use findings when students from all race/ethnicity subgroups are combined. We look first at cigarette use, then at instances of heavy drinking, and finally at use of illicit drugs. For each class of substance use in turn, we first examine links with parental education for all students combined; then we look at those same linkages separately for White, African-American, and Hispanic students. Cigarette Use Figure 1 presents prevalence of cigarette use (percent reporting any use in the last 30 days) for 8th-, 10th-, and 12th-grade students, as a function of parental education levels; Part A shows males, and Part B shows females (a convention used for all figures). Among 8th graders, the figure shows a fairly strong negative linear relationship, with smoking declining by an estimated 2.8 percentage points among males and 3.6 points among females for each increment in parental education level. Among 10th graders the relationship is similar but weaker, with no appreciable difference between the bottom two categories of parental education. Among 12th graders, the pattern clearly departs from
4
Occasional Paper No. 70

linearity, with those in the lowest category of parental education showing lower percentages of smokers than those in the next lowest categories. Figure 2 shows cigarette use as a function of parental education, but this time for the three racial/ethnic subgroups separately, and we can see pronounced disparities. Among White students there are strong and largely linear negative relations, which are most marked among females and younger students. Among African-American students, smoking prevalence is a great deal lower overall; it shows only small negative relations with parental education among males, and even smaller negative relations among females (and only in 8th and 10th grades). Among Hispanic students, smoking prevalence rates among those with the least educated parents are generally quite low, and not appreciably different from the rates for African-American students. At the higher levels of parental education, the prevalence rates for Hispanic students are somewhat higher than those for African-American students. In sum, Figure 2 shows that it is only among White students that clear negative relations appear between parental education levels and smoking. Among African Americans, such a pattern is far weaker and not entirely consistent, and among Hispanic students the pattern is mostly irregular across grades and genders. But because the proportions of students with low educated parents is much higher in the minority subgroups, especially the Hispanic students, the regression coefficients for the total samples, shown in Figure 1, are distinctly weaker than those for White students shown in Figure 2. Heavy Drinking Figure 3 shows that for the total samples, instances of heavy drinking (five or more drinks in a row at least once in the past two weeks) are less likely among 8th-grade students with highly educated parents. Indeed, when students with the highest levels of parental education are compared with those having the least educated parents, heavy drinking is only half as likely among females and about one third as likely among males. By 10th grade this overall relationship is greatly weakened, and by 12th grade it is actually slightly reversed, with instances of heavy drinking a bit less likely among those with the least educated parents. When we look at the three race/ethnicity subgroups separately, in Figure 4, we see again a degree of unmasking—albeit not as pronounced as we saw for cigarette use. In 8th grade, instances of heavy drinking show a clear and largely linear negative relation with parental education among White students, but very little relation among the minority subgroups. By 10th grade the negative relation among White students is weaker, and by 12th grade it has disappeared. Among African-American and Hispanic students, the patterns are perhaps best described as irregular, with little consistency across grades or genders—except, of course, for the often noted finding that instances of heavy drinking are substantially less frequent among African-American students compared with the other groups.
Why do instances of heavy drinking increase between 10th and 12th grade among White students with well-educated parents? Other MTF analyses have shown a kind of
5
Impacts of Parental Education on Substance Use

“catching up” in alcohol use among college-bound students (i.e., those with good grades and definite plans to obtain a college degree, who on average also have better educated parents); this has been attributed to their greater likelihood of spending time with older friends and siblings already in college, thus exposing them to the heavy drinking college scene (Bachman et al., 2008; Johnston et al., 2009), as well as anticipatory socialization (Schulenberg & Maggs, 2002). Figure 4 illustrates this pattern among White students; there is also some suggestion of a similar pattern among Hispanic students, but not among African-American students.
Marijuana Use We examined findings for annual marijuana use (any use in the 12 months preceding the survey) as well as findings for use of any illicit drug (including marijuana). The results are closely overlapping, because the use of marijuana dominates the any illicit drug use measure; accordingly, we focus here on the findings specific to marijuana use. Figure 5 shows that, for the total samples of male and female 8th graders, annual marijuana use is two to three times as likely among those with the least educated parents, compared with those with the most educated parents. By 10th grade the relationship is still negative, but a bit weaker; by 12th grade the pattern is essentially flat (regression coefficients slightly positive, but nonsignificant). Figure 6 shows unmasking that bears some similarities to that shown in earlier figures. The negative links between parental education and marijuana use are strongest among White adolescents, although by 12th grade the pattern is flat among males and greatly reduced among females. African-American 8th and 10th graders also show negative relations, but to a lesser extent. The patterns for Hispanic students are moderately (but significantly) negative among 8th graders, whereas among 10th and 12th graders those with the least educated parents show relatively low marijuana use. Use of Illicit Drugs other than Marijuana MTF annual reports include a measure of any illicit drug use other than marijuana. We examined that measure (any such use in the past 12 months), and the results are shown in Figures 7 and 8. In general, the findings are similar to, but weaker than, those for marijuana. Among Whites there are modest negative links with parental education, which become weaker (but remain statistically significant) by 12th grade; among Hispanics and African Americans the relationships are generally very small and nonsignificant. Much the same can be said for the measure of inhalant use (in the past 12 months), the results for which are shown in Figures 9 and 10.
DISCUSSION
The results clearly indicate the following: (a) High proportions of Hispanic students have parents at the bottom category of education, and their levels of substance use average distinctly lower than those of White students at that same bottom category of parental education. This contributes heavily to the departures from linearity in the total sample data linking parental education and substance use. (b) The patterns for the three
6
Occasional Paper No. 70
subgroups show distinct differences—among African-American and Hispanic students, overall levels of substance use are lower and are also linked less strongly and clearly with parental education levels (i.e., interaction effects). (c) The strong negative relations shown by White 8th and 10th graders are diminished among White 12th graders, especially with respect to instances of heavy drinking and marijuana use. When Wallace and Bachman (1991) explored possible explanations of racial/ethnic differences in drug use among 12th graders, they employed a broad additive model which presumed that “…background…variables impact the drug use of young people from different racial/ethnic subgroups in much the same way” (p. 348). The present findings clearly indicate that such a presumption is not valid. Low parental education appears to be a risk factor for White students, especially in 8th and 10th grades, whereas substance use among African-American and Hispanic students is not strongly linked with parental education. So one implication of the present research is that background factors such as parental education may predict substance use among White students, and thus may retain predictive value for total samples consisting largely of Whites; nevertheless, it is not correct to assume that the same sorts of relations hold within other racial/ethnic subgroups.
Finally, it must be kept in mind that the findings reported here are based on students, not total age groups. There are differences among the three subgroups in school retention, especially at the upper grade levels. Moreover, school retention rates are poorer among students with less educated parents.
7
Impacts of Parental Education on Substance Use

REFERENCES Bachman, J. G., O’Malley, P. M., Schulenberg, J. E., Johnston, L. D., Bryant, A. L., & Merline,
A. C. (2002). The decline of substance use in young adulthood: Changes in social activities, roles, and beliefs. Mahwah, NJ: Lawrence Erlbaum Associates.
Bachman, J. G., O’Malley, P. M., Schulenberg, J. E., Johnston, L. D., Freedman-Doan, P., &
Messersmith, E. E. (2008). The education–drug use connection: How successes and failures in school relate to adolescent smoking, drinking, drug use, and delinquency. New York: Lawrence Erlbaum Associates/Taylor & Francis.
Bachman, J. G., Wadsworth, K. N., O’Malley, P. M., Johnston, L. D., & Schulenberg, J. (1997).
Smoking, drinking and drug use in young adulthood: The impacts of new freedoms and new responsibilities. Mahwah, NJ: Lawrence Erlbaum Associates. (ERIC Document No. ED 435 922).
Bachman, J. G., Johnston, L. D., O’Malley, P. M. & Schulenberg, J. E. (2006). The Monitoring
the Future project after thirty-two years: Design and procedures (Monitoring the Future Occasional Paper No. 64). Ann Arbor, MI: Institute for Social Research.
Bachman, J. G., Wallace, J. M., Jr., O’Malley, P. M., Johnston, L. D., Kurth, C. L., & Neighbors,
H. W. (1991). Racial/ethnic differences in smoking, drinking, and illicit drug use among American high school seniors, 1976–1989. American Journal of Public Health, 81, 372–377.
Johnston, L. D., O’Malley, P. M., Bachman, J. G., & Schulenberg, J. E. (2009). Monitoring the
Future national survey results on drug use, 1975–2008. Volume I: Secondary school students (NIH Publication No. 09-7402). Bethesda, MD: National Institute on Drug Abuse.
Schulenberg, J. E., & Maggs, J. L. (2002). A developmental perspective on alcohol use and heavy
drinking during adolescence and the transition to young adulthood. Journal of Studies on Alcohol, Supplement 14, 54–70.
Wallace, J. M., Jr., & Bachman, J. G. (1991). Explaining racial/ethnic differences in adolescent
drug use: The impact of background and lifestyle. Social Problems, 38(3), 333–357. Wallace, J. M., Jr., Bachman J. G., O’Malley, P. M., Johnston, L. D., Schulenberg, J. E., &
Cooper, S. M. (2002). Tobacco, alcohol, and illicit drug use: Racial and ethnic differences among U.S. high school seniors, 1976–2000. Public Health Reports 117(Supplement 1), S67–S75.
Wallace, J. M., Jr., Bachman, J. G., O’Malley, P. M., Schulenberg, J. E., Cooper, S. M., &
Johnston, L. D. (2003). Gender and ethnic differences in smoking, drinking, and illicit drug use among American 8th, 10th and 12th grade students, 1976–2000. Addiction, 98, 225–234.
Wallace, J. M., Jr., & Muroff, J. R. (2002). Preventing substance abuse among African American
children and youth: Race differences in risk factor exposure and vulnerability. The Journal of Primary Prevention, 22(3), 235–261.
8
Occasional Paper No. 70
Wallace, J. M., Jr., Vaughn, M. G., Bachman, J. G., O’Malley, P. M., Johnston, L. D., & Schulenberg, J. E. (2009). Race/ethnicity, socioeconomic factors, and smoking among early adolescent girls in the United States. Drug and Alcohol Dependence, 104(Suppl. 1), S42–S49.
9
Impacts of Parental Education on Substance Use

1.0–2.0 (Low) 2.5–3.0 3.5–4.0 4.5–5.0 5.5–6.0 (High) TotalWhite
Frequency 4,158 19,453 23,256 26,804 15,177 88,848Row Percentage 4.7 21.9 26.2 30.2 17.1 100.0Column Percentage 32.5 58.6 62.9 67.7 67.1 61.2
African American Frequency 1,530 5,074 5,337 5,024 2,409 19,374
Row Percentage 7.9 26.2 27.6 25.9 12.4 100.0Column Percentage 12.0 15.3 14.4 12.7 10.7 13.3
Hispanic Frequency 5,395 4,817 3,925 2,766 1,518 18,421
Row Percentage 29.3 26.2 21.3 15.0 8.2 100.0Column Percentage 42.2 14.5 10.6 7.0 6.7 12.7
AsianFrequency 467 742 926 1,598 1,578 5,311Row Percentage 8.8 14.0 17.4 30.1 29.7 100.0Column Percentage 3.7 2.2 2.5 4.0 7.0 3.7
OtherFrequency 1,230 3,103 3,506 3,412 1,947 13,197Row Percentage 9.3 23.5 26.6 25.9 14.8 100.0Column Percentage 9.6 9.4 9.5 8.6 8.6 9.1
TotalFrequency 12,779 33,189 36,950 39,604 22,629Percentage 8.8 22.9 25.5 27.3 15.6
1.0–2.0 (Low) 2.5–3.0 3.5–4.0 4.5–5.0 5.5–6.0 (High) TotalWhite
Frequency 3,814 20,444 26,544 28,263 14,749 93,814Row Percentage 4.1 21.8 28.3 30.1 15.7 100.0Column Percentage 32.0 63.3 67.7 73.4 73.2 66.0
African American Frequency 1,386 4,632 5,543 4,329 1,716 17,607
Row Percentage 7.9 26.3 31.5 24.6 9.8 100.0Column Percentage 11.6 14.3 14.1 11.3 8.5 12.4
HispanicFrequency 5 484 4 322 3 661 2 217 971 16 655
Proportion of Racial/Ethnic Groups Comprising Each SES Group
10th Grade
TABLE 1
Parental Education
Parental Education
8th Grade
Frequency 5,484 4,322 3,661 2,217 971 16,655Row Percentage 32.9 26.0 22.0 13.3 5.8 100.0Column Percentage 46.0 13.4 9.3 5.8 4.8 11.7
AsianFrequency 380 722 842 1,296 1,329 4,570Row Percentage 8.3 15.8 18.4 28.4 29.1 100.0Column Percentage 3.2 2.2 2.2 3.4 6.6 3.2
OtherFrequency 870 2,184 2,638 2,379 1,399 9,470Row Percentage 9.2 23.1 27.9 25.1 14.8 100.0Column Percentage 7.3 6.8 6.7 6.2 6.9 6.7
TotalFrequency 11,934 32,305 39,229 38,483 20,164Percentage 8.4 22.7 27.6 27.1 14.2
1.0–2.0 (Low) 2.5–3.0 3.5–4.0 4.5–5.0 5.5–6.0 (High) TotalWhite
Frequency 3,289 19,977 26,559 24,669 12,885 87,379Row Percentage 3.8 22.9 30.4 28.2 14.8 100.0Column Percentage 31.8 65.3 70.0 74.8 74.5 67.7
African American Frequency 1,390 4,542 5,049 3,145 1,186 15,313
Row Percentage 9.1 29.7 33.0 20.5 7.8 100.0Column Percentage 13.5 14.8 13.3 9.5 6.9 11.9
Hispanic Frequency 4,494 3,713 3,266 1,995 987 14,454
Row Percentage 31.1 25.7 22.6 13.8 6.8 100.0Column Percentage 43.5 12.1 8.6 6.1 5.7 11.2
AsianFrequency 495 766 1,021 1,426 1,285 4,993Row Percentage 9.9 15.3 20.5 28.6 25.7 100.0Column Percentage 4.8 2.5 2.7 4.3 7.4 3.9
OtherFrequency 664 1,614 2,043 1,732 961 7,013Row Percentage 9.5 23.0 29.1 24.7 13.7 100.0Column Percentage 6.4 5.3 5.4 5.3 5.6 5.4
TotalFrequency 10,332 30,611 37,939 32,967 17,304Percentage 8.0 23.7 29.4 25.5 13.4
Parental Education
12th Grade
10
Occasional Paper No. 70

FIGURE 1ACigarettes: 30-Day Use by Parental Education among All Male Respondents, 1999–2008
10
20
30
40
50
60
8th grade
Pe
rce
nt
10
20
30
40
50
60
10th grade
10
20
30
40
50
60
12th grade
Pe
rce
nt
Pe
rce
nt
8th Grade 10th Grade 12th Grade
Source. The Monitoring the Future study, the University of Michigan.
0
10
20
30
40
50
60
1.0-2.0 (Low)
2.5-3.0 3.5-4.0 4.5-5.0 5.5-6.0 (High)
Parental Education
8th grade
Pe
rce
nt
0
10
20
30
40
50
60
1.0-2.0 (Low)
2.5-3.0 3.5-4.0 4.5-5.0 5.5-6.0 (High)
Parental Education
10th grade
0
10
20
30
40
50
60
1.0-2.0 (Low)
2.5-3.0 3.5-4.0 4.5-5.0 5.5-6.0 (High)
Parental Education
12th grade
Pe
rce
nt
Pe
rce
nt
8th Grade 10th Grade 12th Grade
b=-2.76 b=-2.59 b=-1.02
11
Impacts of Parental Education on Substance Use

FIGURE 1BCigarettes: 30-Day Use by Parental Education among All Female Respondents, 1999–2008
10
20
30
40
50
60
8th grade
Pe
rce
nt
10
20
30
40
50
60
10th grade
10
20
30
40
50
60
12th grade
Pe
rce
nt
Pe
rce
nt
8th Grade 10th Grade 12th Grade
Source. The Monitoring the Future study, the University of Michigan.
0
10
20
30
40
50
60
1.0-2.0 (Low)
2.5-3.0 3.5-4.0 4.5-5.0 5.5-6.0 (High)
Parental Education
8th grade
Pe
rce
nt
0
10
20
30
40
50
60
1.0-2.0 (Low)
2.5-3.0 3.5-4.0 4.5-5.0 5.5-6.0 (High)
Parental Education
10th grade
0
10
20
30
40
50
60
1.0-2.0 (Low)
2.5-3.0 3.5-4.0 4.5-5.0 5.5-6.0 (High)
Parental Education
12th grade
Pe
rce
nt
Pe
rce
nt
8th Grade 10th Grade 12th Grade
b=-3.61 b=-3.04 b=-1.17
12
Occasional Paper No. 70
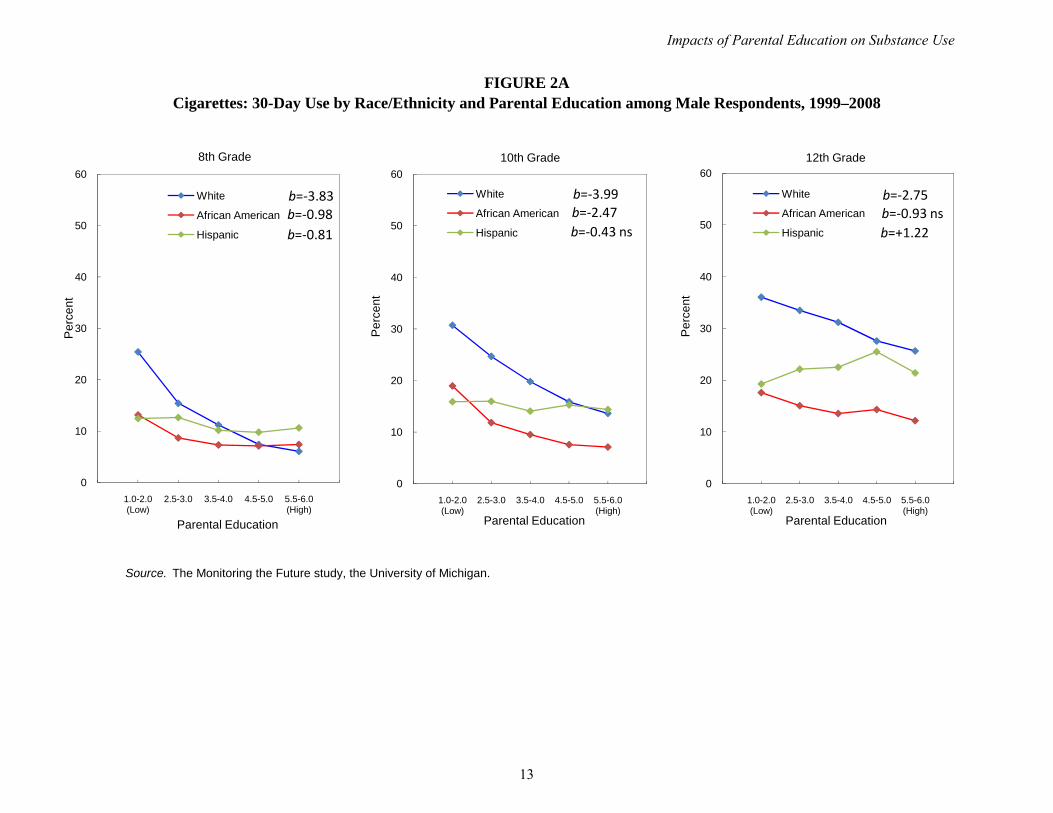
FIGURE 2ACigarettes: 30-Day Use by Race/Ethnicity and Parental Education among Male Respondents, 1999–2008
10
20
30
40
50
60
White
African American
Hispanic
Pe
rce
nt
10
20
30
40
50
60
White
African American
Hispanic
10
20
30
40
50
60
White
African American
Hispanic
Pe
rce
nt
Pe
rce
nt
8th Grade 10th Grade 12th Grade
b=-3.83b=-0.98b=-0.81
b=-3.99b=-2.47b=-0.43 ns
b=-2.75b=-0.93 nsb=+1.22
Source. The Monitoring the Future study, the University of Michigan.
0
10
20
30
40
50
60
1.0-2.0 (Low)
2.5-3.0 3.5-4.0 4.5-5.0 5.5-6.0 (High)
Parental Education
White
African American
Hispanic
Pe
rce
nt
0
10
20
30
40
50
60
1.0-2.0 (Low)
2.5-3.0 3.5-4.0 4.5-5.0 5.5-6.0 (High)
Parental Education
White
African American
Hispanic
0
10
20
30
40
50
60
1.0-2.0 (Low)
2.5-3.0 3.5-4.0 4.5-5.0 5.5-6.0 (High)
Parental Education
White
African American
Hispanic
Pe
rce
nt
Pe
rce
nt
8th Grade 10th Grade 12th Grade
b=-3.83b=-0.98b=-0.81
b=-3.99b=-2.47b=-0.43 ns
b=-2.75b=-0.93 nsb=+1.22
13
Impacts of Parental Education on Substance Use

FIGURE 2BCigarettes: 30-Day Use by Race/Ethnicity and Parental Education among Female Respondents, 1999–2008
10
20
30
40
50
60
White
African American
Hispanic
Pe
rce
nt
10
20
30
40
50
60
White
African American
Hispanic
10
20
30
40
50
60
White
African American
Hispanic
Pe
rce
nt
Pe
rce
nt
8th Grade 10th Grade 12th Grade
b=-5.47b=-0.72b=-0.94
b=-5.66b=-1.01b=+0.10 ns
b=-4.39b=+0.04 nsb=+2.33
Source. The Monitoring the Future study, the University of Michigan.
0
10
20
30
40
50
60
1.0-2.0 (Low)
2.5-3.0 3.5-4.0 4.5-5.0 5.5-6.0 (High)
Parental Education
White
African American
Hispanic
Pe
rce
nt
0
10
20
30
40
50
60
1.0-2.0 (Low)
2.5-3.0 3.5-4.0 4.5-5.0 5.5-6.0 (High)
Parental Education
White
African American
Hispanic
0
10
20
30
40
50
60
1.0-2.0 (Low)
2.5-3.0 3.5-4.0 4.5-5.0 5.5-6.0 (High)
Parental Education
White
African American
Hispanic
Pe
rce
nt
Pe
rce
nt
8th Grade 10th Grade 12th Grade
b=-5.47b=-0.72b=-0.94
b=-5.66b=-1.01b=+0.10 ns
b=-4.39b=+0.04 nsb=+2.33
14
Occasional Paper No. 70
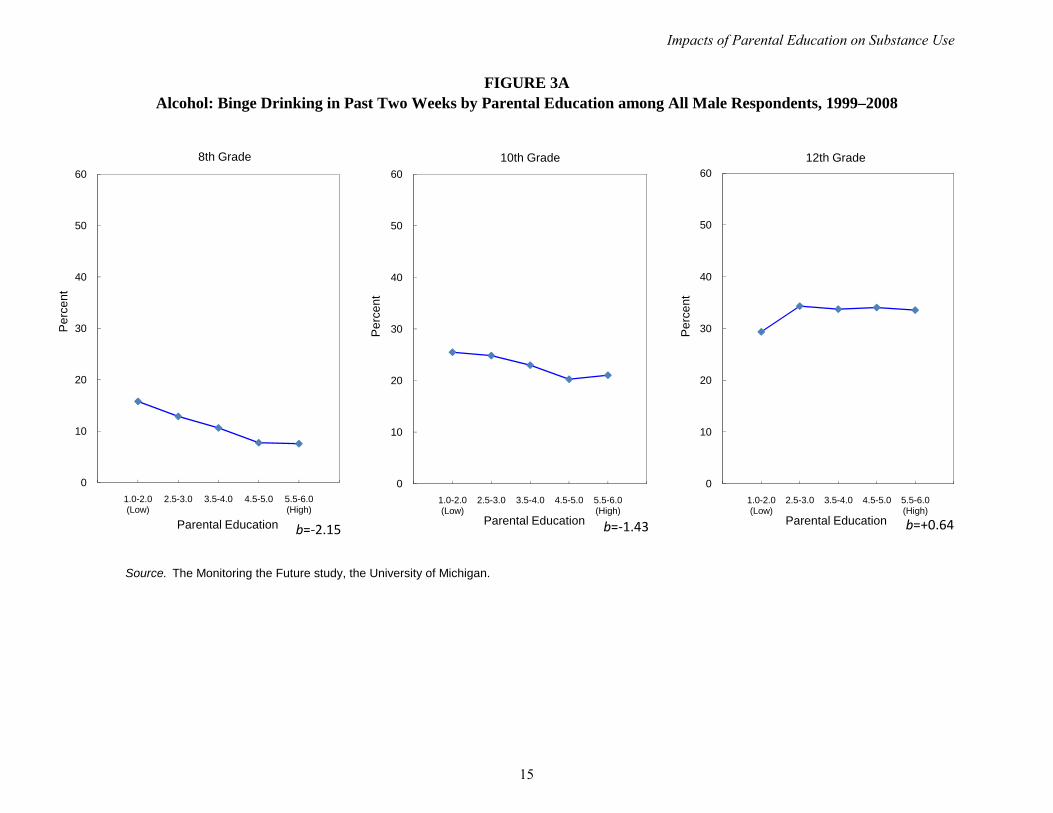
FIGURE 3AAlcohol: Binge Drinking in Past Two Weeks by Parental Education among All Male Respondents, 1999–2008
10
20
30
40
50
60
8th grade
Pe
rce
nt
10
20
30
40
50
60
10th grade
10
20
30
40
50
60
12th grade
Pe
rce
nt
Pe
rce
nt
8th Grade 10th Grade 12th Grade
Source. The Monitoring the Future study, the University of Michigan.
0
10
20
30
40
50
60
1.0-2.0 (Low)
2.5-3.0 3.5-4.0 4.5-5.0 5.5-6.0 (High)
Parental Education
8th grade
Pe
rce
nt
0
10
20
30
40
50
60
1.0-2.0 (Low)
2.5-3.0 3.5-4.0 4.5-5.0 5.5-6.0 (High)
Parental Education
10th grade
0
10
20
30
40
50
60
1.0-2.0 (Low)
2.5-3.0 3.5-4.0 4.5-5.0 5.5-6.0 (High)
Parental Education
12th grade
Pe
rce
nt
Pe
rce
nt
8th Grade 10th Grade 12th Grade
b=-2.15 b=-1.43 b=+0.64
15
Impacts of Parental Education on Substance Use
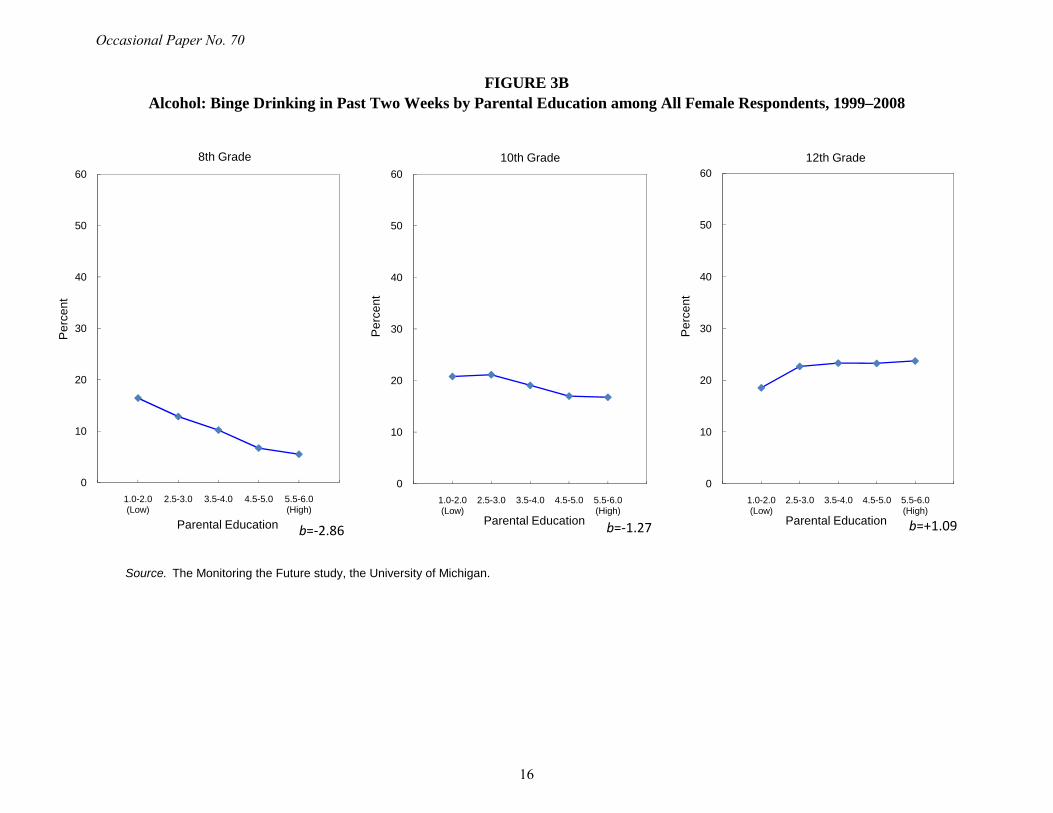
FIGURE 3BAlcohol: Binge Drinking in Past Two Weeks by Parental Education among All Female Respondents, 1999–2008
10
20
30
40
50
60
8th grade
Pe
rce
nt
10
20
30
40
50
60
10th grade
10
20
30
40
50
60
12th grade
Pe
rce
nt
Pe
rce
nt
8th Grade 10th Grade 12th Grade
Source. The Monitoring the Future study, the University of Michigan.
0
10
20
30
40
50
60
1.0-2.0 (Low)
2.5-3.0 3.5-4.0 4.5-5.0 5.5-6.0 (High)
Parental Education
8th grade
Pe
rce
nt
0
10
20
30
40
50
60
1.0-2.0 (Low)
2.5-3.0 3.5-4.0 4.5-5.0 5.5-6.0 (High)
Parental Education
10th grade
0
10
20
30
40
50
60
1.0-2.0 (Low)
2.5-3.0 3.5-4.0 4.5-5.0 5.5-6.0 (High)
Parental Education
12th grade
Pe
rce
nt
Pe
rce
nt
8th Grade 10th Grade 12th Grade
b=-2.86 b=-1.27 b=+1.09
16
Occasional Paper No. 70

FIGURE 4AAlcohol: Binge Drinking in Past Two Weeks by Race/Ethnicity and Parental Education among Male Respondents, 1999–2008
10
20
30
40
50
60
White
African American
Hispanic
Pe
rce
nt
10
20
30
40
50
60
White
African American
Hispanic
10
20
30
40
50
60
White
African American
Hispanic
Pe
rce
nt
Pe
rce
nt
8th Grade 10th Grade 12th Grade
b=-2.69b=-0.43 nsb=-1.19
b=-2.10b=-1.27b=-0.20 ns
b=-0.51 nsb=-0.03 nsb=+1.23 ns
Source. The Monitoring the Future study, the University of Michigan.
0
10
20
30
40
50
60
1.0-2.0 (Low)
2.5-3.0 3.5-4.0 4.5-5.0 5.5-6.0 (High)
Parental Education
White
African American
Hispanic
Pe
rce
nt
0
10
20
30
40
50
60
1.0-2.0 (Low)
2.5-3.0 3.5-4.0 4.5-5.0 5.5-6.0 (High)
Parental Education
White
African American
Hispanic
0
10
20
30
40
50
60
1.0-2.0 (Low)
2.5-3.0 3.5-4.0 4.5-5.0 5.5-6.0 (High)
Parental Education
White
African American
Hispanic
Pe
rce
nt
Pe
rce
nt
8th Grade 10th Grade 12th Grade
b=-2.69b=-0.43 nsb=-1.19
b=-2.10b=-1.27b=-0.20 ns
b=-0.51 nsb=-0.03 nsb=+1.23 ns
17
Impacts of Parental Education on Substance Use

FIGURE 4BAlcohol: Binge Drinking in Past Two Weeks by Race/Ethnicity and Parental Education among Female Respondents, 1999–2008
10
20
30
40
50
60
White
African American
Hispanic
Pe
rce
nt
10
20
30
40
50
60
White
African American
Hispanic
10
20
30
40
50
60
White
African American
Hispanic
Pe
rce
nt
Pe
rce
nt
8th Grade 10th Grade 12th Grade
b=-3.49b=-0.70b=-1.27
b=-2.02b=-0.50 nsb=-0.43 ns
b=-0.06 nsb=+0.30 nsb=+1.48
Source. The Monitoring the Future study, the University of Michigan.
0
10
20
30
40
50
60
1.0-2.0 (Low)
2.5-3.0 3.5-4.0 4.5-5.0 5.5-6.0 (High)
Parental Education
White
African American
Hispanic
Pe
rce
nt
0
10
20
30
40
50
60
1.0-2.0 (Low)
2.5-3.0 3.5-4.0 4.5-5.0 5.5-6.0 (High)
Parental Education
White
African American
Hispanic
0
10
20
30
40
50
60
1.0-2.0 (Low)
2.5-3.0 3.5-4.0 4.5-5.0 5.5-6.0 (High)
Parental Education
White
African American
Hispanic
Pe
rce
nt
Pe
rce
nt
8th Grade 10th Grade 12th Grade
b=-3.49b=-0.70b=-1.27
b=-2.02b=-0.50 nsb=-0.43 ns
b=-0.06 nsb=+0.30 nsb=+1.48
18
Occasional Paper No. 70

FIGURE 5AMarijuana: Annual Use by Parental Education among All Male Respondents, 1999–2008
10
20
30
40
50
60
8th grade
Pe
rce
nt
10
20
30
40
50
60
10th grade
10
20
30
40
50
60
12th grade
Pe
rce
nt
Pe
rce
nt
8th Grade 10th Grade 12th Grade
Source. The Monitoring the Future study, the University of Michigan.
0
10
20
30
40
50
60
1.0-2.0 (Low)
2.5-3.0 3.5-4.0 4.5-5.0 5.5-6.0 (High)
Parental Education
8th grade
Pe
rce
nt
0
10
20
30
40
50
60
1.0-2.0 (Low)
2.5-3.0 3.5-4.0 4.5-5.0 5.5-6.0 (High)
Parental Education
10th grade
0
10
20
30
40
50
60
1.0-2.0 (Low)
2.5-3.0 3.5-4.0 4.5-5.0 5.5-6.0 (High)
Parental Education
12th grade
Pe
rce
nt
Pe
rce
nt
8th Grade 10th Grade 12th Grade
b=-3.31 b=-2.47 b=+0.41 ns
19
Impacts of Parental Education on Substance Use

FIGURE 5BMarijuana: Annual Use by Parental Education among All Female Respondents, 1999–2008
10
20
30
40
50
60
8th grade
Pe
rce
nt
10
20
30
40
50
60
10th grade
10
20
30
40
50
60
12th grade
Pe
rce
nt
Pe
rce
nt
8th Grade 10th Grade 12th Grade
Source. The Monitoring the Future study, the University of Michigan.
0
10
20
30
40
50
60
1.0-2.0 (Low)
2.5-3.0 3.5-4.0 4.5-5.0 5.5-6.0 (High)
Parental Education
8th grade
Pe
rce
nt
0
10
20
30
40
50
60
1.0-2.0 (Low)
2.5-3.0 3.5-4.0 4.5-5.0 5.5-6.0 (High)
Parental Education
10th grade
0
10
20
30
40
50
60
1.0-2.0 (Low)
2.5-3.0 3.5-4.0 4.5-5.0 5.5-6.0 (High)
Parental Education
12th grade
Pe
rce
nt
Pe
rce
nt
8th Grade 10th Grade 12th Grade
b=-3.69 b=-3.01 b=+0.34 ns
20
Occasional Paper No. 70

FIGURE 6AMarijuana: Annual Use by Race/Ethnicity and Parental Education among Male Respondents, 1999–2008
10
20
30
40
50
60
White
African American
Hispanic
Pe
rce
nt
10
20
30
40
50
60
White
African American
Hispanic
10
20
30
40
50
60
White
African American
Hispanic
Pe
rce
nt
Pe
rce
nt
8th Grade 10th Grade 12th Grade
b=-3.45b=-2.55b=-2.11
b=-2.58b=-3.12b=-1.04 ns
b=+0.03 nsb=-0.11 nsb=+1.02 ns
Source. The Monitoring the Future study, the University of Michigan.
0
10
20
30
40
50
60
1.0-2.0 (Low)
2.5-3.0 3.5-4.0 4.5-5.0 5.5-6.0 (High)
Parental Education
White
African American
Hispanic
Pe
rce
nt
0
10
20
30
40
50
60
1.0-2.0 (Low)
2.5-3.0 3.5-4.0 4.5-5.0 5.5-6.0 (High)
Parental Education
White
African American
Hispanic
0
10
20
30
40
50
60
1.0-2.0 (Low)
2.5-3.0 3.5-4.0 4.5-5.0 5.5-6.0 (High)
Parental Education
White
African American
Hispanic
Pe
rce
nt
Pe
rce
nt
8th Grade 10th Grade 12th Grade
b=-3.45b=-2.55b=-2.11
b=-2.58b=-3.12b=-1.04 ns
b=+0.03 nsb=-0.11 nsb=+1.02 ns
21
Impacts of Parental Education on Substance Use

FIGURE 6BMarijuana: Annual Use by Race/Ethnicity and Parental Education among Female Respondents, 1999–2008
10
20
30
40
50
60
White
African American
Hispanic
Pe
rce
nt
10
20
30
40
50
60
White
African American
Hispanic
10
20
30
40
50
60
White
African American
Hispanic
Pe
rce
nt
Pe
rce
nt
8th Grade 10th Grade 12th Grade
b=-4.55b=-1.90b=-1.23
b=-4.49b=-1.79b=-0.21 ns
b=-0.94b=-0.27 ns b=+1.72
Source. The Monitoring the Future study, the University of Michigan.
0
10
20
30
40
50
60
1.0-2.0 (Low)
2.5-3.0 3.5-4.0 4.5-5.0 5.5-6.0 (High)
Parental Education
White
African American
Hispanic
Pe
rce
nt
0
10
20
30
40
50
60
1.0-2.0 (Low)
2.5-3.0 3.5-4.0 4.5-5.0 5.5-6.0 (High)
Parental Education
White
African American
Hispanic
0
10
20
30
40
50
60
1.0-2.0 (Low)
2.5-3.0 3.5-4.0 4.5-5.0 5.5-6.0 (High)
Parental Education
White
African American
Hispanic
Pe
rce
nt
Pe
rce
nt
8th Grade 10th Grade 12th Grade
b=-4.55b=-1.90b=-1.23
b=-4.49b=-1.79b=-0.21 ns
b=-0.94b=-0.27 ns b=+1.72
22
Occasional Paper No. 70

FIGURE 7AAny Illicit Drug other than Marijuana: Annual Use by Parental Education among All Male Respondents, 1999–2008
10
20
30
40
50
60
8th grade
Pe
rce
nt
10
20
30
40
50
60
10th grade
10
20
30
40
50
60
12th grade
Pe
rce
nt
Pe
rce
nt
8th Grade 10th Grade 12th Grade
Source. The Monitoring the Future study, the University of Michigan.
0
10
20
30
40
50
60
1.0-2.0 (Low)
2.5-3.0 3.5-4.0 4.5-5.0 5.5-6.0 (High)
Parental Education
8th grade
Pe
rce
nt
0
10
20
30
40
50
60
1.0-2.0 (Low)
2.5-3.0 3.5-4.0 4.5-5.0 5.5-6.0 (High)
Parental Education
10th grade
0
10
20
30
40
50
60
1.0-2.0 (Low)
2.5-3.0 3.5-4.0 4.5-5.0 5.5-6.0 (High)
Parental Education
12th grade
Pe
rce
nt
Pe
rce
nt
8th Grade 10th Grade 12th Grade
b=-1.19 b=-1.59 b=-0.10 ns
23
Impacts of Parental Education on Substance Use

FIGURE 7BAny Illicit Drug other than Marijuana: Annual Use by Parental Education among All Female Respondents, 1999–2008
10
20
30
40
50
60
8th grade
Pe
rce
nt
10
20
30
40
50
60
10th grade
10
20
30
40
50
60
12th grade
Pe
rce
nt
Pe
rce
nt
8th Grade 10th Grade 12th Grade
Source. The Monitoring the Future study, the University of Michigan.
0
10
20
30
40
50
60
1.0-2.0 (Low)
2.5-3.0 3.5-4.0 4.5-5.0 5.5-6.0 (High)
Parental Education
8th grade
Pe
rce
nt
0
10
20
30
40
50
60
1.0-2.0 (Low)
2.5-3.0 3.5-4.0 4.5-5.0 5.5-6.0 (High)
Parental Education
10th grade
0
10
20
30
40
50
60
1.0-2.0 (Low)
2.5-3.0 3.5-4.0 4.5-5.0 5.5-6.0 (High)
Parental Education
12th grade
Pe
rce
nt
Pe
rce
nt
8th Grade 10th Grade 12th Grade
b=-2.31 b=-2.04 b=-0.20 ns
24
Occasional Paper No. 70

FIGURE 8AAny Illicit Drug other than Marijuana: Annual Use by Race/Ethnicity and Parental Education among Male Respondents, 1999–2008
10
20
30
40
50
60
White
African American
Hispanic
Pe
rce
nt
10
20
30
40
50
60
White
African American
Hispanic
10
20
30
40
50
60
White
African American
Hispanic
Pe
rce
nt
Pe
rce
nt
8th Grade 10th Grade 12th Grade
b=-1.72b=-0.03 nsb=+0.01 ns
b=-2.43b=-0.90b=-0.46 ns
b=-1.19b=+0.36 nsb=+0.99 ns
Source. The Monitoring the Future study, the University of Michigan.
0
10
20
30
40
50
60
1.0-2.0 (Low)
2.5-3.0 3.5-4.0 4.5-5.0 5.5-6.0 (High)
Parental Education
White
African American
Hispanic
Pe
rce
nt
0
10
20
30
40
50
60
1.0-2.0 (Low)
2.5-3.0 3.5-4.0 4.5-5.0 5.5-6.0 (High)
Parental Education
White
African American
Hispanic
0
10
20
30
40
50
60
1.0-2.0 (Low)
2.5-3.0 3.5-4.0 4.5-5.0 5.5-6.0 (High)
Parental Education
White
African American
Hispanic
Pe
rce
nt
Pe
rce
nt
8th Grade 10th Grade 12th Grade
b=-1.72b=-0.03 nsb=+0.01 ns
b=-2.43b=-0.90b=-0.46 ns
b=-1.19b=+0.36 nsb=+0.99 ns
25
Impacts of Parental Education on Substance Use

FIGURE 8BAny Illicit Drug other than Marijuana: Annual Use by Race/Ethnicity and Parental Education among Female Respondents, 1999–2008
10
20
30
40
50
60
White
African American
Hispanic
Pe
rce
nt
10
20
30
40
50
60
White
African American
Hispanic
10
20
30
40
50
60
White
African American
Hispanic
Pe
rce
nt
Pe
rce
nt
8th Grade 10th Grade 12th Grade
b=-3.30b=-0.14 nsb=-0.55 ns
b=-3.56b=-0.33 nsb=+0.25 ns
b=-1.91b=+0.46 nsb=+1.44
Source. The Monitoring the Future study, the University of Michigan.
0
10
20
30
40
50
60
1.0-2.0 (Low)
2.5-3.0 3.5-4.0 4.5-5.0 5.5-6.0 (High)
Parental Education
White
African American
Hispanic
Pe
rce
nt
0
10
20
30
40
50
60
1.0-2.0 (Low)
2.5-3.0 3.5-4.0 4.5-5.0 5.5-6.0 (High)
Parental Education
White
African American
Hispanic
0
10
20
30
40
50
60
1.0-2.0 (Low)
2.5-3.0 3.5-4.0 4.5-5.0 5.5-6.0 (High)
Parental Education
White
African American
Hispanic
Pe
rce
nt
Pe
rce
nt
8th Grade 10th Grade 12th Grade
b=-3.30b=-0.14 nsb=-0.55 ns
b=-3.56b=-0.33 nsb=+0.25 ns
b=-1.91b=+0.46 nsb=+1.44
26
Occasional Paper No. 70
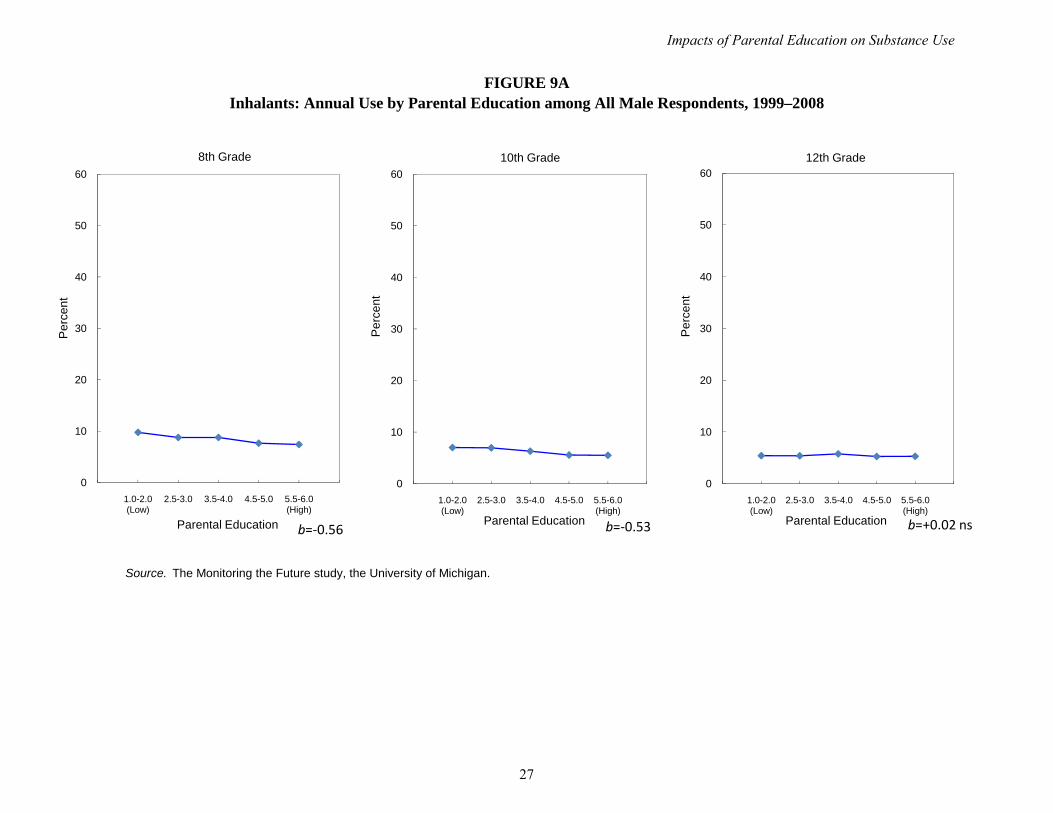
FIGURE 9AInhalants: Annual Use by Parental Education among All Male Respondents, 1999–2008
10
20
30
40
50
60
8th grade
Pe
rce
nt
10
20
30
40
50
60
10th grade
10
20
30
40
50
60
12th grade
Pe
rce
nt
Pe
rce
nt
8th Grade 10th Grade 12th Grade
Source. The Monitoring the Future study, the University of Michigan.
0
10
20
30
40
50
60
1.0-2.0 (Low)
2.5-3.0 3.5-4.0 4.5-5.0 5.5-6.0 (High)
Parental Education
8th grade
Pe
rce
nt
0
10
20
30
40
50
60
1.0-2.0 (Low)
2.5-3.0 3.5-4.0 4.5-5.0 5.5-6.0 (High)
Parental Education
10th grade
0
10
20
30
40
50
60
1.0-2.0 (Low)
2.5-3.0 3.5-4.0 4.5-5.0 5.5-6.0 (High)
Parental Education
12th grade
Pe
rce
nt
Pe
rce
nt
8th Grade 10th Grade 12th Grade
b=-0.56 b=-0.53 b=+0.02 ns
27
Impacts of Parental Education on Substance Use

FIGURE 9BInhalants: Annual Use by Parental Education among All Female Respondents, 1999–2008
10
20
30
40
50
60
8th grade
Pe
rce
nt
10
20
30
40
50
60
10th grade
10
20
30
40
50
60
12th grade
Pe
rce
nt
Pe
rce
nt
8th Grade 10th Grade 12th Grade
Source. The Monitoring the Future study, the University of Michigan.
0
10
20
30
40
50
60
1.0-2.0 (Low)
2.5-3.0 3.5-4.0 4.5-5.0 5.5-6.0 (High)
Parental Education
8th grade
Pe
rce
nt
0
10
20
30
40
50
60
1.0-2.0 (Low)
2.5-3.0 3.5-4.0 4.5-5.0 5.5-6.0 (High)
Parental Education
10th grade
0
10
20
30
40
50
60
1.0-2.0 (Low)
2.5-3.0 3.5-4.0 4.5-5.0 5.5-6.0 (High)
Parental Education
12th grade
Pe
rce
nt
Pe
rce
nt
8th Grade 10th Grade 12th Grade
b=-1.60 b=-0.44 b=-0.21 ns
28
Occasional Paper No. 70
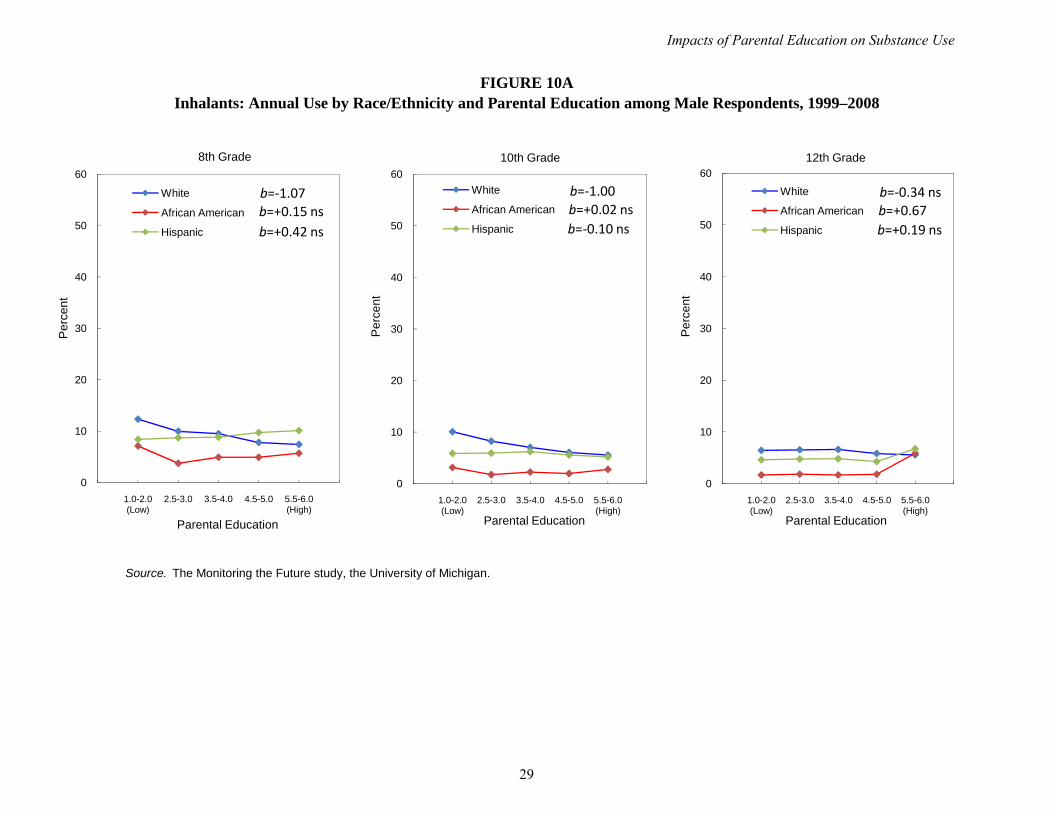
FIGURE 10AInhalants: Annual Use by Race/Ethnicity and Parental Education among Male Respondents, 1999–2008
10
20
30
40
50
60
White
African American
Hispanic
Pe
rce
nt
10
20
30
40
50
60
White
African American
Hispanic
10
20
30
40
50
60
White
African American
Hispanic
Pe
rce
nt
Pe
rce
nt
8th Grade 10th Grade 12th Grade
b=-1.07b=+0.15 nsb=+0.42 ns
b=-1.00b=+0.02 nsb=-0.10 ns
b=-0.34 nsb=+0.67b=+0.19 ns
Source. The Monitoring the Future study, the University of Michigan.
0
10
20
30
40
50
60
1.0-2.0 (Low)
2.5-3.0 3.5-4.0 4.5-5.0 5.5-6.0 (High)
Parental Education
White
African American
Hispanic
Pe
rce
nt
0
10
20
30
40
50
60
1.0-2.0 (Low)
2.5-3.0 3.5-4.0 4.5-5.0 5.5-6.0 (High)
Parental Education
White
African American
Hispanic
0
10
20
30
40
50
60
1.0-2.0 (Low)
2.5-3.0 3.5-4.0 4.5-5.0 5.5-6.0 (High)
Parental Education
White
African American
Hispanic
Pe
rce
nt
Pe
rce
nt
8th Grade 10th Grade 12th Grade
b=-1.07b=+0.15 nsb=+0.42 ns
b=-1.00b=+0.02 nsb=-0.10 ns
b=-0.34 nsb=+0.67b=+0.19 ns
29
Impacts of Parental Education on Substance Use

FIGURE 10BInhalants: Annual Use by Race/Ethnicity and Parental Education among Female Respondents, 1999–2008
10
20
30
40
50
60
White
African American
Hispanic
Pe
rce
nt
10
20
30
40
50
60
White
African American
Hispanic
10
20
30
40
50
60
White
African American
Hispanic
Pe
rce
nt
Pe
rce
nt
8th Grade 10th Grade 12th Grade
b=-2.53b=+0.68b=+0.32 ns
b=-0.93b=+0.41b=+0.12 ns
b=-0.61b=-0.02 nsb=+0.52 ns
Source. The Monitoring the Future study, the University of Michigan.
0
10
20
30
40
50
60
1.0-2.0 (Low)
2.5-3.0 3.5-4.0 4.5-5.0 5.5-6.0 (High)
Parental Education
White
African American
Hispanic
Pe
rce
nt
0
10
20
30
40
50
60
1.0-2.0 (Low)
2.5-3.0 3.5-4.0 4.5-5.0 5.5-6.0 (High)
Parental Education
White
African American
Hispanic
0
10
20
30
40
50
60
1.0-2.0 (Low)
2.5-3.0 3.5-4.0 4.5-5.0 5.5-6.0 (High)
Parental Education
White
African American
Hispanic
Pe
rce
nt
Pe
rce
nt
8th Grade 10th Grade 12th Grade
b=-2.53b=+0.68b=+0.32 ns
b=-0.93b=+0.41b=+0.12 ns
b=-0.61b=-0.02 nsb=+0.52 ns
30
Occasional Paper No. 70

99-03 04-08 99-08 99-03 04-08 p for 99-08 p for sig.
r r r b b difference b relationshipMarijuana: Annual use 8th Grade -0.10 -0.11 -0.11 -3.33 -3.22 0.7568 -3.31 <.0001 10th Grade -0.06 -0.07 -0.06 -2.28 -2.41 0.7846 -2.47 <.0001 12th Grade 0.00 0.00 0.00 0.35 0.47 0.8280 0.41 0.1614Binge drinking in past 2 weeks 8th Grade -0.08 -0.09 -0.08 -2.09 -2.18 0.7805 -2.15 <.0001 10th Grade -0.04 -0.04 -0.04 -1.31 -1.37 0.8982 -1.43 <.0001 12th Grade 0.01 0.01 0.01 0.59 0.71 0.8196 0.64 0.0287Cigarettes: 30-day use 8th Grade -0.11 -0.11 -0.11 -2.98 -2.48 0.1559 -2.76 <.0001 10th Grade -0.07 -0.08 -0.08 -2.50 -2.46 0.9073 -2.59 <.0001 12th Grade -0.02 -0.03 -0.03 -0.87 -1.12 0.6444 -1.02 0.0003Inhalants: Annual use 8th Grade -0.02 -0.02 -0.02 -0.57 -0.56 0.9538 -0.56 <.0001 10th Grade -0.02 -0.03 -0.02 -0.35 -0.67 0.1738 -0.53 <.0001 12th Grade 0.01 -0.01 0.00 0.36 -0.27 0.0429 0.02 0.8821Any illicit other than Mj: Annual use 8th Grade -0.05 -0.05 -0.05 -1.11 -1.23 0.6477 -1.19 <.0001 10th Grade -0.05 -0.05 -0.05 -1.68 -1.38 0.3292 -1.59 <.0001 12th Grade -0.01 0.00 -0.01 -0.26 0.04 0.4688 -0.10 0.6481
APPENDIX
P-M Correlations Linear Regression Resuts
Use of Various Drugs by Grade among All Male Respondents, 1999–2008
31
Impacts of Parental Education on Substance Use
99-03 04-08 99-08 99-03 04-08 p for 99-08 p for sig.
r r r b b difference b relationshipMarijuana: Annual use 8th Grade -0.15 -0.13 -0.14 -4.04 -3.31 0.0208 -3.69 <.0001 10th Grade -0.07 -0.09 -0.08 -2.87 -3.05 0.6990 -3.01 <.0001 12th Grade 0.01 0.00 0.00 0.60 0.14 0.4299 0.34 0.2380Binge drinking in past 2 weeks 8th Grade -0.12 -0.10 -0.11 -3.26 -2.43 0.0015 -2.86 <.0001 10th Grade -0.04 -0.04 -0.04 -1.28 -1.22 0.8784 -1.27 <.0001 12th Grade 0.03 0.02 0.02 1.34 0.88 0.3247 1.09 <.0001Cigarettes: 30-day use 8th Grade -0.15 -0.13 -0.14 -4.18 -2.97 0.0006 -3.61 <.0001 10th Grade -0.09 -0.10 -0.09 -2.94 -2.98 0.9317 -3.04 <.0001 12th Grade -0.02 -0.04 -0.03 -0.81 -1.42 0.2929 -1.17 <.0001Inhalants: Annual use 8th Grade -0.06 -0.06 -0.06 -1.43 -1.78 0.1807 -1.60 <.0001 10th Grade -0.02 -0.02 -0.02 -0.46 -0.42 0.8441 -0.44 <.0001 12th Grade 0.00 -0.02 -0.01 0.02 -0.42 0.0367 -0.21 0.0545Any illicit other than Mj: Annual use 8th Grade -0.09 -0.09 -0.09 -2.27 -2.31 0.8851 -2.31 <.0001 10th Grade -0.07 -0.06 -0.07 -2.31 -1.71 0.0722 -2.04 <.0001 12th Grade 0.00 -0.01 -0.01 -0.09 -0.29 0.6145 -0.20 0.3351
Linear Regression Resuts
Use of Various Drugs by Grade among All Female Respondents, 1999–2008
P-M Correlations
32
Occasional Paper No. 70

99-03 04-08 99-08 99-03 04-08 p for 99-08 p for sig.r r r b b difference b relationship
Marijuana: Annual use White -0.10 -0.12 -0.11 -3.36 -3.40 0.9303 -3.45 <.0001 African American -0.07 -0.09 -0.08 -2.47 -2.65 0.8228 -2.55 <.0001 Hispanic -0.07 -0.07 -0.07 -2.23 -2.10 0.8886 -2.11 <.0001Binge drinking in past 2 weeks White -0.09 -0.10 -0.10 -2.76 -2.51 0.5301 -2.69 <.0001 African American -0.01 -0.04 -0.02 -0.15 -0.74 0.3244 -0.43 0.1809 Hispanic -0.02 -0.07 -0.04 -0.49 -1.78 0.0752 -1.19 0.0008Cigarettes: 30-day use White -0.13 -0.14 -0.14 -4.10 -3.42 0.1455 -3.83 <.0001 African American -0.03 -0.05 -0.04 -0.86 -1.10 0.6871 -0.98 0.0028 Hispanic -0.03 -0.04 -0.03 -0.76 -0.92 0.8331 -0.81 0.0285Inhalants: Annual use White -0.04 -0.04 -0.04 -1.02 -1.07 0.8808 -1.07 <.0001 African American 0.00 0.02 0.01 0.02 0.03 0.5811 0.15 0.5541 Hispanic 0.02 0.02 0.02 0.45 0.38 0.8881 0.42 0.0923Any illicit other than Mj: Annual use White -0.06 -0.08 -0.07 -1.52 -1.84 0.3225 -1.72 <.0001 African American 0.00 0.00 0.00 -0.02 -0.05 0.9502 -0.03 0.9160 Hispanic 0.00 -0.01 0.00 0.11 -1.30 0.7152 0.01 0.9807
P-M Correlations Linear Regression Resuts
Use of Various Drugs by Race/Ethnicity and Parental Education among Male 8th-Grade Respondents, 1999–2008
33
Impacts of Parental Education on Substance Use

99-03 04-08 99-08 99-03 04-08 p for 99-08 p for sig.r r r b b difference b relationship
Marijuana: Annual use White -0.17 -0.16 -0.17 -4.93 -4.07 0.0200 -4.55 <.0001 African American -0.06 -0.08 -0.07 -1.64 -2.23 0.3380 -1.90 <.0001 Hispanic -0.04 -0.04 -0.04 -1.30 -1.17 0.8647 -1.23 0.0023Binge drinking in past 2 weeks White -0.14 -0.12 -0.14 -3.90 -2.99 0.0065 -3.49 <.0001 African American -0.04 -0.02 -0.03 -0.88 -0.48 0.4482 -0.70 0.0092 Hispanic -0.06 -0.03 -0.05 -1.87 -0.78 0.0850 -1.27 <.0001Cigarettes: 30-day use White -0.20 -0.19 -0.20 -6.08 -4.69 0.0017 -5.47 <.0001 African American -0.03 -0.04 -0.03 -0.63 -0.83 0.6742 -0.72 0.0025 Hispanic -0.06 -0.02 -0.04 -1.52 -0.46 0.0925 -0.94 0.0032Inhalants: Annual use White -0.09 -0.10 -0.09 -2.30 -2.79 0.1582 -2.53 <.0001 African American 0.05 0.02 0.03 0.92 0.39 0.2715 0.68 0.0047 Hispanic 0.02 0.01 0.01 0.53 0.15 0.5541 0.32 0.3144Any illicit other than Mj: Annual use White -0.11 -0.13 -0.12 -3.20 -3.33 0.7099 -3.30 <.0001 African American 0.00 -0.02 -0.01 0.01 -0.33 0.3961 -0.14 0.4847 Hispanic -0.01 -0.03 -0.02 -0.33 -0.71 0.5889 -0.55 0.1255
P-M Correlations Linear Regression Resuts
Use of Various Drugs by Race/Ethnicity and Parental Education among Female 8th-Grade Respondents, 1999–2008
34
Occasional Paper No. 70

99-03 04-08 99-08 99-03 04-08 p for 99-08 p for sig.r r r b b difference b relationship
Marijuana: Annual use White -0.05 -0.06 -0.06 -2.37 -2.44 0.9088 -2.58 <.0001 African American -0.08 -0.07 -0.07 -3.20 -3.03 0.8808 -3.12 <.0001 Hispanic -0.02 -0.02 -0.03 -1.00 -0.88 0.9207 -1.04 0.0731Binge drinking in past 2 weeks White -0.05 -0.05 -0.05 -1.98 -1.99 0.9957 -2.10 <.0001 African American -0.04 -0.05 -0.04 -1.24 -1.28 0.9645 -1.27 0.0082 Hispanic 0.01 -0.02 -0.01 0.45 -0.52 0.3190 -0.20 0.6774Cigarettes: 30-day use White -0.10 -0.11 -0.11 -4.04 -3.63 0.3414 -3.99 <.0001 African American -0.07 -0.11 -0.09 -2.16 -2.75 0.4814 -2.47 <.0001 Hispanic -0.01 -0.01 -0.01 -0.39 -0.31 0.9116 -0.43 0.2788Inhalants: Annual use White -0.04 -0.05 -0.04 -0.90 -1.04 0.6350 -1.00 <.0001 African American 0.02 -0.02 0.00 0.27 -0.21 0.1793 0.02 0.8966 Hispanic 0.01 -0.02 -0.01 0.26 -0.38 0.1653 -0.10 0.6691Any illicit other than Mj: Annual use White -0.07 -0.06 -0.07 -2.63 -2.06 0.1400 -2.43 <.0001 African American -0.03 -0.06 -0.04 -0.59 -1.19 0.3274 -0.90 0.0025 Hispanic -0.01 -0.02 -0.02 -0.25 -0.49 0.7311 -0.46 0.2125
P-M Correlations
Use of Various Drugs by Race/Ethnicity and Parental Education among Male 10th-Grade Respondents, 1999–2008
Linear Regression Resuts
35
Impacts of Parental Education on Substance Use

99-03 04-08 99-08 99-03 04-08 p for 99-08 p for sig.r r r b b difference b relationship
Marijuana: Annual use White -0.11 -0.11 -0.11 -4.31 -4.52 0.6913 -4.49 <.0001 African American -0.03 -0.06 -0.05 -1.27 -2.29 0.3388 -1.79 0.0011 Hispanic 0.01 -0.01 -0.01 0.42 -0.49 0.4041 -0.21 0.6812Binge drinking in past 2 weeks White -0.05 -0.06 -0.06 -1.96 -2.02 0.9035 -2.02 <.0001 African American -0.03 -0.01 -0.02 -0.74 -0.25 0.4521 -0.50 0.1239 Hispanic -0.01 -0.01 -0.01 -0.45 -0.37 0.9222 -0.43 0.2944Cigarettes: 30-day use White -0.15 -0.16 -0.16 -5.63 -5.45 0.6734 -5.66 <.0001 African American -0.03 -0.05 -0.04 -0.81 -1.19 0.5557 -1.01 0.0017 Hispanic 0.00 0.01 0.00 0.05 0.33 0.7124 0.10 0.7785Inhalants: Annual use White -0.05 -0.03 -0.04 -1.16 -0.71 0.0954 -0.93 <.0001 African American 0.02 0.04 0.03 0.21 0.60 0.3017 0.41 0.0330 Hispanic 0.03 -0.01 0.01 0.54 -0.32 0.0651 0.12 0.6072Any illicit other than Mj: Annual use White -0.11 -0.09 -0.11 -3.96 -3.05 0.0178 -3.56 <.0001 African American -0.04 0.01 -0.02 -0.78 0.11 0.0714 -0.33 0.1863 Hispanic 0.04 -0.01 0.01 1.18 -0.38 0.0321 0.25 0.4857
P-M Correlations Linear Regression Resuts
Use of Various Drugs by Race/Ethnicity and Parental Education among Female 10th-Grade Respondents, 1999–2008
36
Occasional Paper No. 70

99-03 04-08 99-08 99-03 04-08 p for 99-08 p for sig.r r r b b difference b relationship
Marijuana: Annual use White 0.00 0.01 0.00 -0.13 0.24 0.5745 0.03 0.9331 African American -0.01 0.00 0.00 -0.26 -0.08 0.8868 -0.11 0.8713 Hispanic 0.08 -0.02 0.03 3.15 -0.62 0.0017 1.02 0.1212Binge drinking in past 2 weeks White -0.01 -0.01 -0.01 -0.32 -0.61 0.6340 -0.51 0.1130 African American 0.00 0.00 0.00 -0.11 0.02 0.9003 -0.03 0.9583 Hispanic 0.03 0.03 0.03 1.31 1.14 0.8975 1.23 0.0636Cigarettes: 30-day use White -0.05 -0.07 -0.06 -2.40 -2.95 0.3332 -2.75 <.0001 African American -0.03 -0.03 -0.03 -1.16 -0.80 0.7308 -0.93 0.0677 Hispanic 0.05 0.02 0.04 1.80 0.75 0.3279 1.22 0.0176Inhalants: Annual use White 0.00 -0.03 -0.02 0.09 -0.73 0.0296 -0.34 0.0725 African American 0.08 0.02 0.05 1.08 0.29 0.2431 0.67 0.0424 Hispanic 0.01 0.01 0.01 0.17 0.21 0.9661 0.19 0.6380Any illicit other than Mj: Annual use White -0.03 -0.03 -0.03 -1.28 -1.10 0.6928 -1.19 <.0001 African American 0.02 0.01 0.01 0.60 0.15 0.6002 0.36 0.3912 Hispanic 0.04 0.02 0.03 1.42 0.65 0.4869 0.99 0.0634
P-M Correlations Linear Regression Resuts
Use of Various Drugs by Race/Ethnicity and Parental Education among Male 12th-Grade Respondents, 1999–2008
37
Impacts of Parental Education on Substance Use

99-03 04-08 99-08 99-03 04-08 p for 99-08 p for sig.r r r b b difference b relationship
Marijuana: Annual use White -0.01 -0.03 -0.02 -0.36 -1.36 0.1464 -0.94 0.0060 African American 0.01 -0.02 -0.01 0.27 -0.85 0.2858 -0.27 0.5823 Hispanic 0.04 0.04 0.05 1.60 1.49 0.9365 1.72 0.0056Binge drinking in past 2 weeks White 0.01 -0.01 0.00 0.40 -0.44 0.1448 -0.06 0.8467 African American 0.01 0.01 0.01 0.31 0.29 0.9686 0.30 0.3792 Hispanic 0.06 0.03 0.05 1.98 0.84 0.1536 1.48 0.0010Cigarettes: 30-day use White -0.09 -0.12 -0.11 -3.85 -4.62 0.1430 -4.39 <.0001 African American 0.01 -0.01 0.00 0.34 -0.26 0.4271 0.04 0.9035 Hispanic 0.08 0.07 0.08 2.33 2.06 0.8156 2.33 <.0001Inhalants: Annual use White -0.02 -0.04 -0.03 -0.39 -0.79 0.1513 -0.61 <.0001 African American -0.03 0.03 0.00 -0.30 0.27 0.2001 -0.02 0.9340 Hispanic 0.08 0.00 0.03 1.10 0.02 0.0810 0.52 0.0900Any illicit other than Mj: Annual use White -0.04 -0.06 -0.05 -1.61 -2.16 0.2203 -1.91 <.0001 African American 0.03 0.01 0.02 0.60 0.32 0.6287 0.46 0.1335 Hispanic 0.05 0.04 0.05 1.53 1.25 0.7873 1.44 0.0029
P-M Correlations Linear Regression Resuts
Use of Various Drugs by Race/Ethnicity and Parental Education among Female 12th-Grade Respondents, 1999–2008
38
Occasional Paper No. 70