Embed Size (px)
Citation preview

THIS REPORT CONTAINS ASSESSMENTS OF COMMODITY AND TRADE ISSUES MADE BY
USDA STAFF AND NOT NECESSARILY STATEMENTS OF OFFICIAL U.S. GOVERNMENT
POLICY
Date:
GAIN Report Number:
Approved By:
Prepared By:
Report Highlights:
Pakistan’s marketing year (MY) 2013/14 (October/September) vegetable oil imports are forecast at a
record 2.44 million metric tons (MMT), six percent higher than MY 2012/13. MY 2013/14 imports
of soybean meal are projected at 460,000 tons, up 15 percent from the estimated import level this
year. Oilseed production in MY 2013/14 is forecast at a record 5.4 MMT, up four percent from the
MY 2012/13 5.1 MMT harvest. Pakistan’s cottonseed production in MY 2013/14 is projected at
4.44 MMT, up eight percent over the previous year production of 4.1 MMT. Imports of oilseeds are
forecast at 937,000 tons, up 19 percent from last year’s import level of 790,000 tons.
M. Shafiq Ur Rehman
Richard Todd Drennan
Oilseeds and Products Annual 2013
Oilseeds and Products Annual
Pakistan
PK1303
4/5/2013
Required Report - public distribution

Executive Summary:
Pakistan is a net importer of oilseeds and edible oils, as domestic production of edible oils is sufficient
to meet about 24 percent of total demand. Pakistani oilseed production consists of cotton seed,
sunflower seed, and rapeseed production.
MY 2013/14 oilseed production is forecast at 5.4 MMT, four percent higher than the revised MY
2012/13’s 5.1 MMT harvest, due to higher cotton yields. Imports of oilseeds are forecast at 937,000
MT a 19 percent increase from MY 2012/13 due to increased human and animal consumption. Total
supply of oilseed available for crushing in MY 2013/14 is forecasted at 5.6 MMT, 6 percent higher than
MY 2012/13.
MY 2013/14 domestic meal production is forecast at 3.2 MMT, up 7 percent from current year’s level
of 3.0 MMT. MY 2013/14 imports of soybean meal are forecast at 460,000 tons, 15 percent higher than
MY 2012/13 imports.
MY 2013/14 oil production is forecast at 1.31 MMT, four percent higher than the current year’s
estimate of 1.26 MMT. Vegetable oil imports are forecast at a record 2.44 MMT, an increase of six
percent relative to MY2012/13, due to record oil consumption.
Commodities:

Production:
Pakistan has been chronically deficient in edible oil production, as a result imports account for 76
percent of its domestic requirements. Since the 1970’s oilseed import has been on the increase, a trend
that will continue to increase in tandem with its burgeoning population growth. Sporadic efforts have
been made to increase local oilseed production, but, so far, have proven unsuccessful to narrow the vast
gap between production and consumption.
MY 2013/14 (Oct-Sep) oilseed production is forecast at 5.4 MMT, up four percent over MY 2012/13
production estimate due to an anticipated increase in cottonseed production, which is forecast at 4.44
MMT, eight percent higher than MY2012/13 weather affected crop. Sunflower seed production is
forecast at 600,000 tons, down 14 percent from last year and rapeseed production is forecast at 320,000
tons, nine percent lower than the previous year’s estimate of 350,000 tons; both as a result in similar
reductions in planting area.
Post’s estimate of Pakistan’s total oilseed production in MY 2012/13 was revised down 12 percent to
5.1 MMT, due to a decrease in cotton production, as last year’s unfavorable weather conditions
exacerbated the incidence of cotton leaf curl virus (CLCV) in the cotton growing areas of Punjab and
Sindh province, with estimated loss of over two million 375 lbs. cotton bales equivalent to 680,000 tons
of cotton seed.
Cottonseed:
Cottonseed is the principal oilseed crop grown in Pakistan, accounting for about 80 percent of domestic
oilseed production. Cotton is the country’s most important cash crop and is considered the backbone of
the national economy, as it provides the key input for Pakistan’s $25 billion textile industry.
MY 2013/14 cottonseed production is forecast at 4.44 million tons, eight percent higher than the MY
2012/13 crop. This increase in production is mainly attributed to increased cotton productivity through
best agricultural management practices, and favorable weather conditions.
Rapeseed:
Rapeseed-mustard is an important species of Brassica group grown as oilseed crops in Pakistan, and a
major source of edible oil in the sub-continent for centuries. It is sometimes grown as a fodder in
mixture with "berseem" (alfalfa/medics). Area under rapeseed-mustard fluctuates depending on the
Government of Pakistan’s (GOP) price support policy for wheat crop, and prevailing weather
conditions, as moisture availability in marginal areas is key for farmers’ cropping decisions.
MY 2013/14 rapeseed production is forecast at 320,000 tons, a nine percent reduction from MY
2012/13 rapeseed production estimate of 350,000 tons, due to a similar reduction in planted area.
Sunflower seed:
Oilseed, Soybean
Oilseed, Sunflowerseed
Oilseed, Rapeseed
Oilseed, Cottonseed

In Pakistan commercial cultivation of sunflower began in the 1960’s, and its production remains
cyclical, due to its competition with major crops such as maize and sugarcane and marketing issues
related to the size of crop and offered prices from the private sector.
MY 2013/14 sunflower seed production is forecast at 600,000 tons, 14 percent down from the current
year’s estimate due to increased area allocated to maize, sugarcane and rice due to more attractive prices
Consumption:
Oilseed consumption will continue to be strong in ensuing years due to Pakistan’s high population
growth rate and steady growth in the poultry and livestock sectors. Since 2005, the Government of
Pakistan (GOP) has implemented a liberalized import policy for oilseeds, in order to meet the country’s
growing consumption needs. The oilseed crushing industry, the main beneficiary of these policies, has
improved its efficiency by overhauling older machinery and installing high-tech solvent extraction
equipment.
Total oilseed crush in 2013/14 is anticipated at 5.6 MMT, 6 percent higher than in 2012/13, as higher
local production and imports need to meet the growing oil and oil meal demand. Almost 85 to 90
percent of total oilseed production is crushed for oil with the balance used for food, feed, and seed
purposes.
Trade:
Total imports of oilseeds for crushing are forecast at 937,000 tons in MY 2013/14, up 19 percent over
last year’s revised estimate, in order to meet the increased demand for edible oil from Pakistan’s
burgeoning population, and oilseed meal from the increasingly intensive production systems of the
livestock and poultry sectors.
Table 1: Oilseed Import Statistics (Figures in Metric Tons)
Product CY - 2010 CY -2011 CY -2012 Jan/Feb -2012 Rapeseed/Canola 1,164,914 736,539 713,828 223,780 Sunflower 0 186,208 10,572 0 Soybean 10 10 0 0 Total 1,164,924 922,757 724,400 223,780
Source: Ministry of Commerce (MOC), Government of Pakistan
The MY 2013/14 oilseed import forecast includes 827,000 tons of rapeseed/canola–mainly from
Canada, Australia and the Ukraine–, 90,000 tons of sunflower seed, and 20,000 tons of soybean from
different origins. Since June 2005, under a reformed import policy regime, the GOP exempts oilseeds
from import duty, central excise duty, and federal excise duty. The following table shows the duty
structure levied on imported edible oils and oilseeds.
Table 2: Duty Structure on Edible Oil and Oilseeds
(Figures in Pak. Rupees)
Product Import
Duty (Malaysia)
Import
Duty (Indonesia)
Import
Duty CED I.Tax Adv.I.
Tax FED S.T
Palm 7,743 9,100 - 16% 5% - 1,000 -
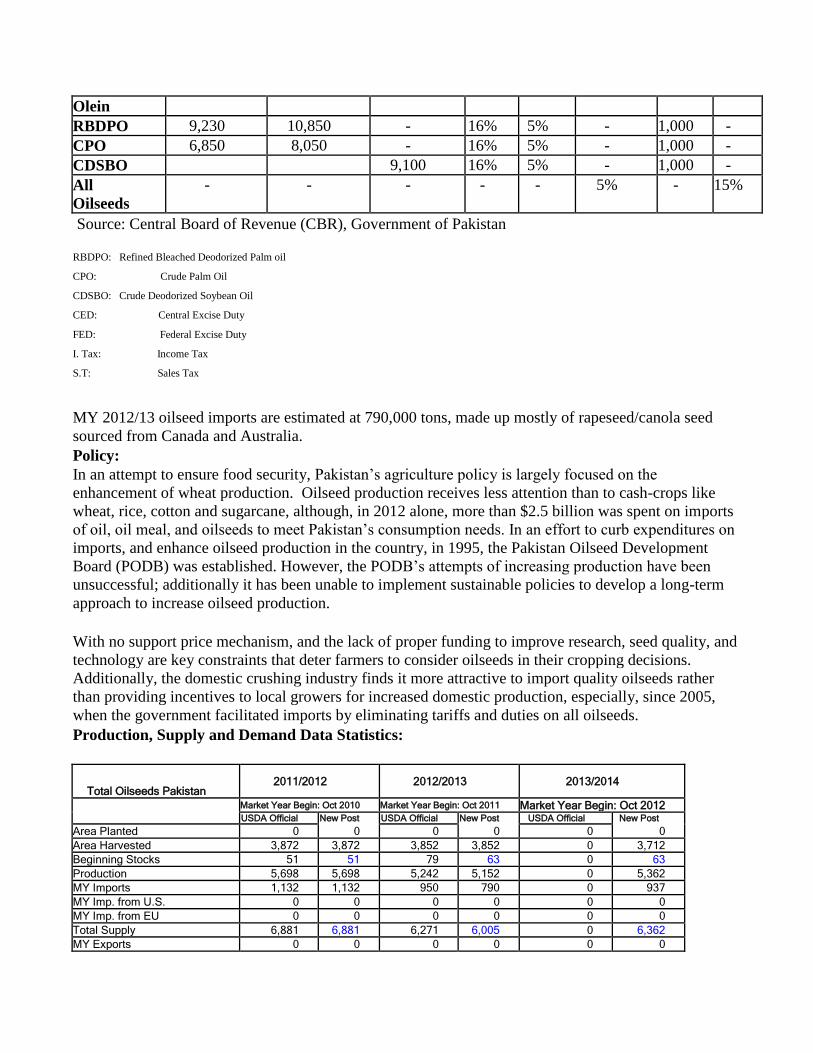
Olein
RBDPO 9,230 10,850 - 16% 5% - 1,000 -
CPO 6,850 8,050 - 16% 5% - 1,000 -
CDSBO 9,100 16% 5% - 1,000 -
All
Oilseeds - - - - - 5% - 15%
Source: Central Board of Revenue (CBR), Government of Pakistan
RBDPO: Refined Bleached Deodorized Palm oil
CPO: Crude Palm Oil
CDSBO: Crude Deodorized Soybean Oil
CED: Central Excise Duty
FED: Federal Excise Duty
I. Tax: Income Tax
S.T: Sales Tax
MY 2012/13 oilseed imports are estimated at 790,000 tons, made up mostly of rapeseed/canola seed
sourced from Canada and Australia.
Policy:
In an attempt to ensure food security, Pakistan’s agriculture policy is largely focused on the
enhancement of wheat production. Oilseed production receives less attention than to cash-crops like
wheat, rice, cotton and sugarcane, although, in 2012 alone, more than $2.5 billion was spent on imports
of oil, oil meal, and oilseeds to meet Pakistan’s consumption needs. In an effort to curb expenditures on
imports, and enhance oilseed production in the country, in 1995, the Pakistan Oilseed Development
Board (PODB) was established. However, the PODB’s attempts of increasing production have been
unsuccessful; additionally it has been unable to implement sustainable policies to develop a long-term
approach to increase oilseed production.
With no support price mechanism, and the lack of proper funding to improve research, seed quality, and
technology are key constraints that deter farmers to consider oilseeds in their cropping decisions.
Additionally, the domestic crushing industry finds it more attractive to import quality oilseeds rather
than providing incentives to local growers for increased domestic production, especially, since 2005,
when the government facilitated imports by eliminating tariffs and duties on all oilseeds.
Production, Supply and Demand Data Statistics:
Total Oilseeds Pakistan
2011/2012 2012/2013 2013/2014
Market Year Begin: Oct 2010 Market Year Begin: Oct 2011 Market Year Begin: Oct 2012 USDA Official New Post USDA Official New Post USDA Official New Post
Area Planted 0 0 0 0 0 0 Area Harvested 3,872 3,872 3,852 3,852 0 3,712 Beginning Stocks 51 51 79 63 0 63 Production 5,698 5,698 5,242 5,152 0 5,362 MY Imports 1,132 1,132 950 790 0 937 MY Imp. from U.S. 0 0 0 0 0 0 MY Imp. from EU 0 0 0 0 0 0 Total Supply 6,881 6,881 6,271 6,005 0 6,362 MY Exports 0 0 0 0 0 0
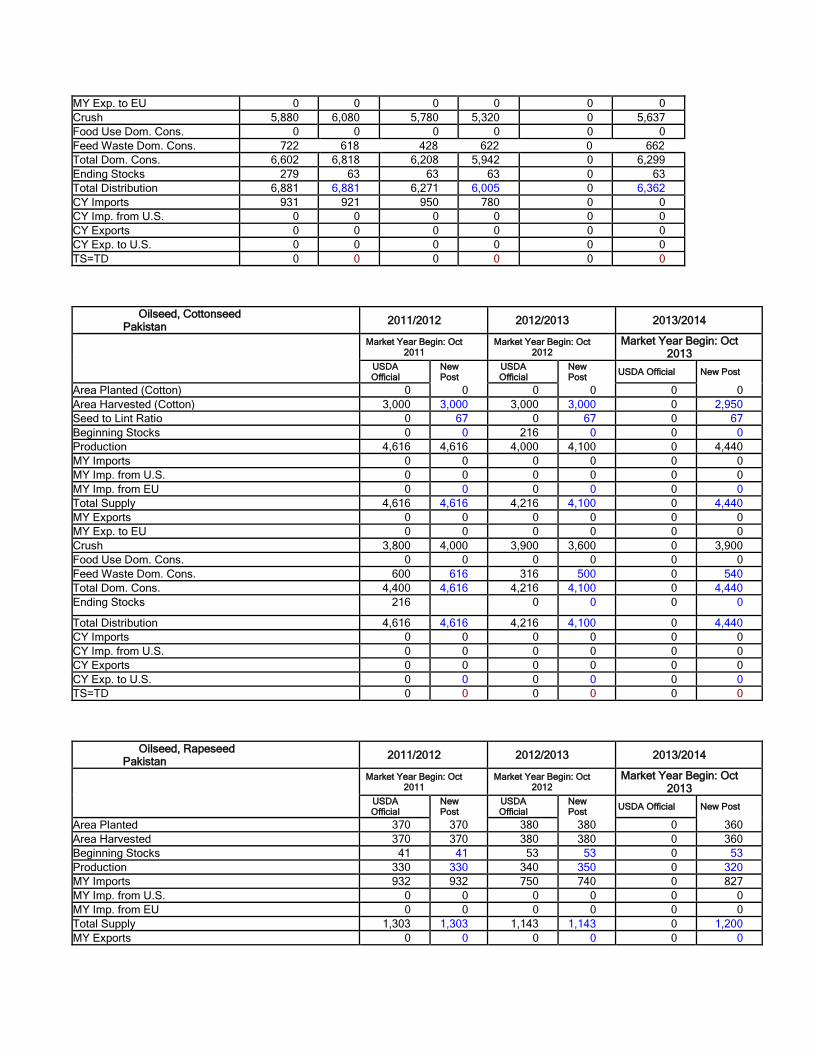
MY Exp. to EU 0 0 0 0 0 0 Crush 5,880 6,080 5,780 5,320 0 5,637 Food Use Dom. Cons. 0 0 0 0 0 0 Feed Waste Dom. Cons. 722 618 428 622 0 662 Total Dom. Cons. 6,602 6,818 6,208 5,942 0 6,299 Ending Stocks 279 63 63 63 0 63 Total Distribution 6,881 6,881 6,271 6,005 0 6,362 CY Imports 931 921 950 780 0 0 CY Imp. from U.S. 0 0 0 0 0 0 CY Exports 0 0 0 0 0 0 CY Exp. to U.S. 0 0 0 0 0 0 TS=TD 0 0 0 0 0 0
Oilseed, Cottonseed
Pakistan 2011/2012 2012/2013 2013/2014
Market Year Begin: Oct 2011
Market Year Begin: Oct 2012
Market Year Begin: Oct 2013
USDA Official
New Post
USDA Official
New Post USDA Official New Post
Area Planted (Cotton) 0 0 0 0 0 0 Area Harvested (Cotton) 3,000 3,000 3,000 3,000 0 2,950 Seed to Lint Ratio 0 67 0 67 0 67 Beginning Stocks 0 0 216 0 0 0 Production 4,616 4,616 4,000 4,100 0 4,440 MY Imports 0 0 0 0 0 0 MY Imp. from U.S. 0 0 0 0 0 0 MY Imp. from EU 0 0 0 0 0 0 Total Supply 4,616 4,616 4,216 4,100 0 4,440 MY Exports 0 0 0 0 0 0 MY Exp. to EU 0 0 0 0 0 0 Crush 3,800 4,000 3,900 3,600 0 3,900 Food Use Dom. Cons. 0 0 0 0 0 0 Feed Waste Dom. Cons. 600 616 316 500 0 540 Total Dom. Cons. 4,400 4,616 4,216 4,100 0 4,440 Ending Stocks 216 0 0 0 0
Total Distribution 4,616 4,616 4,216 4,100 0 4,440 CY Imports 0 0 0 0 0 0 CY Imp. from U.S. 0 0 0 0 0 0 CY Exports 0 0 0 0 0 0 CY Exp. to U.S. 0 0 0 0 0 0 TS=TD 0 0 0 0 0 0
Oilseed, Rapeseed
Pakistan 2011/2012 2012/2013 2013/2014
Market Year Begin: Oct 2011
Market Year Begin: Oct 2012
Market Year Begin: Oct 2013
USDA Official
New Post
USDA Official
New Post USDA Official New Post
Area Planted 370 370 380 380 0 360 Area Harvested 370 370 380 380 0 360 Beginning Stocks 41 41 53 53 0 53 Production 330 330 340 350 0 320 MY Imports 932 932 750 740 0 827 MY Imp. from U.S. 0 0 0 0 0 0 MY Imp. from EU 0 0 0 0 0 0 Total Supply 1,303 1,303 1,143 1,143 0 1,200 MY Exports 0 0 0 0 0 0

MY Exp. to EU 0 0 0 0 0 0 Crush 1,170 1,170 1,010 1,010 0 1,067 Food Use Dom. Cons. 0 0 0 0 0 0 Feed Waste Dom. Cons. 80 80 80 80 0 80 Total Dom. Cons. 1,250 1,250 1,090 1,090 0 1,147 Ending Stocks 53 53 53 53 0 53 Total Distribution 1,303 1,303 1,143 1,143 0 1,200 CY Imports 721 721 750 720 0 0 CY Imp. from U.S. 0 0 0 0 0 0 CY Exports 0 0 0 0 0 0 CY Exp. to U.S. 0 0 0 0 0 0 TS=TD 0 0 0 0
Oilseed, Sunflowerseed
Pakistan 2011/2012 2012/2013 2013/2014
Market Year Begin: Oct 2011
Market Year Begin: May 2012
Market Year Begin: Oct 2013
USDA Official
New Post
USDA Official
New Post USDA Official New Post
Area Planted 0 0 0 0 0 0 Area Harvested 500 500 470 470 0 400 Beginning Stocks 10 10 10 10 0 10 Production 750 750 700 700 0 600 MY Imports 190 190 200 50 0 90 MY Imp. from U.S. 0 0 0 0 0 0 MY Imp. from EU 0 0 0 0 0 0 Total Supply 950 950 910 760 0 700 MY Exports 0 0 0 0 0 0 MY Exp. to EU 0 0 0 0 0 0 Crush 900 900 870 710 0 650 Food Use Dom. Cons. 0 0 0 0 0 0 Feed Waste Dom. Cons. 40 40 30 40 0 40 Total Dom. Cons. 940 940 900 750 0 690 Ending Stocks 10 10 10 10 0 10 Total Distribution 950 950 910 760 0 700 CY Imports 200 200 200 60 0 0 CY Imp. from U.S. 0 0 0 0 0 0 CY Exports 0 0 0 0 0 0 CY Exp. to U.S. 0 0 0 0 0 0 TS=TD 0 0 0 0
Oilseed, Soybean
Pakistan 2011/2012 2012/2013 2013/2014
Market Year Begin: Oct 2011
Market Year Begin: May 2012
Market Year Begin: Oct 2013
USDA Official
New Post
USDA Official
New Post USDA Official New Post
Area Planted 2 2 2 2 0 2 Area Harvested 2 2 2 2 0 2 Beginning Stocks 0 0 0 0 0 0 Production 2 2 2 2 0 2 MY Imports 10 10 0 0 0 20 MY Imp. from U.S. 0 2 0 0 0 0 MY Imp. from EU 0 2 0 0 0 0 Total Supply 12 12 2 2 0 22 MY Exports 0 0 0 0 0 0 MY Exp. to EU 0 0 0 0 0 0 Crush 10 10 0 0 0 20 Food Use Dom. Cons. 0 0 0 0 0 0 Feed Waste Dom. Cons. 2 2 2 2 0 2

Total Dom. Cons. 12 12 2 2 0 22 Ending Stocks 0 0 0 0 0 0 Total Distribution 12 12 2 2 0 22 CY Imports 10 0 0 0 0 0 CY Imp. from U.S. 0 0 0 0 0 0 CY Exports 0 0 0 0 0 0 CY Exp. to U.S. 0 0 0 0 0 0 TS=TD 0 0 0 0 0 0
Commodities:
Production:
MY 2013/14 oilseed meal production is forecast at 3.2 MMT, up seven percent over MY 2012/13 due to
the projected increase in local production of cottonseed supplemented with significant imports of
oilseeds. Post’s estimate of MY2012/13 oil meal production was revised marginally upward to 3.0
MMT, mainly due to improved production of rapeseed. The domestic crushing industry traditionally
produces an oilseed meal ration comprised of 71 percent cottonseed, 19 percent rapeseed/canola, and 10
percent sunflower seed.
Consumption:
MY 2013/14 meal requirements are forecast to increase to 3.8 MMT due to the anticipated expansion of
the poultry, dairy and livestock, and aquaculture sectors. Pakistan’s poultry meat production is expected
to grow by more than 10 percent per annum. The layer industry is also expanding rapidly as it is able to
provide a relatively cheap protein source compared to other sources of protein.
The pace of dairy feed production is increasing at an accelerated pace to meet the demand of the
expanding commercial dairy units, that rely on high milk yielding animals, requiring balanced feeds.
This has created business opportunities to several poultry feed manufacturers, which have started
producing dairy feed and in turn spiking the demand for soybean meal to meet the rations’ needs of high
protein content. ..
This has resulted in a shift in the demand of soybean meal by feed millers from the traditional 5-7
percent to 10-15 percent.
Trade:
Virtually all of Pakistan’s meal imports are comprised of soybean meal imported from India. Imports in
MY2013/14 are forecast at 460,000 tons, up 15 percent from MY 2012/13 estimate of 400,000 tons.
Prospects for imports of U.S. soybean meal, so far, are limited due to higher freight charges and time
lag required relative to India, however, the lack of consistency in the quality of Indian soybean meal is a
pressing problem for the feed industry.
Production, Supply and Demand Data Statistics:
Meal, Soybean
Meal, Sunflowerseed
Meal, Rapeseed
Meal, Cottonseed

Total Oil Meal Pakistan 2011/2012 2012/2013 2013/2014
Market Year Begin: Oct 2010 Market Year Begin: Oct 2011 Market Year Begin: Oct 2012 USDA Official New Post USDA Official New Post USDA Official New Post
Crush 5,880 6,080 5,780 5,320 0 5,637 Beginning Stocks 65 65 139 140 0 140 Production 2,818 3,424 2,748 3,006 0 3,207 MY Imports 450 450 350 400 0 460 MY Imp. from U.S. 0 0 0 0 0 0 MY Imp. from EU 0 0 0 0 0 0 Total Supply 3,333 3,939 3,237 3,546 0 3,807 MY Exports 91 91 50 50 0 58 MY Exp. to EU 0 0 0 0 0 0 Industrial Dom. Cons. 0 0 0 0 0 0 Food Use Dom. Cons. 0 0 0 0 0 0 Feed Waste Dom. Cons. 3,103 3,708 3,108 3,356 0 3,609 Total Dom. Cons. 3,103 3,708 3,108 3,356 0 3,609 Ending Stocks 139 140 79 140 0 140 Total Distribution 3,333 3,939 3,237 3,546 0 3,807 CY Imports 425 425 300 350 0 0 CY Imp. from U.S. 0 0 0 0 0 0 CY Exports 0 0 0 0 0 0 CY Exp. to U.S. 0 0 0 0 0 0 SME 0 0 0 0 0 0 TS=TD 0 0 0 0 0 0
Meal, Cottonseed Pakistan 2011/2012 2012/2013 2013/2014
Market Year Begin: Oct 2011
Market Year Begin: Oct 2012
Market Year Begin: Oct 2013
USDA Official
New Post
USDA Official
New Post USDA Official New Post
Crush 3,800 4,000 3,900 3,600 0 3,900 Extr. Rate, 999.9999 0. 0.59 0. 0.59 0. 0.59 Beginning Stocks 65 65 89 90 0 90 Production 1,754 2,360 1,800 2,124 0 2,301 MY Imports 0 0 0 0 0 0 MY Imp. from U.S. 0 0 0 0 0 0 MY Imp. from EU 0 0 0 0 0 0 Total Supply 1,819 2,425 1,889 2,214 0 2,391 MY Exports 0 0 0 0 0 0 MY Exp. to EU 0 0 0 0 0 0 Industrial Dom. Cons. 0 0 0 0 0 0 Food Use Dom. Cons. 0 0 0 0 0 2,301 Feed Waste Dom. Cons. 1,730 2,335 1,810 2,124 0 0 Total Dom. Cons. 1,730 2,335 1,810 2,124 0 2,301 Ending Stocks 89 90 79 90 0 90 Total Distribution 1,819 2,425 1,889 2,214 0 2,391 CY Imports 0 0 0 0 0 0 CY Imp. from U.S. 0 0 0 0 0 0 CY Exports 0 0 0 0 0 0 CY Exp. to U.S. 0 0 0 0 0 0 SME 1,402 1,892 1,467 1,721 0 1,865
Meal, Rapeseed Pakistan 2011/2012 2012/2013 2013/2014
Market Year Begin: Oct 2011
Market Year Begin: Oct 2012
Market Year Begin: Oct 2013
USDA Official
New Post
USDA Official
New Post USDA Official New Post

Crush 1,170 1,170 1,010 1,010 0 1,067 Extr. Rate, 999.9999 1. 0.5812 1. 0.5792 0. 0.5792 Beginning Stocks 0 0 0 0 0 0 Production 680 680 585 585 0 618 MY Imports 0 0 0 0 0 0 MY Imp. from U.S. 0 0 0 0 0 0 MY Imp. from EU 0 0 0 0 0 0 Total Supply 680 680 585 585 0 618 MY Exports 91 91 50 50 0 58 MY Exp. to EU 0 0 0 0 0 0 Industrial Dom. Cons. 0 0 0 0 0 0 Food Use Dom. Cons. 0 0 0 0 0 0 Feed Waste Dom. Cons. 589 589 535 535 0 560 Total Dom. Cons. 589 589 535 535 0 560 Ending Stocks 0 0 0 0 0 0 Total Distribution 680 680 585 585 0 618 CY Imports 0 0 0 0 0 0 CY Imp. from U.S. 0 0 0 0 0 0 CY Exports 94 0 50 50 0 0 CY Exp. to U.S. 0 0 0 0 0 SME 419 419 381 381 0 398
Meal, Sunflowerseed Pakistan 2011/2012 2012/2013 2013/2014
Market Year Begin: Oct 2011
Market Year Begin: May 2012
Market Year Begin: Oct 2013
USDA Official
New Post
USDA Official New Post USDA Official New Post
Crush 900 900 870 710 0 650 Extr. Rate, 999.9999 0. 0.4178 0. 0.4178 0. 0.4185 Beginning Stocks 0 0 0 0 0 0 Production 376 376 363 297 0 272 MY Imports 0 0 0 0 0 0 MY Imp. from U.S. 0 0 0 0 0 0 MY Imp. from EU 0 0 0 0 0 0 Total Supply 376 376 363 297 0 272 MY Exports 0 0 0 0 0 0 MY Exp. to EU 0 0 0 0 0 0 Industrial Dom. Cons. 0 0 0 0 0 Food Use Dom. Cons. 0 0 0 0 0 0 Feed Waste Dom. Cons. 376 376 363 297 0 272 Total Dom. Cons. 376 376 363 297 0 272 Ending Stocks 0 0 0 0 0 0 Total Distribution 376 376 363 297 0 272 CY Imports 0 0 0 0 0
CY Imp. from U.S. 0 0 0 0 0 0 CY Exports 0 0 0 0 0 0 CY Exp. to U.S. 0 0 0 0 0 0 SME 355 355 343 280 0 257 TS=TD 0 0 0 0 0 0
Meal, Soybean Pakistan 2011/2012 2012/2013 2013/2014
Market Year Begin: Oct 2011
Market Year Begin: May 2012
Market Year Begin: Oct 2013
USDA Official
New Post
USDA Official
New Post USDA Official New Post
Crush 10 10 0 0 0 20 Extr. Rate, 999.9999 1. 0.8 0. 0. 0. 0.8

Beginning Stocks 0 0 50 50 0 50 Production 8 8 0 0 0 16 MY Imports 450 450 350 400 0 460 MY Imp. from U.S. 0 0 0 0 0 0 MY Imp. from EU 0 0 0 0 0 0 Total Supply 458 458 400 450 0 526 MY Exports 0 0 0 0 0 0 MY Exp. to EU 0 0 0 0 0 0 Industrial Dom. Cons. 0 0 0 0 0 0 Food Use Dom. Cons. 0 0 0 0 0 0 Feed Waste Dom. Cons. 408 408 400 400 0 476 Total Dom. Cons. 408 408 400 400 0 476 Ending Stocks 50 50 0 50 0 50 Total Distribution 458 458 400 450 0 526 CY Imports 425 425 300 350 0 0 CY Imp. from U.S. 0 0 0 0 0 0 CY Exports 0 0 0 0 0 0 CY Exp. to U.S. 0 0 0 0 0 0 SME 408 408 400 400 0 476 TS=TD 0 0 0 0 0 0
Commodities:
Production:
Domestic oil production meets only about 24 percent of the demand with the balance met through
imports. Due to a growing population and the inability to expand domestic production, Pakistan will
rely on ever larger imports to meet its consumption needs.
Based on an increased crush volume stemming from a larger cotton crop, supplemented with
significant imports of canola and sunflower seed, domestic production of vegetable oil in MY 2013/14
is forecast at 1.3 MMT, up four percent over the MY 2012/13 revised estimate.
MY 2012/13 edible oil production is estimated at 1.26 MMT, which includes 564,000 tons of
cottonseed oil, 415, 000 tons of rapeseed oil and 282,000 tons of sunflower seed oil.
Consumption:
MY 2013/14 total oil consumption is forecast at 3.7 MMT, up 5 percent over last year’s estimates. The
share of imported oil in Pakistan’s total consumption is close to 76 percent, with palm oil accounting for
87 percent of total imports, given that home consumers and food processors prefer it due to its price
competitiveness. Additionally, blending palm oil with local oils and selling it as cooking oil is popular
Oil, Palm
Oil, Soybean
Oil, Sunflowerseed
Oil, Rapeseed
Oil, Cottonseed
in Pakistan. For health reasons, well-to-do consumers are gradually shifting from hydrogenated oils
towards soft oils.
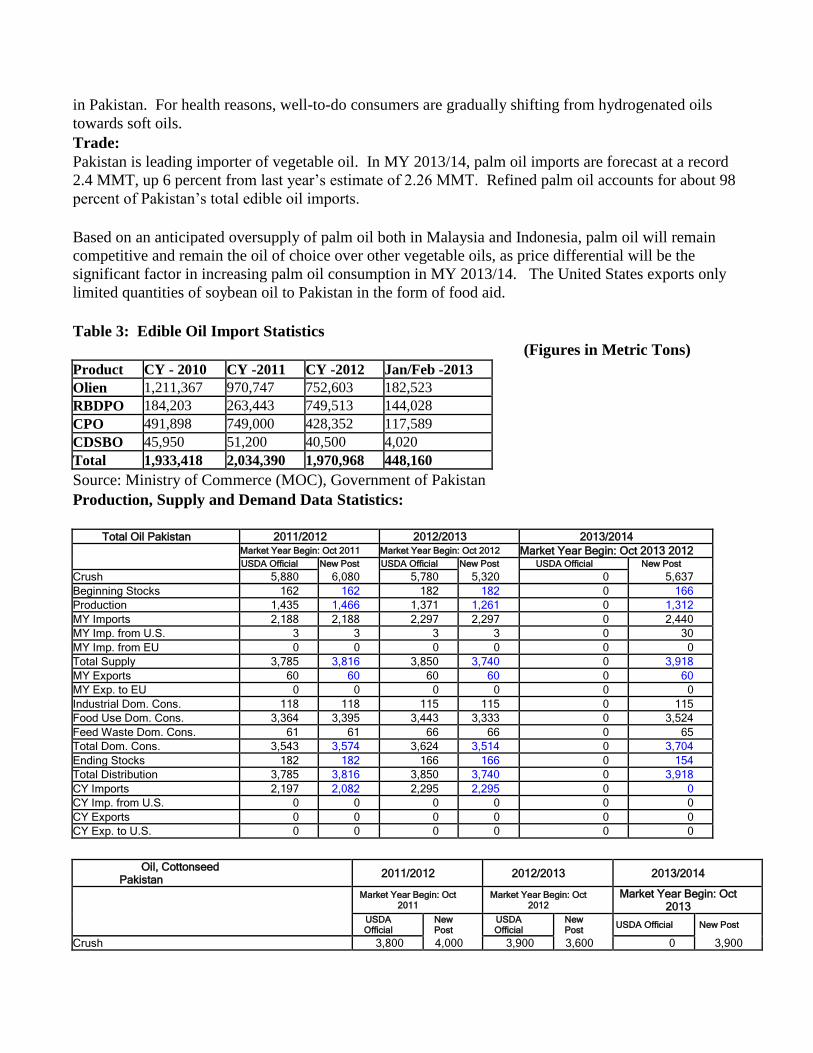
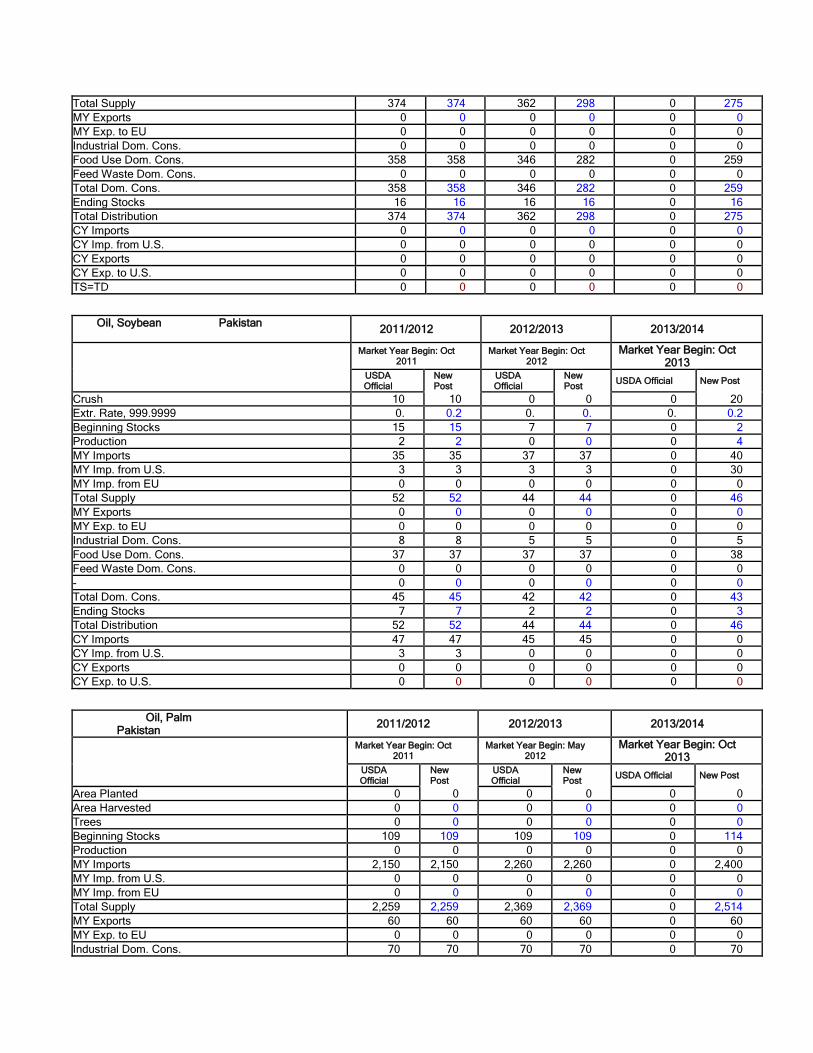
Trade:
Pakistan is leading importer of vegetable oil. In MY 2013/14, palm oil imports are forecast at a record
2.4 MMT, up 6 percent from last year’s estimate of 2.26 MMT. Refined palm oil accounts for about 98
percent of Pakistan’s total edible oil imports.
Based on an anticipated oversupply of palm oil both in Malaysia and Indonesia, palm oil will remain
competitive and remain the oil of choice over other vegetable oils, as price differential will be the
significant factor in increasing palm oil consumption in MY 2013/14. The United States exports only
limited quantities of soybean oil to Pakistan in the form of food aid.
Table 3: Edible Oil Import Statistics
(Figures in Metric Tons)
Product CY - 2010 CY -2011 CY -2012 Jan/Feb -2013 Olien 1,211,367 970,747 752,603 182,523 RBDPO 184,203 263,443 749,513 144,028 CPO 491,898 749,000 428,352 117,589 CDSBO 45,950 51,200 40,500 4,020 Total 1,933,418 2,034,390 1,970,968 448,160
Source: Ministry of Commerce (MOC), Government of Pakistan
Production, Supply and Demand Data Statistics:
Total Oil Pakistan 2011/2012 2012/2013 2013/2014
Market Year Begin: Oct 2011 Market Year Begin: Oct 2012 Market Year Begin: Oct 2013 2012 USDA Official New Post USDA Official New Post USDA Official New Post
Crush 5,880 6,080 5,780 5,320 0 5,637 Beginning Stocks 162 162 182 182 0 166 Production 1,435 1,466 1,371 1,261 0 1,312 MY Imports 2,188 2,188 2,297 2,297 0 2,440 MY Imp. from U.S. 3 3 3 3 0 30 MY Imp. from EU 0 0 0 0 0 0 Total Supply 3,785 3,816 3,850 3,740 0 3,918 MY Exports 60 60 60 60 0 60 MY Exp. to EU 0 0 0 0 0 0 Industrial Dom. Cons. 118 118 115 115 0 115 Food Use Dom. Cons. 3,364 3,395 3,443 3,333 0 3,524 Feed Waste Dom. Cons. 61 61 66 66 0 65 Total Dom. Cons. 3,543 3,574 3,624 3,514 0 3,704 Ending Stocks 182 182 166 166 0 154 Total Distribution 3,785 3,816 3,850 3,740 0 3,918 CY Imports 2,197 2,082 2,295 2,295 0 0 CY Imp. from U.S. 0 0 0 0 0 0 CY Exports 0 0 0 0 0 0 CY Exp. to U.S. 0 0 0 0 0 0
Oil, Cottonseed Pakistan 2011/2012 2012/2013 2013/2014
Market Year Begin: Oct 2011
Market Year Begin: Oct 2012
Market Year Begin: Oct 2013
USDA Official
New Post
USDA Official
New Post USDA Official New Post
Crush 3,800 4,000 3,900 3,600 0 3,900

Extr. Rate, 999.9999 0. 0.1565 0. 0.1567 0. 0.1567 Beginning Stocks 20 20 20 20 0 20 Production 595 626 610 564 0 611 MY Imports 0 0 0 0 0 0 MY Imp. from U.S. 0 0 0 0 0 0 MY Imp. from EU 0 0 0 0 0 0 Total Supply 615 646 630 584 0 631 MY Exports 0 0 0 0 0 0 MY Exp. to EU 0 0 0 0 0 0 Industrial Dom. Cons. 30 30 30 30 0 30 Food Use Dom. Cons. 565 596 580 534 0 581 Feed Waste Dom. Cons. 0 0 0 0 0 0 Total Dom. Cons. 595 626 610 564 0 611 Ending Stocks 20 20 20 20 0 20 Total Distribution 615 646 630 584 0 631 CY Imports 0 0 0 0 0 0 CY Imp. from U.S. 0 0 0 0 0 0 CY Exports 0 0 0 0 0 0 CY Exp. to U.S. 0 0 0 0 0 0
Oil, Rapeseed Pakistan 2011/2012 2012/2013 2013/2014
Market Year Begin: Oct 2011
Market Year Begin: Oct 2012
Market Year Begin: Oct 2013
USDA Official
New Post
USDA Official
New Post USDA Official New Post
Crush 1,170 1,170 1,010 1,010 0 1,067 Extr. Rate, 999.9999 0. 0.4103 0. 0.4109 0. 0.4105 Beginning Stocks 5 5 30 30 0 14 Production 480 480 415 415 0 438 MY Imports 0 0 0 0 0 0 MY Imp. from U.S. 0 0 0 0 0 0 MY Imp. from EU 0 0 0 0 0 0 Total Supply 485 485 445 445 0 452 MY Exports 0 0 0 0 0 0 MY Exp. to EU 0 0 0 0 0 0 Industrial Dom. Cons. 10 10 10 10 0 10 Food Use Dom. Cons. 444 444 420 420 0 441 Feed Waste Dom. Cons. 1 1 1 1 0 1 Total Dom. Cons. 455 455 431 431 0 452 Ending Stocks 30 30 14 14 0 0 Total Distribution 485 485 445 445 0 452 CY Imports 0 0 0 0 0 0 CY Imp. from U.S. 0 0 0 0 0 0 CY Exports 0 0 0 0 0 0 CY Exp. to U.S. 0 0 0 0 0 0 TS=TD 0 0 0 0 0 0
Oil, Sunflowerseed Pakistan 2011/2012 2012/2013 2013/2014
Market Year Begin: Oct 2011
Market Year Begin: Oct 2012
Market Year Begin: Oct 2013
USDA Official
New Post
USDA Official
New Post USDA Official New Post
Crush 900 900 870 710 0 650 Extr. Rate, 999.9999 0. 0.3978 0. 0.3972 0. 0.3985 Beginning Stocks 13 13 16 16 0 16 Production 358 358 346 282 0 259 MY Imports 3 3 0 0 0 0 MY Imp. from U.S. 0 0 0 0 0 0 MY Imp. from EU 0 0 0 0 0 0
Total Supply 374 374 362 298 0 275 MY Exports 0 0 0 0 0 0 MY Exp. to EU 0 0 0 0 0 0 Industrial Dom. Cons. 0 0 0 0 0 0 Food Use Dom. Cons. 358 358 346 282 0 259 Feed Waste Dom. Cons. 0 0 0 0 0 0 Total Dom. Cons. 358 358 346 282 0 259 Ending Stocks 16 16 16 16 0 16 Total Distribution 374 374 362 298 0 275 CY Imports 0 0 0 0 0 0 CY Imp. from U.S. 0 0 0 0 0 0 CY Exports 0 0 0 0 0 0 CY Exp. to U.S. 0 0 0 0 0 0 TS=TD 0 0 0 0 0 0
Oil, Soybean Pakistan 2011/2012 2012/2013 2013/2014
Market Year Begin: Oct 2011
Market Year Begin: Oct 2012
Market Year Begin: Oct 2013
USDA Official
New Post
USDA Official
New Post USDA Official New Post
Crush 10 10 0 0 0 20 Extr. Rate, 999.9999 0. 0.2 0. 0. 0. 0.2 Beginning Stocks 15 15 7 7 0 2 Production 2 2 0 0 0 4 MY Imports 35 35 37 37 0 40 MY Imp. from U.S. 3 3 3 3 0 30 MY Imp. from EU 0 0 0 0 0 0 Total Supply 52 52 44 44 0 46 MY Exports 0 0 0 0 0 0 MY Exp. to EU 0 0 0 0 0 0 Industrial Dom. Cons. 8 8 5 5 0 5 Food Use Dom. Cons. 37 37 37 37 0 38 Feed Waste Dom. Cons. 0 0 0 0 0 0 - 0 0 0 0 0 0 Total Dom. Cons. 45 45 42 42 0 43 Ending Stocks 7 7 2 2 0 3 Total Distribution 52 52 44 44 0 46 CY Imports 47 47 45 45 0 0 CY Imp. from U.S. 3 3 0 0 0 0 CY Exports 0 0 0 0 0 0 CY Exp. to U.S. 0 0 0 0 0 0
Oil, Palm Pakistan 2011/2012 2012/2013 2013/2014
Market Year Begin: Oct 2011
Market Year Begin: May 2012
Market Year Begin: Oct 2013
USDA Official
New Post
USDA Official
New Post USDA Official New Post
Area Planted 0 0 0 0 0 0 Area Harvested 0 0 0 0 0 0 Trees 0 0 0 0 0 0 Beginning Stocks 109 109 109 109 0 114 Production 0 0 0 0 0 0 MY Imports 2,150 2,150 2,260 2,260 0 2,400 MY Imp. from U.S. 0 0 0 0 0 0 MY Imp. from EU 0 0 0 0 0 0 Total Supply 2,259 2,259 2,369 2,369 0 2,514 MY Exports 60 60 60 60 0 60 MY Exp. to EU 0 0 0 0 0 0 Industrial Dom. Cons. 70 70 70 70 0 70

Food Use Dom. Cons. 1,960 1,960 2,060 2,060 0 2,205 Feed Waste Dom. Cons. 60 60 65 65 0 64 Total Dom. Cons. 2,090 2,090 2,195 2,195 0 2,339 Ending Stocks 109 109 114 114 0 115 Total Distribution 2,259 2,259 2,369 2,369 0 2,514 CY Imports 2,150 2,035 2,250 2,250 0 0 CY Imp. from U.S. 0 0 0 0 0 0 CY Exports 60 60 50 50 0 0 CY Exp. to U.S. 0 0 0 0 0 0 TS=TD 0 0 0 0 0 0