Embed Size (px)
Citation preview

Food Outlook
0000 November 20116
Oilseeds market summary
Although likely to exceed last season’s record, global
oilcrop production in 2011/12 is forecast to grow
marginally, with a year-on-year decrease expected for
two major oilcrops, soybeans and rapeseed. Growth
in global supplies of oils and meals could still be
somewhat higher, thanks to ample carry-in stocks
from 2010/11. However, with steady expansion in
demand for oilseed products, a tightening in the world
supply and demand balance seems inevitable. As to
international prices for oilcrops and derived products,
changes in the short-term prospects and spill-over
effects from other markets have led to downward
trends in recent months. However, with the onset of
the new season, the market should be increasingly
driven by the outlook for 2011/12. The anticipated
tightening in global supply and demand seems to call
for a gradual strengthening in prices of both oils and
meals. As the season unfolds, the market will face a
drawdown in global inventories as well as a reduction
in overall stock-to-use ratios, the reverse of the past
two seasons. Furthermore, new risks arise from the
fact that global import demand will depend heavily on
future supplies from Latin America and the Caribbean.
Developments outside the oilseed complex are also
adding uncertainty, in particular, the evolution of
prices of feedgrain and mineral oil markets and
renewed fears of a global economic recession, which
could reduce overall commodity demand.
50
100
150
200
250
300
20112010200920082007200620052004
Meals/cakes
Oils/ fats
Oilseeds
FAO monthly international price indices for oilseeds, oils/ fats and meals/cakes (2002-2004=100)
Contact person:
Peter Thoenes: E.mail: [email protected]
World oilseed and product market at a glance
2009/10 2010/11 2011/12
Change: 2011/12
over 2010/11
est im. f 'cast
million tonnes %
TOTAL OILSEEDS
Product ion 456.7 469.9 472.0 0.4
OILS AND FATS
Product ion 172.7 178.6 181.3 1.5
Supply 196.1 204.9 209.8 2.4
Ut ilizat ion 169.9 175.2 183.6 4.8
Trade 89.4 90.7 94.4 4.1
Stock-to-ut ilizat ion rat io (%) 15.5 16.2 14.5 -10.5
MEALS AND CAKES
Product ion 114.1 117.3 116.9 -0.3
Supply 128.1 136.3 137.6 1.0
Ut ilizat ion 107.8 113.8 119.1 4.7
Trade 67.0 69.3 72.3 4.3
Stock-to-ut ilizat ion rat io (%) 17.6 18.1 15.1 -16.6
FAO PRICE INDICES (Jan-Dec) (2002-2004=100) 2009 2010 2011
Change: Jan-Oct 2011
over Jan-Oct 2010
Jan-Oct %
Oilseeds 161 172 218 34.9
Meals/cakes 194 217 220 2.5
Oils/fats 150 193 258 46.3
Note: Refer to table 10 for further explanat ion regarding de nit ions and coverage.

Food Outlook
November 201144
OILSEEDS, OILS AND MEALS4
PRICES5
Fundamentals point towards renewed price strength in 2011/12 In the 2010/11 marketing season (October/September),
international prices for most oilcrops and derived products
rose until February 2011, when they came close to their
2008 peaks (as illustrated by the respective FAO price
indices). Key drivers behind the price rise were a series of
downward corrections in production forecasts, continued
growth in the demand for vegetable oil as biodiesel
feedstock, strong import demand for oilcrop products, and
price spill-over effects from tight grain markets.
However, after February 2011, international prices
embarked on a downward trend and by September, though
still high in historical terms, the price indices for oilseed, oil
and meal had fallen 7 percent, 15 percent and 17 percent,
respectively, compared with their mid-season peaks. The
decrease came with changes in market prospects: ample
and larger than expected soybean crops were harvested in
South America and Southeast Asian palm oil production
began to recover ending eight months of poor growth. The
improvement of crop prospects coincided with a temporary
slowdown in global import demand for soybean and
derived products and palm oil, resulting in an unexpected
rise in inventories held by major exporters. With northern
hemisphere crops entering the markets in September,
supply pressure continued. Furthermore, price weakness in
global feed grain markets started spilling over to the oilseed
complex, and growing fear of another global economic
recession, which could depress demand, began to weigh on
prices.
With the onset of the new season, the market should
be increasingly influenced by the supply and demand
outlook for 2011/12. Based on current forecasts, notably
the prospect of reduced output in two major oilcrops
(soybeans and rapeseed), a tightening in the global supply
and demand balance seems inevitable. To date, the market
4 Almost the entire volume of oilcrops harvested worldwide is crushed to obtain oils and fats for human nutrition or industrial purposes, and to obtain cakes and meals which are used as feed ingredients. Therefore, rather than referring to oilseeds, the analysis of the market situation is mainly undertaken in terms of oils/fats and cakes/meals. Hence, production data for oils (cakes) derived from oilseeds refer to the oil (cake) equivalent of the current production of the relevant oilseeds, i.e. they do not reflect the outcome of actual oilseed crushing.Furthermore, the data on trade in and stocks of oils (cakes) refer to the sum of trade in and stocks of oils and cakes plus the oil (cake) equivalent of oilseed trade and stocks.
5 For details on prices and corresponding indices, see appendix Table A24 .
has not yet reacted to these signals: the current ample
availabilities of oils and meals, the price weakness prevailing
in grain markets and continued macroeconomic uncertainties
have prevented prices from rising. However, 2011/12
oilcrop market fundamentals seem to call for a gradual
strengthening in prices later this season. Poor growth in
global supplies of oilcrops and derived products (especially
oilmeals) is forecast to coincide with a steady expansion in
global demand. Therefore, assuming the current forecasts
materialize, the market will be faced with a drawdown in
global inventories as well as a reduction in overall stock-to-
use ratios – the reverse of what happened in the past two
seasons. Moreover, new risks arise from the fact that global
import demand will depend heavily on future supplies from
South America. Finally, oilcrop markets will continue to be
influenced by developments outside the oilseed complex, in
particular price trends in related feedgrain and mineral oil
markets and continued fears of economic recession.
OILSEEDS
Oilseed production forecast to grow only marginally in 2011/12 World oilcrop production in 2011/12 is tentatively estimated
at 472 million tonnes. Although a new record, production
would grow by less than 1 percent year-on-year, compared
with over 5 percent on average in the last three seasons. The
slowdown would be due to reduced soybean and rapeseed
crops, which are both forecast to fall by around 2 percent.
In the United States, the world’s leading soybean
producer, the just completed harvest yielded about 8 percent
Figure 33. FAO monthly international price indices for oilseeds, oils/fats and meals/cakes (2002-2004=100)
50
100
150
200
250
300
20112010200920082007200620052004
Meals/cakes
Oils/fats
Oilseeds
Market assessments
November 2011 45
less than last year, with lower plantings and weather-induced
yield losses contributing about equally to the decline. Due
to increased competition for land, plantings of other crops,
in particular maize, rose at the expense of soybeans. Lower
soybean output is also reported in China, due to shifts in
plantings and continued shrinkage in the country’s arable
land base, and Canada. In South America, where soybean
plantings are underway, tentative forecasts imply a modest
rise to the second highest output on record. Competition
from grains and other attractively priced crops should limit
this year’s expansion in soy plantings. In addition, yield
prospects remain uncertain as a new La Niña weather
pattern might develop during the season, bringing below
average rainfall to the region. Argentina’s production is
estimated to rise compared with last year, whereas a slight
fall is forecast for Brazil. The anticipated drop in global rapeseed production
primarily reflects falls in China and parts of the EU, due
to, respectively, reduced plantings and adverse weather.
Record harvests in Australia, Canada and India should
only partly offset those falls. Global production of other
major oilcrops is anticipated to rise markedly, particularly
cottonseed and sunflowerseed. Growth in cottonseed
production is concentrated in South and East Asia,
while the Russian Federation is driving the rise in
sunflowerseed.
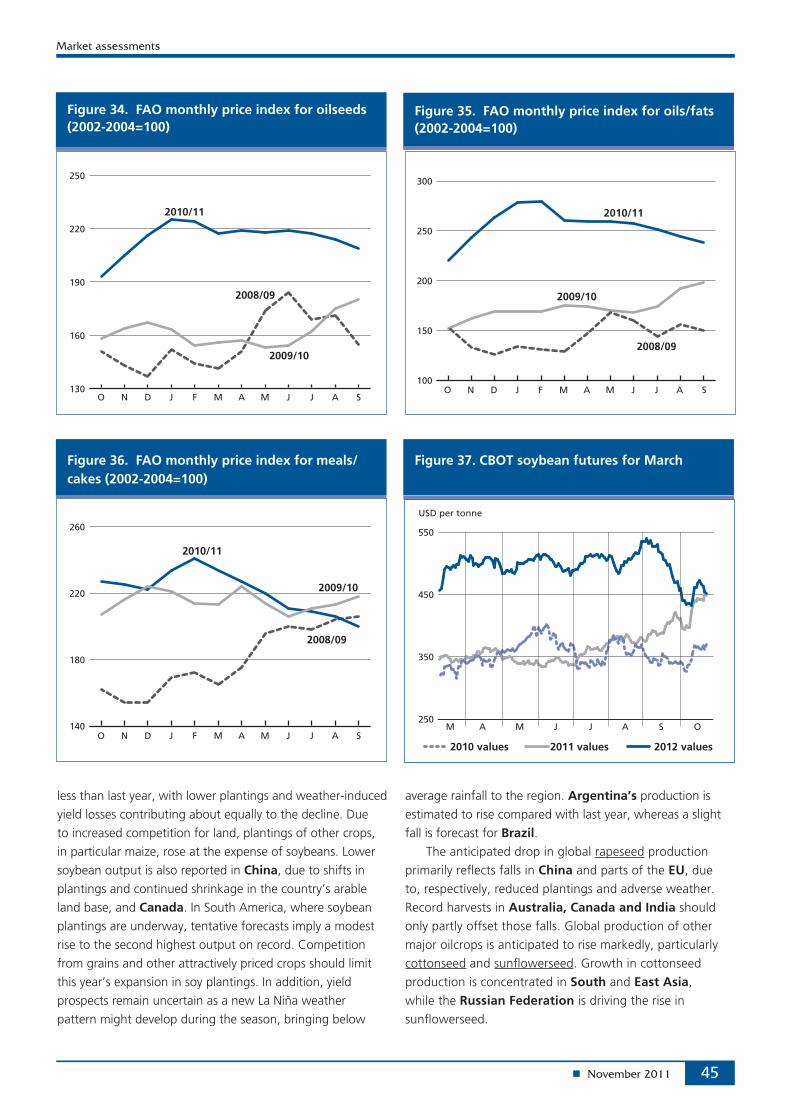
Figure 37. CBOT soybean futures for March
250
350
450
550
USD per tonne
M A M J J A S O
2010 values 2011 values 2012 values
Figure 35. FAO monthly price index for oils/fats (2002-2004=100)
100
150
200
250
300
2009/10
2008/09
2010/11
SAJJMAMFJDNO
Figure 36. FAO monthly price index for meals/cakes (2002-2004=100)
140
180
220
260
2008/09
2009/10
2010/11
SAJJMAMFJDNO
Figure 34. FAO monthly price index for oilseeds (2002-2004=100)
130
160
190
220
250
2008/09
2009/10
2010/11
SAJJMAMFJDNO

Food Outlook
n November 201146
OILS AND FATS6
below average growth anticipated in oils/fats suppliesCurrent 2011/12 crop forecasts translate into a 1.5 percent
increase in global oils/fats production to 181 million tonnes,
which implies a considerable slowdown in growth compared
with the three preceding seasons. Oil extraction from annual
oilcrops should increase by less than 1 million tonnes. Led
by the oil palm, perennial crops are forecast to add almost
2 million tonnes to total output. At 3 percent, the projected
year-on-year growth in global palm oil production would
however remain well below past growth rates, due to
reduced expansion in mature area, in particular in Malaysia,
as well as to the tree’s yield cycle and the effects of a
possible La Niña weather episode.
Global oils/fats supplies, which comprise 2011/12
production plus global 2010/11 ending stocks, should
expand by about 2.5 percent, thanks to good stock
positions at the beginning of this season. With regard to
key producers, domestic availability is set to expand, in
particular, in Argentina, brazil, Indonesia, Malaysia and cIS countries. By contrast, it is forecast to remain
about unchanged in canada, china and India, while a
pronounced drop is expected in the united States, owing
to its poor soybean harvest. A reduction in supplies, for the
second consecutive season, is also anticipated in the eu,
following further cuts in both output and opening stocks.
oils/fats consumption to continue expanding Global demand for oils/fats is anticipated to continue
expanding at an about average rate of 5 percent in 2011/12,
reaching 184 million tonnes. Economic growth is expected
to continue boosting average per capita oil consumption
in many developing countries, in particular emerging
economies. Further rising demand from the biodiesel
industry worldwide, estimated to consume some 20 percent
more than last season, should account for close to half
of the projected increase in global consumption. Higher
mandatory blending rates and the creation of additional
production capacity in several countries continue driving
growth in the biodiesel sector.
As in past years, much of the increase in global demand
is expected to originate in Asia, with china a dominant
player and with food and oleochemical uses as main
areas of growth. With national consumption exceeding
6 This section refers to oils from all origins, which, in addition to products derived from the oil crops discussed under the section on oilseeds, include palm oil, marine oils as well as animal fats.
Table 14. World production of major oilseeds
2009/10 2010/11estim.
2011/12 f’cast
change 2011/12
over 2010/11
%
million tonnes
Soybeans 259.9 265.8 260.7 -1.9
Cottonseed 39.9 44.8 48.0 + 6.9
Rapeseed 61.7 60.7 59.2 - 2.5
Groundnuts (unshelled) 34.9 37.0 37.2 + 0.5
Sunflower seed 32.5 33.1 37.5 + 13.2
Palm kernels 11.7 12.5 13.1 + 4.3
Copra 5.8 5.0 5.5 + 9.3
Total 446.4 458.9 461.2 + 0.5
Table 15: World oilseed and product market at a glance
2009/10 2010/11 2011/12
Change: 2011/12
over 2010/11
estim. f'cast
million tonnes %
TOTAL OILSEEDS
Production 456.7 469.9 472.0 0.4
OILS AND FATS1
Production 172.7 178.6 181.3 1.5
Supply2 196.1 204.9 209.8 2.4
Utilization3 169.9 175.2 183.6 4.8
Trade4 89.4 90.7 94.4 4.1
Stock-to-utilization ratio (%) 15.5 16.2 14.5 -10.5
MEALS AND CAKES5
Production 114.1 117.3 116.9 -0.3
Supply2 128.1 136.3 137.6 1.0
Utilization3 107.8 113.8 119.1 4.7
Trade4 67.0 69.3 72.3 4.3
Stock-to-utilization ratio (%) 17.6 18.1 15.1 -16.6
FAO PRICE INDICES (Oct-Sep) (2002-2004=100) 2008/09 2009/10 2010/11
Change: 2010/11
over 2009/10
%
Oilseeds 156 162 215 32.7
Meals/cakes 180 215 221 2.8
Oils/fats 144 173 254 46.8
Note: Refer to footnote 4 in the text for further explanation regarding definitions and coverage.1 Includes oils and fats of vegetable, animal and marin origin.2 Production plus opening stocks.3 Residual of the balance.4 Trade data refer to exports based on a common October/September marketing season.5 All meal figures are expressed in protein equivalent; meals include all meals and cakes derived from oilcrops as well as meals of marine and animal origin.
Note: The split years bring together northern hemisphere annual crops harvested in the latter part of the first year shown, with southern hemisphere annual crops harvested in the early part of the second year shown. For tree crops, which are produced throughout the year, calendar year production for the second year shown is used.

Market assessments
November 2011 47
34 million tonnes (almost 9 percent higher than last season),
China is set to confirm its position as the world’s largest
consumer. In India, Asia’s second largest consumer, year-
on-year growth should not exceed 4 percent, whereas
in Indonesia, utilization is forecast to grow more than
10 percent, reflecting further expansion in the country’s
palm oil refining industry. Under the lead of Argentina and,
in particular, Brazil, consumption should continue rising in
South America. Together, Argentina and Brazil are expected
to consume 11.4 million tonnes of oils/fats, double the level
recorded only six years ago. Biofuel demand is estimated to
account for no less than two-thirds of the anticipated rise in
consumption, as mandatory blending rates are expected to
be raised to 7 percent in Brazil and 10 percent in Argentina,
which is also set to further expand its biodiesel exports. In
the United States, domestic consumption growth mainly
reflects efforts by the biodiesel industry to comply with
the national biofuel consumption targets. However, the
industry’s actual uptake will depend on whether or not the
currently applied biodiesel tax credit will be extended into
2012. In the EU, demand seems to be stagnating because
of successive reductions in domestic oil supplies and slower
expansion of the biodiesel industry, due to low profitability
levels.
Supply and demand balance for oils/fats expected to tightenUnlike in the last two seasons, global production is
anticipated to fall short of total demand in 2011/12. The
shortfall, estimated at about 2.4 million tonnes, should lead
to a decrease in global inventories. World ending stocks
(measured as oil/fat inventories plus the oil contained in
stored oilseeds) are projected to fall by 5 percent to below
27 million tonnes. With regard to major stockholding
countries, a pronounced decrease in stocks is anticipated
in the United States, so as to compensate for the cut in
production and in China, to meet rising consumption.
Canada’s inventories are anticipated to fall to a seven-
year low. Significant rebuilding of inventories is expected
only in Argentina and the Russian Federation, thanks to
domestic production increases. The anticipated fall in global
inventories, combined with the projected rise in global
consumption, would push the stock-to-use ratio below
15 percent and, thus, close to the critically low level recorded
during the 2008 food crisis. If these forecasts were to be
confirmed, firm prices are likely to prevail in the international
oils/fats market during 2011/12.
Global trade in oils/fats to expandIn 2011/12, global trade in oils/fats (including the oil contained
in traded oilseeds) is forecast to expand by close to 4 million
tonnes, or about 4 percent. About half of the anticipated
rise should be on account of palm oil, with record export
availabilities in Indonesia forecast to boost its shipments by
6 percent. Compared with Indonesia, Malaysia’s increase
in palm oil sales should be considerably lower due to its
sluggish growth in domestic production. Unlike in recent
years, soybean oil is anticipated to play only a limited role
in this season’s global trade expansion, as South America’s
expected rise in exports should be largely offset by a drop
in shipments from the United States. Instead, trade in
sunflowerseed oil is anticipated to grow vigorously, given the
Figure 39. World closing stocks and stock-to-use ratio of oils/fats (including the oil contained in seeds stored)
0
10
20
30
2011/122010/112009/102008/092007/0811
13
15
17
Million tonnes Percent
World Stocks Stock-to-use ratio
estim. f’cast
Figure 38. Global production and utilization of oils/fats
-4
-2
0
2
4
150
160
170
180
190
2011/122010/112009/102008/092007/08
Million tonnes Million tonnes
estim. f’cast
Balance (production minus utilization, right axis)
Production (left axis) Utilization (left axis)

Food Outlook
November 201148
surge in sunflowerseed production in the CIS region. More
than half of the joint output of the Russian Federation and
Ukraine is anticipated to reach the world market. Similar to
soybean, rapeseed’s contribution to the expansion in global
trade should be limited, mainly reflecting lack of production
growth in Canada. As to global oils/fats imports, most of the
anticipated growth in 2011/12 is expected to occur in Asia
under the lead of China and India. China’s increase is set at
close to 10 percent, which lifts purchases by the country to
over 21 million tonnes (including the oil contained in seed
imports). Continued population and income growth coupled
with stagnating domestic oilcrop production explain the
rise. In China as well as India, reliance on foreign purchases
to satisfy domestic demand will remain high. In the EU, a
marked increase in imports appears likely, given this year’s
poor rapeseed crop and additional demand from the biodiesel
industry. Based on current forecasts, more than half of the
EU’s oils/fats consumption would be met through foreign
purchases this season.
MEALS AND CAKES7
Global meal supplies to increase marginally in 2011/12 Assuming current crop forecasts materialize, global meals/
cakes production should drop slightly compared with last
season. Higher sunflower and cottonseed meal outputs will
not be sufficient to offset the expected decline in soymeal
production. However, thanks to ample carry-in stocks from
last season, in particular near record soybean inventories,
global supplies of meals/cakes, comprising 2011/12
production and 2010/11 ending stocks, are forecast to
increase slightly. With regard to the main producers, poor
harvests should translate into sizeable drops in domestic
supplies in China, the EU and the United States, while
abundant inventories should allow domestic meal supplies
to grow in Brazil. In Argentina, a more distinct rise should
be achievable thanks to the prospective rise in soybean
production. Noticeable supply improvements are also
expected in India and the Russian Federation, again based
on good domestic crops.
Steady expansion expected in meal consumptionSteady expansion in global consumption of meals/cakes
is forecast to continue in 2011/12. Commodity-wise,
consumption growth is expected to concern mainly soybean,
sunflower and cottonseed meal. In absolute terms, soybean
meal is forecast to satisfy two-thirds of total demand.
Consumption growth in the developing world should
continue to outpace that of developed nations. About
two-thirds of global consumption growth is anticipated to
originate in Asia, where demand keeps increasing, fuelled
by livestock sector expansion. The key player in this context
is China. Despite a possible slowdown relative to the last
two seasons, China’s meal demand is still forecast to grow
by 5.5 million tonnes. Further consumption gains are also
expected in India, as well as in South American countries,
especially Brazil. By contrast, poor or no growth is likely to
7 This section refers to meals from all origins. In addition to products derived from the oil crops discussed under the section on oilseeds, this also includes fish meal and meals of animal origin.
Figure 40. Total oil/fat imports by region or major country (including the oil contained in seed imports)
0
8
16
24
32
2011/122009/102007/082005/062003/04
Latin America
Asia excl. China (total) Europe
China (total)
Million tonnes
United States & Canada Africa
f’cast
Figure 41. Oil/fat exports by major exporters (including the oil contained in seed exports)
0
5
10
15
20
252010/11 estimate
2011/12 forecast
Million tonnes
UnitedStates
IndonesiaCanada MalaysiaArgentina Brazil

Market assessments
November 2011 49
continue in Africa, Central America and Oceania. Among
developed economies, demand is forecast to increase by less
than 1 percent in the United States, keeping the level of
consumption historically low, whereas in the EU, moderate
growth could lift consumption to a new record.
Global meal production to fall short of demand As opposed to the last two seasons when global production
outpaced global consumption and allowed global inventories
to grow, total output in 2011/12 is forecast to fall short
of demand by over 2 million tonnes (expressed in protein
equivalent), or 2 percent. The deficit should mainly concern
soybean meal and, to a lesser extent, rapeseed meal.
Provided these projections materialize, a sizeable reduction
in global inventories will be required to satisfy demand.
During 2011/12, global stocks could fall to 18 million tonnes
(expressed in protein equivalents and compromising meal
inventories plus the meal contained in stored oilseeds), down
as much as 13 percent from the comfortable level reached
at the close of last season. Among major stockholding
countries, China, Brazil and the United States are
expected to experience strong reductions in stocks, be it
to satisfy internal demand (China) or to continue catering
for the export market (Brazil, United States). In all three
countries, inventories could fall by 20–25 percent. By
contrast, in Argentina, the anticipated rise in production
should be sufficient to rebuild meal inventories once
domestic industry needs and export demand are covered.
Combined, the projected rise in world consumption and the
likely drop in global inventories would cause the stock-to-use
ratio to fall to 15 percent, compared with about 18 percent
in the last two seasons. Though not as low as during the
2008 food crisis, the expected ratio seems to point towards a
progressive strengthening of international meal prices during
the current season.
Continued growth expected in global meal tradeIn 2011/12, world trade in meals/cakes is anticipated
to grow by about 4 percent, to over 72 million tonnes
(expressed in protein equivalents and including the meal
contained in oilseeds traded). Soymeal should account for
the bulk of the anticipated expansion. Increased demand for
meals will likely be satisfied primarily by countries in South
America. Thanks to a significant rise in export availabilities,
the region is expected to gain back market share lost over
the last few years. Argentina’s meal shipments could rise
to the second highest level on record, provided this season’s
anticipated increase in soybean production materializes.
Record shipments are also forecast for Brazil, despite the
likely decrease in soybean output, as releases from stocks
are expected to make up for poor production. Also in the
United States, stocks should be used to sustain exports.
Nevertheless, United States shipments are expected to fall
for the second consecutive season, reducing the country’s
share in the world market. In addition to South American
suppliers, CIS countries are expected to raise their exports,
but those increases would be less relevant at the global
level. In India, a significant increase in shipments appears
unlikely as the domestic feedstuff market is expected to
absorb most of this season’s rise in meal production. With
Figure 43. World closing stocks and stock-to-use ratio of meals/cakes (in protein equivalent and including the meal contained in seeds stored)
10
14
18
22
2011/122010/112009/102008/092007/0810
14
18
22
Million tonnes Percent
World Stocks Stock-to-use ratio
estim. f’cast
Figure 42. Global production and utilization of meals/cakes (in protein equivalent)
-8
-4
0
4
8
85
95
105
115
125
2011/122010/112009/102008/092007/08
Million tonnes Million tonnes
estim. f’cast
Balance (production minus utilization, right axis)
Production (left axis) Utilization (left axis)

Food Outlook
November 201150
regard to imports, large purchases by Asian countries,
dominated by China, are forecast to drive global import
demand. After last season’s subdued growth, China’s
purchases are forecast to rise by about 8 percent, swelling
to a record 22 million tonnes (in protein equivalent,
including the meal contained in imported oilseeds). The
Figure 45. Meal/cake exports by major exporters (in protein equivalent and including the meal contained in seed exports)
0
5
10
15
20
252010/11 estimate
2011/12 forecast
Million tonnes
UnitedStates
Canada India ParaguayArgentina Brazil
Figure 44. Meal/cake imports by region or major country (in protein equivalent and including the meal contained in seed imports)
0
5
10
15
20
25
2011/122009/102007/082005/062003/04
Latin America Asia excl. China (total) Europe
China (total)
Million tonnes
United States & Canada Africa
f’cast
forecast builds on growing demand for livestock products
and further expansion in the country’s crushing industry.
In Asian countries other than China and India, imports also
should continue to grow. Another source of global import
growth would be the EU, given the anticipated slowdown in
its domestic meal production.

Market assessments
November 2011 51
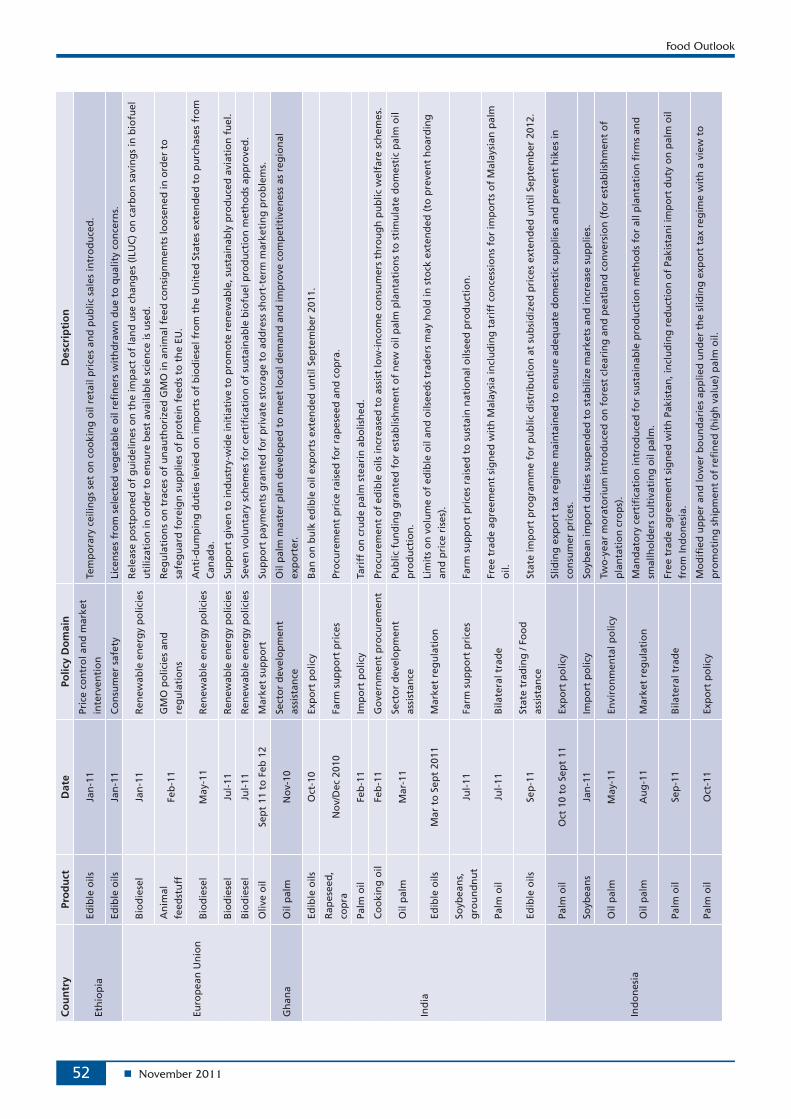
Tab
le 1
6. M
ajo
r O
ilsee
d P
olic
y D
evel
op
men
ts: O
cto
ber
201
0 to
Sep
tem
ber
201
1
Co
un
try
Pro
du
ctD
ate
Polic
y D
om
ain
Des
crip
tio
n
Alg
eria
Edib
le o
ilsD
ec-1
0Pr
ice
con
tro
lSa
les
taxe
s an
d im
po
rt t
arif
fs t
emp
ora
rily
red
uce
d, o
n f
oo
d s
tap
les
incl
ud
ing
co
oki
ng
oil,
to
ch
eck
rise
in
co
nsu
mer
pri
ces.
Arg
enti
na
Bio
die
sel
May
-11
Ren
ewab
le e
ner
gy
po
licie
sG
ove
rnm
ent-
set
reta
il p
rice
fo
r b
iod
iese
l rai
sed
to
sti
mu
late
do
mes
tic
pro
du
ctio
n a
nd
sal
es.
Au
stra
liaB
iod
iese
lA
pr-
11A
nti
-du
mp
ing
du
ties
An
ti-d
um
pin
g d
uti
es in
tro
du
ced
on
imp
ort
s o
f b
iod
iese
l fro
m t
he
Un
ited
Sta
tes.
Ban
gla
des
hSo
ybea
n o
ilD
ec-1
0Pr
ice
con
tro
lTe
mp
ora
ry p
rice
cei
ling
s n
ego
tiat
ed w
ith
pro
cess
ors
to
ch
eck
rise
in c
on
sum
er p
rice
s.
Edib
le o
ilsFe
b-1
1Im
po
rt p
olic
yIm
po
rt t
arif
f re
du
ced
to
sh
ield
co
nsu
mer
s fr
om
su
rges
in in
tern
atio
nal
pri
ces.
Bra
zil
Oil
pal
mN
ov-
10La
nd
man
agem
ent
Ru
les
intr
od
uce
d in
su
pp
ort
of
sust
ain
able
fo
rms
of
oil
pal
m e
xpan
sio
n.
Bio
die
sel
Ap
r-11
Ren
ewab
le e
ner
gy
po
licie
sIn
tro
du
ctio
n o
f m
and
ato
ry B
7 ad
mix
ture
del
ayed
to
allo
w m
ore
tim
e fo
r d
evel
op
men
t o
f d
om
esti
c fe
edst
ock
bas
e.
Can
ada
Rap
esee
d,
soyb
ean
, ca
mel
ina
seed
Jan
-11
Res
earc
h a
nd
dev
elo
pm
ent
Pub
lic f
un
din
g p
rog
ram
mes
intr
od
uce
d t
o r
aise
do
mes
tic
valu
e ad
dit
ion
an
d c
reat
e n
ew m
arke
t o
pp
ort
un
itie
s fo
r p
rom
isin
g o
ilcro
ps.
Bio
die
sel
Feb
-11
Ren
ewab
le e
ner
gy
po
licie
sN
atio
nw
ide
man
dat
ory
B2
adm
ixtu
re in
tro
du
ced
.
Rap
esee
dJu
l-11
Exp
ort
po
licy
Pub
lic f
un
ds
gra
nte
d f
or
fore
ign
mar
ket
dev
elo
pm
ent
(rap
esee
d a
nd
rap
esee
d p
rod
uct
s).
Ch
ina
Soyb
ean
sO
ct-1
0St
ate
rese
rves
Stat
e re
serv
es in
crea
sed
fo
r fu
ture
mar
ket
inte
rven
tio
ns.
Soyb
ean
oil
No
v-10
Imp
ort
po
licy
Stri
ng
ent
qu
alit
y re
qu
irem
ents
fo
r so
ybea
n o
il im
po
rts
(in
tro
du
ced
in A
pri
l 200
9) s
usp
end
ed.
Soyb
ean
s,
soym
eal,
soyb
ean
oil,
p
alm
oil
No
v-10
Pric
e co
ntr
ol
Reg
ula
tio
n o
f fu
ture
s ex
chan
ges
tig
hte
ned
to
det
er s
pec
ula
tio
n o
n c
om
mo
dit
y m
arke
ts a
nd
ch
eck
rise
in
co
nsu
mer
pri
ces.
Rap
esee
d
& r
apeo
il,
soyb
ean
s &
so
yoil
Dec
10
to S
ept
11St
ate
rese
rves
Stat
e re
serv
es r
elea
sed
to
ch
eck
rise
in c
on
sum
er p
rice
s; p
refe
ren
tial
acc
ess
to s
tate
au
ctio
ns
gra
nte
d
to m
anu
fact
ure
rs t
hat
ag
ree
to c
ap r
etai
l pri
ces;
an
d s
ub
sid
ies
gra
nte
d t
o c
rush
ers
bu
yin
g f
rom
sta
te
rese
rves
.
Bio
die
sel
Dec
-10
Ren
ewab
le e
ner
gy
po
licie
sB
iod
iese
l fro
m c
on
sum
pti
on
tax
es (
app
lied
ret
roac
tive
ly f
rom
Jan
uar
y 20
09).
Edib
le o
ilsD
ec 1
0 to
Au
g 1
1Pr
ice
con
tro
lN
ego
tiat
ed t
emp
ora
ry p
rice
fre
eze
for
coo
kin
g o
il w
ith
maj
or
reta
ilers
to
ch
eck
rise
in c
on
sum
er p
rice
s.
Rap
esee
dM
ay-1
1St
ate
rese
rves
Stat
e re
serv
es r
eco
nst
itu
ted
fo
r fu
ture
mar
ket
inte
rven
tio
ns.
Bio
die
sel
Jul-
11R
enew
able
en
erg
y p
olic
ies
Co
mp
lete
tra
de
stan
dar
d la
un
ched
fo
r re
gu
lati
on
of
bio
die
sel p
rod
uct
ion
, dis
trib
uti
on
an
d s
ales
.
Edib
le o
ilsJu
l-11
Mar
ket
reg
ula
tio
nIn
spec
tio
n o
f co
oki
ng
oil
at p
ub
lic f
oo
d o
utl
ets
intr
od
uce
d, t
o e
nfo
rce
qu
alit
y st
and
ard
s an
d d
eter
ill
egal
tra
de.
Soyb
ean
sJu
l-11
GM
O p
olic
ies
and
re
gu
lati
on
sO
ffici
al G
MO
-fre
e so
ybea
n c
ult
ivat
ion
are
a es
tab
lish
ed t
o d
isti
ng
uis
h d
om
esti
c p
rod
uct
ion
fro
m
imp
ort
ed G
MO
so
ybea
n.
CIS
(R
uss
ian
Fe
der
atio
n,
Bel
aru
s,
Kaz
akh
stan
)
Soym
eal
Jun
e to
Ju
ly 2
011
Imp
ort
po
licy
Soym
eal i
mp
ort
tar
iffs
tem
po
rari
ly s
usp
end
ed t
o c
ou
nte
r d
om
esti
c fe
ed g
rain
sh
ort
ages
.
Food Outlook
November 201152
Co
un
try
Pro
du
ctD
ate
Polic
y D
om
ain
Des
crip
tio
n
Eth
iop
iaEd
ible
oils
Jan
-11
Pric
e co
ntr
ol a
nd
mar
ket
inte
rven
tio
nTe
mp
ora
ry c
eilin
gs
set
on
co
oki
ng
oil
reta
il p
rice
s an
d p
ub
lic s
ales
intr
od
uce
d.
Edib
le o
ilsJa
n-1
1C
on
sum
er s
afet
yLi
cen
ses
fro
m s
elec
ted
veg
etab
le o
il re
fin
ers
wit
hd
raw
n d
ue
to q
ual
ity
con
cern
s.
Euro
pea
n U
nio
n
Bio
die
sel
Jan
-11
Ren
ewab
le e
ner
gy
po
licie
sR
elea
se p
ost
po
ned
of
gu
idel
ines
on
th
e im
pac
t o
f la
nd
use
ch
ang
es (
ILU
C)
on
car
bo
n s
avin
gs
in b
iofu
el
uti
lizat
ion
in o
rder
to
en
sure
bes
t av
aila
ble
sci
ence
is u
sed
.
An
imal
fe
edst
uff
Feb
-11
GM
O p
olic
ies
and
re
gu
lati
on
sR
egu
lati
on
s o
n t
race
s o
f u
nau
tho
rize
d G
MO
in a
nim
al f
eed
co
nsi
gn
men
ts lo
ose
ned
in o
rder
to
sa
feg
uar
d f
ore
ign
su
pp
lies
of
pro
tein
fee
ds
to t
he
EU.
Bio
die
sel
May
-11
Ren
ewab
le e
ner
gy
po
licie
sA
nti
-du
mp
ing
du
ties
levi
ed o
n im
po
rts
of
bio
die
sel f
rom
th
e U
nit
ed S
tate
s ex
ten
ded
to
pu
rch
ases
fro
m
Can
ada.
Bio
die
sel
Jul-
11R
enew
able
en
erg
y p
olic
ies
Sup
po
rt g
iven
to
ind
ust
ry-w
ide
init
iati
ve t
o p
rom
ote
ren
ewab
le, s
ust
ain
ably
pro
du
ced
avi
atio
n f
uel
.
Bio
die
sel
Jul-
11R
enew
able
en
erg
y p
olic
ies
Seve
n v
olu
nta
ry s
chem
es f
or
cert
ifica
tio
n o
f su
stai
nab
le b
iofu
el p
rod
uct
ion
met
ho
ds
app
rove
d.
Oliv
e o
ilSe
pt
11 t
o F
eb 1
2M
arke
t su
pp
ort
Sup
po
rt p
aym
ents
gra
nte
d f
or
pri
vate
sto
rag
e to
ad
dre
ss s
ho
rt-t
erm
mar
keti
ng
pro
ble
ms.
Gh
ana
Oil
pal
mN
ov-
10Se
cto
r d
evel
op
men
t as
sist
ance
Oil
pal
m m
aste
r p
lan
dev
elo
ped
to
mee
t lo
cal d
eman
d a
nd
imp
rove
co
mp
etit
iven
ess
as r
egio
nal
ex
po
rter
.
Ind
ia
Edib
le o
ilsO
ct-1
0Ex
po
rt p
olic
yB
an o
n b
ulk
ed
ible
oil
exp
ort
s ex
ten
ded
un
til S
epte
mb
er 2
011.
Rap
esee
d,
cop
raN
ov/
Dec
201
0Fa
rm s
up
po
rt p
rice
sPr
ocu
rem
ent
pri
ce r
aise
d f
or
rap
esee
d a
nd
co
pra
.
Palm
oil
Feb
-11
Imp
ort
po
licy
Tari
ff o
n c
rud
e p
alm
ste
arin
ab
olis
hed
.
Co
oki
ng
oil
Feb
-11
Go
vern
men
t p
rocu
rem
ent
Pro
cure
men
t o
f ed
ible
oils
incr
ease
d t
o a
ssis
t lo
w-i
nco
me
con
sum
ers
thro
ug
h p
ub
lic w
elfa
re s
chem
es.
Oil
pal
mM
ar-1
1Se
cto
r d
evel
op
men
t as
sist
ance
Pub
lic f
un
din
g g
ran
ted
fo
r es
tab
lish
men
t o
f n
ew o
il p
alm
pla
nta
tio
ns
to s
tim
ula
te d
om
esti
c p
alm
oil
pro
du
ctio
n.
Edib
le o
ilsM
ar t
o S
ept
2011
Mar
ket
reg
ula
tio
nLi
mit
s o
n v
olu
me
of
edib
le o
il an
d o
ilsee
ds
trad
ers
may
ho
ld in
sto
ck e
xten
ded
(to
pre
ven
t h
oar
din
g
and
pri
ce r
ises
).
Soyb
ean
s,
gro
un
dn
ut
Jul-
11Fa
rm s
up
po
rt p
rice
sFa
rm s
up
po
rt p
rice
s ra
ised
to
su
stai
n n
atio
nal
oils
eed
pro
du
ctio
n.
Palm
oil
Jul-
11B
ilate
ral t
rad
eFr
ee t
rad
e ag
reem
ent
sig
ned
wit
h M
alay
sia
incl
ud
ing
tar
iff
con
cess
ion
s fo
r im
po
rts
of
Mal
aysi
an p
alm
o
il.
Edib
le o
ilsSe
p-1
1St
ate
trad
ing
/ Fo
od
as
sist
ance
Stat
e im
po
rt p
rog
ram
me
for
pu
blic
dis
trib
uti
on
at
sub
sid
ized
pri
ces
exte
nd
ed u
nti
l Sep
tem
ber
201
2.
Ind
on
esia
Palm
oil
Oct
10
to S
ept
11Ex
po
rt p
olic
ySl
idin
g e
xpo
rt t
ax r
egim
e m
ain
tain
ed t
o e
nsu
re a
deq
uat
e d
om
esti
c su
pp
lies
and
pre
ven
t h
ikes
in
con
sum
er p
rice
s.
Soyb
ean
sJa
n-1
1Im
po
rt p
olic
ySo
ybea
n im
po
rt d
uti
es s
usp
end
ed t
o s
tab
ilize
mar
kets
an
d in
crea
se s
up
plie
s.
Oil
pal
mM
ay-1
1En
viro
nm
enta
l po
licy
Two
-yea
r m
ora
tori
um
intr
od
uce
d o
n f
ore
st c
lear
ing
an
d p
eatl
and
co
nve
rsio
n (
for
esta
blis
hm
ent
of
pla
nta
tio
n c
rop
s).
Oil
pal
mA
ug
-11
Mar
ket
reg
ula
tio
nM
and
ato
ry c
erti
fica
tio
n in
tro
du
ced
fo
r su
stai
nab
le p
rod
uct
ion
met
ho
ds
for
all p
lan
tati
on
firm
s an
d
smal
lho
lder
s cu
ltiv
atin
g o
il p
alm
.
Palm
oil
Sep
-11
Bila
tera
l tra
de
Free
tra
de
agre
emen
t si
gn
ed w
ith
Pak
ista
n, i
ncl
ud
ing
red
uct
ion
of
Paki
stan
i im
po
rt d
uty
on
pal
m o
il fr
om
Ind
on
esia
.
Palm
oil
Oct
-11
Exp
ort
po
licy
Mo
difi
ed u
pp
er a
nd
low
er b
ou
nd
arie
s ap
plie
d u
nd
er t
he
slid
ing
exp
ort
tax
reg
ime
wit
h a
vie
w t
o
pro
mo
tin
g s
hip
men
t o
f re
fin
ed (
hig
h v
alu
e) p
alm
oil.

Market assessments
n November 2011 53
co
un
try
Pro
du
ctd
ate
Polic
y d
om
ain
des
crip
tio
n
Jap
anEd
ible
oils
&
fats
Jan
-11
Hea
lth
po
licy
Mo
ved
to
vo
lun
tary
dis
clo
sure
of
leve
ls o
f tr
ans
fatt
y ac
ids
in f
oo
d p
rod
uct
s to
red
uce
ris
k o
f ca
rdio
vasc
ula
r d
isea
ses.
Kaz
akh
stan
All
maj
or
oils
eed
s an
d
thei
r o
ilsO
ct 1
0 to
Mar
11
Exp
ort
po
licy
Tem
po
rary
exp
ort
ban
ap
plie
d.
Lib
eria
Oil
pal
mJa
n-1
1Se
cto
r d
evel
op
men
t as
sist
ance
Co
nce
ssio
ns
gra
nte
d t
o f
ore
ign
inve
sto
rs f
or
esta
blis
hm
ent
of
larg
e-sc
ale
oil
pal
m p
lan
tati
on
s.
Lib
yaEd
ible
oils
Feb
-11
Imp
ort
po
licy
/ Mar
ket
reg
ula
tio
nC
ust
om
du
ties
an
d d
om
esti
c sa
les
taxe
s su
spen
ded
on
ed
ible
oils
to
ch
eck
rise
in c
on
sum
er p
rice
s.
Mal
aysi
a
Oil
pal
mJa
n-1
1Se
cto
r d
evel
op
men
t as
sist
ance
New
oil
pal
m r
epla
nti
ng
sch
eme
lau
nch
ed t
o r
aise
pro
du
ctiv
ity
in o
il p
alm
cu
ltiv
atio
n, i
ncl
ud
ing
m
easu
res
spec
ifica
lly g
eare
d t
ow
ard
sm
allh
old
ers.
Palm
oil
Jan
-11
Mar
ket
reg
ula
tio
n /
Foo
d
assi
stan
ceEd
ible
oil
pro
du
cers
ord
ered
to
rai
se s
ales
of
pal
m o
il at
su
bsi
diz
ed p
rice
s to
pre
ven
t ar
tifi
cial
sh
ort
ages
o
n d
om
esti
c m
arke
t.
Palm
oil
Jan
-11
Bila
tera
l tra
de
Free
Tra
de
Ag
reem
ent
wit
h In
dia
in f
orc
e, in
clu
din
g r
edu
ctio
n o
f In
dia
n im
po
rt d
uti
es o
n M
alay
sian
p
alm
oil.
Palm
oil
Mar
-11
Ren
ewab
le e
ner
gy
po
licie
sPh
ased
intr
od
uct
ion
of
man
dat
ory
B5
adm
ixtu
re in
itia
ted
, acc
om
pan
ied
by
tax
exem
pti
on
an
d v
aria
ble
su
bsi
dy.
Palm
oil
Jun
-11
Ren
ewab
le e
ner
gy
po
licie
sPu
blic
fu
nd
s al
loca
ted
to
pet
rol c
om
pan
ies
for
inve
stm
ent
in in
fras
tru
ctu
re f
or
bio
die
sel b
len
din
g.
Palm
oil
Sep
-11
Envi
ron
men
tal p
olic
yPu
blic
-pri
vate
par
tner
ship
s p
rom
ote
d f
or
was
te p
rod
uct
rec
yclin
g in
th
e p
alm
oil
mill
ing
pro
cess
.
Mo
zam
biq
ue
Bio
die
sel
Jul-
11R
enew
able
en
erg
y p
olic
ies
Reg
ula
tio
n m
and
atin
g n
atio
nw
ide
B3
adm
ixtu
re b
y 20
12 p
asse
d in
to la
w.
Paki
stan
Rap
esee
dN
ov-
10Em
erg
ency
ass
ista
nce
Co
nce
ssio
nal
an
d in
tere
st-f
ree
loan
s o
ffer
ed t
o h
elp
far
mer
s re
cove
r fr
om
imp
act
of
flo
od
s.
Sun
flo
wer
Jan
-11
Farm
er s
up
po
rtN
ego
tiat
ion
s co
nd
uct
ed w
ith
th
e p
riva
te s
ecto
r co
nce
rnin
g r
ises
in t
he
farm
-gat
e p
rice
(to
sti
mu
late
d
om
esti
c p
rod
uct
ion
).
Edib
le o
ilsJu
l-11
Mar
ket
reg
ula
tio
n /
Co
mp
etit
ion
po
licy
Nat
ion
al a
sso
ciat
ion
of
coo
kin
g o
il m
anu
fact
ure
rs f
orb
idd
en t
o c
oo
rdin
ate
cost
ing
an
d p
rici
ng
ac
tivi
ties
.
Palm
oil
Sep
-11
Bila
tera
l tra
de
Free
tra
de
agre
emen
t si
gn
ed w
ith
Ind
on
esia
, in
clu
din
g t
arif
f co
nce
ssio
ns
on
pal
m o
il im
po
rts
fro
m
Ind
on
esia
.
Phili
pp
ines
Co
con
ut
Jan
-11
Sect
or
dev
elo
pm
ent
assi
stan
ceSi
x-ye
ar p
rog
ram
me
pre
sen
ted
, to
rai
se p
rod
uct
ivit
y in
co
con
ut
cult
ivat
ion
.
Sou
th K
ore
aSo
ybea
ns
Feb
-11
Stat
e re
serv
esIn
clu
sio
n o
f so
ybea
ns
in p
ub
lic r
eser
ves
ann
ou
nce
d, t
o s
tab
ilize
do
mes
tic
sup
plie
s.
Soyb
ean
sM
ar t
o D
ec 2
011
Imp
ort
po
licy
Imp
ort
tar
iff
tem
po
rari
ly r
edu
ced
.
Sri L
anka
Edib
le o
ilsN
ov-
10Im
po
rt p
olic
yTa
xes
app
lied
on
pal
m a
nd
co
con
ut
oil
imp
ort
s re
du
ced
to
ch
eck
surg
e in
co
nsu
mer
pri
ces.
Co
con
ut
Jan
-11
Sect
or
dev
elo
pm
ent
assi
stan
ceC
hem
ical
fer
tiliz
ers
off
ered
to
pro
du
cers
at
sub
sid
ized
pri
ces
to r
aise
co
con
ut
pro
du
ctio
n.
Tan
zan
iaEd
ible
oils
Mar
-11
Sect
or
dev
elo
pm
ent
assi
stan
ceM
anu
fact
ure
rs u
sin
g h
om
e-g
row
n o
ilsee
ds
exem
pte
d f
rom
pay
ing
VA
T to
sti
mu
late
dem
and
fo
r lo
cal
oils
eed
s.
co
un
try
Pro
du
ctd
ate
Polic
y d
om
ain
des
crip
tio
n
Eth
iop
iaEd
ible
oils
Jan
-11
Pric
e co
ntr
ol a
nd
mar
ket
inte
rven
tio
nTe
mp
ora
ry c
eilin
gs
set
on
co
oki
ng
oil
reta
il p
rice
s an
d p
ub
lic s
ales
intr
od
uce
d.
Edib
le o
ilsJa
n-1
1C
on
sum
er s
afet
yLi
cen
ses
fro
m s
elec
ted
veg
etab
le o
il re
fin
ers
wit
hd
raw
n d
ue
to q
ual
ity
con
cern
s.
Euro
pea
n U
nio
n
Bio
die
sel
Jan
-11
Ren
ewab
le e
ner
gy
po
licie
sR
elea
se p
ost
po
ned
of
gu
idel
ines
on
th
e im
pac
t o
f la
nd
use
ch
ang
es (
ILU
C)
on
car
bo
n s
avin
gs
in b
iofu
el
uti
lizat
ion
in o
rder
to
en
sure
bes
t av
aila
ble
sci
ence
is u
sed
.
An
imal
fe
edst
uff
Feb
-11
GM
O p
olic
ies
and
re
gu
lati
on
sR
egu
lati
on
s o
n t
race
s o
f u
nau
tho
rize
d G
MO
in a
nim
al f
eed
co
nsi
gn
men
ts lo
ose
ned
in o
rder
to
sa
feg
uar
d f
ore
ign
su
pp
lies
of
pro
tein
fee
ds
to t
he
EU.
Bio
die
sel
May
-11
Ren
ewab
le e
ner
gy
po
licie
sA
nti
-du
mp
ing
du
ties
levi
ed o
n im
po
rts
of
bio
die
sel f
rom
th
e U
nit
ed S
tate
s ex
ten
ded
to
pu
rch
ases
fro
m
Can
ada.
Bio
die
sel
Jul-
11R
enew
able
en
erg
y p
olic
ies
Sup
po
rt g
iven
to
ind
ust
ry-w
ide
init
iati
ve t
o p
rom
ote
ren
ewab
le, s
ust
ain
ably
pro
du
ced
avi
atio
n f
uel
.
Bio
die
sel
Jul-
11R
enew
able
en
erg
y p
olic
ies
Seve
n v
olu
nta
ry s
chem
es f
or
cert
ifica
tio
n o
f su
stai
nab
le b
iofu
el p
rod
uct
ion
met
ho
ds
app
rove
d.
Oliv
e o
ilSe
pt
11 t
o F
eb 1
2M
arke
t su
pp
ort
Sup
po
rt p
aym
ents
gra
nte
d f
or
pri
vate
sto
rag
e to
ad
dre
ss s
ho
rt-t
erm
mar
keti
ng
pro
ble
ms.
Gh
ana
Oil
pal
mN
ov-
10Se
cto
r d
evel
op
men
t as
sist
ance
Oil
pal
m m
aste
r p
lan
dev
elo
ped
to
mee
t lo
cal d
eman
d a
nd
imp
rove
co
mp
etit
iven
ess
as r
egio
nal
ex
po
rter
.
Ind
ia
Edib
le o
ilsO
ct-1
0Ex
po
rt p
olic
yB
an o
n b
ulk
ed
ible
oil
exp
ort
s ex
ten
ded
un
til S
epte
mb
er 2
011.
Rap
esee
d,
cop
raN
ov/
Dec
201
0Fa
rm s
up
po
rt p
rice
sPr
ocu
rem
ent
pri
ce r
aise
d f
or
rap
esee
d a
nd
co
pra
.
Palm
oil
Feb
-11
Imp
ort
po
licy
Tari
ff o
n c
rud
e p
alm
ste
arin
ab
olis
hed
.
Co
oki
ng
oil
Feb
-11
Go
vern
men
t p
rocu
rem
ent
Pro
cure
men
t o
f ed
ible
oils
incr
ease
d t
o a
ssis
t lo
w-i
nco
me
con
sum
ers
thro
ug
h p
ub
lic w
elfa
re s
chem
es.
Oil
pal
mM
ar-1
1Se
cto
r d
evel
op
men
t as
sist
ance
Pub
lic f
un
din
g g
ran
ted
fo
r es
tab
lish
men
t o
f n
ew o
il p
alm
pla
nta
tio
ns
to s
tim
ula
te d
om
esti
c p
alm
oil
pro
du
ctio
n.
Edib
le o
ilsM
ar t
o S
ept
2011
Mar
ket
reg
ula
tio
nLi
mit
s o
n v
olu
me
of
edib
le o
il an
d o
ilsee
ds
trad
ers
may
ho
ld in
sto
ck e
xten
ded
(to
pre
ven
t h
oar
din
g
and
pri
ce r
ises
).
Soyb
ean
s,
gro
un
dn
ut
Jul-
11Fa
rm s
up
po
rt p
rice
sFa
rm s
up
po
rt p
rice
s ra
ised
to
su
stai
n n
atio
nal
oils
eed
pro
du
ctio
n.
Palm
oil
Jul-
11B
ilate
ral t
rad
eFr
ee t
rad
e ag
reem
ent
sig
ned
wit
h M
alay
sia
incl
ud
ing
tar
iff
con
cess
ion
s fo
r im
po
rts
of
Mal
aysi
an p
alm
o
il.
Edib
le o
ilsSe
p-1
1St
ate
trad
ing
/ Fo
od
as
sist
ance
Stat
e im
po
rt p
rog
ram
me
for
pu
blic
dis
trib
uti
on
at
sub
sid
ized
pri
ces
exte
nd
ed u
nti
l Sep
tem
ber
201
2.
Ind
on
esia
Palm
oil
Oct
10
to S
ept
11Ex
po
rt p
olic
ySl
idin
g e
xpo
rt t
ax r
egim
e m
ain
tain
ed t
o e
nsu
re a
deq
uat
e d
om
esti
c su
pp
lies
and
pre
ven
t h
ikes
in
con
sum
er p
rice
s.
Soyb
ean
sJa
n-1
1Im
po
rt p
olic
ySo
ybea
n im
po
rt d
uti
es s
usp
end
ed t
o s
tab
ilize
mar
kets
an
d in
crea
se s
up
plie
s.
Oil
pal
mM
ay-1
1En
viro
nm
enta
l po
licy
Two
-yea
r m
ora
tori
um
intr
od
uce
d o
n f
ore
st c
lear
ing
an
d p
eatl
and
co
nve
rsio
n (
for
esta
blis
hm
ent
of
pla
nta
tio
n c
rop
s).
Oil
pal
mA
ug
-11
Mar
ket
reg
ula
tio
nM
and
ato
ry c
erti
fica
tio
n in
tro
du
ced
fo
r su
stai
nab
le p
rod
uct
ion
met
ho
ds
for
all p
lan
tati
on
firm
s an
d
smal
lho
lder
s cu
ltiv
atin
g o
il p
alm
.
Palm
oil
Sep
-11
Bila
tera
l tra
de
Free
tra
de
agre
emen
t si
gn
ed w
ith
Pak
ista
n, i
ncl
ud
ing
red
uct
ion
of
Paki
stan
i im
po
rt d
uty
on
pal
m o
il fr
om
Ind
on
esia
.
Palm
oil
Oct
-11
Exp
ort
po
licy
Mo
difi
ed u
pp
er a
nd
low
er b
ou
nd
arie
s ap
plie
d u
nd
er t
he
slid
ing
exp
ort
tax
reg
ime
wit
h a
vie
w t
o
pro
mo
tin
g s
hip
men
t o
f re
fin
ed (
hig
h v
alu
e) p
alm
oil.
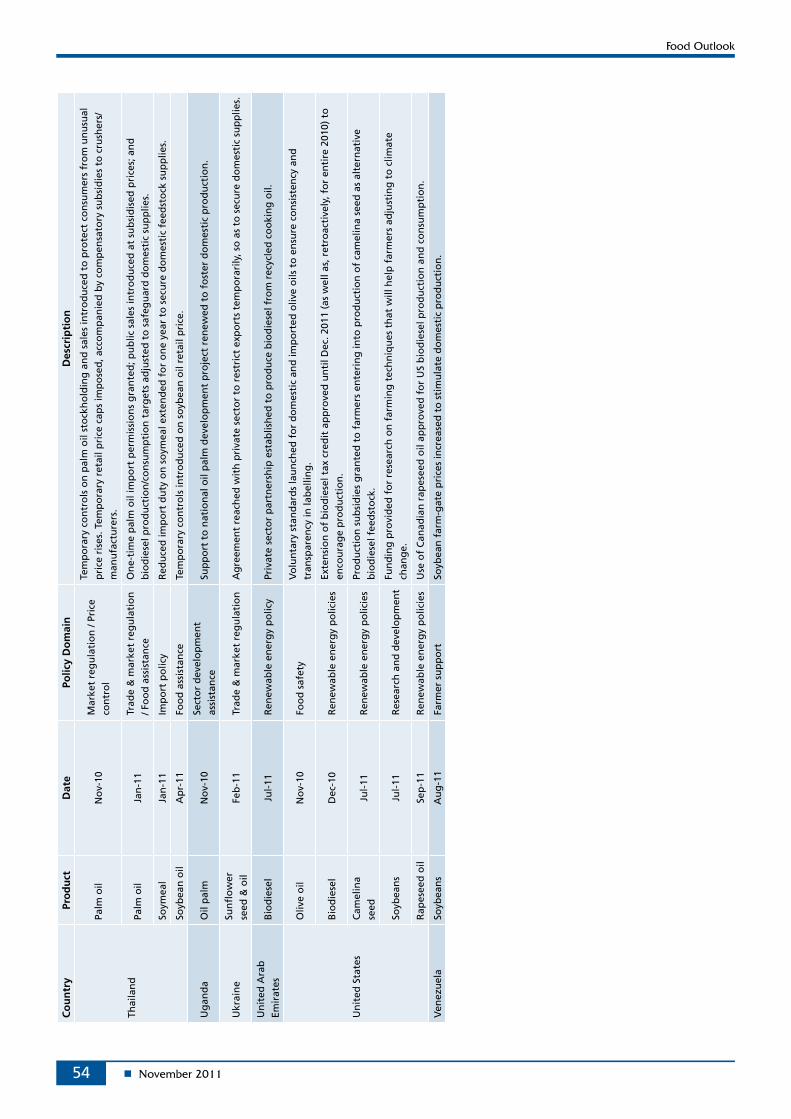
Food Outlook
n November 201154
co
un
try
Pro
du
ctd
ate
Polic
y d
om
ain
des
crip
tio
n
Thai
lan
d
Palm
oil
No
v-10
Mar
ket
reg
ula
tio
n /
Pric
e co
ntr
ol
Tem
po
rary
co
ntr
ols
on
pal
m o
il st
ock
ho
ldin
g a
nd
sal
es in
tro
du
ced
to
pro
tect
co
nsu
mer
s fr
om
un
usu
al
pri
ce r
ises
. Tem
po
rary
ret
ail p
rice
cap
s im
po
sed
, acc
om
pan
ied
by
com
pen
sato
ry s
ub
sid
ies
to c
rush
ers/
man
ufa
ctu
rers
.
Palm
oil
Jan
-11
Trad
e &
mar
ket
reg
ula
tio
n
/ Fo
od
ass
ista
nce
On
e-ti
me
pal
m o
il im
po
rt p
erm
issi
on
s g
ran
ted
; pu
blic
sal
es in
tro
du
ced
at
sub
sid
ised
pri
ces;
an
d
bio
die
sel p
rod
uct
ion
/co
nsu
mp
tio
n t
arg
ets
adju
sted
to
saf
egu
ard
do
mes
tic
sup
plie
s.
Soym
eal
Jan
-11
Imp
ort
po
licy
Red
uce
d im
po
rt d
uty
on
so
ymea
l ext
end
ed f
or
on
e ye
ar t
o s
ecu
re d
om
esti
c fe
edst
ock
su
pp
lies.
Soyb
ean
oil
Ap
r-11
Foo
d a
ssis
tan
ceTe
mp
ora
ry c
on
tro
ls in
tro
du
ced
on
so
ybea
n o
il re
tail
pri
ce.
Ug
and
aO
il p
alm
No
v-10
Sect
or
dev
elo
pm
ent
assi
stan
ceSu
pp
ort
to
nat
ion
al o
il p
alm
dev
elo
pm
ent
pro
ject
ren
ewed
to
fo
ster
do
mes
tic
pro
du
ctio
n.
Ukr
ain
eSu
nfl
ow
er
seed
& o
ilFe
b-1
1Tr
ade
& m
arke
t re
gu
lati
on
Ag
reem
ent
reac
hed
wit
h p
riva
te s
ecto
r to
res
tric
t ex
po
rts
tem
po
rari
ly, s
o a
s to
sec
ure
do
mes
tic
sup
plie
s.
Un
ited
Ara
b
Emir
ates
Bio
die
sel
Jul-
11R
enew
able
en
erg
y p
olic
yPr
ivat
e se
cto
r p
artn
ersh
ip e
stab
lish
ed t
o p
rod
uce
bio
die
sel f
rom
rec
ycle
d c
oo
kin
g o
il.
Un
ited
Sta
tes
Oliv
e o
ilN
ov-
10Fo
od
saf
ety
Vo
lun
tary
sta
nd
ard
s la
un
ched
fo
r d
om
esti
c an
d im
po
rted
oliv
e o
ils t
o e
nsu
re c
on
sist
ency
an
d
tran
spar
ency
in la
bel
ling
.
Bio
die
sel
Dec
-10
Ren
ewab
le e
ner
gy
po
licie
sEx
ten
sio
n o
f b
iod
iese
l tax
cre
dit
ap
pro
ved
un
til D
ec. 2
011
(as
wel
l as,
ret
roac
tive
ly, f
or
enti
re 2
010)
to
en
cou
rag
e p
rod
uct
ion
.
Cam
elin
a se
edJu
l-11
Ren
ewab
le e
ner
gy
po
licie
sPr
od
uct
ion
su
bsi
die
s g
ran
ted
to
far
mer
s en
teri
ng
into
pro
du
ctio
n o
f ca
mel
ina
seed
as
alte
rnat
ive
bio
die
sel f
eed
sto
ck.
Soyb
ean
sJu
l-11
Res
earc
h a
nd
dev
elo
pm
ent
Fun
din
g p
rovi
ded
fo
r re
sear
ch o
n f
arm
ing
tec
hn
iqu
es t
hat
will
hel
p f
arm
ers
adju
stin
g t
o c
limat
e ch
ang
e.
Rap
esee
d o
ilSe
p-1
1R
enew
able
en
erg
y p
olic
ies
Use
of
Can
adia
n r
apes
eed
oil
app
rove
d f
or
US
bio
die
sel p
rod
uct
ion
an
d c
on
sum
pti
on
.
Ven
ezu
ela
Soyb
ean
sA
ug
-11
Farm
er s
up
po
rtSo
ybea
n f
arm
-gat
e p
rice
s in
crea
sed
to
sti
mu
late
do
mes
tic
pro
du
ctio
n.

Statistical appendix
November 2011 107
Table A10. Total oilcrops statistics (million tonnes)
Production1 Imports Exports
07/08-09/10 2010/11 2011/12
07/08-09/102010/11 2011/12
07/08-09/10 2010/11 2011/12
average average average estim. f’cast estim. f’cast estim. f’cast
ASIA 124.7 130.3 133.6 67.1 76.7 82.1 2.3 2.0 2.0China 57.5 59.7 59.3 47.8 56.7 61.3 1.3 0.9 0.9 of which Taiwan Prov. 0.1 0.1 0.1 2.3 2.4 2.5 - - - India 35.3 37.5 39.4 0.2 0.2 0.4 0.5 0.5 0.5 Indonesia 8.4 9.3 9.9 1.7 2.1 2.1 0.1 0.1 0.1 Iran, Islamic Republic of 0.7 0.7 0.9 0.8 0.8 0.8 - - - Japan 0.3 0.3 0.2 6.2 5.8 5.9 - - - Korea, Republic of 0.2 0.2 0.2 1.4 1.5 1.6 - - - Malaysia 4.6 4.8 4.9 0.7 0.7 0.7 - - - Pakistan 4.8 4.7 5.1 1.1 1.0 1.2 - 0.1 - Thailand 0.7 0.8 0.8 1.7 2.2 2.1 - - - Turkey 2.1 2.6 2.6 2.1 2.2 2.6 - 0.1 0.1
AFRICA 16.6 17.4 17.9 2.7 3.2 3.0 0.8 0.8 1.1Nigeria 4.7 4.7 4.9 - - - 0.2 0.2 0.2
CENTRAL AMERICA 1.2 1.3 1.2 5.9 5.9 6.0 0.1 0.2 0.2 Mexico 0.7 0.8 0.7 5.2 5.3 5.3 - - -
SOUTH AMERICA 124.7 147.5 149.6 2.7 1.1 1.0 45.3 48.0 54.2Argentina 48.8 54.1 58.0 1.5 0.1 - 11.3 9.6 11.3 Brazil 64.9 79.3 77.3 0.1 - - 28.0 31.1 34.5 Paraguay 6.5 8.7 8.7 - - - 4.5 5.4 6.4
NORTH AMERICA 106.8 119.2 110.2 2.1 1.9 1.9 46.8 52.2 49.5Canada 16.1 18.4 18.0 0.7 0.7 0.5 10.0 10.9 10.7 United States of America 90.7 100.9 92.2 1.4 1.3 1.4 36.8 41.3 38.8
EUROPE 46.9 50.1 55.0 19.6 19.7 20.3 3.6 3.7 5.2 European Union 27.5 29.0 28.7 18.1 17.9 18.7 0.8 0.8 0.8 Russian Federation 8.0 7.5 11.6 0.9 1.3 1.0 0.3 0.1 0.9 Ukraine 9.3 11.6 12.5 - - - 2.4 2.5 3.2
OCEANIA 2.6 4.1 4.6 0.1 0.1 0.1 1.1 1.8 2.2 Australia 2.2 3.7 4.2 0.1 0.1 0.1 1.0 1.8 2.1
WORLD 423.4 469.9 472.0 100.2 108.7 114.3 100.1 108.8 114.3 Developing countries 262.0 291.0 296.6 71.2 80.3 85.2 48.4 51.0 57.0 Developed countries 161.4 178.9 175.4 29.0 28.4 29.1 51.7 57.8 57.3 LIFDCs 128.7 133.8 137.6 52.0 61.3 66.0 2.9 2.7 2.7 LDCs 10.2 10.6 10.9 0.3 0.3 0.3 0.4 0.5 0.5
1 The split years bring together northern hemisphere annual crops harvested in the latter part of the first year shown, with southern hemisphere annual crops harvested in the early part of the second year shown; for tree crops which are produced throughout the year, calendar year production for the second year shown is used.

Food Outlook
November 2011108
Table A11. Total oils and fats statistics 1 (million tonnes)
Imports Exports Utilization
07/08-09/10 2010/11 2011/12
07/08-09/102010/11 2011/12
07/08-09/10 2010/11 2011/12
average average average estim. f’cast estim. f’cast estim. f’cast
ASIA 34.6 37.4 38.7 39.7 42.6 44.3 79.9 87.4 92.9Bangladesh 1.2 1.4 1.4 - - - 1.5 1.6 1.6 China 10.8 10.6 11.4 0.7 0.8 0.7 30.1 33.0 35.7 of which Taiwan Prov. 0.4 0.5 0.5 - - - 0.9 0.9 0.9 India 8.0 8.7 9.1 0.5 0.4 0.4 17.4 18.7 19.5 Indonesia 0.1 0.1 0.1 17.9 19.8 21.0 5.7 6.9 7.8 Iran 1.2 1.6 1.5 0.1 0.2 0.1 1.6 1.8 1.9 Japan 1.1 1.2 1.2 - - - 3.1 3.1 3.1 Korea, Republic of 0.9 0.9 0.9 - - - 1.2 1.3 1.3 Malaysia 1.5 2.2 2.1 17.2 18.5 19.1 3.8 3.8 4.0 Pakistan 2.1 2.4 2.4 0.1 0.1 0.1 3.6 4.0 4.0 Philippines 0.5 0.5 0.5 1.1 1.0 1.1 1.0 1.1 1.1 Singapore 0.6 0.8 0.9 0.3 0.3 0.3 0.3 0.5 0.7 Turkey 1.2 1.2 1.4 0.3 0.3 0.3 2.3 2.5 2.7
AFRICA 7.4 7.8 8.0 1.2 1.3 1.3 13.0 13.8 14.1Algeria 0.6 0.5 0.6 0.1 - - 0.7 0.7 0.7 Egypt 1.6 1.5 1.7 0.1 - 0.1 2.0 2.1 2.1 Nigeria 0.8 1.1 1.1 0.1 0.1 0.1 2.5 2.8 2.9 South Africa 0.7 0.8 0.8 0.1 0.1 0.1 1.1 1.2 1.2
CENTRAL AMERICA 2.3 2.4 2.4 0.6 0.6 0.6 4.5 4.7 4.6 Mexico 1.2 1.2 1.2 0.1 0.1 0.1 2.9 3.0 3.0
SOUTH AMERICA 2.3 2.5 2.6 9.7 9.2 9.3 12.3 14.5 15.6Argentina 0.1 0.1 0.1 6.2 6.1 6.1 2.2 3.0 3.3Brazil 0.4 0.5 0.6 2.1 1.8 1.9 6.5 7.4 8.2
NORTH AMERICA 4.0 4.4 4.6 6.1 6.9 6.5 17.3 18.0 18.9Canada 0.5 0.6 0.5 2.3 3.1 3.2 0.9 0.8 1.0 United States of America 3.5 3.8 4.1 3.8 3.8 3.4 16.4 17.2 17.9
EUROPE 13.4 13.0 13.6 5.4 5.7 6.6 34.9 35.8 36.4 European Union 10.8 10.3 10.9 2.1 2.1 2.1 29.2 29.7 30.0 Russian Federation 1.2 1.2 1.2 0.8 0.4 1.3 3.6 3.7 3.8 Ukraine 0.5 0.5 0.5 2.2 2.8 2.8 0.9 0.9 1.2
OCEANIA 0.5 0.6 0.6 1.7 1.8 1.9 1.0 1.1 1.1 Australia 0.4 0.4 0.4 0.6 0.7 0.7 0.7 0.7 0.7
WORLD 64.5 68.0 70.4 64.5 68.0 70.4 163.0 175.3 183.8 Developing countries 44.4 47.7 49.4 51.8 54.2 56.1 104.6 115.2 122.1 Developed countries 20.1 20.3 21.0 12.7 13.8 14.4 58.3 60.0 61.7 LIFDCs 30.3 31.7 33.2 22.1 23.9 25.0 72.9 79.7 84.5 LDCs 4.2 4.6 4.6 0.4 0.5 0.4 7.1 7.6 7.7
1 Includes oils and fats of vegetable, marine and animal origin.

Statistical appendix
November 2011 109
Table A12. Total meals and cakes statistics1 (million tonnes)
Imports Exports Utilization
07/08-09/10 2010/11 2011/12
07/08-09/102010/11 2011/12
07/08-09/10 2010/11 2011/12
average average average estim. f’cast estim. f’cast estim. f’cast
ASIA 25.8 30.0 31.0 13.7 14.7 15.0 106.7 125.7 133.6China 3.0 4.0 4.2 1.6 0.9 0.8 54.6 69.6 75.1 of which Taiwan Prov. 0.5 0.5 0.5 - - - 2.3 2.4 2.4 India 0.1 0.2 0.1 5.1 5.9 6.2 11.4 12.2 13.1 Indonesia 2.7 3.1 3.4 2.8 3.3 3.3 3.0 3.3 3.8 Japan 2.5 2.9 2.9 - - - 7.1 7.1 7.1 Korea, Republic of 3.5 3.3 3.4 - - - 4.6 4.4 4.5 Malaysia 1.0 1.1 1.2 2.3 2.4 2.5 1.8 1.9 2.0 Pakistan 0.5 0.6 0.6 0.1 0.2 0.1 2.8 3.1 3.1 Philippines 1.7 1.9 2.1 0.5 0.5 0.6 2.3 2.4 2.6 Saudi Arabia 0.5 0.5 0.5 - - - 0.6 0.5 0.5 Thailand 2.7 2.8 2.9 0.1 0.1 0.1 4.5 5.0 5.3 Turkey 0.9 1.1 1.1 - 0.1 0.1 3.1 3.5 3.7 Viet Nam 2.8 3.5 3.6 0.1 0.1 0.1 2.9 3.8 4.1
AFRICA 3.6 3.9 4.3 0.9 0.9 0.9 9.5 10.5 10.7Egypt 0.5 0.6 0.7 - - - 1.8 2.2 2.3 South Africa 1.1 1.1 1.2 0.1 0.1 0.1 1.8 1.9 1.9
CENTRAL AMERICA 3.4 3.3 3.3 0.2 0.2 0.2 8.0 8.0 8.0 Mexico 1.8 1.8 1.9 0.1 0.1 0.1 6.0 5.9 6.0
SOUTH AMERICA 4.4 4.5 4.6 42.7 46.4 48.4 23.2 23.6 25.8Argentina - - - 26.1 28.5 29.5 3.3 2.4 3.1 Bolivia - - - 1.1 1.2 1.3 0.2 0.4 0.4 Brazil 0.3 0.2 0.1 12.5 14.1 14.7 14.0 14.6 15.9 Chile 0.9 1.0 0.9 0.5 0.4 0.4 1.3 1.3 1.4 Paraguay - - - 0.8 0.8 1.0 0.4 0.5 0.5 Peru 0.7 0.8 0.9 1.4 1.1 1.3 0.9 1.1 1.2 Venezuela 1.2 1.1 1.1 - - - 1.3 1.3 1.3
NORTH AMERICA 3.2 3.5 3.4 11.8 12.3 12.0 34.3 33.5 34.1Canada 1.3 1.2 1.2 2.7 3.8 3.7 2.2 1.9 2.2 United States of America 1.9 2.3 2.2 9.1 8.5 8.2 32.1 31.6 31.9
EUROPE 31.5 32.1 33.3 4.4 5.1 5.6 61.4 62.7 63.7 European Union 29.1 29.6 30.7 1.0 1.2 1.1 55.6 56.2 57.1 Russian Federation 0.6 0.6 0.6 1.0 0.8 1.3 3.0 3.6 3.7 Ukraine 0.1 0.1 0.1 1.9 2.6 2.6 0.4 0.3 0.3
OCEANIA 2.0 2.4 2.4 0.2 0.2 0.2 2.6 3.2 3.3Australia 0.8 0.8 0.9 - 0.1 0.1 1.4 1.6 1.7
WORLD 73.9 79.6 82.4 74.0 79.6 82.3 245.8 267.0 279.2Developing countries 33.2 37.1 38.7 57.3 61.9 64.4 136.7 157.0 167.2 Developed countries 40.7 42.5 43.7 16.6 17.7 18.0 109.0 110.1 112.0 LIFDCs 10.7 13.2 14.0 11.2 11.8 12.3 82.4 99.8 106.9 LDCs 0.5 0.5 0.5 0.4 0.4 0.4 3.4 3.6 3.6
1 Expressed in product weight; includes meals and cakes derived from oilcrops as well as fish meal and other meals from animal origin.
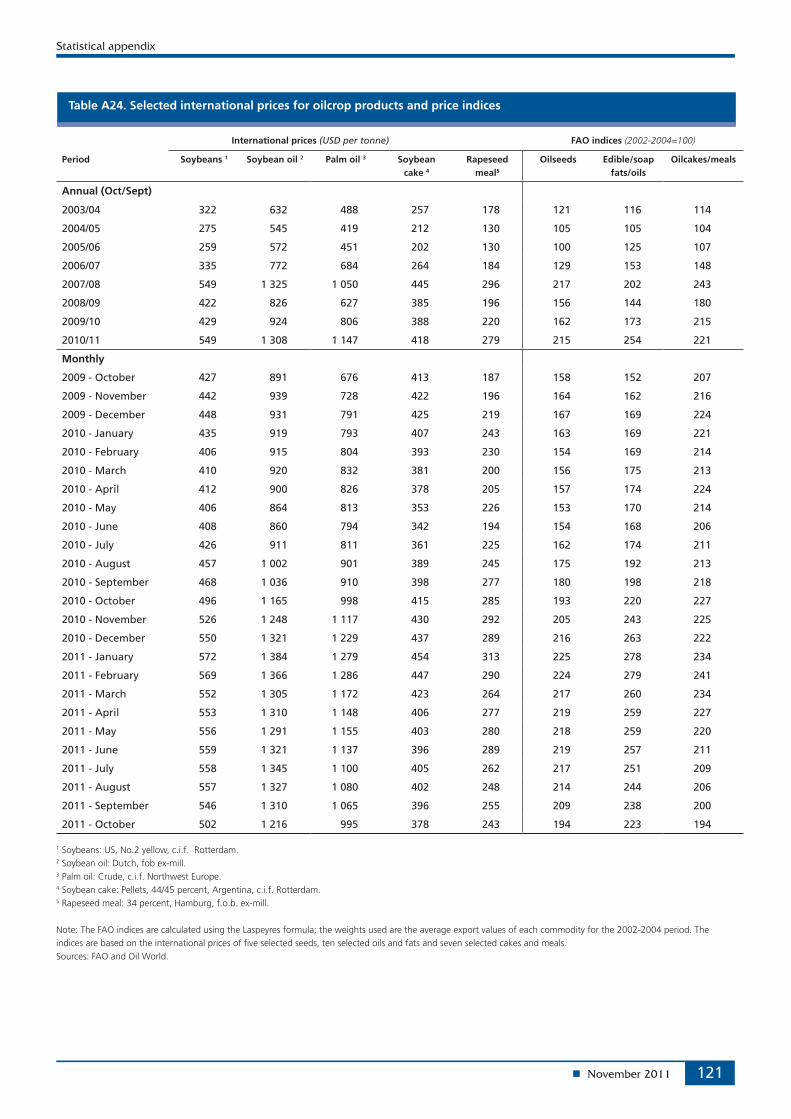
Statistical appendix
November 2011 121
Table A24. Selected international prices for oilcrop products and price indices
International prices (USD per tonne) FAO indices (2002-2004=100)
Period Soybeans 1 Soybean oil 2 Palm oil 3 Soybean cake 4
Rapeseed meal5
Oilseeds Edible/soap fats/oils
Oilcakes/meals
Annual (Oct/Sept)
2003/04 322 632 488 257 178 121 116 114
2004/05 275 545 419 212 130 105 105 104
2005/06 259 572 451 202 130 100 125 107
2006/07 335 772 684 264 184 129 153 148
2007/08 549 1 325 1 050 445 296 217 202 243
2008/09 422 826 627 385 196 156 144 180
2009/10 429 924 806 388 220 162 173 215
2010/11 549 1 308 1 147 418 279 215 254 221
Monthly
2009 - October 427 891 676 413 187 158 152 207
2009 - November 442 939 728 422 196 164 162 216
2009 - December 448 931 791 425 219 167 169 224
2010 - January 435 919 793 407 243 163 169 221
2010 - February 406 915 804 393 230 154 169 214
2010 - March 410 920 832 381 200 156 175 213
2010 - April 412 900 826 378 205 157 174 224
2010 - May 406 864 813 353 226 153 170 214
2010 - June 408 860 794 342 194 154 168 206
2010 - July 426 911 811 361 225 162 174 211
2010 - August 457 1 002 901 389 245 175 192 213
2010 - September 468 1 036 910 398 277 180 198 218
2010 - October 496 1 165 998 415 285 193 220 227
2010 - November 526 1 248 1 117 430 292 205 243 225
2010 - December 550 1 321 1 229 437 289 216 263 222
2011 - January 572 1 384 1 279 454 313 225 278 234
2011 - February 569 1 366 1 286 447 290 224 279 241
2011 - March 552 1 305 1 172 423 264 217 260 234
2011 - April 553 1 310 1 148 406 277 219 259 227
2011 - May 556 1 291 1 155 403 280 218 259 220
2011 - June 559 1 321 1 137 396 289 219 257 211
2011 - July 558 1 345 1 100 405 262 217 251 209
2011 - August 557 1 327 1 080 402 248 214 244 206
2011 - September 546 1 310 1 065 396 255 209 238 200
2011 - October 502 1 216 995 378 243 194 223 194
1 Soybeans: US, No.2 yellow, c.i.f. Rotterdam.2 Soybean oil: Dutch, fob ex-mill.3 Palm oil: Crude, c.i.f. Northwest Europe.4 Soybean cake: Pellets, 44/45 percent, Argentina, c.i.f. Rotterdam.5 Rapeseed meal: 34 percent, Hamburg, f.o.b. ex-mill. Note: The FAO indices are calculated using the Laspeyres formula; the weights used are the average export values of each commodity for the 2002-2004 period. The indices are based on the international prices of five selected seeds, ten selected oils and fats and seven selected cakes and meals.Sources: FAO and Oil World.