Embed Size (px)
Citation preview
© 2010 TASC
Rashid A. Chotani, MD, MPH, DTMDirector, Chemical/Biological Defense Programs, TASCAdjunct Professor , Uniformed Services University Health SystemFormer Director, Global Infectious Disease Alert & Surveillance System (GIDSAS)Johns Hopkins School of Medicine & Bloomberg School of Public [email protected] (Office) 571.642.0549 (Fax)571.425.9730 (Cell)
Pakistan Floods: An Unprecedented Humanitarian CrisisCenter for Global Health, Feinberg School of Medicine, Chicago, ILOctober 14, 2010
© 2010 TASC
• Health Statistics Before the flood
• Impacts of the Floods
• Global Response
• Additional Mortality
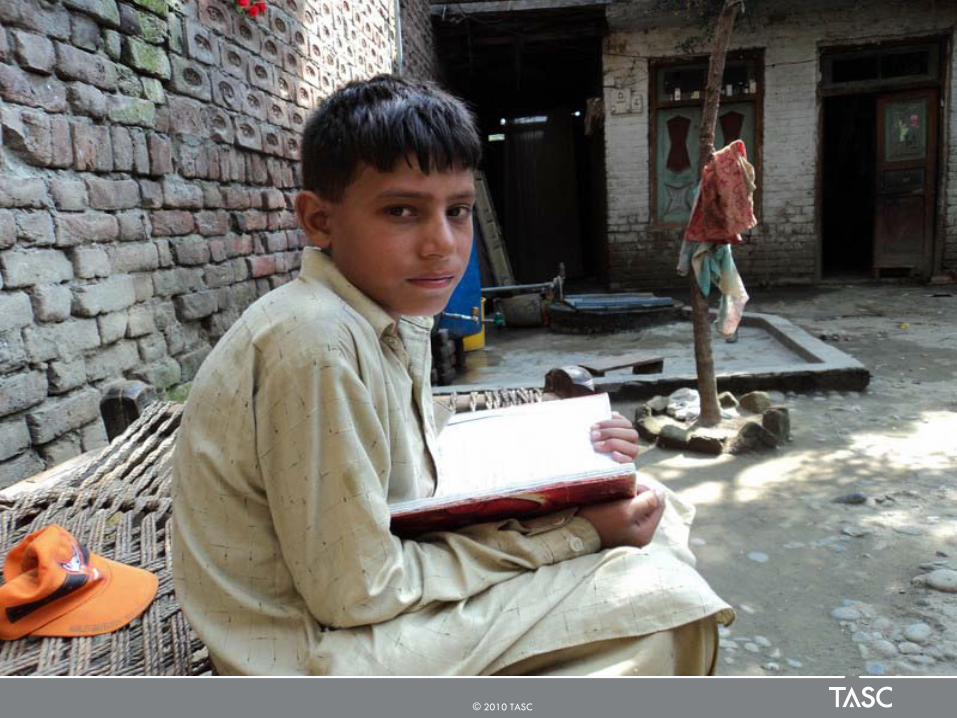
• A Journey Through the Affected Areas
• Discussion
• Conclusions
Outline
2
© 2010 TASC
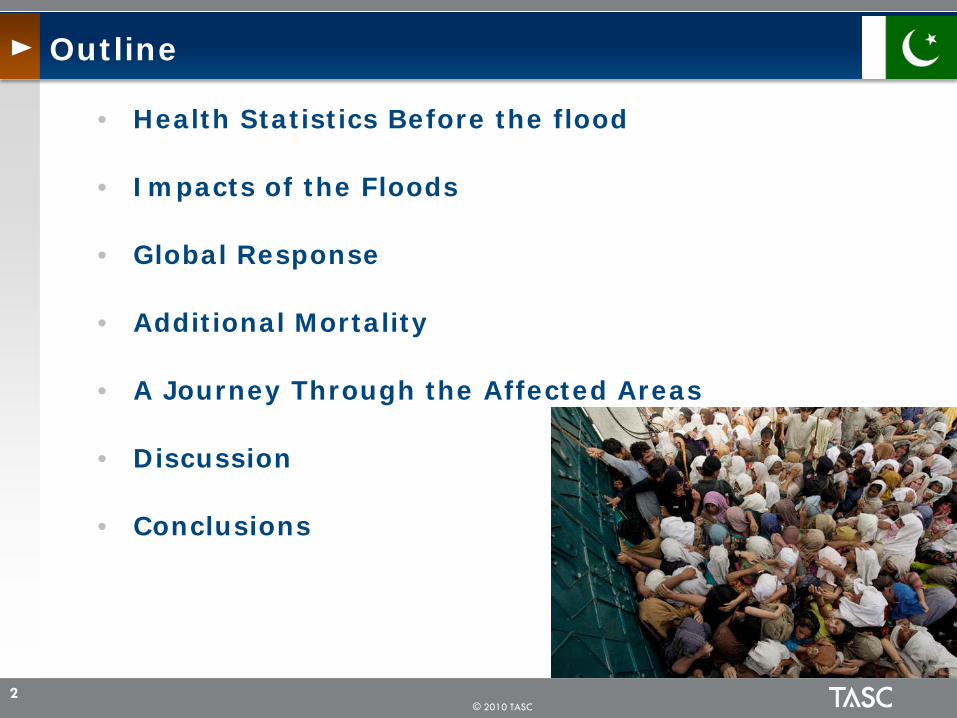
Pakistan
3
Capital: Islamabad
Largest City: Karachi
Official Languages: Urdu & English
Regional Languages: Punjabi, Pashto, Sindhi, Seraiki &
Balochi
Government: Federal Parliamentary Republic

© 2010 TASC
Demographic indicators
4
Area in square kilometers 796,096
Total population in thousands 170,294 2010
% Urban population out of total population
35 2009
Crude birth rate 25 2009
Crude death rate 7.7 2009
% Population growth rate 1.7 2009
% Population below 15 years 43.4 2009
% Population 65 years and over 3.5 2009
% Dependency ratio 88.3 2009
Total fertility rate per woman 4.1 2007

© 2010 TASC
Socioeconomic indicators
5
Adult literacy rate 15+ years, total (%) 56 2009
Adult literacy rate 15+ years, males (%) 69 2009
Adult literacy rate 15+ years, females (%) 44 2009
Gross primary school enrolment ratio - total (%) 91 2009
Gross primary school enrolment ratio - male (%) 97 2009
Gross primary school enrolment ratio - female (%) 83 2009
Gross secondary school enrolment ratio - total (%) 47 2009
Gross secondary school enrolment ratio - males (%) 55 2009
Gross secondary school enrolment ratio - females (%) 36 2009
Pop with sustainable access to improved water source (%) 93 2007
Population with access to improved sanitation (%) 44 2007
Unemployment in percent 5 2008
Smoking prevalence among adults (aged 15+), total (%) 23 2007
Smoking prevalence among adults (aged 15 +), males (%) 36 2007
Smoking prevalence among adults (aged 15+), females (%) 9 2007

© 2010 TASC
Health Expenditure indicators
6
GDP per capita US$ exchange rate 841 2008
Total expenditure on health (per capita) Average US$ exchange rate
24 2008
Government expenditure on health (per capita) Average US$ exchange rate
7 2008
Total expenditure on health of % of GDP 2.9 2008
General government expenditure on health as % of total health expenditure
29.7 2008
Out-of-pocket expenditure as % of total health expenditure
57.9 2008
General government expenditure on health as % of total government expenditure
… 2008
Ministry of health budget as % of government budget 3.3 …

© 2010 TASC
Human and physical resources indicators Rate/100,000 population
7
Physicians 8 2009
Dentists 1 2009
Pharmacists 0.9 2009
Nursing and midwifery 6 2009
Hospital beds 6 2009
Infrastructure - primary health care units and centers
1 2009
© 2010 TASC
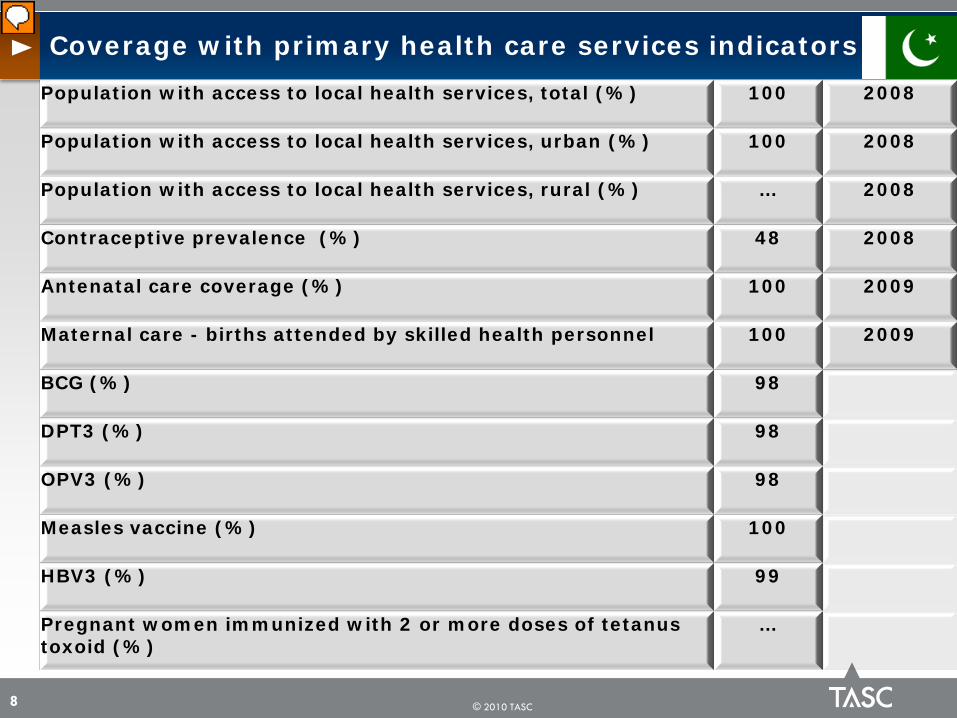
Coverage with primary health care services indicators
8
Population with access to local health services, total (%) 100 2008
Population with access to local health services, urban (%) 100 2008
Population with access to local health services, rural (%) … 2008
Contraceptive prevalence (%) 48 2008
Antenatal care coverage (%) 100 2009
Maternal care - births attended by skilled health personnel 100 2009
BCG (%) 98
DPT3 (%) 98
OPV3 (%) 98
Measles vaccine (%) 100
HBV3 (%) 99
Pregnant women immunized with 2 or more doses of tetanus toxoid (%)
…

© 2010 TASC
Health status indicators
9
Total life expectancy at birth (years) 65.4 2009
Male life expectancy at birth (years) 65.2 2009
Female life expectancy at birth (years) 65.6 2009
Newborns with low birth weight (%) 26 2007
Children underweight (%) 37 2007
Perinatal mortality rate per 1,000 total births 56 2004
Neonatal mortality rate (per 1,000 live births) 54 2007
Infant mortality rate (per 1,000 live births) 70.2 2007
Under five mortality rate (per 1,000 live births) 90 2007
Maternal mortality ratio (per 10,000 live births) 276 2007

© 2010 TASC
Selected morbidity indicators
10
Annual number (N) of reported cases 2008
Malaria Number of reported cases=121,360
Incidence rate per 1,000 population
= 0.70
Measles Number of reported cases = 441
Incidence rate per 1,000,000 population
= 2.69
Poliomyelitis Number of reported cases = 89
All forms of tuberculosis
Number of reported cases = 267,451
Notification rate per 100,000 population
= 148
AIDS Estimated number of PLHIV = 96,000
Reported number of people receiving ART
= 1,296
Imported cases; rate not calculated
© 2010 TASC
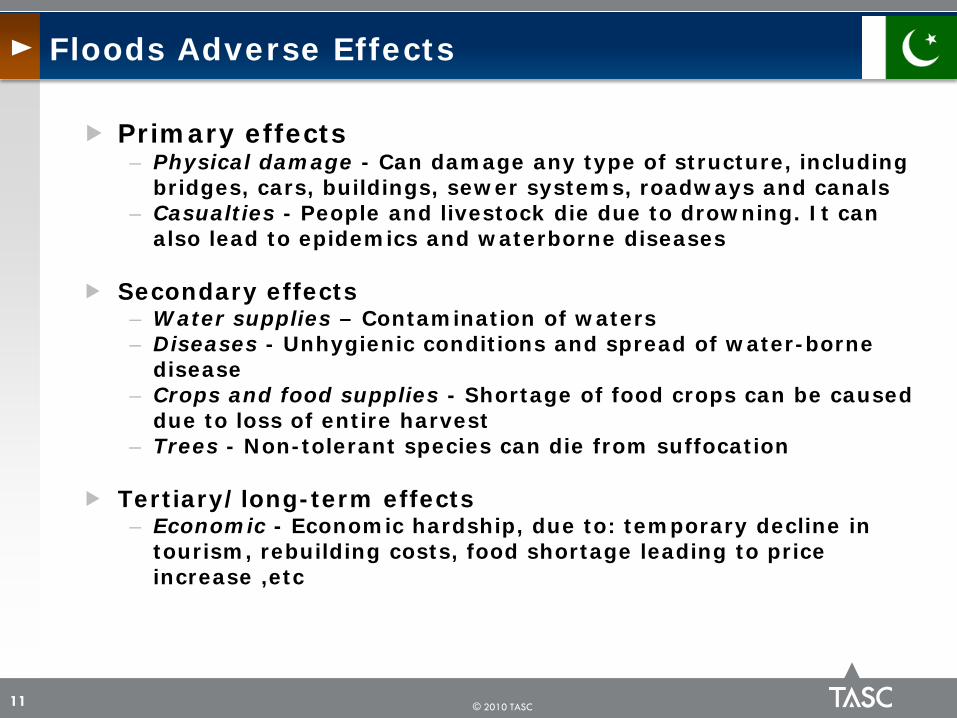
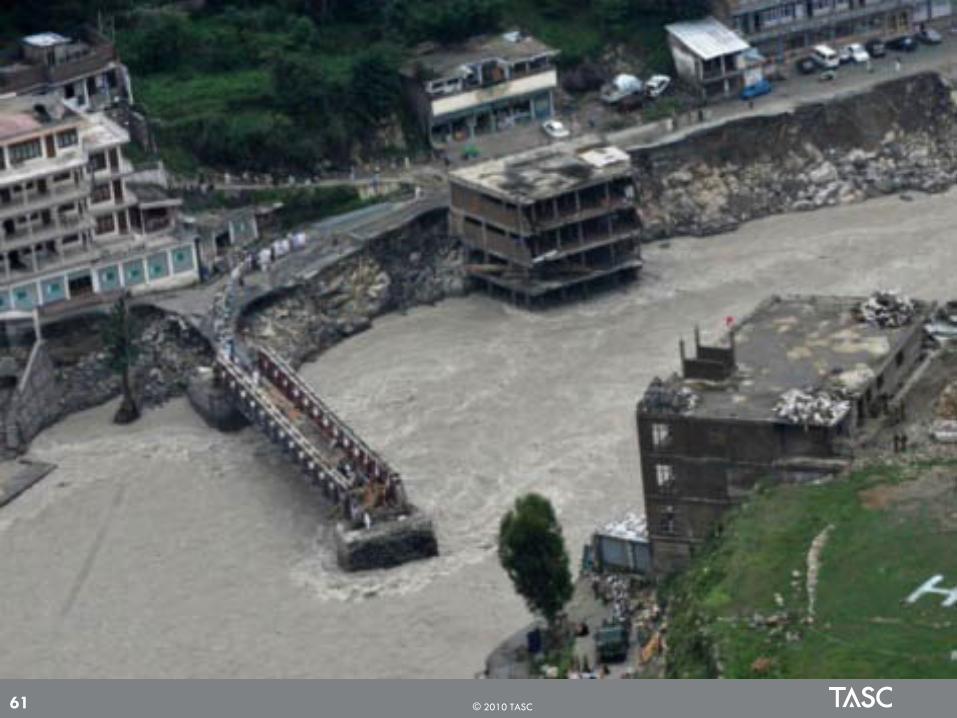
Primary effects– Physical damage - Can damage any type of structure, including
bridges, cars, buildings, sewer systems, roadways and canals – Casualties - People and livestock die due to drowning. It can
also lead to epidemics and waterborne diseases
Secondary effects– Water supplies – Contamination of waters– Diseases - Unhygienic conditions and spread of water-borne
disease– Crops and food supplies - Shortage of food crops can be caused
due to loss of entire harvest– Trees - Non-tolerant species can die from suffocation
Tertiary/long-term effects– Economic - Economic hardship, due to: temporary decline in
tourism, rebuilding costs, food shortage leading to price increase ,etc
Floods Adverse Effects
11
© 2010 TASC 12
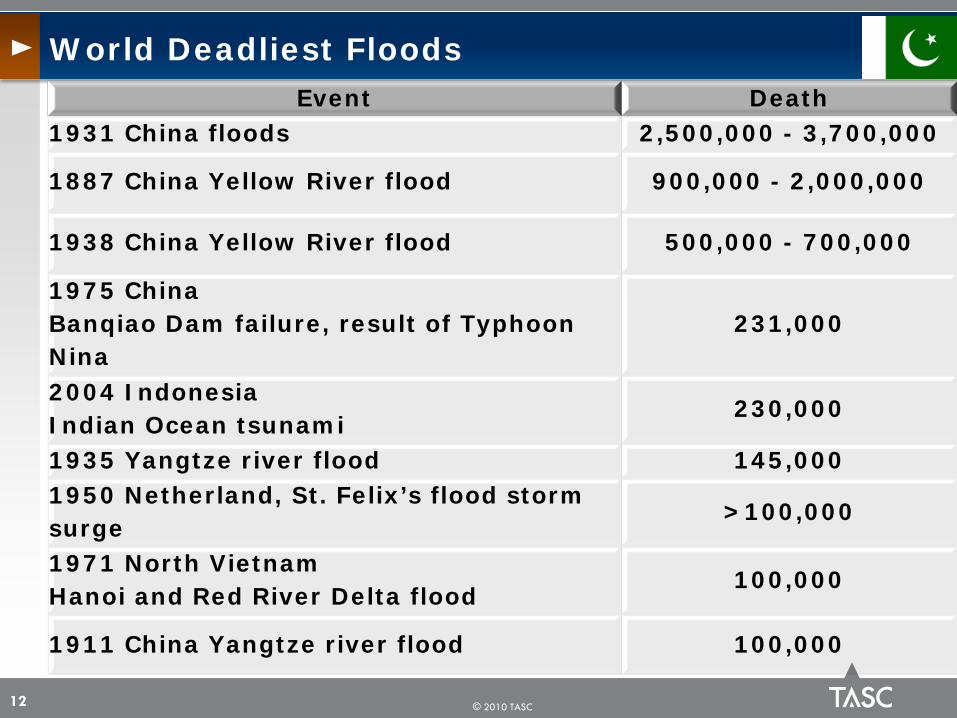
Event Death1931 China floods 2,500,000 - 3,700,000
1887 China Yellow River flood 900,000 - 2,000,000
1938 China Yellow River flood 500,000 - 700,000
1975 China Banqiao Dam failure, result of Typhoon Nina
231,000
2004 IndonesiaIndian Ocean tsunami
230,000
1935 Yangtze river flood 145,0001950 Netherland, St. Felix’s flood storm surge
>100,000
1971 North VietnamHanoi and Red River Delta flood
100,000
1911 China Yangtze river flood 100,000
World Deadliest Floods
© 2010 TASC
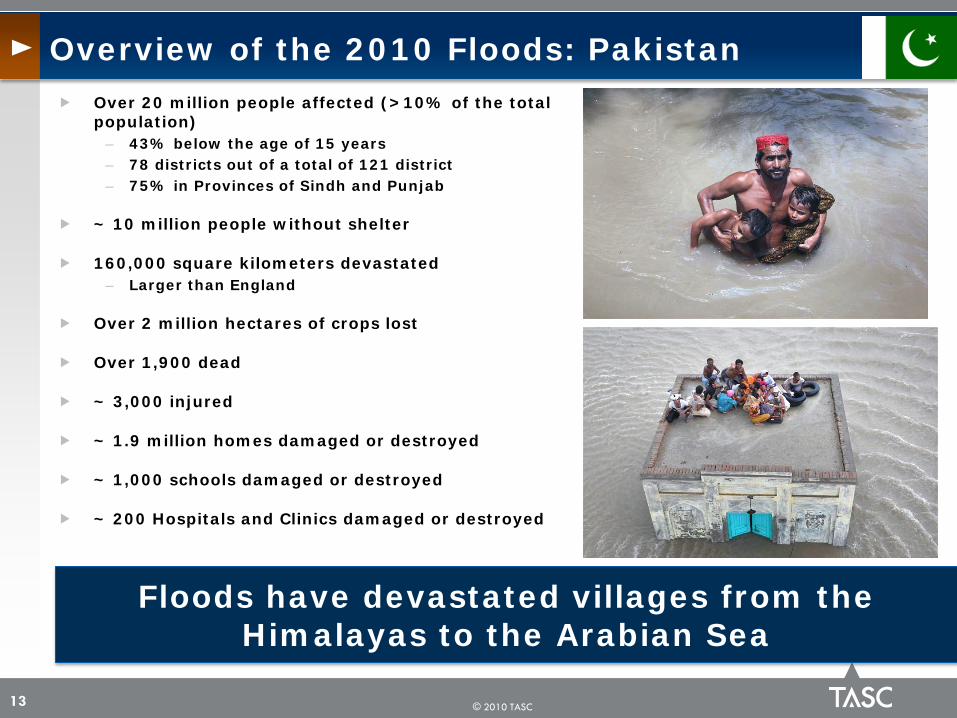
Over 20 million people affected (>10% of the total population)
– 43% below the age of 15 years– 78 districts out of a total of 121 district– 75% in Provinces of Sindh and Punjab
~ 10 million people without shelter
160,000 square kilometers devastated – Larger than England
Over 2 million hectares of crops lost
Over 1,900 dead
~ 3,000 injured
~ 1.9 million homes damaged or destroyed
~ 1,000 schools damaged or destroyed
~ 200 Hospitals and Clinics damaged or destroyed
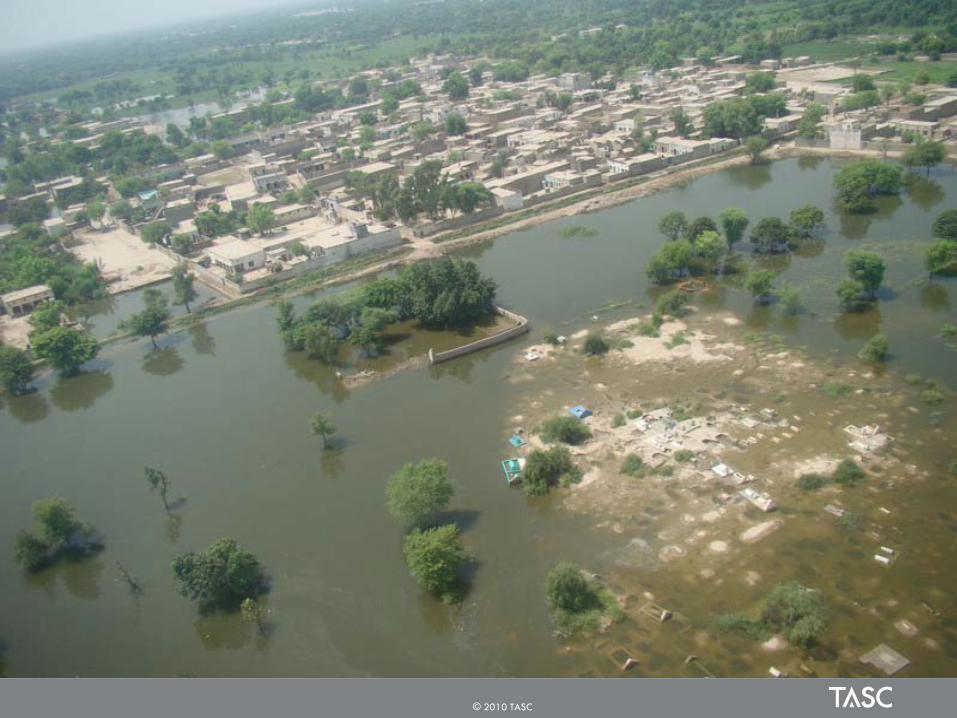
Overview of the 2010 Floods: Pakistan
13
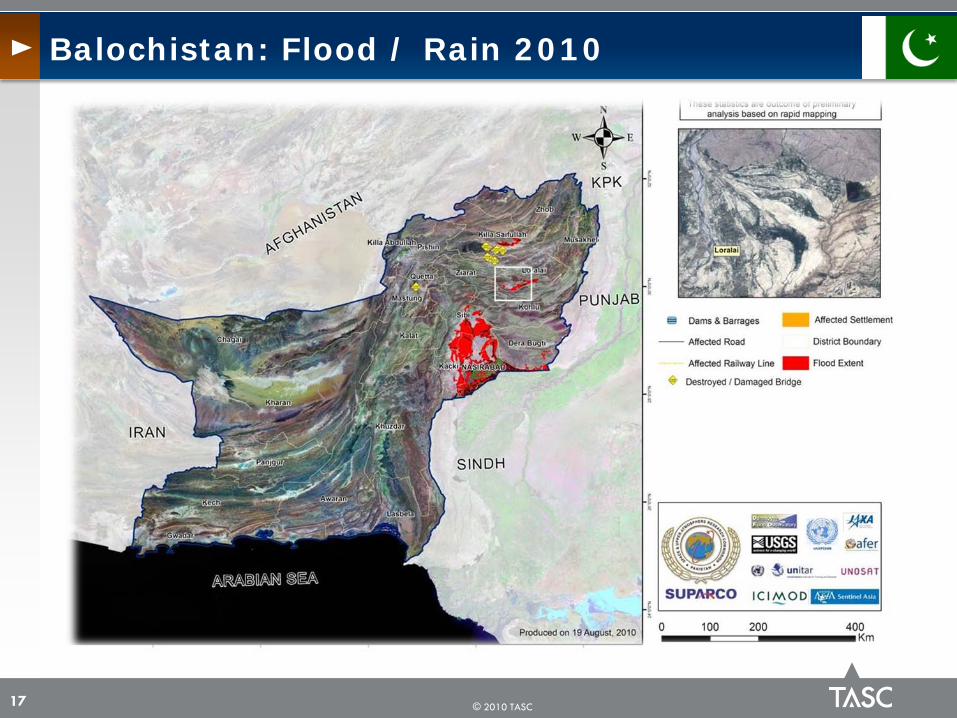
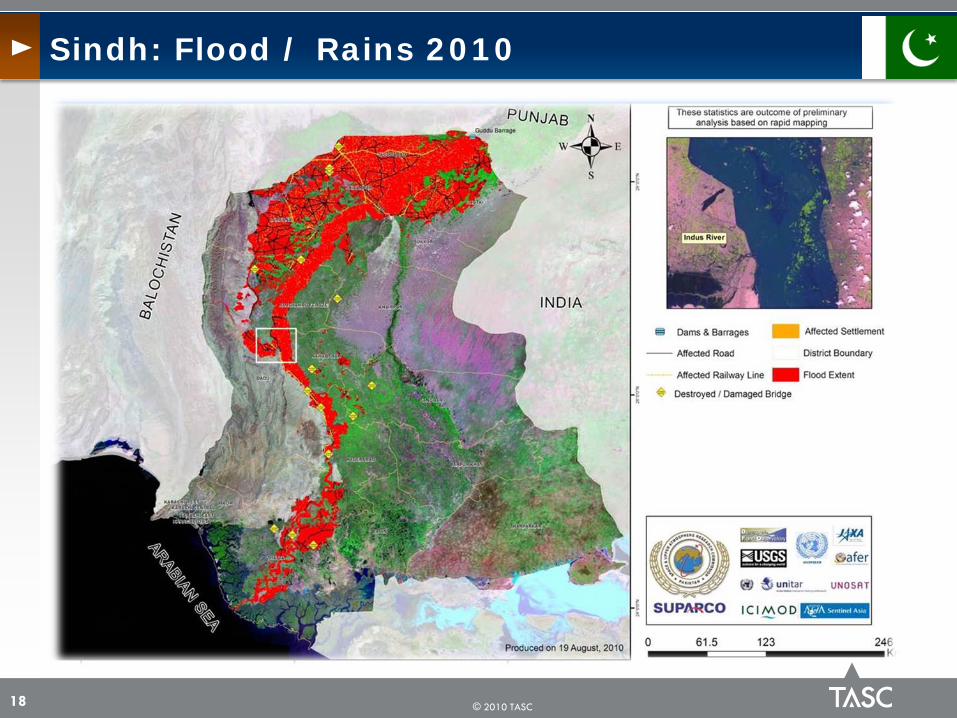
Floods have devastated villages from the Himalayas to the Arabian Sea

© 2010 TASC
Affected Areas by Floods: Pakistan
14

© 2010 TASC
Khyber Pakhtoon Khwa: Flood / Rain 2010
15

© 2010 TASC
Punjab: Flood / Rain 2010
16
© 2010 TASC
Balochistan: Flood / Rain 2010
17
© 2010 TASC
Sindh: Flood / Rains 2010
18

© 2010 TASC
Flood Damages as of October 11, 2010, by Affected Provinces
19
SINDH PUNJAB KPK BALO AJ&K GB Total
Houses Damaged 1,114,629 509,814 200,799 75,261 7,106 2,830 1,910,439
Injured 1201 350 1198 98 87 60 2994
Deaths 234 110 1156 48 71 183 1802
KPK= Khyber Pakhtunkhwa including FATABALO = BalochistanAJ&K= Azad Jammu & KashmirGB= Gilgit-Baltistan
© 2010 TASC
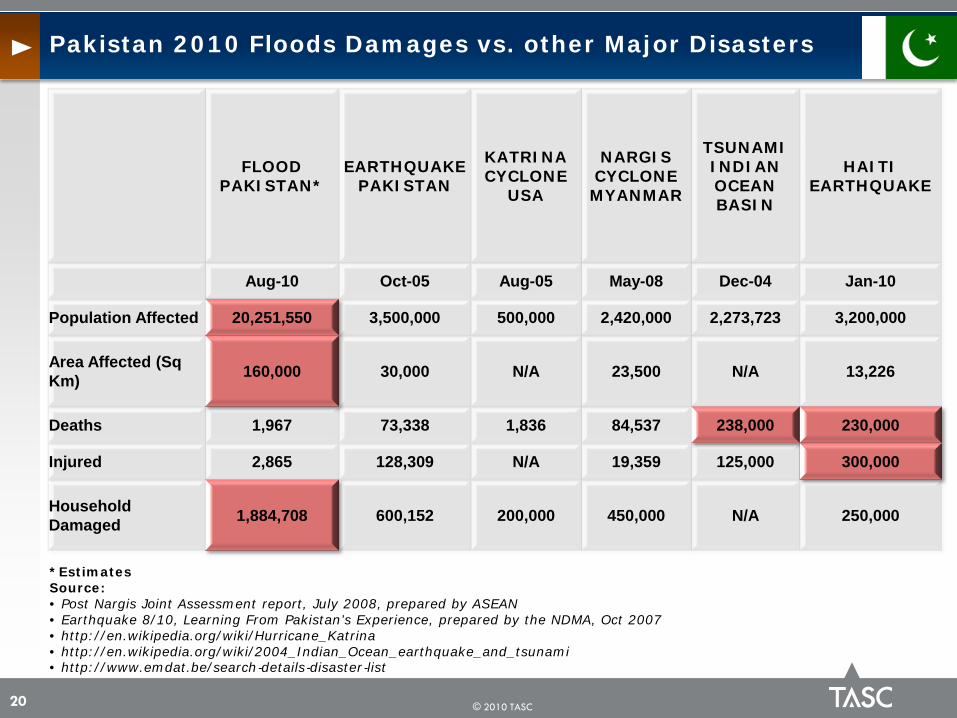
Pakistan 2010 Floods Damages vs. other Major Disasters
20
*EstimatesSource:• Post Nargis Joint Assessment report, July 2008, prepared by ASEAN• Earthquake 8/10, Learning From Pakistan’s Experience, prepared by the NDMA, Oct 2007• http://en.wikipedia.org/wiki/Hurricane_Katrina• http://en.wikipedia.org/wiki/2004_Indian_Ocean_earthquake_and_tsunami• http://www.emdat.be/search‐details‐disaster‐list
FLOOD PAKISTAN*
EARTHQUAKE PAKISTAN
KATRINA CYCLONE
USA
NARGIS CYCLONE MYANMAR
TSUNAMI INDIAN OCEAN BASIN
HAITI EARTHQUAKE
Aug-10 Oct-05 Aug-05 May-08 Dec-04 Jan-10
Population Affected 20,251,550 3,500,000 500,000 2,420,000 2,273,723 3,200,000
Area Affected (Sq Km) 160,000 30,000 N/A 23,500 N/A 13,226
Deaths 1,967 73,338 1,836 84,537 238,000 230,000
Injured 2,865 128,309 N/A 19,359 125,000 300,000
Household Damaged 1,884,708 600,152 200,000 450,000 N/A 250,000

© 2010 TASC
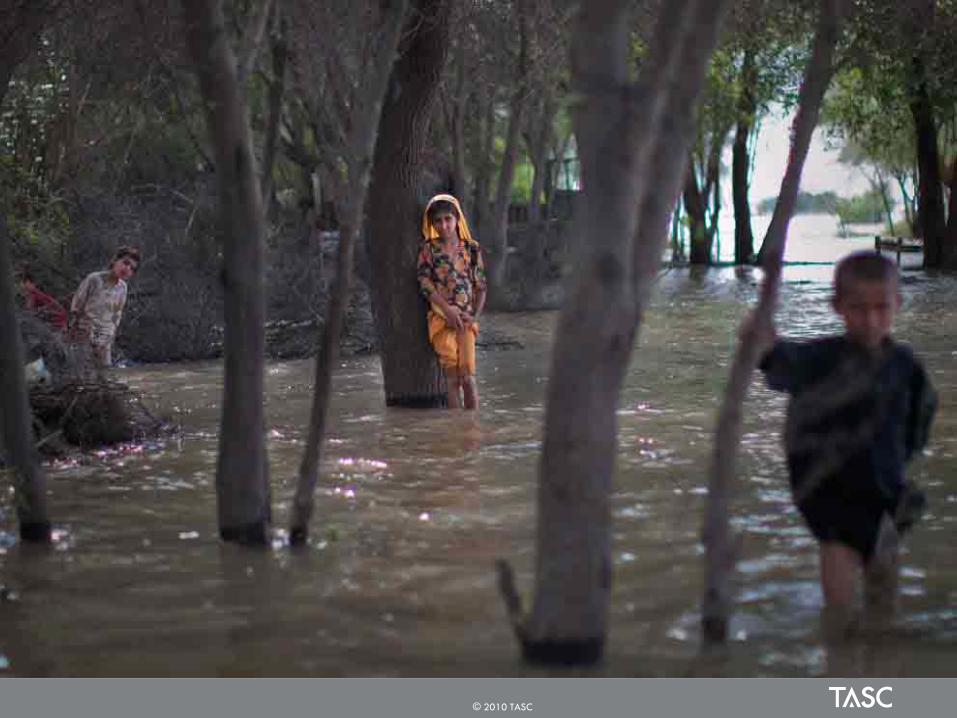
Many markets have been destroyed, and food is generally not available
Nearly 8 million acres of agricultural land have been flooded
The main water sources in the area are dug wells, hand pumps, and a few tube wells which have become contaminated, and the water is no longer safe to drink
Food and Water
21
People can live on small amounts of food, but they can’t survive without potable water
© 2010 TASC
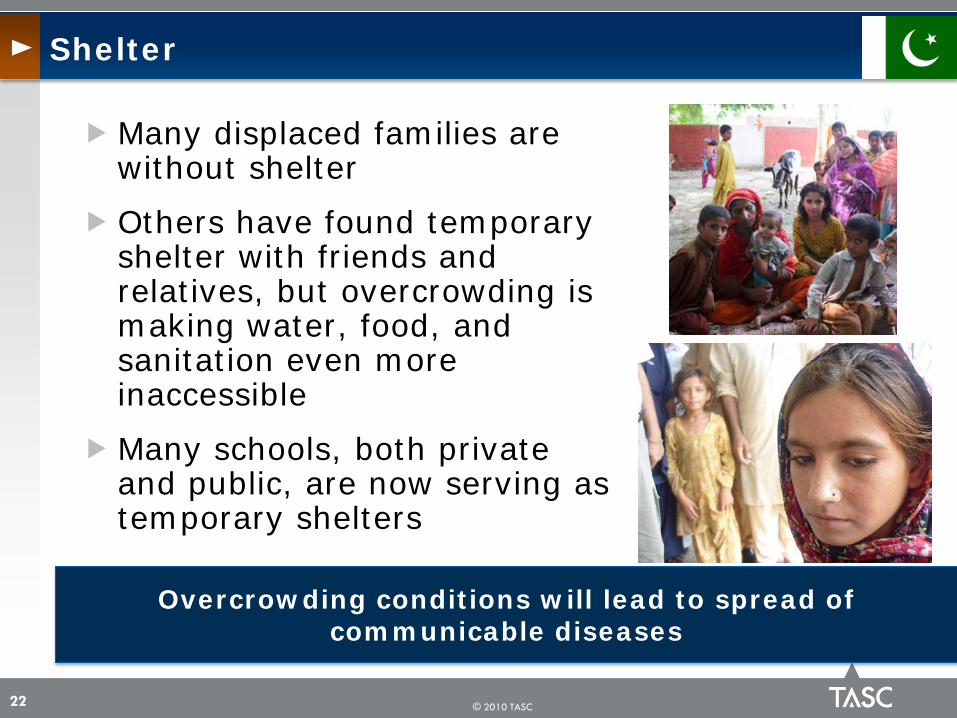
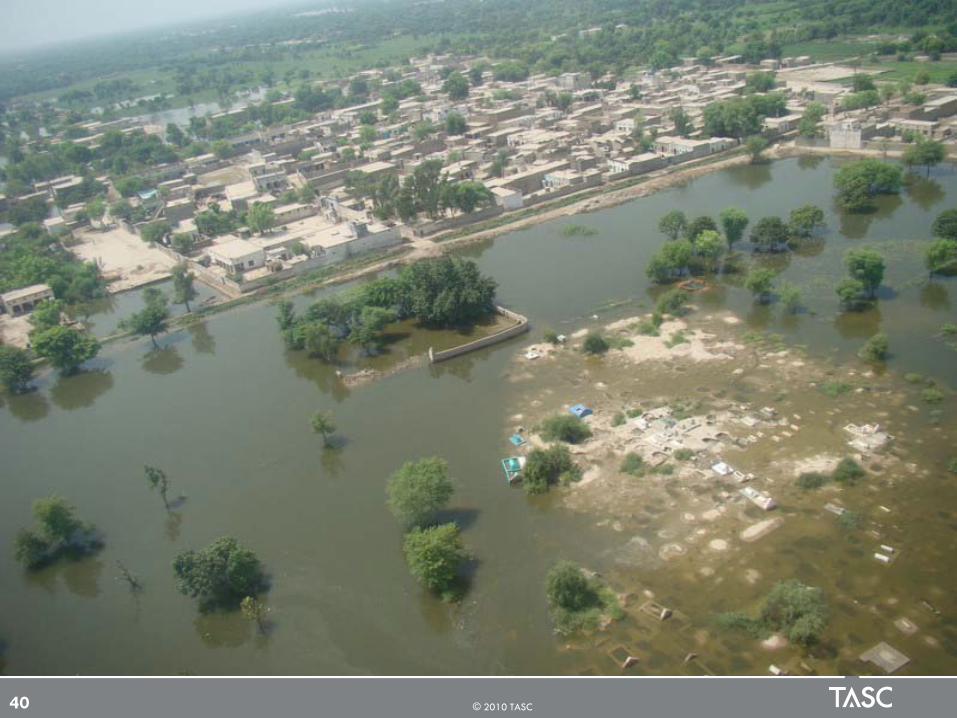
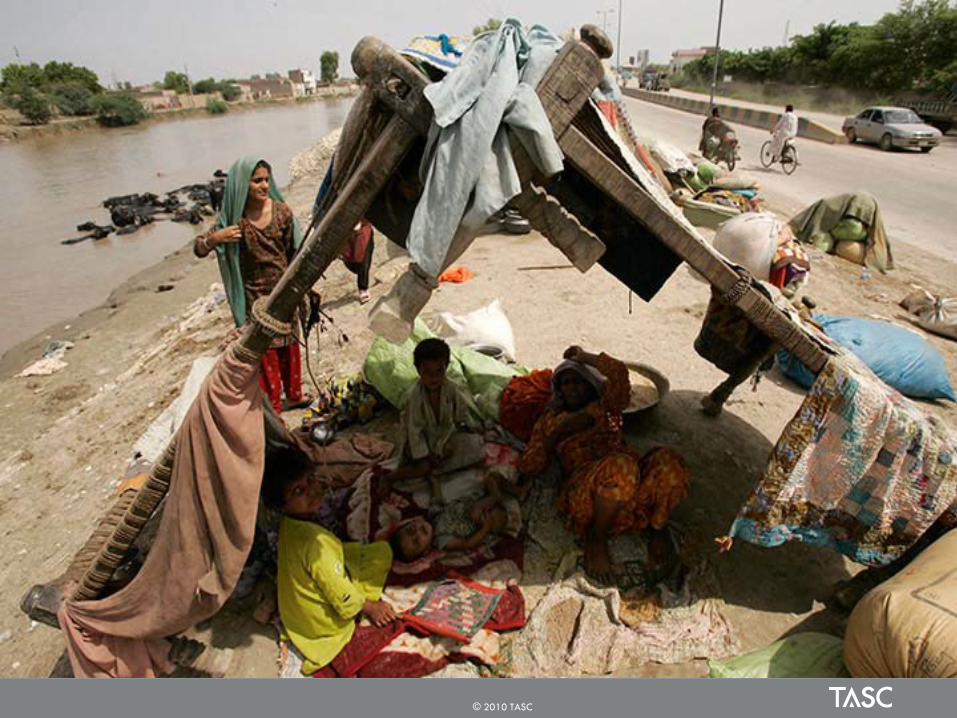
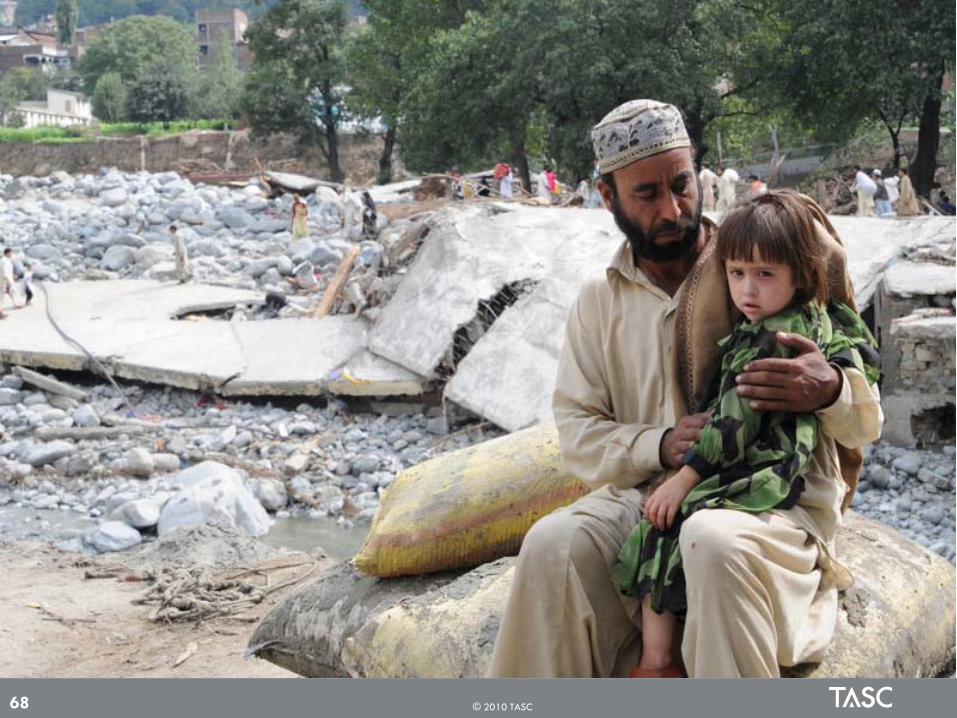
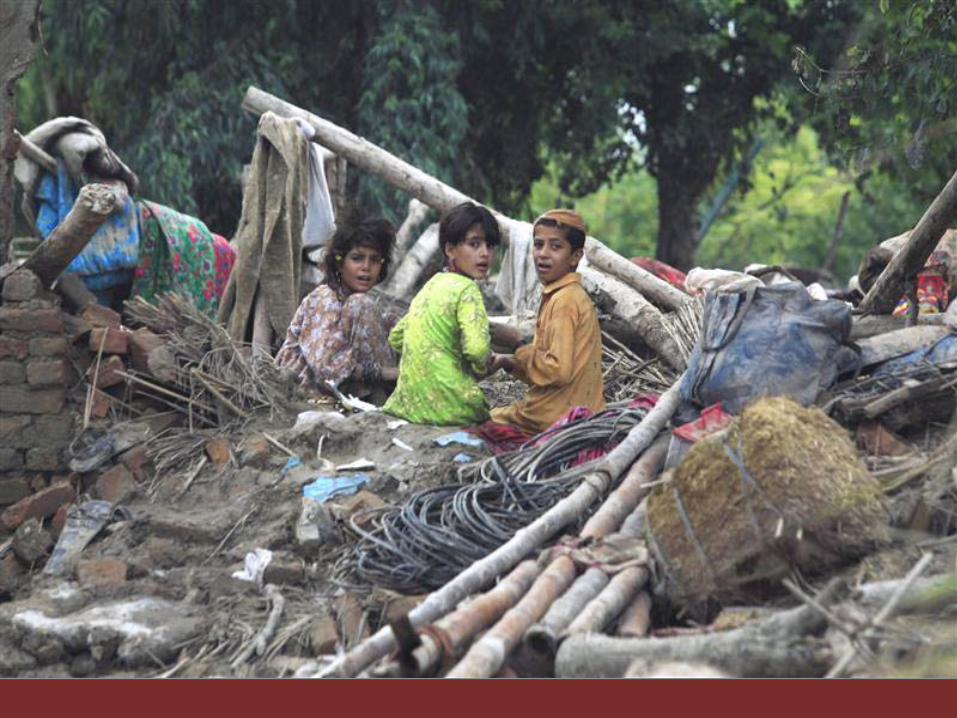
Many displaced families are without shelter
Others have found temporary shelter with friends and relatives, but overcrowding is making water, food, and sanitation even more inaccessible
Many schools, both private and public, are now serving as temporary shelters
Shelter
22
Overcrowding conditions will lead to spread of communicable diseases

© 2010 TASC
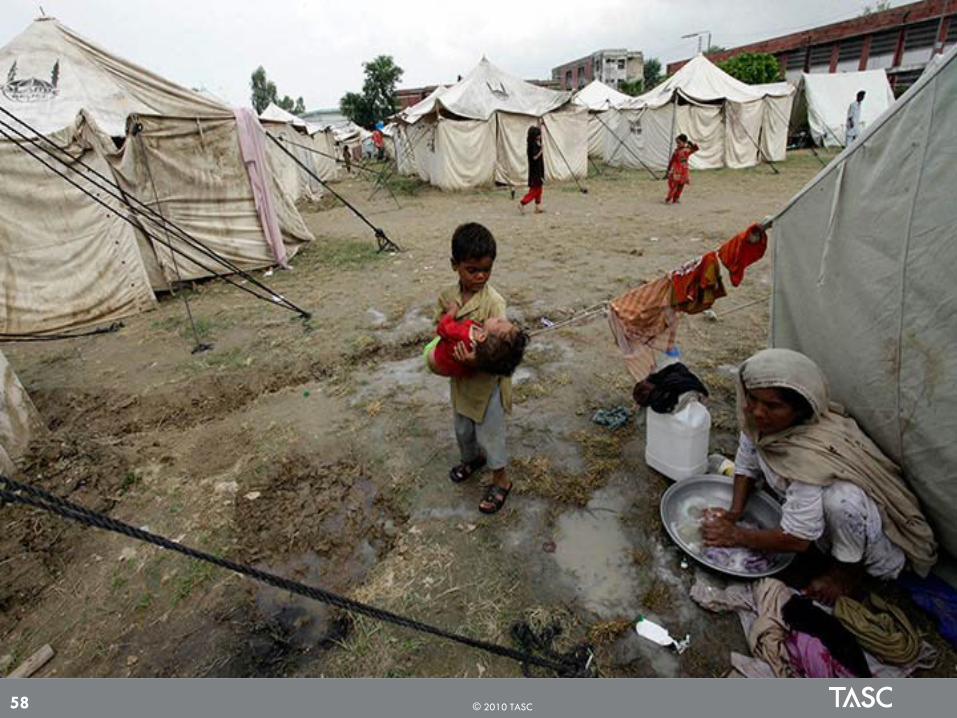
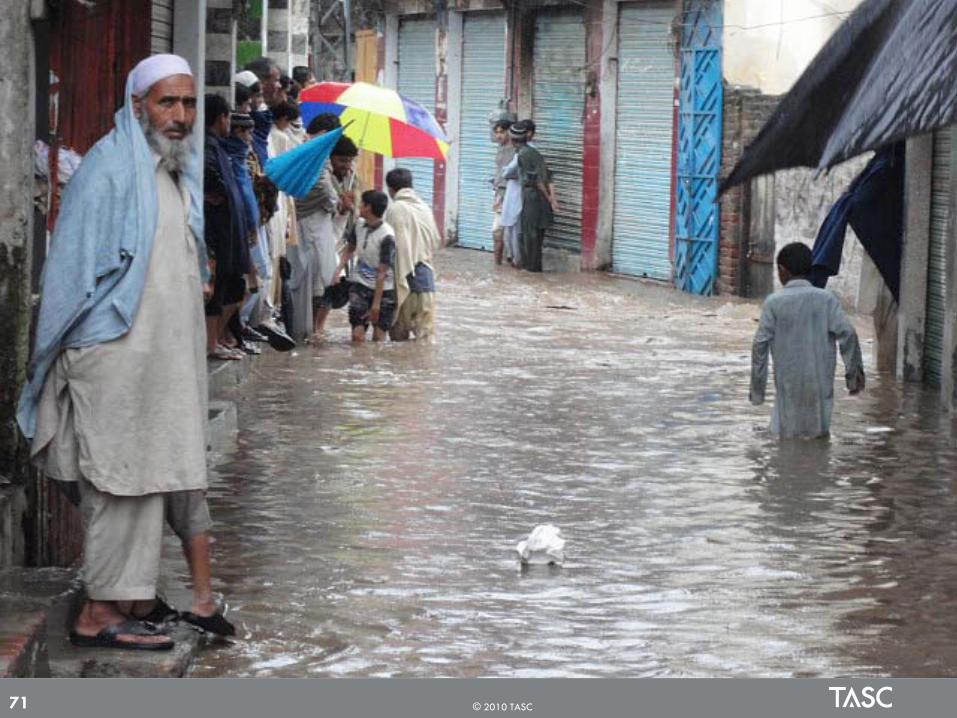
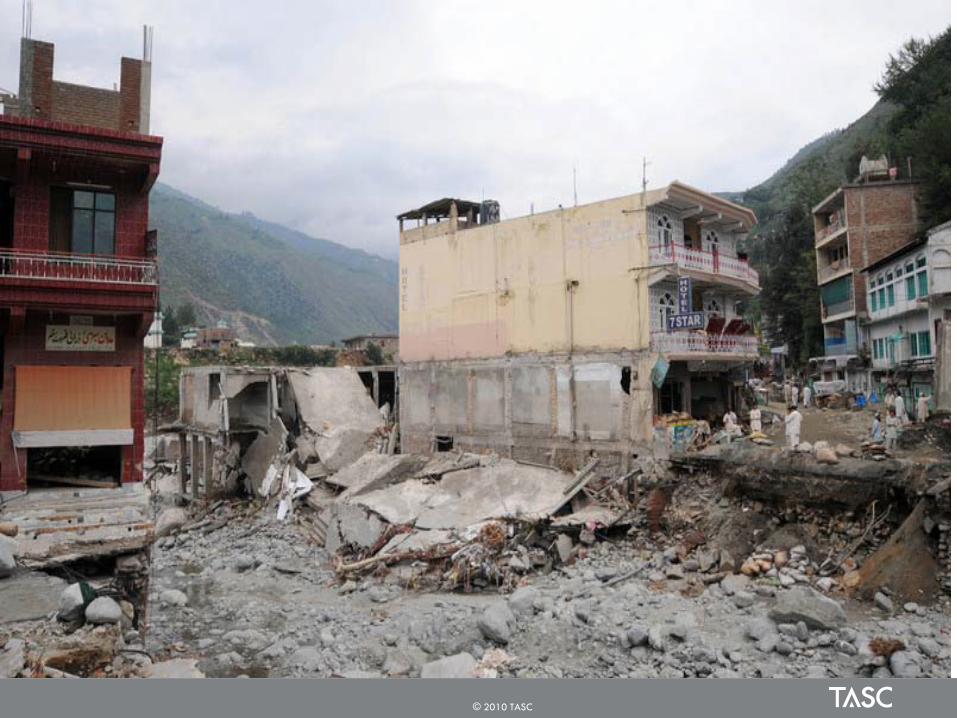
Some clinics in the area have been washed away, and medical staff and medicine are scarce– ~200 hospitals & Clinics damaged/destroyed
Children and families are suffering from diarrhea, vomiting, malaria, and acute respiratory infections
Prior to the flooding there was lack of proper toilets in homes
Since the flooding, human waste has been mixed with drinking water
In addition, water is sitting stagnant in many places, increasing the risk of disease
Health and Sanitation
23
Major risk of waterborne disease outbreaks, e.g., cholera, typhoid and increased incidence of malaria
© 2010 TASC
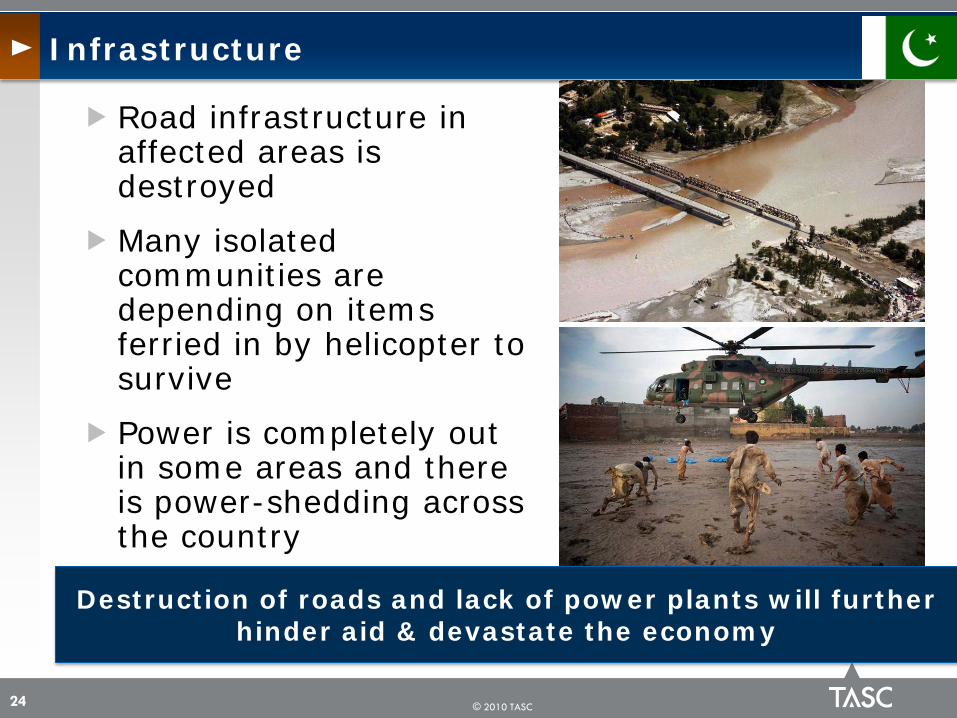
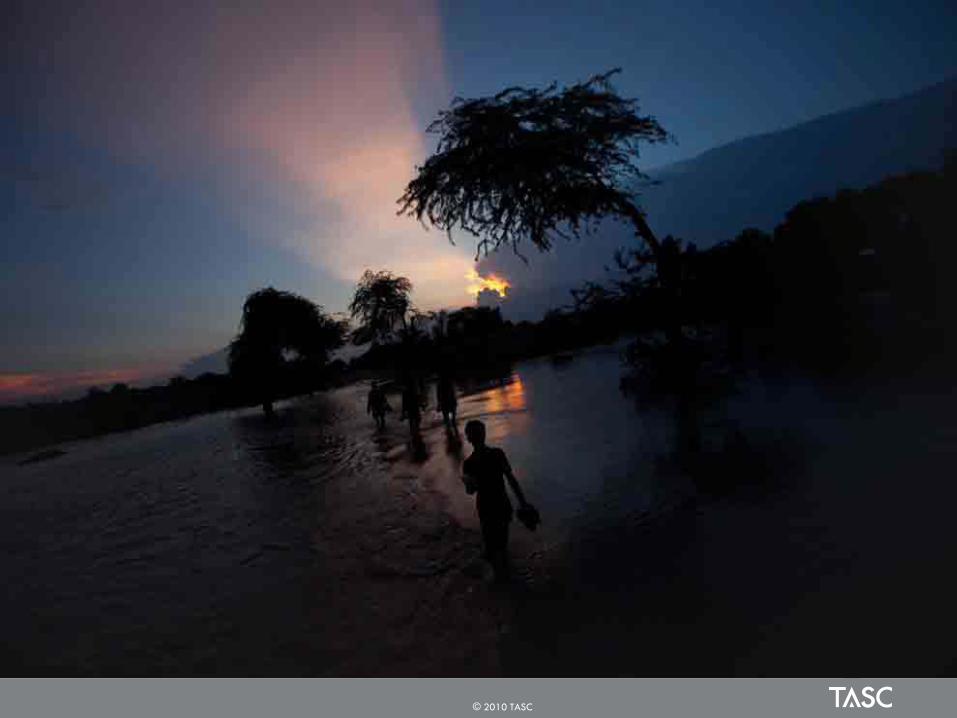
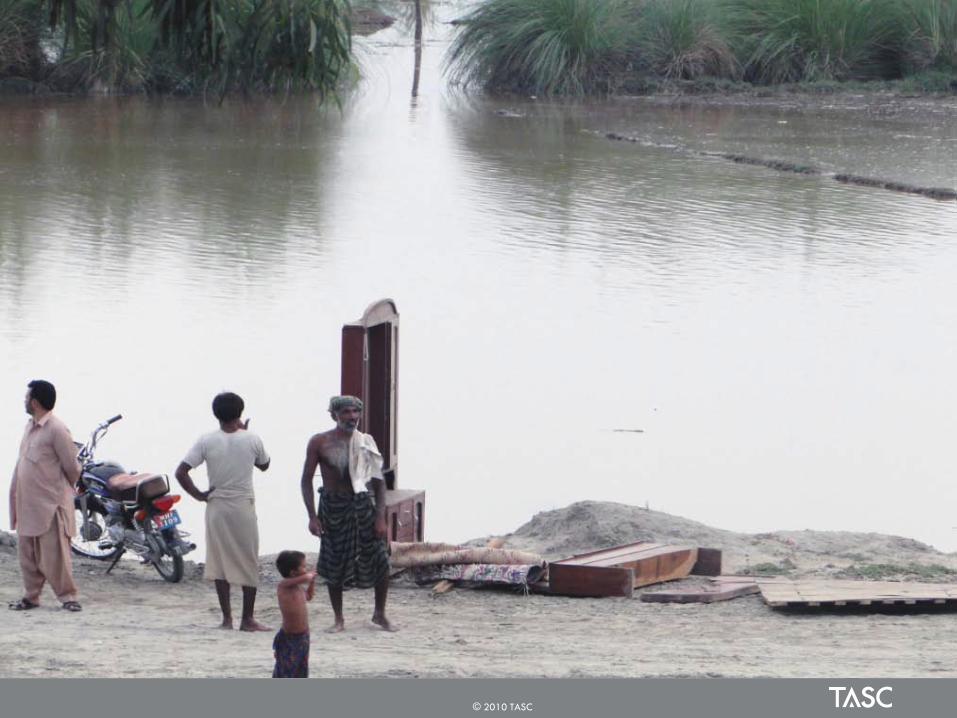
Road infrastructure in affected areas is destroyed
Many isolated communities are depending on items ferried in by helicopter to survive
Power is completely out in some areas and there is power-shedding across the country
Infrastructure
24
Destruction of roads and lack of power plants will further hinder aid & devastate the economy

© 2010 TASC
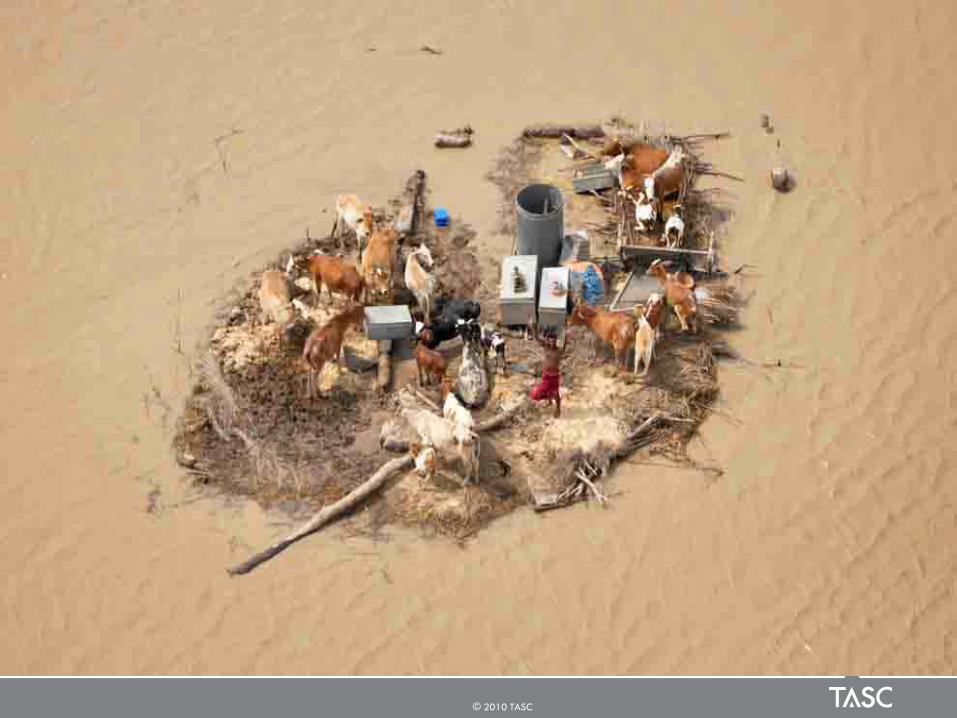
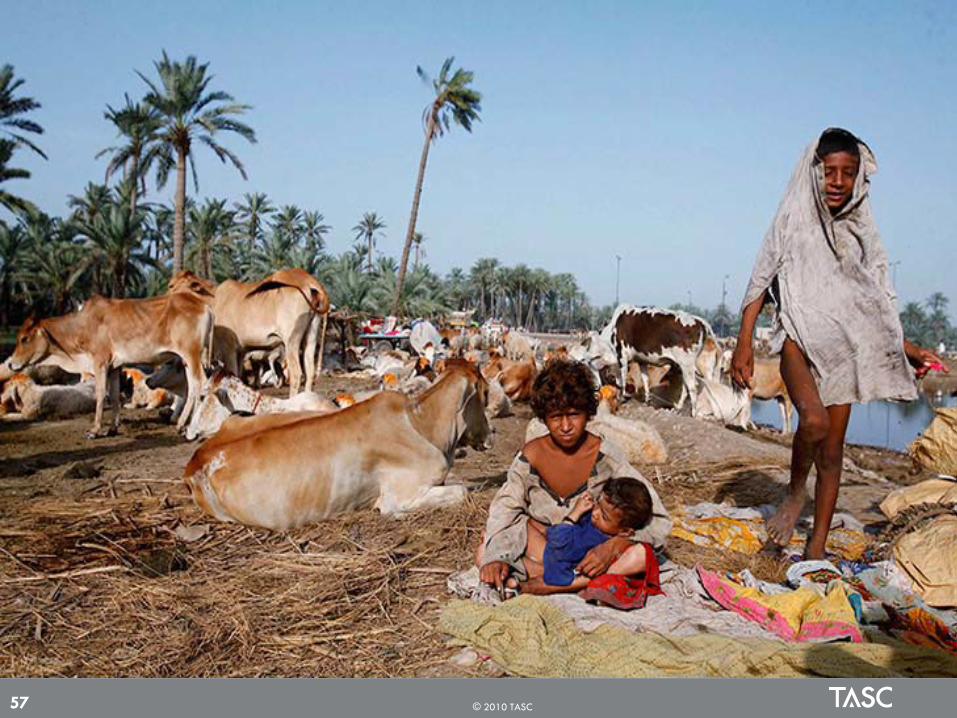
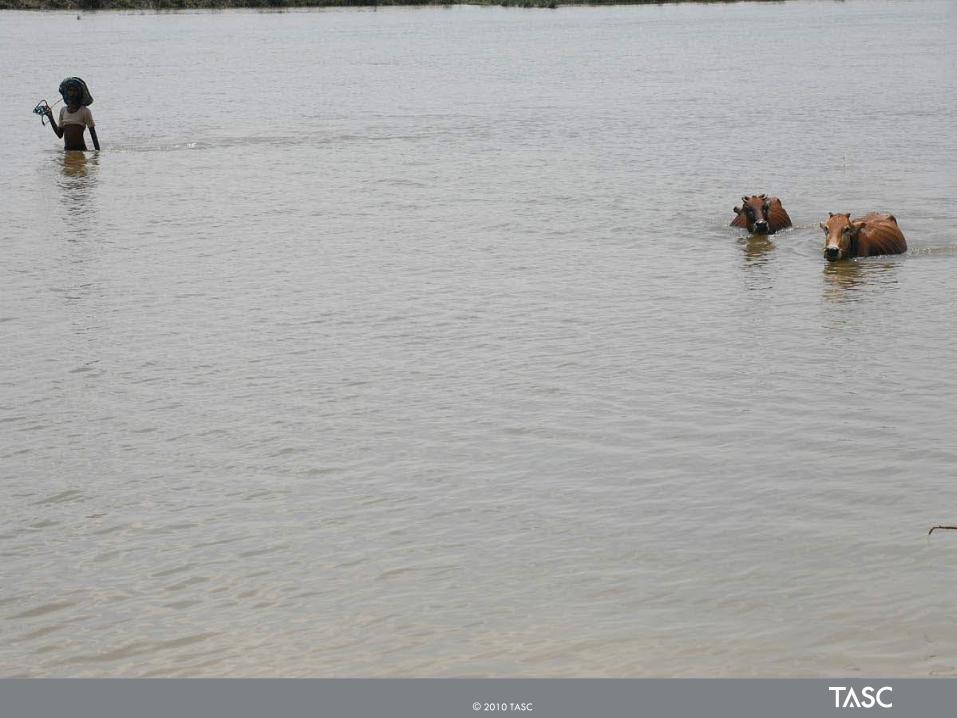
Most people are farmers, earning a living from crops and livestock
Millions of acres of crops have been damaged, as have irrigation systems
Livelihoods
25
Farmers are likely to remain dependent on aid until well into 2012

© 2010 TASC
Response to Pakistan Floods
26
National and international communities has launched the immediate response to the affected people in Pakistan
However, there are difficulties during disaster responses:– Billions of dollars are needed– Inaccessible or hard to reach
areas, as the roads are destructed and lands are submerged by floods water
– Political relationship affects providing or accepting the relief aids
– Donors are concerned whether the funds will reach Taliban instead flood victims
Security issues
Unexploded mines

© 2010 TASC
United Nations and its partners have launched a revised Pakistan Floods Emergency Response Plan
– Over US$2B to provide aid for up to 14M people over a 12-month period
The appeal has 483 projects to be carried out by – 15 United Nations bodies, the International Organization for
Migration (IOM), and 156 national and international non-governmental organizations (NGOs)
The appeal includes the earlier amount of $459.7M, requested on 11 August
The initial appeal of $459.7M is 80% funded, making the unmet requirements for this emergency $1.6B
TOTAL COMMITTED by World = $1.85B– Administrative Agency UN/INNGO - $1.22B – GoP – $6.34M
Major Donors:– SA (Gov + Others):$362M; US:$360M; EU: $187M; Turkey (Gov +
Others): $176M; UK $117M; Iran 101M; OTHERS
Response to Pakistan Floods
27
The size of the revised appeal reflects the enormous human and geographic scale of the catastrophe, and the necessity of putting into place the right kind of early recovery, including
projects in agriculture, community restoration, education, health and shelter

© 2010 TASC
Ensure all assessments and response efforts take into consideration the needs of: – Women of childbearing age– Pregnant women– Children– Elderly– Disabled
The Most Vulnerable Victims
28
© 2010 TASC 29
An estimated 400,000 women in the affected population are pregnant with 45,000 deliveries per month, many of which will be in an unsafe environment
without access to a skilled birth attendant, an adequate referral system,
and emergency obstetric care. About 4,500 women will need access to
emergency obstetric services

© 2010 TASC
Population <15 years (43.4%) = 9,000,000
Population b/w 16-64 years (52.3%) = 10,300,000
Population 65 + (3.5%) = 700,000
Total Affected Population = 20,000,000
Guesstimating Additional Mortality
30
Assumptions
~50% female = 5,150,000~30% childbearing age = 1,545,000~25% expecting mothers = 386,250

© 2010 TASC
Guesstimating Additional Mortality
31
N=386,250 Expecting Mothers
Health Indicators
Rate Deaths/Year Deaths/3 months Excess Deaths due to Floods
10% 20% 30%
Maternal Mortality Rate
276/10,000 Live Births 10,661 2,665 266 533 800
Prenatal Mortality Rate
56/1,000 Total Births 21,630 5,408 540 1,081 1,622
Neonatal Mortality Rate
54/1,000 Live Births 20,858 5,214 521 1,043 1,564
Infant Mortality Rate
70.2/1,000 Live Births 27,115 6,779 678 1,356 2,034
Under 5 Mortality Rate
90/1,000 Live Births 34,763 8,691 869 1,738 2,607
TOTAL 115,027 28,757 2,874 5,751 8,627
3,000 to 9,000 excess deaths in expecting mothers, prenatal, neonatal, infants and <5 years old due to the
floods in affected population

© 2010 TASC
© 2010 TASC

© 2010 TASC

© 2010 TASC
© 2010 TASC
© 2010 TASC

© 2010 TASC
© 2010 TASC 40

© 2010 TASC

© 2010 TASC

© 2010 TASC

© 2010 TASC

© 2010 TASC
© 2010 TASC

© 2010 TASC 47
© 2010 TASC

© 2010 TASC 49

© 2010 TASC 50

© 2010 TASC 52

© 2010 TASC

© 2010 TASC
© 2010 TASC
© 2010 TASC 57
© 2010 TASC 58

© 2010 TASC 59

© 2010 TASC 60
© 2010 TASC 61

© 2010 TASC 62

© 2010 TASC 63

© 2010 TASC 64
© 2010 TASC

© 2010 TASC
© 2010 TASC
© 2010 TASC 68

© 2010 TASC 69

© 2010 TASC 70
© 2010 TASC 71

© 2010 TASC 72
© 2010 TASC
© 2010 TASC
© 2010 TASC

© 2010 TASC

© 2010 TASC 77

© 2010 TASC 78

© 2010 TASC 79

© 2010 TASC

© 2010 TASC 81

© 2010 TASC
The ongoing floods in Pakistan have resulted in a critical need for health services for the affected population which even prior to the crisis had limited access to services
The inadequate health infrastructure, coupled with large scale population displacement forced by the floods means an increased risk of diseases and disabilities
Large numbers of people are being exposed to public health risks exacerbated by inadequate sanitation, compromised safe water supply, and food shortages
More than 20 million Pakistanis have been affected, out of which 10 million are in need of immediate humanitarian assistance-including an estimated 1.5 million women of childbearing age with 400,000 potentially pregnant
– Resulting in 3,000 to 9,000 excess deaths in the last three months alone among expecting mothers, prenatal, neonatal, infants and <5 years old
Pakistan has a high burden of infectious diseases
Poor and marginalized populations living in unsafe dilapidated living conditions in the IDP camps/in makeshift shelters and flood affected areas are disproportionately affected
Discussion
82

© 2010 TASC
Cases of acute watery diarrhea, cholera, typhoid, acute respiratory illnesses, malaria, dengue, measles, skin disease/disorders etc will continue to escalate and some will cause major outbreaks
The pre-existing high rate of chronic malnutrition in children (30-35% are stunted), combined with food insecurity and increased risk of disease, threatens to substantially increase the numbers of children with acute malnutrition
Patients with chronic diseases, such as TB, diabetes and cardiovascular diseases, HIV, face treatment interruption with consequential health risks
– One in three adults over the age of 45 years suffers from high blood pressure; and 10% have diabetes
– HIV/AIDS is a significant problem, with a concentrated epidemic among injecting drug users – HIV prevalence in this group has been reported to be between 10% to 20%
The health workforce has been affected by the flooding– At least 35,000 Lady Health Workers (LHW) have been displaced
Management capacity of the local health systems in the flood-affected districts has virtually collapsed
Discussion
83

© 2010 TASC
The district health authorities are currently not able to cope with the impact of the disaster
Approximately over 70% of the total health expenditure is from direct out-of-pocket payment and there is no functional social security system
The affected population has lost livelihoods and is unable to pay for health services
Following a disaster of this magnitude and severity, mental health problems are expected to increase
Discussion
84

© 2010 TASC
Pakistan's development prospects have been disrupted for many years
The damage to the economic infrastructure and livelihoods is immense
Irrigation, drainage and storage facilities are badly affected
Farmers who lost their crops and who are not able to plant their fields by November are likely to remain dependent on aid until well into 2012
Hundreds of thousands more lost their shops or other small businesses
Conclusion
85
United Nations estimate aid will be required for at least 2 years before Pakistan returns to its current degree of development
© 2010 TASC
Strong component of success will be
– Actual aid versus the pledges
– Sustained international assistance
– Political stability in Pakistan and the region
– Identifying the needs of the affected population
– Appropriate aid getting to the affected in a timely fashion
– Providing appropriate shelter and security
– Availability of skilled HCW
Discussion
86

© 2010 TASC
Strong component of success will be
– Provision of essential medicines and supplies including for life threatening communicable diseases, non-communicable and chronic diseases
– Basic emergency health services, including maternal and newborn/child health services (delivered through community-based services, mobile teams, static units and referral facilities)– Diarrhea Treatment Centers functioning in all affected districts– Under five year vaccinations against measles and polio, and vitamin A through
emergency mass vaccination campaigns– Delivery of preventive and curative malaria activities in all the endemic areas in
the affected districts
– Mental health care
– Scaling up of surveillance and the early warning system of epidemic prone diseases in all the affected districts
Discussion
87

© 2010 TASC
Strong component of success will be
– Managing the many national and international humanitarian health NGOs in the affected areas by strengthening of the local authorities’ governance role to avoid uncoordinated interventions that may undermine the future recovery of the health system
– Solutions with partners to remove financial barriers to enable access to services for at least as long as the humanitarian phase lasts
Discussion
88

© 2010 TASC © 2009 TASC89
UN Secretary-General Ban Ki-Moon
"I will never forget the destruction and suffering I
have witnessed”
“In the past I have witnessed many natural
disasters around the world, but nothing like this."
© 2010 TASC © 2009 TASC90