Embed Size (px)
Citation preview

Paisley Grammar - Mathematics Department
National 5 Homework/Revision Booklet
Applications
Order of Contents
Topic by topic: This homework should be completed as requested by your teacher.
1.1 Area of a Triangle
1.2 Sine and Cosine Rules
1.3 Bearings with Trigonometry
2.1 2D Vectors
2.2 3D Coordinates
2.3 Vector Components
3.1 Working with Percentages
3.2 Working with Fractions
4.1 Statistics: IQR and Standard Deviation
4.2 Equation of a Best Fitting Straight Line
Mixed Exercises: This homework is compulsory. You will be given a week to complete. Please ask your teacher for help if necessary.
Mixed Exercise 1
Mixed Exercise 2
Mixed Exercise 3
Mixed Exercise 4 – NAB Revision
Mixed Exercise 5 – Extension Test Revision

1.1 Area of a Triangle
Area 1
2absinC
End of Area of a Triangle review.
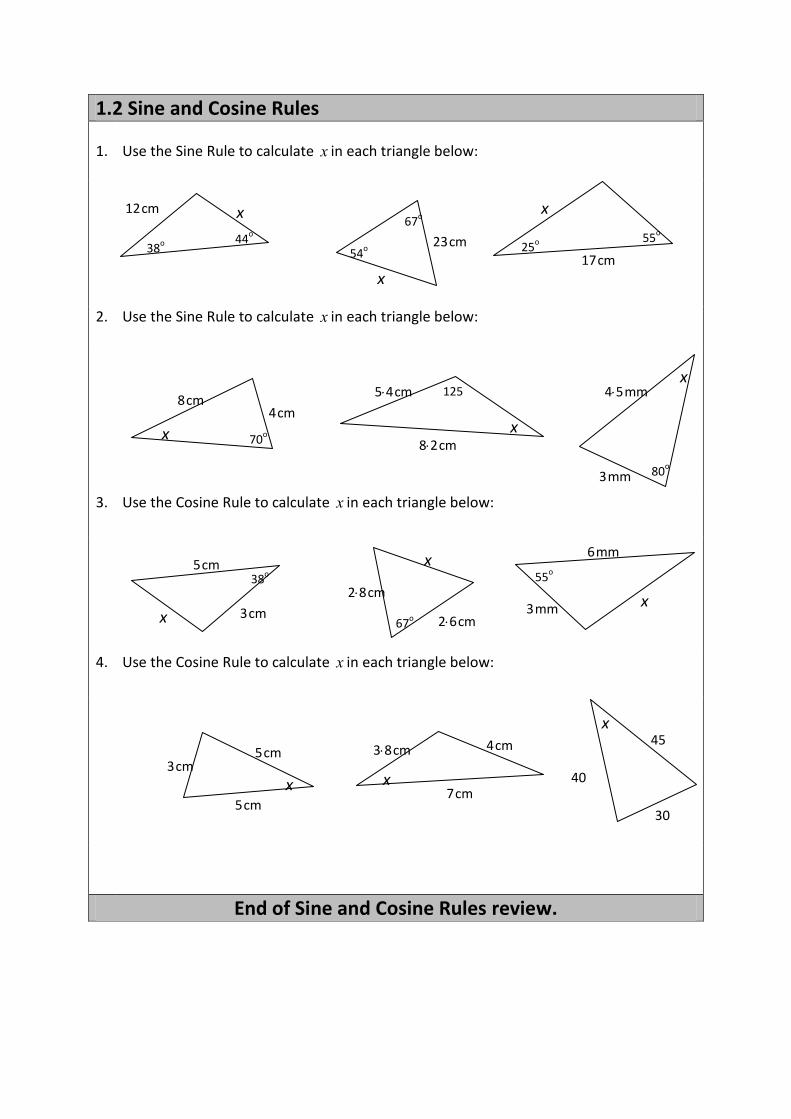
1.2 Sine and Cosine Rules 1.
Use the Sine Rule to calculate x in each triangle below:
2. Use the Sine Rule to calculate x in each triangle below:
3. Use the Cosine Rule to calculate x in each triangle below:
4. Use the Cosine Rule to calculate x in each triangle below:
End of Sine and Cosine Rules review.
x
x
x 12 cm
23 cm
17 cm 38
o
44o
54o
67o
25o
55o
x x
x
4 cm 8 cm
54 cm
82 cm
45 mm
3 mm
70o
125o
80o
x
x
x
5 cm 6 mm
38o
67o
55o
3 cm
28 cm
26 cm 3 mm
x x
x
3 cm 5 cm 38 cm
7 cm 5 cm
4 cm
30
mm
40
mm
45
mm

1.3 Bearings with Trigonometry 1.
A and B represent two forest look-out towers. A is 5km and on a bearing of 220o from B. A forest fire is sighted at F, on a bearing of 070o from A and 150o from B. A fire-fighting helicopter leaves A for F. What distance does this helicopter have to travel to reach the fire?
2. A ship sails from harbour H on a bearing of 084o for 340km until it reaches point P. It then sails on a bearing of 210o for 160km until it reaches point Q. (a) Calculate the distance between point Q and the harbour. (b) On what bearing must the ship sail to return directly to the harbour from Q?
3.
A surveyor is walking due west when he comes to a marsh. To avoid the marsh he turns at P and walks for 60 metres on a bearing of 215o and then for 85 metres on a bearing of 290o.
He then calculates the distance PR, the direct distance across the marsh. What answer should he get?
End of Bearings with Trigonometry review.
A
B
F
N
N 84o
H
210o
N
P
Q
340km
160km

2.1 2D Vectors 1. In the diagram below vectors k, l and m are represented by OK
u ruu, OL
u ruu and OM
u ruuu.
(a) Express KL
u ruu in terms of k and l.
(b) Express LMu ruu
in terms of l and m.
2. In the diagram below vectors a, b and c are represented by OAu ruu
, OBu ruu
and BCu ruu
.
(a) Express AB
u ruu in terms of a and b.
(b) Express OCu ruu
in terms of b and c.

3. In the diagram below vectors a, b and c are represented by OAu ruu
, OBu ruu
and OCu ruu
.
M is the midpoint of OBu ruu
.
(a) Express OM
u ruuu in terms of a, b and c.
(b) Express ACu ruu
in terms of a, b and c.
4. In the diagram below vectors m, n and p are represented by OMu ruuu
, ONu ruu
and OPu ruu
. R is the midpoint of NP.
(a) Express PN
u ruu in terms of m, n and p.
(b) Express ROu ruu
in terms of m, n and p.
End of 2D Vectors review.

2.2 3D Vectors 1.
With coordinate axes as shown, the point A is (2, 4, 6). Find the coordinates of B, C and D. Show that C is the midpoint of AD.
2. The first four levels of a stepped pyramid with a square base are shown below. Each level is a square-based cuboid with a height of 3 m. The shaded parts indicate the steps which have a “width” of 1 m. With coordinate axes as shown and 1 unit representing 1 metre, the coordinates of P and A are (12, 0, 0) and (24, 0, 0).
Find the coordinates of Q and R.
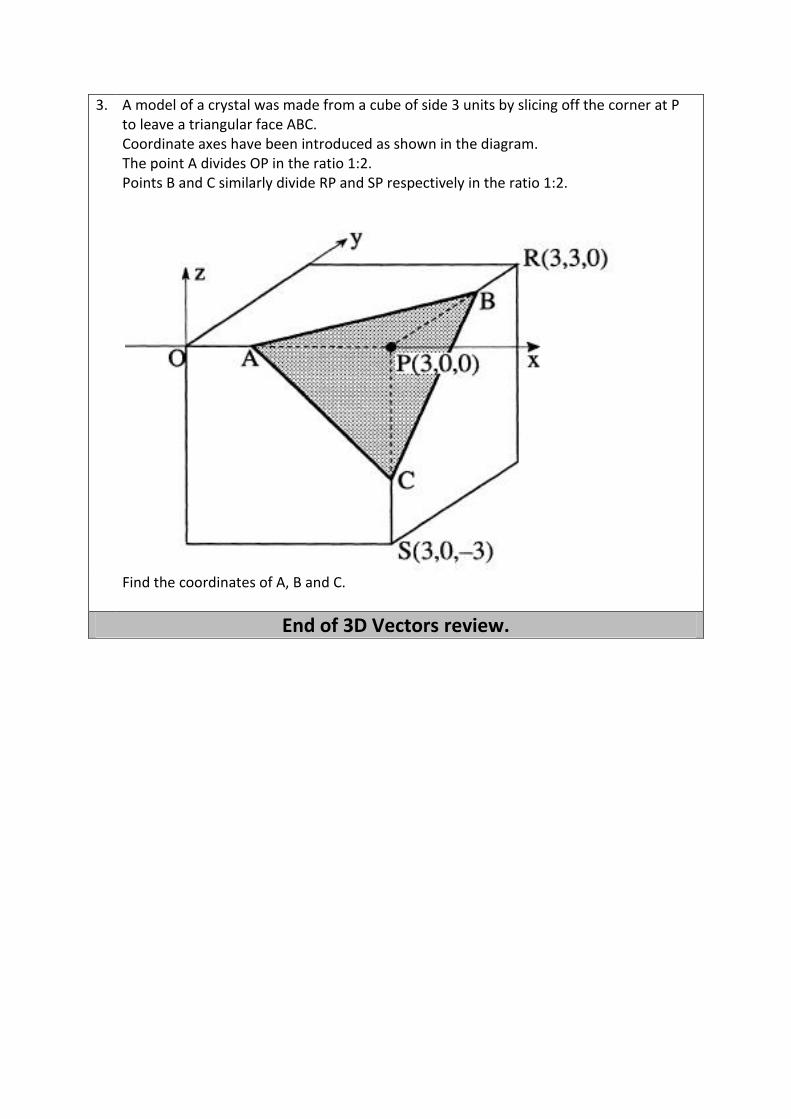
3. A model of a crystal was made from a cube of side 3 units by slicing off the corner at P to leave a triangular face ABC. Coordinate axes have been introduced as shown in the diagram. The point A divides OP in the ratio 1:2. Points B and C similarly divide RP and SP respectively in the ratio 1:2.
Find the coordinates of A, B and C.
End of 3D Vectors review.

2.3 Vector Components 1.
A is the point (-3, 2, 4) and B is (-1, 3, 2).
(a) Find the components of the vector ABu ruu
(b) Calculate the length of AB.
2. A cuboid crystal is placed relative to the coordinate axes as shown.
(a) Write down BCu ruu
in component form.
(b) Calculate BCu ruu
.
3. The line AB is divided into 3 equal parts by the points C and D as shown.
A and B have coordinates (3, -1, 2) and (9, 2, -4).
(a) Find the components of ABu ruu
and ACu ruu
. (b) Find the coordinates of C and D.
End of Vector Components review.

3.1 Working with Percentages 1.
A man invests £4500 in a Building Society at an interest rate of 4% per annum. How much will his investment be worth after 8 months?
2. A woman buys a car for £6700 and sells it for £4891 a year later. Calculate her percentage loss.
3. After restoring a boat a man sold it for £2511 and made a 35% profit. How much did he pay for the boat?
4. Calculate the total amount Eddie will have in his account after 3 years if he invests £1500 at the rate of 4% per annum.
5. Brenda buys a new car costing £12600.
It depreciates in value by 30% in the first year and by 20% each year after that. How much will she be able to trade it in for in 3 years time?
End of Working with Percentages review.
3.2 Working with Fractions 1.
Evaluate
31
612
3
2. Evaluate
41
311
2
3. Evaluate
22
314
5
4. Evaluate
2
311
3
5. Evaluate
2
311
21
3
End of Working with Fractions review.

4.1 Statistics: SIQR and Standard Deviation 1.
For each data set below establish the value of the median (Q2) and the quartiles Q1 and Q3.
Hence calculate the semi-interquartile range for each set.
(a) 4 4 5 6 8 10 10 10 12 13 18
(b) 23 32 32 34 35 40 41 47 50
(c) 4 4 5 7 8 9 9 9 12 14
(d) 23 34 38 46 58 71
2.
A sample of fifteen matchboxes was chosen from an assembly line. The number of matches in each box was recorded. The results are shown below. 65 63 66 62 61 61 62 62 63 64 59 61 60 63 64
(a) Calculate, correct to 3 significant figures, the mean and standard deviation of this
sample. (b) Boxes which contain less than one standard deviation of matches below the mean
are to be discarded and refilled. How many boxes in this sample would be discarded?
3. A group of students took part in an end of year assessment. The marks out of fifty for a sample of these students are listed below. 35 38 21 44 48 32 45 45 39 31 40
(a) A “highly commended” certificate is to be given to any student who has a mark that is more than one standard deviation above the mean. How many students in this sample would receive this certificate?
(b) Calculate, correct to 3 significant figures, the mean and standard deviation of this sample.
End of SIQR and Standard Deviation review.

4.2 Equation of a Best Fitting Straight Line 1.
For both of the following sets of points, the lines of best fit have been drawn for you. Choose two points on each line, find the gradient of it and write down its equation.
2. An ornithologist believes that the more bread he leaves out for the birds in the morning, the greater the number of different species he'll attract to his garden. Over a nine day period, he weighs out the bread and notes the number of species which land in his garden.
Weight (grams)
50 125 175 225 300 375 500 575 650
No. of species
3 4 6 6 8 9 13 13 15
(a) Use half centimetre squared paper to plot the results. (b) Draw the best fitting line through the set of points. (c) Find the equation of this line of the form y = mx +c. (d) Use your line to estimate how many species might be expected to land in the
garden when 400 grams of bread is left out.
3. (a) Use half centimetre squared paper to plot the following pairs of values.
x-value 1 3 5 8 12 15 16
y-value 4 61 63 92 125 141 15
(b) Draw, by eye, the best fitting line through the set of points. (c) Find the equation of this line in the form y = mx +c. (d) Use your equation to find the y-value when the x-value is 10.

4. A research team visits a remote island. As part of a conservation exercise the weight and length of each of ten birds of one particular species are taken. The results are shown on the scattergraph and the best fitting straight line has been drawn.
(a) Determine the equation of this line.
(b) Use the equation of this line to estimate the weight of a bird of length 30cm.
5. A production manager suspects that the number of defective items produced in a 15-minute period increases with the number of hours a workman has been working. A survey was taken of the number of defective items in each of ten 15-minute periods. The results are shown on the scattergraph and the best fitting straight line has been drawn.
(a) Determine the equation of this line.
(b) Use the equation of this line to forecast the number of defectives expected when the workmen have been working for 7 hours from starting.
End of Equation of a Best Fitting Straight Line review.

Mixed Exercise 1 – You may use a calculator 1.
Evaluate
22
311
5
2. Ian’s annual salary is £28 400. His boss tells him that his salary will increase by 23% per
annum. What will Ian’s salary be after 3 years? Give your answer to the nearest pound.
3. ABCDE is a regular pentagon with each side 1 centimetre.
Angle CDF is 72. EDF is a straight line.
Calculate the length of AC.
4. Tom looked at the cost of 10 different flights to New York. He calculated that the mean cost was £360 and the standard deviation was £74. A tax of £12 is then added to each flight. What is the new mean and standard deviation?
End of Mixed Exercise 1.

Mixed Exercise 2 – You may use a calculator 1.
Evaluate
1
9 21
6
2. It is estimated that an iceberg weighs 84 000 tonnes.
As the iceberg moves into warmer water, its weight decreases by 25% each day. What will the iceberg weigh after 3 days in the warmer water? Give your answer correct to three significant figures.
3. Alan sets off from campsite A on a bearing of 100 at an average speed of 56 kilometres per hour.
At the same time Bob sets off from campsite B on a bearing of 070.
After 3 hours they both arrive at campsite C. Who has the faster average speed and by how much?
4. The number of goals scored by each of twelve football teams in a season is shown below 38 33 35 57 60 53 50 52 55 73 80 62
(a) Find the upper quartile.
(b) Calculate the semi-interquartlie range.
End of Mixed Exercise 2.

Mixed Exercise 3 – You may use a calculator 1.
In the diagram RSTU, VWXY represents a cuboid.
SRuru
represents vector f, STu ru
represents vector g and SWu ruu
represents vector h.
Express VT
u ruu in terms of f, g and h.
2. Mark takes some friends out for a meal. The restaurant adds a 10% service charge to the price of the meal.
The total bill is £14850. What was the price of the meal?
3. A farmer builds a sheep-pen using two lengths of fencing and a wall.
The two lengths of fencing are 15 metres and 18 metres long.
Calculate the area of the sheep-pen, when the angle between the fencing is 70. What angle between the fencing would give the farmer the largest area?
End of Mixed Exercise 3.

Mixed Exercise 4 : Practice for NAB – You may use a calculator.
1. Billy wishes to pave a triangular plot of ground.
The diagram gives the dimensions of the plot.
Calculate the area of this plot to the nearest square metre.
2. The diagram shows how a golf ball was hit from the tee (T) to position B, a distance of 290 yards. The hole (H) is 380 yards from the tee.
What is the shortest distance between the golf ball and the hole?

3. Ocean buoys in the Atlantic are positioned at Kestrel (K), Wagtail (W) and Pelican (P) as shown in the diagram below.
Kestrel is 180 kilometres from Pelican. Wagtail is 390 kilometres from Pelican. Pelican is on a bearing of 125° from Kestrel. Calculate the bearing of Pelican from Wagtail. Give your answer to the nearest degree.
P
N
W
K
390 km
125
180 km

4.
5. The diagram below shows a square based model of a glass pyramid of height 9 cm. Square OABC has a side length of 6 cm. The coordinates of A are (6, 0, 0). C lies on the y-axis.
Write down the coordinates of D.
6. The forces acting on a body are represented by three vectors p, q and r as
O
C
A (6, 0, 0)
B
D
x
y
z

given below.
p
4
2
3.5
,Ê
q
5.5
8.5
6.5
,
r
4
6.5
10
Find the resultant force.
7. Vector
a 6
3
and vector
b 3
0
.
Calculate 2a 3b .
8. Jaspreet bought a new car for £12 000. Its value decreased by 8% each year. Find the value of the motorbike after 3 years.
9. Jennifer measures the length and breadth of a table top as shown in the diagram below.
Calculate the exact area of the table top (in m2).
3
2
3Êm
Ê4
3
5mÊ

10. A trainee in a garden centre monitors the growth of a young plant. The height of the plant is found to increase by 16% to 48 cm. Find the height of the plant when the trainee started to monitor it.
11. The table below shows the monthly profits made by an electrical company X during the period January to July 2012. Profits are in millions of euros.
(a) (b)
Calculate the mean and standard deviation of Company X’s profits during this 7-month period. During this 7-month period, another company, Company Y, had monthly profits with a mean of 20·68 million euros and a standard deviation of 1·3 million euros.
Using these statistics, compare the profits of the two companies and make two valid comparisons.

12. A group of students sat tests in mathematics and physics and their results are shown on the scattergraph below. The results from the test were plotted in the scatter graph below.
(a) (b) (c)
Determine the gradient and the y-intercept of the line of best fit shown. Using these values for the gradient and the y-intercept, write down the equation of the line. Another pupil scored 64% in the mathematics test but was absent from the physics test. Use your answer to part (b) to predict her physics mark.
End of Mixed Exercise 4.

Mixed Exercise 5: Test Revision – You may use a calculator 1. A regular pentagon ABCDE is drawn in a circle, centre O, with radius 10
centimetres.
Calculate the area of the regular pentagon.
2. The diagram shows a square-based pyramid P, QRST.
TSuru
, TQu ruu
and TPuru
represent f, g and h respectively.
Express RPu ruu
in terms of f, g and h.

3. The diagram shows two blocks of flats of equal height.
A and B represent points on the top of the flats and C represents a point on the ground between them. To calculate the height, h, of each block of flats, a surveyor measures the angles of depression from A and B to C.
From A, the angle of depression is 38.
From B, the angle of depression is 46. The distance AB is 30 metres. Calculate the height, h, in metres.
4. Gordon and Brian leave a hostel at the same time.
Gordon walks on a bearing of 045 at a speed of 44 kilometres per hour.
Brian walks on a bearing of 100 at a speed of 48 kilometres per hour. If they both walk at steady speeds, how far apart will they be after 2 hours?

5. The diagram shows a cuboid OABC, DEFG. F is the point (8,4,6). P divides AE in the ratio 2:1. Q is the midpoint of CG.
(a) State the coordinates of P and Q
(b) Write down the
components of PQu ruu
and PAu ruu
6. Evaluate
2
511
10
7. A company makes large bags of crisps which contain 90 grams of fat. The company aim to reduce the fat content of the crisps by 50%. They decide to reduce the fat content by 20% each year. Will they have achieved their aim by the end of the 3rd year? Justify your answer.
8. Teams in a quiz answer questions on film and sport. This scatter graph shows the scores of some of the teams.
A line of best fit is drawn as shown above.
(a) Find the equation of this straight line.
(b) Use this equation to estimate the sport score for a team with a film score of 20.

9. (a) Show that the standard deviation of 1, 1, 1, 2 and 5 is equal to 3 .
(b) Write down the standard deviation of 101, 101, 101, 102 and 105.
10. This back-to-back stem and leaf diagram shows the results for a class in a recent mathematics examination.
(a) A boxplot is drawn to represent one set of data.
Does the boxplot above represent the girls’ data or the boys’ data? Give a reason for your answer.
(b) For the other set of data, find: (i) the median; (ii) the lower quartile; (iii) the upper quartile.
(c) Use the answers found in part (b) to construct a second boxplot. (d) Make an appropriate comment about the distribution of data in the two
sets.
End of Mixed Exercise 5.