Embed Size (px)
Citation preview

Package ‘microplot’January 11, 2018
Type Package
Title Microplots (Sparklines) in 'LaTeX', 'Word', 'HTML', 'Excel'
Version 1.0-25
Date 2018-01-08
Author Richard M. Heiberger, with contributions from Karen Byron and Nooreen Dabbish.
Maintainer Richard M. Heiberger <[email protected]>
DescriptionThe microplot() function writes a set of R graphics files to be used as microplots (sparklines) in ta-bles in either 'LaTeX', 'HTML', 'Word', or 'Excel' files. For 'LaTeX', use the 'Hmisc::latex' func-tion or 'xtable::xtable' function to construct 'latex' tabular environments which in-clude the graphs. These can be used directly with the operating system 'pdflatex' or 'latex' com-mand, or by using one of 'Sweave', 'knitr', 'rmarkdown', or 'Emacs' 'org-mode' as an intermedi-ary. For 'Word', the MSWord* functions use the 'ReporteRs::FlexTable' and 'Re-porteRs::pot_img' functions to construct 'Word' tables which include the graphs. There are sev-eral distinct approaches for constructing HTML file. The simplest is to use the MSWord* with ar-gument 'filetype=``html'''. Alternatively, use either 'Emacs' 'org-mode' or the 'htmlTable::htmlTable' function to construct an 'HTML' file containing ta-bles which include the graphs. For 'Excel' use on 'Windows', the file 'examples/irisExcel.xls' in-cludes 'VBA' code which brings the individual panels into individual cells in the spread-sheet. Examples in the 'examples' subdirectory and demos are shown with 'lattice' graph-ics, 'base' graphics, and 'ggplot2' graphics. Examples for 'LaTeX' include 'Sweave' (both 'La-TeX'-style and 'Noweb'-style), 'knitr', 'emacs' 'org-mode', and 'rmarkdown' in-put files and their 'pdf' output files. Examples for 'HTML' include 'org-mode' and 'Rmd' in-put files and their webarchive 'HTML' output files. In addition, the 'as.orgtable' func-tion can display a 'data.frame' in an 'org-mode' document. The examples for 'Word' (with ei-ther 'filetype=``docx''' or 'filetype=``html''') work with all operating systems. The pack-age does not require the installation of 'LaTeX' or 'Word' to be able to write '.tex' or '.docx' files.
Imports Hmisc, HH, lattice, grid, ReporteRs, ggplot2, htmltools
Suggests reshape2, latticeExtra, xtable, markdown, rmarkdown, knitr,htmlTable
License GPL (>= 2)
NeedsCompilation no
Repository CRAN
Date/Publication 2018-01-10 23:34:49 UTC
1

2 microplot-package
R topics documented:microplot-package . . . . . . . . . . . . . . . . . . . . . . . . . . . . . . . . . . . . . 2as.htmlimg . . . . . . . . . . . . . . . . . . . . . . . . . . . . . . . . . . . . . . . . . 10as.includegraphics . . . . . . . . . . . . . . . . . . . . . . . . . . . . . . . . . . . . . . 11as.orgfile . . . . . . . . . . . . . . . . . . . . . . . . . . . . . . . . . . . . . . . . . . . 14as.orgtable . . . . . . . . . . . . . . . . . . . . . . . . . . . . . . . . . . . . . . . . . . 15latex.AEdotplot . . . . . . . . . . . . . . . . . . . . . . . . . . . . . . . . . . . . . . . 16latex.trellis . . . . . . . . . . . . . . . . . . . . . . . . . . . . . . . . . . . . . . . . . 17latexCheckOptions . . . . . . . . . . . . . . . . . . . . . . . . . . . . . . . . . . . . . 20layoutCollapse . . . . . . . . . . . . . . . . . . . . . . . . . . . . . . . . . . . . . . . 21microplot . . . . . . . . . . . . . . . . . . . . . . . . . . . . . . . . . . . . . . . . . . 23microplot.AEdotplot . . . . . . . . . . . . . . . . . . . . . . . . . . . . . . . . . . . . 25MSWord . . . . . . . . . . . . . . . . . . . . . . . . . . . . . . . . . . . . . . . . . . . 28MSWord_TablePlusGraphicColumn . . . . . . . . . . . . . . . . . . . . . . . . . . . . 30pdfMicroplotTrellis . . . . . . . . . . . . . . . . . . . . . . . . . . . . . . . . . . . . . 32theme_collapse . . . . . . . . . . . . . . . . . . . . . . . . . . . . . . . . . . . . . . . 33
Index 35
microplot-package Microplots (Sparklines) in ’LaTeX’, ’Word’, ’HTML’, ’Excel’
Description
The microplot() function writes a set of R graphics files to be used as microplots (sparklines) intables in either ’LaTeX’, ’HTML’, ’Word’, or ’Excel’ files. For ’LaTeX’, use the ’Hmisc::latex’function or ’xtable::xtable’ function to construct ’latex’ tabular environments which include thegraphs. These can be used directly with the operating system ’pdflatex’ or ’latex’ command, orby using one of ’Sweave’, ’knitr’, ’rmarkdown’, or ’Emacs’ ’org-mode’ as an intermediary. For’Word’, the MSWord* functions use the ’ReporteRs::FlexTable’ and ’ReporteRs::pot_img’ func-tions to construct ’Word’ tables which include the graphs. There are several distinct approachesfor constructing HTML file. The simplest is to use the MSWord* with argument ’filetype="html"’.Alternatively, use either ’Emacs’ ’org-mode’ or the ’htmlTable::htmlTable’ function to constructan ’HTML’ file containing tables which include the graphs. For ’Excel’ use on ’Windows’, thefile ’examples/irisExcel.xls’ includes ’VBA’ code which brings the individual panels into indi-vidual cells in the spreadsheet. Examples in the ’examples’ subdirectory and demos are shownwith ’lattice’ graphics, ’base’ graphics, and ’ggplot2’ graphics. Examples for ’LaTeX’ include’Sweave’ (both ’LaTeX’-style and ’Noweb’-style), ’knitr’, ’emacs’ ’org-mode’, and ’rmarkdown’input files and their ’pdf’ output files. Examples for ’HTML’ include ’org-mode’ and ’Rmd’ inputfiles and their webarchive ’HTML’ output files. In addition, the ’as.orgtable’ function can displaya ’data.frame’ in an ’org-mode’ document. The examples for ’Word’ (with either ’filetype="docx"’or ’filetype="html"’) work with all operating systems. The package does not require the installationof ’LaTeX’ or ’Word’ to be able to write ’.tex’ or ’.docx’ files.
Details
The DESCRIPTION file:

microplot-package 3
Package: microplotType: PackageTitle: Microplots (Sparklines) in ’LaTeX’, ’Word’, ’HTML’, ’Excel’Version: 1.0-25Date: 2018-01-08Author: Richard M. Heiberger, with contributions from Karen Byron and Nooreen Dabbish.Maintainer: Richard M. Heiberger <[email protected]>Description: The microplot() function writes a set of R graphics files to be used as microplots (sparklines) in tables in either ’LaTeX’, ’HTML’, ’Word’, or ’Excel’ files. For ’LaTeX’, use the ’Hmisc::latex’ function or ’xtable::xtable’ function to construct ’latex’ tabular environments which include the graphs. These can be used directly with the operating system ’pdflatex’ or ’latex’ command, or by using one of ’Sweave’, ’knitr’, ’rmarkdown’, or ’Emacs’ ’org-mode’ as an intermediary. For ’Word’, the MSWord* functions use the ’ReporteRs::FlexTable’ and ’ReporteRs::pot_img’ functions to construct ’Word’ tables which include the graphs. There are several distinct approaches for constructing HTML file. The simplest is to use the MSWord* with argument ’filetype="html"’. Alternatively, use either ’Emacs’ ’org-mode’ or the ’htmlTable::htmlTable’ function to construct an ’HTML’ file containing tables which include the graphs. For ’Excel’ use on ’Windows’, the file ’examples/irisExcel.xls’ includes ’VBA’ code which brings the individual panels into individual cells in the spreadsheet. Examples in the ’examples’ subdirectory and demos are shown with ’lattice’ graphics, ’base’ graphics, and ’ggplot2’ graphics. Examples for ’LaTeX’ include ’Sweave’ (both ’LaTeX’-style and ’Noweb’-style), ’knitr’, ’emacs’ ’org-mode’, and ’rmarkdown’ input files and their ’pdf’ output files. Examples for ’HTML’ include ’org-mode’ and ’Rmd’ input files and their webarchive ’HTML’ output files. In addition, the ’as.orgtable’ function can display a ’data.frame’ in an ’org-mode’ document. The examples for ’Word’ (with either ’filetype="docx"’ or ’filetype="html"’) work with all operating systems. The package does not require the installation of ’LaTeX’ or ’Word’ to be able to write ’.tex’ or ’.docx’ files.Imports: Hmisc, HH, lattice, grid, ReporteRs, ggplot2, htmltoolsSuggests: reshape2, latticeExtra, xtable, markdown, rmarkdown, knitr, htmlTableLicense: GPL (>= 2)
Index of help topics:
MSWord Generate a .docx or .html file from an Robject.
MSWord_TablePlusGraphicColumnConstruct an 'MS Word' file containing a tablewith several columns of numbers and one columnof graphics.
as.htmlimg Place a filename or filepath in the format usedby HTML
as.includegraphics Convert a filename into a complete LaTeX'includegraphics' command. This is useful for'pdf', 'png', and 'jpeg' files that arerecognized by the LaTeX 'includegraphics' macroin the 'graphicx' package when used with the'pdflatex' command. This is useful for 'ps','bmp', and 'tiff' files that are recognized bythe LaTeX 'includegraphics' macro in the'graphicx' package when used with the 'latex'command.
as.orgfile Place a filename or filepath in the format usedby org-mode
as.orgtable Prepare a matrix or data.frame to be used as anorg-mode table
latex.AEdotplot Display the AE (Adverse Events) dotplot ofincidence and relative risk in a 'LaTeX'tabular environment or in an 'MS Word' or an'HTML' table.
latex.trellis Hmisc::latex method for "trellis" objects.latexCheckOptions Check whether the options for latex functions
have been specified.layoutCollapse Set the lattice 'par.settings' to remove all
marginal space.microplot Take a trellis or ggplot object and generate a
set of graphics files, one per panel of a

4 microplot-package
multi-panel display.microplot-package Microplots (Sparklines) in 'LaTeX', 'Word',
'HTML', 'Excel'microplot.AEdotplot Take apart a '"AEdotplot"' object and construct
a set of graphics files each of the AdverseEvents.
pdfMicroplot_yfactorGgplotInternal subroutines used by microplot.ggplotand microplot_yfactor.ggplot to write theindividual graphics files.
theme_collapse Set the 'ggplot2' theme to remove all marginalspace.
Microplots are small plots that fit into the cells of a table that otherwise consists of text and numbers.A special case of a microplot is known as a sparkline.
The examples in this package show tables of simple or complex graphs placed into one or morecolumns of a table. The graphs can be produced by any graphical system in ’R’. We show lattice,base, and ggplot2 graphics. The tables can be targeted for display in ’LaTeX’, ’MS Word’, ’MSExcel’, or ’HTML’. We show examples of each.
The best way to learn this package is to read the examples and demo files. The primary functionmicroplot takes a trellis or ggplot object and generates a set of graphics files, one per panel ofa multi-panel display.
The latex examples (in the examples subdirectory) and demo files use operating system pdflatexor latex command and the ’R’ pdf() graphics device. They therefore require that the three optionsoptions()[c("latexcmd","dviExtension","xdvicmd")]all be set to non-NULL values. Please see the "System options" in the "Details" section oflatex for discussion of the options available.
I normally use the optionsoptions(latexcmd="pdflatex")options(dviExtension="pdf")on Macintosh, on Windows, on Linux.
The "xdvicmd" option is dependent on details of the operating system. The goal is to name thefunction that opens pdf files. In order to open pdf files, the "xdvicmd" option must be specified.On systems I have used, this works
if (nchar(Sys.which("open"))) {options(xdvicmd="open") ## Macintosh, Windows, SMP linux
} else {options(xdvicmd="xdg-open") ## ubuntu linux
}
For anything else, you might need to experiment.
Should you prefer to use the operating system latex command to write dvi files, then leave thefirst two options unspecified. You might need to change the "xdvicmd". See latex for guidance.Also you will need to modify the examples to specify a different ’R’ device function instead of thepdf function used here.
microplot-package 5
The examples in this DESCRIPTION file are inside dontrun environments because they depend onoptions and they write files. You must set the options for your system before running the examplemanually.
Most of the examples are shown using the Hmisc::latex function latex (I am coauthor of thatfunction). The microplot package also works with the xtable::xtable function xtable. The lastexample in this help file shows a simple use of xtable
The demos in the demo directory are not inside a dontrun environment. You must set the optionsfor your system before running them. I recommend that you run them manually, not automatically.You will need to read them closely to see what they are doing.
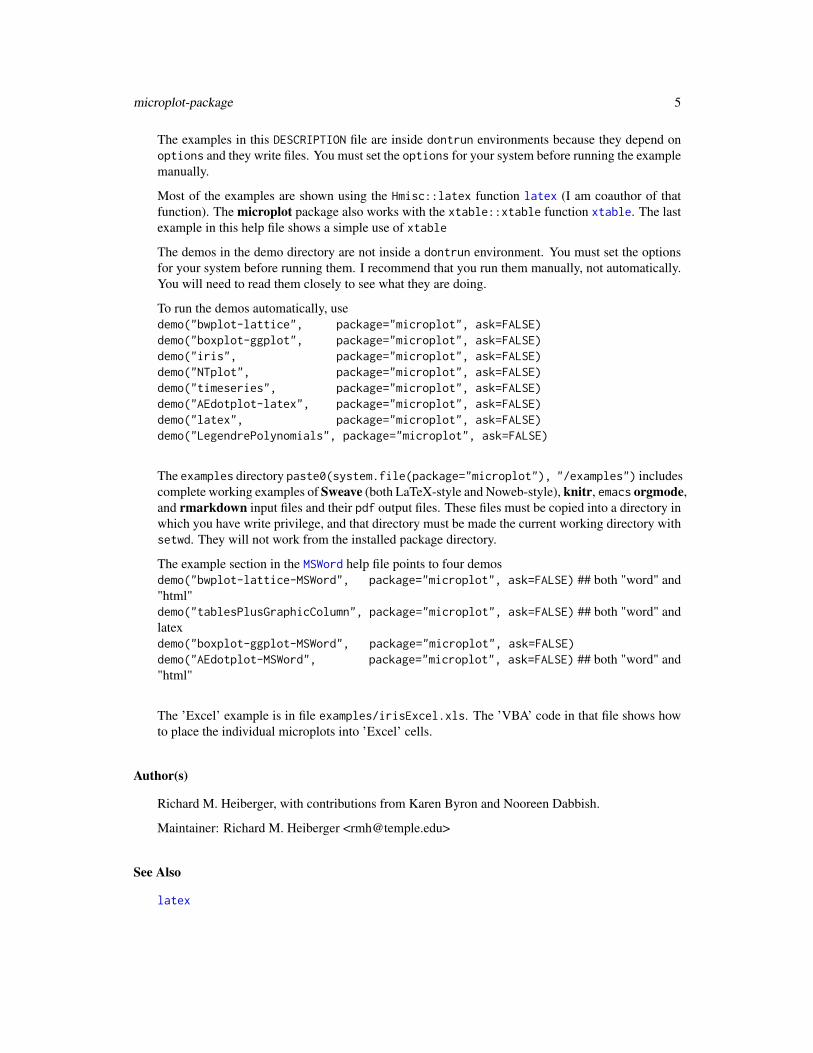
To run the demos automatically, usedemo("bwplot-lattice", package="microplot", ask=FALSE)demo("boxplot-ggplot", package="microplot", ask=FALSE)demo("iris", package="microplot", ask=FALSE)demo("NTplot", package="microplot", ask=FALSE)demo("timeseries", package="microplot", ask=FALSE)demo("AEdotplot-latex", package="microplot", ask=FALSE)demo("latex", package="microplot", ask=FALSE)demo("LegendrePolynomials", package="microplot", ask=FALSE)
The examples directory paste0(system.file(package="microplot"), "/examples") includescomplete working examples of Sweave (both LaTeX-style and Noweb-style), knitr, emacs orgmode,and rmarkdown input files and their pdf output files. These files must be copied into a directory inwhich you have write privilege, and that directory must be made the current working directory withsetwd. They will not work from the installed package directory.
The example section in the MSWord help file points to four demosdemo("bwplot-lattice-MSWord", package="microplot", ask=FALSE) ## both "word" and"html"demo("tablesPlusGraphicColumn", package="microplot", ask=FALSE) ## both "word" andlatexdemo("boxplot-ggplot-MSWord", package="microplot", ask=FALSE)demo("AEdotplot-MSWord", package="microplot", ask=FALSE) ## both "word" and"html"
The ’Excel’ example is in file examples/irisExcel.xls. The ’VBA’ code in that file shows howto place the individual microplots into ’Excel’ cells.
Author(s)
Richard M. Heiberger, with contributions from Karen Byron and Nooreen Dabbish.
Maintainer: Richard M. Heiberger <[email protected]>
See Also
latex
6 microplot-package
Examples
## Not run:
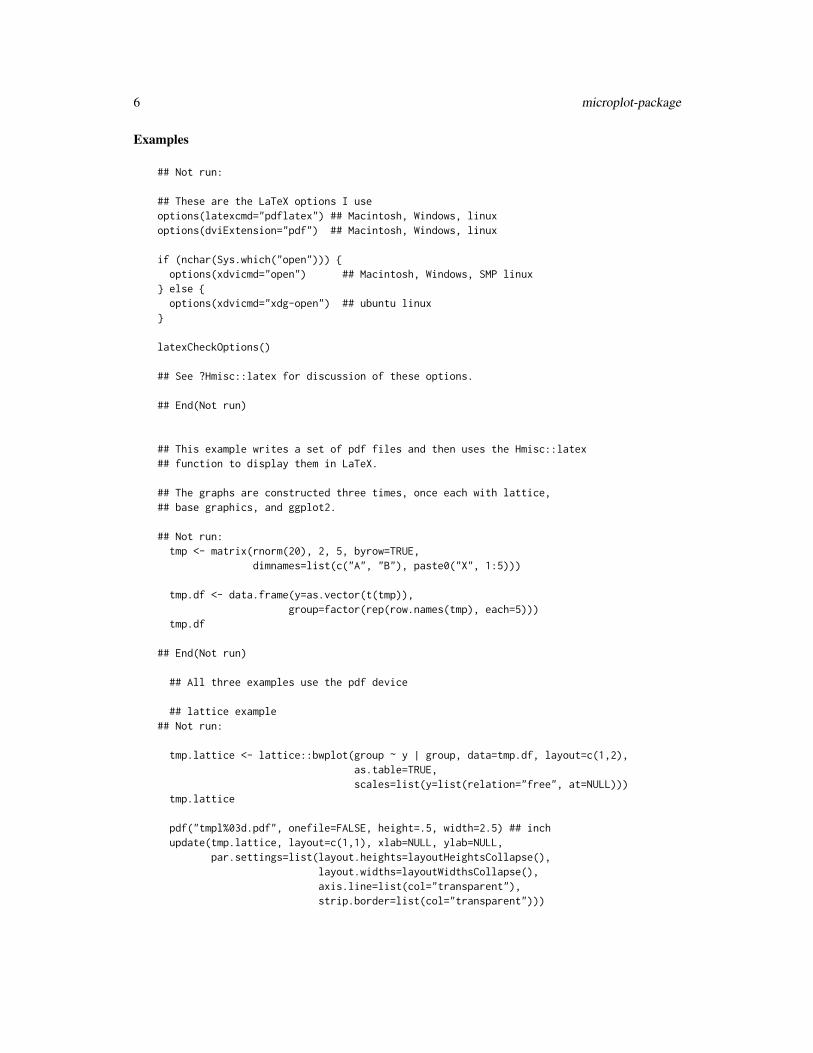
## These are the LaTeX options I useoptions(latexcmd="pdflatex") ## Macintosh, Windows, linuxoptions(dviExtension="pdf") ## Macintosh, Windows, linux
if (nchar(Sys.which("open"))) {options(xdvicmd="open") ## Macintosh, Windows, SMP linux
} else {options(xdvicmd="xdg-open") ## ubuntu linux
}
latexCheckOptions()
## See ?Hmisc::latex for discussion of these options.
## End(Not run)
## This example writes a set of pdf files and then uses the Hmisc::latex## function to display them in LaTeX.
## The graphs are constructed three times, once each with lattice,## base graphics, and ggplot2.
## Not run:tmp <- matrix(rnorm(20), 2, 5, byrow=TRUE,
dimnames=list(c("A", "B"), paste0("X", 1:5)))
tmp.df <- data.frame(y=as.vector(t(tmp)),group=factor(rep(row.names(tmp), each=5)))
tmp.df
## End(Not run)
## All three examples use the pdf device
## lattice example## Not run:
tmp.lattice <- lattice::bwplot(group ~ y | group, data=tmp.df, layout=c(1,2),as.table=TRUE,scales=list(y=list(relation="free", at=NULL)))
tmp.lattice
pdf("tmpl%03d.pdf", onefile=FALSE, height=.5, width=2.5) ## inchupdate(tmp.lattice, layout=c(1,1), xlab=NULL, ylab=NULL,
par.settings=list(layout.heights=layoutHeightsCollapse(),layout.widths=layoutWidthsCollapse(),axis.line=list(col="transparent"),strip.border=list(col="transparent")))

microplot-package 7
dev.off()
tmpl.graphnames <- paste0("tmpl", sprintf("%03i", 1:2), ".pdf")
tmpl.display <-data.frame(round(tmp, 2),
graphs=as.includegraphics(tmpl.graphnames, raise="-3.5ex"))## retains dimensions from pdf() statement
tmpl.displaytmpl.latex <- Hmisc::latex(tmpl.display)tmpl.latex$style <- "graphicx"tmpl.latex ## this line requires latex in the PATH, and Hmisc to be loaded## Hmisc::print.latex(tmpl.latex) ## if Hmisc is not loaded
tmplw.display <-data.frame(round(tmp, 2),
graphs=as.includegraphics(tmpl.graphnames, width="1in", raise="-1.01ex"))tmplw.displaytmplw.latex <- Hmisc::latex(tmplw.display)tmplw.latex$style <- "graphicx"tmplw.latex ## this line requires latex in the PATH, and Hmisc to be loaded## Hmisc::print.latex(tmpl.latex) ## if Hmisc is not loaded
## repeat using the latex.trellis methodHmisc::latex(update(tmp.lattice,
scales=list(y=list(relation="free"))),raise="-2ex",height=.3, width=3, ## inchesfigPrefix="tmp", x.axis=TRUE, y.axis=FALSE)
## End(Not run)
## base graphics example## Not run:
pdf("tmpb%03d.pdf", onefile=FALSE, height=.5, width=3) ## inchpar( bty="n", xaxt="n", omd=c(0,1, 0,1), mai=c(0,0,0,0))boxplot(tmp["A",], horizontal=TRUE, ylim=range(tmp)) ## ylim for horizontal plotboxplot(tmp["B",], horizontal=TRUE, ylim=range(tmp)) ## ylim for horizontal plotdev.off()
tmpb.graphnames <- paste0("tmpb", sprintf("%03i", 1:2), ".pdf")
tmpb.display <-data.frame(round(tmp, 2),
graphs=as.includegraphics(tmpb.graphnames, height="2em", raise="-1.4ex"))tmpb.display
tmpb.latex <- Hmisc::latex(tmpb.display)tmpb.latex$style <- "graphicx"tmpb.latex ## this line requires latex in the PATH, and Hmisc to be loaded## Hmisc::print.latex(tmpb.latex) ## if Hmisc is not loaded

8 microplot-package
## End(Not run)
## Not run:## ggplot2 example, whole set constructed as a unit, then printed one panel at a time.
library(ggplot2)
tmpga <-ggplot(tmp.df, aes(group, y)) +geom_boxplot(outlier.size = 8) +coord_flip() +theme_collapse()
tmpga ## on interactive device
pdf("tmpga%03d.pdf", onefile=FALSE, height=1, width=4) ## inchfor (i in 1:length(levels(tmp.df$group))) {
tmpga$coordinates$limits$x <- c(i, i) ## I dislike this usage.## I want to use "+" with some ggplot2 function,## but have not figured out the right incantation.
print(tmpga)}dev.off()
graphnames <- paste0("tmpga", sprintf("%03i", 1:2), ".pdf")
tmpga.display <-data.frame(round(tmp, 2),
graphs=as.includegraphics(graphnames, height="1.5em", raise="-.7ex"))tmpga.display
tmpga.latex <- Hmisc::latex(tmpga.display)tmpga.latex$style <- "graphicx"tmpga.latex ## this line requires latex in the PATH, and Hmisc to be loaded## Hmisc::print.latex(tmpga.latex) ## if Hmisc is not loaded
## ggplot2 example, constructed one panel at a time.
pdf("tmpgb%03d.pdf", onefile=FALSE, height=1, width=4) ## inchggplot(tmp.df[1:5,], aes(group, y)) +geom_boxplot(outlier.size = 8) + ylim(range(tmp.df[,1])) +
coord_flip() +theme_collapse()
ggplot(tmp.df[6:10,], aes(group, y)) +geom_boxplot() + ylim(range(tmp.df[,1])) +
coord_flip() +theme_collapse()
dev.off()
graphnames <- paste0("tmpgb", sprintf("%03i", 1:2), ".pdf")
tmpgb.display <-

microplot-package 9
data.frame(round(tmp, 2),graphs=as.includegraphics(graphnames, height="1.5em", raise="-.7ex"))
tmpgb.display
tmpgb.latex <- Hmisc::latex(tmpgb.display)tmpgb.latex$style <- "graphicx"tmpgb.latex ## this line requires latex in the PATH, and Hmisc to be loaded## Hmisc::print.latex(tmpgb.latex) ## if Hmisc is not loaded
detach("package:ggplot2")
## End(Not run)
## MS Word example. Uses functions in ReporteRs package.## Not run:
## uses tmp.df and tmp.lattice from above examples
tmplw.graphnames <- microplot(tmp.lattice,height=.3, width=3, ## inchesdevice="png")
tmplw.docx <- MSWord_TablePlusGraphicColumn(format(tmp, digits=2), title="bwplot",rowname.header="group",data.header="data values",graph.header="bwplot",panel.files=tmplw.graphnames,axis.files=attr(tmplw.graphnames, "axis.names"),height=.3, width=3, ## inches, must be same as in microplot() callFlexTableWidths=c(.7, ## inches, rownames count as a column
rep(.5, 5), ## inches, for each data column3), ## inches, for graphs, must be same as width
rmh.borders=TRUE,caption="Lattice bwplot using MSWord_TablePlusGraphicColumn function")
tmplw.docx # file namesystem(paste("open", tmplw.docx)) ## cut and paste this graph into a larger .docx file.
## End(Not run)
## xtable example## Not run:
tmpl.display ## from lattice example abovetmplx.name <- "tmpldisplayxtable.tex"print(xtable::xtable(tmpl.display),
caption.placement = "top",sanitize.text.function = function(x) x, ## xtable converts "\abc" to "$\backslash$abc"
file=tmplx.name) ## sanitize restores it back to "\abc".tmpx.latex <- list(file=tmplx.name, style="graphicx")class(tmpx.latex) <- "latex"
tmpx.latex ## this line requires latex in the PATH, and Hmisc to be loaded## Hmisc::print.latex(tmpx.latex) ## if Hmisc is not loaded

10 as.htmlimg
## End(Not run)
## Please see the demos for more interesting examples.## demo(package="microplot")
as.htmlimg Place a filename or filepath in the format used by HTML
Description
Place a filename or filepath in the format used by HTML, by surrounding it with "<img src" and"/>" and with possible additional arguments between.
Usage
as.htmlimg(object, height = "80", width = NULL, wd = getwd(), align = "middle")
Arguments
object Vector of character strings containing filenames.
height, width Number of pixels as a character string.
wd The directory in which the files reside. The default is the current working direc-tory that R is using.
align Specifies the alignment of an image according to surrounding elements (Notsupported in HTML5). One of the strings: "top", "bottom", "middle", "left","right"
Value
A character vector containing the input strings surrounded by "<img src" and "/>" and withpossible additional arguments between.
Author(s)
Nooreen Dabbish <[email protected]> and Richard M. Heiberger <[email protected]>
See Also
microplot

as.includegraphics 11
Examples
as.htmlimg("abcd.png")as.htmlimg("abcd.png", wd=".")as.htmlimg(c("abcd.png", "efgh.png"))cat( as.htmlimg("abcd.png") , "\n")cat( as.htmlimg("abcd.png", wd=".") , "\n")cat( paste(as.htmlimg(c("abcd.png", "efgh.png")), "\n"))
## For an example in context, please see the package example:## system.file(package="microplot", "examples/irisRMarkdownHtml.Rmd")## Copy file irisRMarkdownHtml.Rmd to a directory in which you have write privileges.## Run the statement## rmarkdown::render("irisRMarkdownHtml.Rmd", output_file="irisRMarkdownHtml.html")## at the R Console.
as.includegraphics Convert a filename into a complete LaTeX includegraphics com-mand. This is useful for pdf, png, and jpeg files that are recognizedby the LaTeX includegraphics macro in the graphicx package whenused with the pdflatex command. This is useful for ps, bmp, and tifffiles that are recognized by the LaTeX includegraphics macro in thegraphicx package when used with the latex command.
Description
Convert a filename into a complete ’LaTeX’ includegraphics command. The directory name isincluded in the command. The includegraphics macro is generated with the height and optionalwidth. An optional raise value is available for vertical alignment. An optional trim argumentis available to remove excess margins from the image. See the Details section for use of the trimargument to trim panels in an externally produced graphics file.
Usage
as.includegraphics(object,height=NULL, ## LaTeX measurement (character)
width=NULL, ## retains original aspect ratio, LaTeX measurement (character)scale=NULL, ## numberraise=NULL, ## LaTeX measurement (character)hspace.left=NULL, ## LaTeX measurement (character)hspace.right=NULL, ## LaTeX measurement (character)wd=getwd(), ## working directory
viewport=NULL, ## if specified, then left bottom right top (character)## used for pdf png jpeg## See MediaBox in pdf file.## Ask operating system for png or jpg file.bb=NULL, ## if specified, then left bottom right top (character)## used for bmp tiff ps, ask operating system for values

12 as.includegraphics
trim=NULL, ## for example, "0 0 0 0" left bottom right top (character)x.axis=TRUE, ## may be logical or a list of argumentsy.axis=TRUE, ## may be logical or a list of argumentskey=FALSE) ## may be logical or a list of arguments
Arguments
object A character vector or matrix of filenames for graphics files. The argumentmay include attribues axis.names and keyname for graphics files containingthe x.axis, y.axis, and key (legend). attributes,
scale Scale factor (number) applied to figure. If height or width is specified, thenscale is ignored.
height, width Character vector containing a LaTeX distance (by default NULL). Specifying atmost one of these retains the original aspect ratio. Specifying a value for bothmight distort the figure by changing the aspect ratio.
wd The directory in which the files reside. The default is the full path to the cur-rent working directory that R is using. The full path is necessary when usingthe Hmisc::print.latex and related functions because they run the operatingsystem’s latex or pdflatex command in a temporary directory. The relativepath to the current directory (wd=".") is sufficient if the file will be brought intoa larger tex file with the LaTeX input macro.
raise Character vector containing a LaTeX distance (by default NULL). This value maybe negative. Use it if the default vertical alignment of the graphs in the table isnot satisfactory.
hspace.left, hspace.right
Character vector containing a LaTeX distance (by default NULL). This value maybe negative. Use it if the default distance on the left or right between columnsof graphs in the table is not satisfactory.
viewport Size in pixels of the image file. This is the MediaBox in a pdf file. It is thenumber reported by the operating system for a png or jpeg file. The viewportis optional. When specified it must be a character string containing four numbersin order: left, bottom, right, top.
bb Bounding Box: Size in pixels of the image file. It is the number reported bythe operating system for a ps, bmp, or jpeg file. When specified it must be acharacter string containing four numbers in order: left, bottom, right, top.
trim Size in pixels to be trimmed. It must be a character string containing four num-bers in order: left, bottom, right, top. See the manual for the LaTeX packagegraphicx for details. See the Details section for additional use of the trim ar-gument.
x.axis, y.axis, key
logical, or list of arguments to nested calls to as.includegraphics.
Details
We recommend that the aspect ratio be controlled by the ’R’ functions that generated the figure.

as.includegraphics 13
We recommend that only one of the arguments height and weight be used in as.includegraphics.Using both will change the aspect ratio and consequently stretch the figure. The trim argument isused to remove excess margins from the figure.
Either the viewport or bb should be specified, not both.
The trim argument can be used to take apart an externally produced graphics file and use subsetsof its area as components in a ’LaTeX’ table. See the files examples/irisSweaveTakeApart.Rtexand examples/irisSweaveTakeApart-Distributed.pdf for an example.
Value
A vector or matrix of ’LaTeX’ statements with the ’LaTeX’ macro \includegraphics for each ofthe input filenames. If the input argument has axis.names or keyname attributes, then the valuewill also have those attributes, enclosed in \includegraphics statements. The arguments allowdifferent \includegraphics options for the panels, the x.axis, the y.axis, and the key (legend).
Author(s)
Richard M. Heiberger <[email protected]>
See Also
latex, microplot
Examples
as.includegraphics("abc.pdf")## [1] "\includegraphics[height=1em]{/Users/rmh/abc.pdf}"## This form, with the full pathname, is required when the Hmisc::print.latex## and related functions are used to display the current .tex file on screen.
as.includegraphics("abc.pdf", wd=".")## [1] "\includegraphics[height=1em]{./abc.pdf}"## This form, with the relative path, is optional when the .tex file will be## embedded into a larger file, and will not be displayed on screen.
as.includegraphics(c("abc.pdf", "def.pdf"), raise="-1em")## [1] "\raisebox{-1em}{\includegraphics[height=1em]{/Users/rmh/abc.pdf}}"## [2] "\raisebox{-1em}{\includegraphics[height=1em]{/Users/rmh/def.pdf}}"
## Please see the package documentation ?microplot for a simple example in context.
## Please see the demos for more interesting examples.## demo(package="microplot")

14 as.orgfile
as.orgfile Place a filename or filepath in the format used by org-mode
Description
Place a filename or filepath in the format used by org-mode, by surrounding it with "[[" and "]]".
Usage
as.orgfile(object, wd = getwd(), ...)
Arguments
object Vector of character strings containing filenames.
wd The directory in which the files reside. The default is the current working direc-tory that R is using.
... Ignored.
Value
A character vector containing the input strings surrounded by "[[" and "]]".
Author(s)
Nooreen Dabbish <[email protected]> and Richard M. Heiberger <[email protected]>
See Also
microplot
Examples
as.orgfile("abcd.png")as.orgfile("abcd.png", wd=".")as.orgfile(c("abcd.png", "efgh.png"))
## For an example in context, please see the package example:## system.file(package="microplot", "examples/irisOrgHtml.org")## Copy file irisOrgHtml.org to a directory in which you have write privileges,## open it in emacs, and enter## C-c C-e b on Macintosh## C-c C-e ho on Windows## C-c C-e <something> on linux

as.orgtable 15
as.orgtable Prepare a matrix or data.frame to be used as an org-mode table
Description
Prepare a matrix or data.frame to be used as an org-mode table. Column names are required. Rownames are optional (and default to FALSE
Usage
as.orgtable(x, rownames = FALSE)
Arguments
x Matrix or data.frame.
rownames Logical. When FALSE (the default), the row.names are not displayed in the value.When TRUE, the row.names are displayed in the value. See the last example fordetails on this behavior.
Value
Vector of character strings, one item for each row of the argument x. The strings contain the markupthat will make them appear as tables in an org-mode document.
Author(s)
Nooreen Dabbish <[email protected]> and Richard M. Heiberger <[email protected]>
See Also
microplot
Examples
tmp <- matrix(1:12, 3, 4, dimnames=list(letters[1:3], LETTERS[4:7]))tmpas.orgtable(tmp)as.orgtable(tmp, rownames=TRUE)
tmpdf <- data.frame(tmp)tmpdfcat(as.orgtable(tmpdf), sep="\n")cat(as.orgtable(tmpdf, rownames=TRUE), sep="\n")
## This example shows why row names default to FALSE.
tmp2 <- rbind(tmp, tmp)tmp2tmp2df <- data.frame(tmp2)

16 latex.AEdotplot
tmp2df
tmp2df <- cbind(" "=row.names(tmp2), group=rep(c("A","B"), each=3), tmp2df)tmp2df
cat(as.orgtable(tmp2df), sep="\n") ## this is what we want
## this has the unwanted initial column of 1:6cat(as.orgtable(tmp2df, rownames=TRUE), sep="\n")
latex.AEdotplot Display the AE (Adverse Events) dotplot of incidence and relative riskin a ’LaTeX’ tabular environment or in an ’MS Word’ or an ’HTML’table.
Description
The AEdotplot function constructs a display of the most frequently occurring AEs (Adverse Events)in the active arm of a clinical study. The latex method takes the incidence panel and the relativerisk panel from the AEdotplot and places them in a ’LaTeX’ tabular environment along with thenumerical table of counts, percents, and relative risks. The MSWord method takes the incidencepanel and the relative risk panel from the AEdotplot and places them in an ’MS Word’ table alongwith the numerical table of counts, percents, and relative risks.
Usage
## S3 method for class 'AEdotplot'latex(object, figPrefix = Hmisc::first.word(substitute(object)),
device="pdf", ...)
## S3 method for class 'AEdotplot'MSWord(object, filetype="docx", figPrefix = Hmisc::first.word(substitute(object)),
device="png", ...)
Arguments
object An "AEdotplot" object as constructed by the AEdotplot.
figPrefix Beginning characters for names of the sequence of generated graphics files.
device Forwarded to microplot.
filetype Forwarded to MSWord.
... Additional arguments forwarded to the latex function (which will use them) orto theMSWord.AEdotplot.microplot function (which will ignore them).
latex.trellis 17
Details
The microplot.AEdotplot function does most of the work, taking apart the "AEdotplot" objectand constructing the set of graphics files and returning the data.frame containing the tabled data andthe set of graphics files. The data.frame is sent to either latex or to MSWord.AEdotplot.microplot.For more detail see microplot.AEdotplot.
Value
For latex.AEdotplot, the "latex" object giving the pathname of the .tex file containing the’LaTeX’ tabular environment constructed by the latex function. For MSWord.AEdotplot, the"character" object giving the pathname of the .docx file containing the generated table con-structed by by MSWord.AEdotplot.microplot function which in turn uses functions in the Re-porteRs package.
Author(s)
Richard M. Heiberger <[email protected]>
See Also
See AEdotplot and latex for details on the operation of the latex method.See microplot.AEdotplot for details on how the microplot function works with the "AEdotplot"object.
Examples
##---- Should be DIRECTLY executable !! ----##-- ==> Define data, use random,##--or do help(data=index) for the standard data sets.
## Not run:## The function is currently defined asfunction (object, figPrefix = Hmisc::first.word(substitute(object)),
...){
Hmisc::latex(microplot(object, figPrefix = figPrefix, target = "latex",...))
}
## End(Not run)
latex.trellis Hmisc::latex method for "trellis" objects.
Description
Hmisc::latex method for "trellis" objects.

18 latex.trellis
Usage
latex.trellis(## microplot argumentsobject=stop("trellis object is required", call. = FALSE),
## object must have class "trellis"obji=NULL, ## Vector or matrix of trellis objects, with dimnames,
## normally each containing one panel.## When obji is non-null, the axes and key will be## taken from object. We need object to be a trellis## object so the latex generic will dispatch to## latex.trellis.
figPrefix=Hmisc::first.word(deparse(substitute(object))),device=c("pdf","postscript","png", ## other devices require
## a user-written functionif (version$os == "mingw32") "win.metafile"),
height=1, width=1, ## microplot, numeric, in inchescollapse=layoutCollapse, ## see below for example.
## zero out unwanted layout.heights## and layout.widths.
height.x.axis=height,par.settings.x.axis=list(layout.heights=list(panel=0, axis.bottom=1,
axis.xlab.padding=1, xlab=1),axis.line=list(col="black")),
width.y.axis=width,par.settings.y.axis=list(layout.widths=list(ylab=1, ylab.axis.padding=1,
axis.left=1, panel=0),axis.line=list(col="black")),
key=FALSE, ## FALSE or a list of arguments defining a keyheight.key=height, width.key=width,#### as.includegraphics argumentsheight.as=NULL, ## character with TeX units, for example "1in"width.as=NULL, ## keeps aspect ratioscale=NULL, ## ignored if either height.as or width.as
## is specified.raise=NULL, ## argument to as.includegraphicshspace.left=NULL, ## argument to as.includegraphicshspace.right=NULL, ## argument to as.includegraphicswd=getwd(), ## working directory for graphics files
viewport=NULL, ## if specified, then left bottom right top (character)## used for pdf png jpeg## See MediaBox in pdf file.## Ask operating system for png or jpg file.bb=NULL, ## if specified, then left bottom right top (character)
## used for bmp tiff ps, ask operating system for valuestrim=NULL, ## for example, "0 0 0 0" left bottom right top (character)
x.axis.includegraphics=TRUE, ## logical or a list of arguments

latex.trellis 19
y.axis.includegraphics=TRUE, ## logical or a list of argumentskey.includegraphics=is.list(key), ## logical or a list of arguments#### latex.includegraphicsMatrix arguments,## including arguments to latex.default...)
latex.includegraphicsMatrix(ii, ## ii is not currently an includegraphicsMatrix object.rowlabel="rowname", ## latex, column heading of row dimnamestitle="figPrefix", ## latex.defaultrowseparator=FALSE,return.value=c("latex","R"),bottom=if (!is.null(attr(ii, "key.name")))
attr(ii, "key.name"),...) ## arguments to latex.default
Arguments
object "trellis" object, usually a multi-panel object.
obji NULL, or a vector or matrix of "trellis" objects, with dimnames, normallyeach containing one panel. When obji is non-null, the axes and key will betaken from object. We need object to be a "trellis" object so the latexgeneric will dispatch to latex.trellis.
figPrefix, device, height, width, collapse
See microplot.trellis.height.x.axis, par.settings.x.axis, width.y.axis,par.settings.y.axis
See microplot.trellis.key, height.key, width.key
See microplot.trellis.height.as, width.as
Forwarded to as.includegraphics as height and weight.scale, raise, hspace.left, hspace.right, wd, viewport, bb, trim
See as.includegraphics
x.axis.includegraphics, y.axis.includegraphics, key.includegraphics
Forwarded to as.includegraphics as x.axis, y.axis, and key.
ii The input to latex.includegraphicsMatrix is the result of as.includegraphicscall; a matrix of LaTeX \includegraphics statements, possibly with axis.namesor keyname attributes.
title, rowlabel
Arguments to Hmisc::latex.
rowseparator logical. If TRUE, then place a blank line between rows.
return.value The default "latex" sends ii to Hmisc::latex for processing by the oper-ationg system latex. The alternate "R" returns the ii matrix for further pro-cessing, for example to rbind a numerical table before sending the result toHmisc::latex.

20 latexCheckOptions
bottom default argument to latex.default’s insert.bottom argument.
... Further arguments to latex.default.
Value
The default value of latex.trellis, when return.value="latex", is a "latex" object contain-ing two components. The file component contains the pathname of the generated .tex file. Thestyle component contains the value graphicx indicating that the latex \usepackage{graphicx}is required. See the demo in demo/latex.r for an elaborate example, almost a tutorial.
file Pathname of the generated .tex file.
style "graphicx"
When return.value="latex" and argument file="", the generated LaTeX code is printed tostandard output. See the discussion of the file argument in latex to learn how to use this featurewith Sweave.
The alternate value of latex.trellis when return.value="R" is a matrix of \includegraphics{}statements that may be combined with other matrices and then sent to latex.default. See the lastexample in demo/bwplot-lattice.r.
Function latex.includegraphicsMatrix takes the output of as.includegraphics as its inputii and returns a "latex" object. If there are axis.names attributes, they are placed in front ofeach row of panels and beneath each column of panels. If there is a keyname attribute, then it isforwarded to latex.default as the insert.bottom argument.
Author(s)
Richard M. Heiberger <[email protected]>
See Also
latex
Examples
## See the examples in the help files, the demo files, and in the## examples subdirectory.
latexCheckOptions Check whether the options for latex functions have been specified.
Description
Check whether the options for latex functions have been specified. If any ofoptions()[c("latexcmd","dviExtension","xdvicmd")] are NULL, an error message is displayed.
Usage
latexCheckOptions(...)

layoutCollapse 21
Arguments
... Any arguments are ignored.
Value
If any NULL options are detected, the invisible text of the error message. If all three options havenon-NULL values, NULL.
Author(s)
Richard M. Heiberger <[email protected]>
See Also
latex, microplot
layoutCollapse Set the lattice par.settings to remove all marginal space.
Description
Set the lattice par.settings to remove all marginal space. By default layoutHeightsCollapseand layoutWidthsCollapse set everything in layout.heights or layout.widths to 0 except forpanel. The user can specify values for all the standard items in either of those items.layoutCollapse by default sets layout=c(1,1), collapses to 0 all heights and widths except forpanel, removes all labels and strip labels, and sets all axis lines to col="transparent".
Usage
layoutCollapse(x,xlab="",ylab="",xlab.top=NULL,ylab.right=NULL,main=NULL,sub=NULL,strip=FALSE,strip.left=FALSE,layout.heights=layoutHeightsCollapse(),layout.widths=layoutWidthsCollapse(),strip.border=list(col="transparent"),axis.line=list(col="transparent"),layout=c(1,1),...)
layoutHeightsCollapse(...)layoutWidthsCollapse(...)

22 layoutCollapse
Arguments
... For layoutCollapse any argument to update.trellis.For layoutHeightsCollapse any item name in trellis.par.get()$layout.heights.For layoutWidthsCollapse any item name in trellis.par.get()$layout.widths.
x Any "trellis" object.xlab, ylab, xlab.top, ylab.right, main, sub
Standard xyplot arguments.strip, strip.left, strip.border, axis.line, layout
Standard xyplot arguments.layout.heights, layout.widths
Arguments to trellis.par.get.
Details
When very small plots are placed inside a LaTeX tabular environment, it is often helpful to suppressmargins, axes, labels, titles.
Value
For layoutHeightsCollapse and layoutWidthsCollapse, a list which may be used as input tothe par.settings argument in a lattice call. For layoutCollapse, a "trellis" object.
Author(s)
Richard M. Heiberger <[email protected]>
Examples
lattice::trellis.par.get("layout.heights")lattice::trellis.par.get("layout.widths")layoutHeightsCollapse()layoutWidthsCollapse()layoutWidthsCollapse(axis.left=1)## Not run:
A <- lattice::xyplot(Sepal.Length ~ Sepal.Width | Species, data=iris)
A ## one page with three panels
layoutCollapse(A) ## three pages with one unlabeled panel on each
layoutCollapse(A, ## one page with panels labeled by ylablayout=c(1,3),ylab=levels(iris$Species),layout.heights=list(axis.bottom=1),layout.widths=list(axis.left=1),axis.line=list(col="green"))
## End(Not run)

microplot 23
## Please see the package documentation for a simple example in context.
## Please see the demos for more interesting examples.## demo(package="microplot")
microplot Take a trellis or ggplot object and generate a set of graphics files, oneper panel of a multi-panel display.
Description
Take a trellis or ggplot object and generate a set of graphics files, one per panel of a multi-paneldisplay. microplot.trellis is complete. microplot.ggplot at present is a placeholder. Fulldevelopment requires more familiarity with ggplot than I have. microplot_yfactor.ggplot is aspecial-case example for a one-dimensional array of ggplot panels.
This help file documents the microplot function. See microplot-package for information on themicroplot package.
Usage
microplot(object, ...)
## complete for an array of lattice panels## S3 method for class 'trellis'microplot(
object=stop("trellis object is required", call. = FALSE),## object must have class "trellis"figPrefix=Hmisc::first.word(deparse(substitute(object))),device=c("pdf","postscript","png",
## other devices require a user-written functionif (version$os == "mingw32") "win.metafile"),
height=1, width=1, ## numeric in inchescollapse=layoutCollapse, ## Zero out unwanted
## layout.heights and layout.widths.## See below for example.
height.x.axis=height,par.settings.x.axis=list(layout.heights=list(panel=0, axis.bottom=1,
axis.xlab.padding=1, xlab=1),axis.line=list(col="black")),
width.y.axis=width,par.settings.y.axis=list(layout.widths=list(ylab=1, ylab.axis.padding=1,
axis.left=1, panel=0),axis.line=list(col="black")),
key=FALSE, ## FALSE or a list of arguments defining a keyheight.key=height, width.key=width,
24 microplot
...) ## needed to match generic. ignored in the trellis method
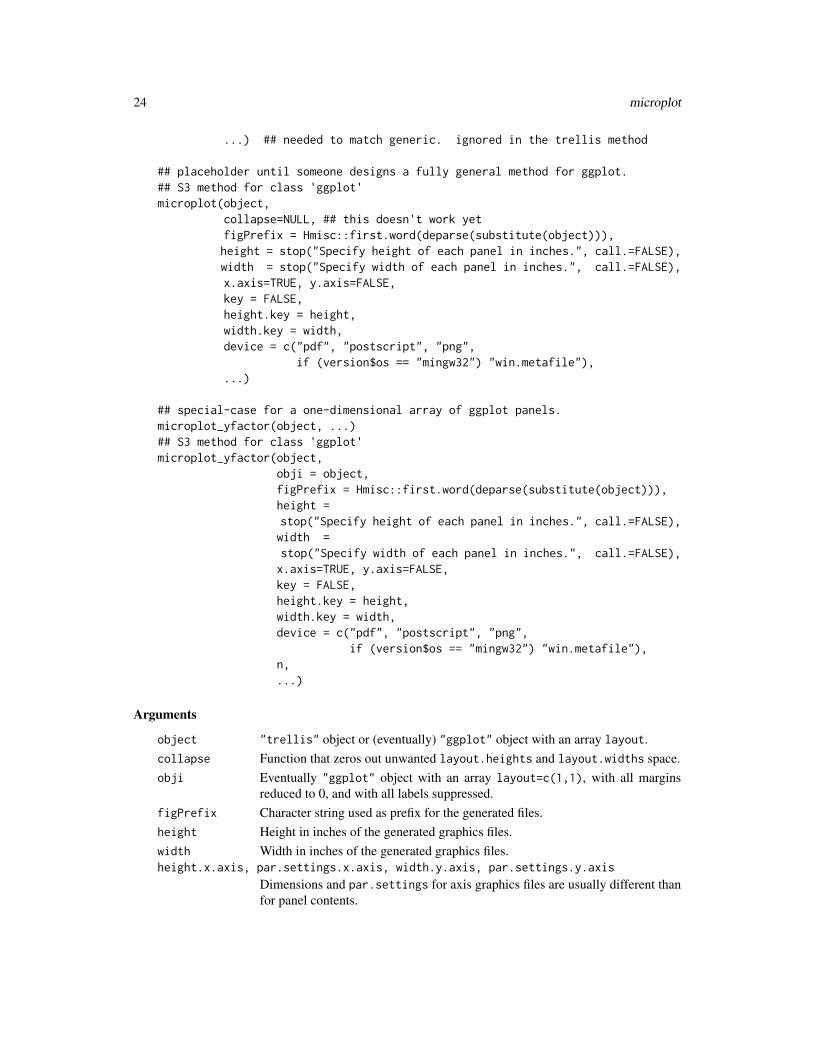
## placeholder until someone designs a fully general method for ggplot.## S3 method for class 'ggplot'microplot(object,
collapse=NULL, ## this doesn't work yetfigPrefix = Hmisc::first.word(deparse(substitute(object))),height = stop("Specify height of each panel in inches.", call.=FALSE),width = stop("Specify width of each panel in inches.", call.=FALSE),x.axis=TRUE, y.axis=FALSE,key = FALSE,height.key = height,width.key = width,device = c("pdf", "postscript", "png",
if (version$os == "mingw32") "win.metafile"),...)
## special-case for a one-dimensional array of ggplot panels.microplot_yfactor(object, ...)## S3 method for class 'ggplot'microplot_yfactor(object,
obji = object,figPrefix = Hmisc::first.word(deparse(substitute(object))),height =stop("Specify height of each panel in inches.", call.=FALSE),width =stop("Specify width of each panel in inches.", call.=FALSE),x.axis=TRUE, y.axis=FALSE,key = FALSE,height.key = height,width.key = width,device = c("pdf", "postscript", "png",
if (version$os == "mingw32") "win.metafile"),n,...)
Arguments
object "trellis" object or (eventually) "ggplot" object with an array layout.collapse Function that zeros out unwanted layout.heights and layout.widths space.obji Eventually "ggplot" object with an array layout=c(1,1), with all margins
reduced to 0, and with all labels suppressed.figPrefix Character string used as prefix for the generated files.height Height in inches of the generated graphics files.width Width in inches of the generated graphics files.height.x.axis, par.settings.x.axis, width.y.axis, par.settings.y.axis
Dimensions and par.settings for axis graphics files are usually different thanfor panel contents.

microplot.AEdotplot 25
x.axis, y.axis no longer used in microplot.trellis because graphics files for the x.axis andy.axis are now always written. Still used in the ggplot method because theyhaven’t been rewriteen yet.
key Logical or list. If logical and FALSE there is no key (legend). If a list, it mustbe defined as described in xyplot for "trellis" objects and as described inggplot2 for "ggplot" objects.
height.key Height in inches of key graphics file. Defaults to same height as the panels.
width.key Width in inches of key graphics file. Defaults to same width as the panels.
device Function used to construct the graphics files.For latex with (options("latexcmd")=="latex") use "pdf" (the default).For latex with (options("latexcmd")=="tex") use "postscript".For MSWord use "png", or on ’Windows’ "win.metafile".
n Number of panels in the ggplot array.Used only in the microplot_yfactor.ggplot method. The other methods de-termine n from the dim of the object argument.
... Arguments to panel function, i.e., cex and such for lattice. Similar argumentsfor ggplot. Currently ignored for the microplot_yfactor.ggplot function.
Value
Array of filenames with same dim and dimnames as the argument object. There may one or twoattributes
• axis.name Filename of graphics files containing the horizontal and vertical axes.
• key.name Filename of graphics file containing the key (legend).
Author(s)
Richard M. Heiberger <[email protected]>
Examples
## See demos
microplot.AEdotplot Take apart a "AEdotplot" object and construct a set of graphics fileseach of the Adverse Events.
Description
Take apart a "AEdotplot" object and construct a set of graphics files each of the Adverse Events.

26 microplot.AEdotplot
Usage
## S3 method for class 'AEdotplot'microplot(object,
figPrefix = Hmisc::first.word(substitute(object)),title = "Adverse Event",main = attr(object, "main")[[1]],sub = attr(object, "sub")[[1]],height = 0.2,width.pct = 2,width.RR = 1.5,key = attr(object, "ae.key"),device = c("pdf", "postscript", "png",
if (version$os == "mingw32") "win.metafile"),...)
## S3 method for class 'AEdotplot.microplot'latex(object, ...)
## S3 method for class 'AEdotplot.microplot'MSWord(object,
filetype=c("docx","html"),graph.file.directory = "./",width.pct = attr(object, "width.pct"),width.RR = attr(object, "width.RR"),height = attr(object, "height"),title = attr(object, "title"),caption = attr(object, "caption"),figPrefix = attr(object, "figPrefix"),rmh.borders = TRUE,FlexTableWidths = c(1.5, 0.6, 0.6, 0.6, 0.6, 0.7, 2.1, 1.6),file=paste0(figPrefix, ".", filetype),...)
Arguments
object An "AEdotplot" object constructed by the AEdotplot function.
... Additional arguments.For microplot.AEdotplot, ignored.For latex.AEdotplot.microplot, forwarded to the latex function.For MSWord.AEdotplot.microplot, ignored.
figPrefix Character string used as prefix for the generated files.
title Column head for the rownames of the generated table.
main, sub, key Standard xyplot arguments.
height Height in inches of the generated graphics files.
width.pct Width in inches of the generated graphics files for the "Percent" column.
width.RR Width in inches of the generated graphics files for the "Relative Risk" column.

microplot.AEdotplot 27
device Function used to construct the graphics files.graph.file.directory
MSWord method only. The ReporteRs function needs this to be explicit.
caption Caption used in the generated ’MS Word’ table.
rmh.borders Logical. The default value TRUE uses solid borders only to distinguish the col-umn labels and the row labels from the body of the table. The alternate valueFALSE allows the ReporteRs package to construct a table with solid borderssurrounding all cells.
FlexTableWidths
See setFlexTableWidths.
file Name of the file to create.
filetype MSWord only. Type of file to generate: .docx for ’MS Word’, or .html for’HTML’.
Details
The microplot.AEdotplot function does most of the work for the latex.AEdotplot andMSword.AEdotplot functions. This microplot method takes apart the "AEdotplot" object, con-structs the set of graphics files, and returns the data.frame containing the tabled data and the set ofgraphics files. The data.frame is then sent to either latex or to MSWord.AEdotplot.microplot.
The calling sequence of functions is
a. latex.AEdotplotb. microplot.AEdotplot
c. microplot.trellisb. latex.AEdotplot.microplot
c. single call to latex.default with an argument list into theHmisc::latex function tells Hmisc::latex what work to do.
##a. MSWord.AEdotplot
b. microplot.AEdotplotc. microplot.trellis
b. MSWord.AEdotplot.microplotc. direct calls to many functions (FlexTable, textPoperties,
parProperties, pot_img, setFlexTableBorders, borderNone,borderProperties, cellProperties, setFlexTableWidths, docx,addParagraph, addFlexTable, writeDoc) inside the ReporteRspackage. Unlike the latex.AEdotplot function, which uses anargument list into Hmisc::latex for organization, theMSWord.AEdotplot function must do the work itself with theprimitives supplied by ReporteRs.
Value
For microplot.AEdotplot, a data.frame of tabular values and filenames. The data.frame has at-tributes

28 MSWord
• figPrefix, title, sub, height, width.pct, width.RR, device Copied from the argu-ments to microplot.
• caption Copied from the "main" argument to microplot.
• cgroup, n.cgroup, rgroup, n.rgroup Values appropriate to the "AEdotplot" object thatwill be passed forward to the latex.AEdotplot method or the MSWord.AEdotplot method.These variables are documented in latex.
For latex.AEdotplot.microplot, a "latex" object containing the filename of the file containinga ’latex’ tabular environment. Printing the return value at the console will generate a preview of thetable. Use print.default to display the name of the generated .tex file.
For MSWord.AEdotplot.microplot, a character string containing the name of the generated .docxor .html file.
Author(s)
Richard M. Heiberger <[email protected]>
References
Ohad Amit, Richard M. Heiberger, and Peter W. Lane. (2008) “Graphical Approaches to the Anal-ysis of Safety Data from Clinical Trials”. Pharmaceutical Statistics, 7, 1, 20–35.
http://www3.interscience.wiley.com/journal/114129388/abstract
See Also
AEdotplot
Examples
## Not run:demo("AEdotplot-latex", package="microplot", ask=FALSE)demo("AEdotplot-MSWord", package="microplot", ask=FALSE) ## both "word" and "html"
## End(Not run)
MSWord Generate a .docx or .html file from an R object.
Description
Generate a .docx or .html file from an R object.
Usage
MSWord(object, filetype=c("docx", "html"), ...)

MSWord 29
Arguments
object For the MSWord.AEdotplot method, the argument is an "AEdotplot" objectconstructed with the AEdotplot function. For the more general methods the ob-ject will be a data.frame containing formatted numbers (class "character", notclass "numeric") and the pathnames of .png (or .wmf on MS Windows) files.At this writing the only more general method is theMSWord_TablePlusGraphicColumn function which requires several columnscontaining formatted numerical data (hence "character", not "numeric") andthe last column containing the pathnames to the graphics files.MSWord_TablePlusGraphicColumn is written as a function, not a method, soits full name must be used.
filetype Type of file to generate: .docx for ’MS Word’, or .html for ’HTML’.
... Additional arguments used by methods.
Details
See MSWord.AEdotplot for "AEdotlot" objects.
See MSWord_TablePlusGraphicColumn for numerical data with a single graphics column.
For more general objects, there is not yet a cover routine. It will be necessary for the user to writethe code directly using the functions provided in the ReporteRs package. Should anyone want towrite a more general MSWord method, I will be happy to include it (with full credit to the author) ina future release of the microplot package.
Value
Invisibly, the name of the constructed .docx or .html file.
Author(s)
Richard M. Heiberger <[email protected]>
Examples
## See the examples in the demo files.## Not run:
demo("bwplot-lattice-MSWord", package="microplot")demo("tablesPlusGraphicColumn", package="microplot")demo("boxplot-ggplot-MSWord", package="microplot")demo("AEdotplot-MSWord", package="microplot")
## End(Not run)

30 MSWord_TablePlusGraphicColumn
MSWord_TablePlusGraphicColumn
Construct an ’MS Word’ file containing a table with several columnsof numbers and one column of graphics.
Description
Construct an ’MS Word’ file containing a table with several columns of numbers and one columnof graphics. This function needs to be rewritten as a method for the generic MSWord.
Usage
MSWord_TablePlusGraphicColumn(object,filetype=c("docx","html"),title=Hmisc::first.word(deparse(substitute(object))),rowname.header,data.header,graph.header,graph.file.directory="./",panel.files, ## make sure they are in the correct orderaxis.files, ## axis.files["x"] is used. axis.files["y"] is currently ignored.legend.file,height=stop("specify height of each panel in inches",
call.=FALSE),width=stop("specify width of each panel in inches",
call.=FALSE),height.key=height, width.key=width, ## inchesFlexTableWidths, ## inchesrmh.borders=TRUE,caption,file=paste0(title, ".", filetype),doc.title="Microplot",...)
Arguments
object Character-valued matrix or data.frame.
title Name of file to create without the .docx or .html extension.
rowname.header Column header for column of rownames.
data.header Group header for set of data columns.
graph.header Column header for columns of graphics.graph.file.directory
Directory containing the filenames listed in the argumentspanel.files, axis.files, legend.file.

MSWord_TablePlusGraphicColumn 31
panel.files Vector of graphics filenames, one for each row of the object.
axis.files Vector of filenames for graphics files. The file named in axis.files["x"]contains the common horizontal axis of the files in panel.files. The filenamed in axis.files["y"] contains the common vertical axis of the files inpanel.files.
legend.file Filename for graphics file containing the key (legend) for the files in panel.files.
height Height in inches of the generated graphics files.
width Width in inches of the generated graphics files.
height.key Height in inches of key graphics file. Defaults to same height as the panels.
width.key Width in inches of key graphics file. Defaults to same width as the panels.FlexTableWidths
See setFlexTableWidths.
rmh.borders The default value TRUE uses solid borders only to distinguish the column labelsand the row labels from the body of the table. The alternate value FALSE allowsthe ReporteRs package to construct a table with solid borders surrounding allcells.
caption Caption used in the generated ’MS Word’ table.
filetype Type of file to generate: .docx for ’MS Word’, or .html for ’HTML’.
file Name of the file to create. The default file name is x.docx or x.html (dependingon the value of filetype) where x is the first word in the name of the argumentfor object.
doc.title title required by docx for the title of the .docx file (in the document proper-ties).
... Other arguments are ignored.
Value
Invisibly, the name of the constructed .docx or .html file.
Author(s)
Richard M. Heiberger <[email protected]>
See Also
MSWord
Examples
## Not run:demo("tablesPlusGraphicColumn", package="microplot", ask=FALSE) ## both "word" and latex
## End(Not run)

32 pdfMicroplotTrellis
pdfMicroplotTrellis Internal subroutines used by microplot.ggplot and mi-croplot_yfactor.ggplot to write the individual graphics files.
Description
Internal subroutines used by microplot.ggplot and microplot_yfactor.ggplot to write the individualgraphics files.
Usage
## used by microplot_yfactor.ggplotpdfMicroplot_yfactorGgplot(
object, n, is.key, figPrefix, height, width, x.axis, y.axis,key, height.key, width.key, ...)
postscriptMicroplot_yfactorGgplot(object, n, is.key, figPrefix, height, width, x.axis, y.axis,key, height.key, width.key, ...)
win.metafileMicroplot_yfactorGgplot(object, n, is.key, figPrefix, height, width, x.axis, y.axis,key, height.key, width.key, ...)
pngMicroplot_yfactorGgplot(object, n, is.key, figPrefix, height, width, x.axis, y.axis,key, height.key, width.key, ...)
Arguments
object Individual filename. Used by the special case microplot_yfactor.ggplot function.n Number of panels in the lattice or ggplot array.is.key Logical. If TRUE then key is lattice key (legend).figPrefix Character string used as prefix for the generated files.height Height in inches of the generated graphics files.width Width in inches of the generated graphics files.x.axis, y.axis Logical. If TRUE then write a graphics file containing the horizontal axis or the
vertical axis. At the moment, the y.axis value is ignored.key For "trellis" objects, a key as described in xyplot.
For "ggplot" objects, a legend as described in guide_legend.height.key Height in inches of key graphics file. Defaults to same height as the panels.width.key Width in inches of key graphics file. Defaults to same width as the panels.... Arguments to panel function, i.e., cex and such for trellis. Similar arguments for
ggplot. Currently ignored for the *_yfactorGgplot functions.
Author(s)
Richard M. Heiberger <[email protected]>

theme_collapse 33
theme_collapse Set the ggplot2 theme to remove all marginal space.
Description
Set the ggplot2 theme to remove all marginal space. By default the grid, ticks, tick labels, and axislabels are set to blank. Margins are set to 0.
Usage
theme_collapse( ## the commented values are from theme_greypanel.grid.major=eb, ## element_line(colour = "white")panel.grid.minor=eb, ## element_line(colour = "white", size = 0.25)axis.ticks=eb, ## element_line(colour = "grey20")axis.text=eb, ## element_text(size = rel(0.8), colour = "grey30")axis.title=eb, ## axis.title.x = element_text(
## margin = margin(t = 0.8 * half_line,## b = 0.8 * half_line/2))## axis.title.y = element_text(angle = 90,## margin = margin(r = 0.8 * half_line,## l = 0.8 * half_line/2))
plot.margin= grid::unit(c(0, 0, 0, 0), "in"),...,eb=ggplot2::element_blank())
Arguments
panel.grid.major, panel.grid.minor, axis.ticks, axis.text, axis.title, plot.margin
ggplot2 theme elements. See theme for information.... Other valid arguments to ggplot2::theme.eb Conventience for ggplot2::element_blank().
Details
When very small plots are placed inside a LaTeX tabular environment, it is often helpful to suppressmargins, axes, labels, titles.
Value
A ggplot2 theme object.
Note
The first draft of theme_collapse was written by Karen Byron.
Author(s)
Richard M. Heiberger <[email protected]>

34 theme_collapse
Examples
theme_collapse()## Please see the package documentation for a simple example in context.
## Please see the demos for more interesting examples.## demo(package="microplot")

Index
∗Topic Excelmicroplot-package, 2
∗Topic HTMLmicroplot-package, 2
∗Topic LaTeXlatex.trellis, 17microplot-package, 2
∗Topic Sweavemicroplot-package, 2
∗Topic Wordmicroplot-package, 2
∗Topic documentationas.htmlimg, 10as.includegraphics, 11as.orgfile, 14latex.trellis, 17
∗Topic ggplot2theme_collapse, 33
∗Topic hplotlatex.AEdotplot, 16microplot, 23microplot.AEdotplot, 25MSWord, 28MSWord_TablePlusGraphicColumn, 30pdfMicroplotTrellis, 32
∗Topic htmllatex.AEdotplot, 16MSWord_TablePlusGraphicColumn, 30
∗Topic knitrmicroplot-package, 2
∗Topic latticelayoutCollapse, 21
∗Topic microplotmicroplot-package, 2
∗Topic org-modemicroplot-package, 2
∗Topic packagemicroplot-package, 2
∗Topic rmarkdown
microplot-package, 2∗Topic sparkline
microplot-package, 2∗Topic utilities
as.htmlimg, 10as.includegraphics, 11as.orgfile, 14as.orgtable, 15latex.trellis, 17latexCheckOptions, 20
AEdotplot, 16, 17, 26, 28, 29as.htmlimg, 10as.includegraphics, 11, 19as.orgfile, 14as.orgtable, 15
docx, 31
ggplot2, 25guide_legend, 32
latex, 4, 5, 13, 16, 17, 20, 21, 26–28latex.AEdotplot, 16latex.AEdotplot.microplot
(microplot.AEdotplot), 25latex.includegraphicsMatrix
(latex.trellis), 17latex.trellis, 17latexCheckOptions, 20layoutCollapse, 21layoutHeightsCollapse (layoutCollapse),
21layoutWidthsCollapse (layoutCollapse),
21
microplot, 4, 10, 13–15, 17, 21, 23microplot-package, 2microplot.AEdotplot, 17, 25, 27microplot.trellis, 19microplot_yfactor (microplot), 23
35

36 INDEX
MSWord, 5, 16, 28, 30, 31MSWord.AEdotplot, 29MSWord.AEdotplot (latex.AEdotplot), 16MSWord.AEdotplot.microplot, 16, 17, 27MSWord.AEdotplot.microplot
(microplot.AEdotplot), 25MSWord_TablePlusGraphicColumn, 29, 30
pdfMicroplot_yfactorGgplot(pdfMicroplotTrellis), 32
pdfMicroplotTrellis, 32pngMicroplot_yfactorGgplot
(pdfMicroplotTrellis), 32postscriptMicroplot_yfactorGgplot
(pdfMicroplotTrellis), 32
ReporteRs, 17
setFlexTableWidths, 27, 31sparkline (microplot-package), 2
theme, 33theme_collapse, 33trellis.par.get, 22
update.trellis, 22
win.metafileMicroplot_yfactorGgplot(pdfMicroplotTrellis), 32
xtable, 5xyplot, 22, 25, 26, 32