Embed Size (px)
Citation preview

YF37-04: Asian Currency Unit and ASEAN Trade Prospect
PAFTAD International Secretariat Crawford School of Public Policy
College of Asia and the Pacific The Australian National University
Canberra ACT 0200 Australia
PACIFIC TRADE AND DEVELOPMENT
WORKING PAPER SERIES
Paper No. YF37-04
ASIAN CURRENCY UNIT AND ASEAN TRADE
PROSPECT: AN UNTOLD STORY
SHAHRIAR KABIR
DRAFT, NOT FOR CITATION WITHOUT AUTHOR CONSENT AUTHOR AFFILIATION: SCHOOL OF BUSINESS AND ECONOMICS, MONASH UNIVERSITY MALAYSIA CONTACT: JALAN LAGOON SELATAN, 46150, BANDAR SUNWAY, SELANGOR DARUL EHSAN, MALAYSIA. PHONE: +603 5514 6172, FAX: +603 5514 6192 / 6194, E-MAIL: [email protected] ACKNOWLEDGEMENTS: I thank Professor Harry Bloch and Associate Professor Ruhul A Salim for their valuable feedback. I also thank School of Economics and Finance, Curtin University Australia for providing research infrastructural support for doing part of the research.
YF37-04: Asian Currency Unit and ASEAN Trade Prospect
PAFTAD International Secretariat Crawford School of Public Policy
College of Asia and the Pacific The Australian National University
Canberra ACT 0200 Australia
Abstract
Successful regional integration activities in the last two decades have brought East
Asia under the limelight of International Economics. Recent literature strongly
suggests Asian Currency Unit (ACU) as a potential currency arrangement for East
Asian countries. However, high level of heterogeneity among these countries raise
question about the feasibility of ACU. This study analyses the feasibility of ACU for
ten South East Asian countries, which are commonly known as ASEAN and
represent an important portion of East Asian economy. The study has two
contributions for ASEAN literature. First, ACU is feasible for the ASEAN countries in
terms of increasing intra-ASEAN trade, however, may not be cost effective in terms
of achieving the required level of pre-currency union economic convergence among
the members. Second, this paper overcomes a major limitation of gravity model (a
commonly used trade model) by developing an alternative trade model which
captures the possible outcome of a future economic event. Gravity model is an
effective tool for analysing trade flows as a result of an existing currency union,
however, cannot predict the possible trade enhancement which would be possible
with a future currency union. Instead, the Event study model of trade developed in
this study forecasts possible trade enhancement of Asian Currency Unit in three
steps. First, an existing event has been selected as a benchmark; second, the
benchmark is analysed to estimate the possible trade enhancement factor, and
finally, the trade enhancement factor has been applied to a hypothetical event of
Asian Currency Unit for forecasting the possible outcome of that event. The study
successfully predicts the possible positive outcome of Asian Currency Unit in terms
of intra-ASEAN trade enhancement, and suggests for quantification of the cost for
achieving required level of ASEAN macroeconomic convergence as a pre-condition
of the perceived monetary union.
Key Words: ASEAN, Asian Currency Unit (ACU), Currency Union, Trade Integration, Event Study
JEL Classifications: C02, C63, F14, F15, F17, F33

YF37-04: Asian Currency Unit and ASEAN Trade Prospect
PAFTAD International Secretariat Crawford School of Public Policy
College of Asia and the Pacific The Australian National University
Canberra ACT 0200 Australia
1. Introduction
Economic integration and currency union has been one of the major research
topics since the initiation of Mundell’s (1961) OCA theory. However, controversy
exists over feasibility of common monetary policy around the region, particularly
after the economic struggle of the European Union (EU) members. Instead, East
Asia is often considered as a potential optimum currency area, which is fuelled
by successful regional economic and trade integration in this region in last two
decades. Some prominent economists such as Mundell (2003) has proposed for
Asian Currency Unit (ACU) and suggested for sorting out a suitable anchor for
such common currency (others, for example Shimizutani, 2009; Lee and Koh,
2012). The other group opposed the idea of ACU highlighting strong
heterogeneous pattern among East Asian economies (for example, Sato and
Zhang, 2006; Bacha, 2008; Nguyen, 2010; Yeh, 2013). These studies, however,
highlighted possible costs of a monetary union in East Asia.
Under the light of this debate, the current study analyses the possible intra-
regional trade benefit of ASEAN members from the proposed Asian Currency
unit. ASEAN is often considered as important part of East Asia in terms of trade.
However, in last two decades, ASEAN members showed remarkable progress of
regional integration which substantially reflects through their intra- and extra-
ASEAN trade enhancement (Thong, 2014). In such situation, how much
additional trade creation might be possible for ASEAN members by accepting a
common Asian currency is an important policy question. The current study
attempts to answer the question in terms of intra-ASEAN trade benefit.
The study does an important methodological improvement in forecasting the
trade outcome of a future economic event, such as, a currency union. Existing
trade literature typically applies Gravity model as a basic analytical tool for
analysing existing trade flows. A major transform of gravity model takes place
when Rose (2000) applies two new variables to the model, one is the effect of
currency union on trade flows, and other is the response of bilateral trade to
bilateral nominal exchange rate volatility. Rose’s modified gravity model was
YF37-04: Asian Currency Unit and ASEAN Trade Prospect
PAFTAD International Secretariat Crawford School of Public Policy
College of Asia and the Pacific The Australian National University
Canberra ACT 0200 Australia
well enough to measure the impact of Euro on EU members’ trade during the
post-Euro period. However, even after further improvement in the last decade,
gravity model is far away to predict the prospect of a future currency union.
This study applies an alternative approach in assessing the possible trade
enhancement from a prospective currency union. The contribution of this paper
to the literature is threefold. First, event study method is a commonly used
technique in Finance to observe the impact of a sudden event. The current study
extends the event study model to include trade variables and currency union
effects. The performance of the model is compared with the performance of
gravity model. Second, the model is further extended to capture the impacts of a
future currency union compared with a pre-selected benchmark. Thus the event
study model of trade overcomes a major drawback of forecast ability of the
gravity model; that is, predicting possible outcome of a future economic event.
Finally, in current study, the model assesses the potential trade benefit of the
proposed Asian Currency Unit. For this, assumption is made for a hypothetical
scenario a common currency in 2012. The results are compared to the actual
situation to test whether ACU would offer much trade benefit to ASEAN
countries. Thus quantification of potential trade benefit is made possible by
using the Event study model.
The Event study model of trade developed in this study consists of two parts, one
is benchmark analysis tool and the other is forecasting tool. Numerical
simulations of the model show that if ASEAN economic integration can reach to a
similar level of economic integration as in the pre-Euro European Union, the
Asian Currency Unit would increase intra-ASEAN trade by 21 cent against every
dollar of ASEAN GDP. However, the forecast of trade benefit is observed at a
range of 11 to 14 cent against every dollar of ASEAN GDP when the benchmark is
analysed using gravity approach. Thus the study has two important implications.
First, the forecasting tool developed in this study model works well to predict
the possible trade outcome of a future economic event ie implementation of
Asian Currency Unit, however, the benchmark analysis tool shows tendency to

YF37-04: Asian Currency Unit and ASEAN Trade Prospect
PAFTAD International Secretariat Crawford School of Public Policy
College of Asia and the Pacific The Australian National University
Canberra ACT 0200 Australia
overestimate compare to parametric model. Second, Asian Currency Unit would
be feasible for ASEAN countries in terms of creating additional intra-regional
trade benefit, however, may not be cost effective in terms of achieving expected
level of pre-currency union economic convergence.
The remainder of the paper is organized as follows. Section 2 reviews the
literature relating to the study. Section 3 describes the model and is followed by
a description of data and analysis in Section 4. The estimated trade benefit
amount is verified using an alternative parametric model in Section 5. The last
section concludes the paper.
2. Review of Literature
The success of European economic integration in launching of Euro in 1999
encouraged economists to further investigate the integration potentiality of
other regions. A number of regions such as East Asia, the Association of South
East Asian Nations (ASEAN), the South Mediterranean countries, the East African
Community (EAC) and the Gulf Cooperation Council (GCC) appear as potential
candidates for regional economic integration (Bayoumi and Eichengreen, 1997).
East Asia, including the ASEAN countries, is often pronounced as highly credible
optimum currency area. The issue becomes particularly important following the
1997-98 Asian financial crisis and a fast recovery of most members from that
crisis (Madhur, 2002). Almost all members were able to maintain high economic
growth in 2000 onwards.
The post-Asian crisis literature brings forward the importance of selecting a
proper exchange rate system for Asian countries (Madhur, 2002). East Asian
courtiers showed a trend to move towards the flexible exchange rate system to
avoid any future financial crisis. However, performance of the flexible exchange
rate regime becomes questionable in long-run for increasing volatility in the
foreign exchange market (Madhur, 2002). Moreover, retaining monetary
autonomy under the free-floating system might be challenging for East Asian
countries (Lee, Shin, and Park, 2004).
YF37-04: Asian Currency Unit and ASEAN Trade Prospect
PAFTAD International Secretariat Crawford School of Public Policy
College of Asia and the Pacific The Australian National University
Canberra ACT 0200 Australia
The concept of Asian Currency Unit (ACU) comes forward as a more realistic goal
for East Asian economic integration in recent literature. The Nobel-prize winning
economist and a major contributor of OCA theory, Robert Mundell highlights the
prospects of a large currency area in Asia (Mundell, 2003). He prioritizes
selection of anchor currency in East Asia as more important over assessing the
optimality of currency area. He discards the existing literature suggesting
currency basket of dollar, euro and yen, mostly because of the high instability of
yen-dollar rates. Rather he proposes a cooperative arrangement between China
and Japan to form an Asian currency area. Considering the difference between
Asia and the European model in term of institutional, economic and political
framework, Mundell suggests for an external currency as a possible alternative
anchor.
Shimizutani (2009) supports Mundell by introducing a three-step “roadmap” for
Asian currency union beginning with a regional cooperation mechanism,
followed by introduction of an Asian currency unit (ACU) in the 2020s and
incorporation of the Asian common currency in the 2030s. Political alliance
within the region was strongly advised for the success of this roadmap. Though
Lee and Koh (2012) did not support East Asia wide currency union, they
suggested for ASEAN monetary union as a long term policy goal.
Literature suggests additional trade creation as a major benefit of currency
union. However, the true potential benefit of ACU in terms of additional trade
enhancement is still unexplored. By claiming current East Asian economic
integration process as an effective step for unmarked trade liberalization
process, Hashmi and Lee (2008) proposed for using initial flexible agreements
for currency stabilization, followed by future stiff agreements. The market-
driven economic integration in East Asia suffers from limited institutional
support in terms of Asia-wide FTAs, financial stabilization mechanism and
intraregional exchange rate stabilization. Political and economic divergence also
slows down the institutional cooperation. In fact, East Asia differs from other
regions in terms of regional integration process from both economic and trade

YF37-04: Asian Currency Unit and ASEAN Trade Prospect
PAFTAD International Secretariat Crawford School of Public Policy
College of Asia and the Pacific The Australian National University
Canberra ACT 0200 Australia
perspective. Trade integration in East Asia started through the market much
before developing formal agreements, while other regions mostly initiated their
integration through formal treaties. Strong political bargaining power was
achieved through market-oriented integration, which perhaps led stronger
economic integration in East Asia (Aminia, Fung and Ng, 2009).
With such strong trade integration, empirical literature fails to support
Shimizutani and Mundell’s claim for Asian Currency Unit. Instead, Yeh (2013)
supports for smaller voluntary currency areas in East Asia instead of forming
Asian Currency Unit. In fact, this suggestion is more practical because the success
of East Asian economic integration is still limited within trade integration
(Thong, 2014).
Though literature identifies trade enhancement as a major benefit of common
currency formation, East Asian countries have already achieved substantial trade
enhancement with their ongoing integration arrangement. The additional trade
benefit over the high cost of forming and maintaining a large currency area is an
important policy issue. The issue is further highlighted in literature by showing
high level of heterogeneity among East Asian economies (Lee and Azali, 2010).
However, existing literature mostly studies East Asia as a whole. In spite of being
part of East Asia, ASEAN countries have their own institutional arrangement of
regional economic and trade integration. Only few articles extensively focus on
ASEAN members for assessing the common currency impact. The current study
contributes to the literature by assessing the possible intra-ASEAN trade benefit
that would be made possible by introducing the proposed Asian Currency Unit.
The next section discusses the methodology of the study.
3. Event Study Model of Trade
3.1 Theoretical Foundation
The foundation of the event study approach is the seminal works of Ashley
(1962), Ball and Brown (1968) and Fama et al. (1969). This approach has been
adopted by a number of researchers (example) to assess the impact of an event
YF37-04: Asian Currency Unit and ASEAN Trade Prospect
PAFTAD International Secretariat Crawford School of Public Policy
College of Asia and the Pacific The Australian National University
Canberra ACT 0200 Australia
on stock returns or asset prices or firms’ earnings. For example, an event
includes the announcement of a merger, a stock split, a legislative act or
regulatory ruling. The methodology is based on the assumption that the
historical information is sufficient to estimate the effect of new information, and
the information is termed an event. According to the literature (for example,
Bowman, 1983; Peterson, 1989; Campbell et al., 1997; Mackinlay, 1997;
Dasgupta et al., 1998), the event study method proceeds through several steps:
(i) Event identification and event window determination; (ii) selection of a
sample set of cases to be analysed; (iii) prediction of a “normal” outcome during
the event window when the event is absent; (iv) evaluation of the cumulative
abnormal outcome (event effect) within the event window; (v) test for statistical
significance of the cumulative abnormal outcome.
Traditionally, trade analysis applies the gravity model of trade. However, the
Event Study method can be alternatively applied to analyse the impact of an
economic event on trade. For example, the trade enhancement factor of Euro
implementation for the Euro-members can be estimated using the event study
approach, and the results can be verified in gravity framework. Based on the
rationale, this paper applies the event study method to forecast the incremental
trade intensity in a hypothetical Asian common currency scenario for the ASEAN
economies. For this, the model measures the trade enhancement factor from the
Euro countries, and then applies that factor to the ASEAN economy. Hence, the
implementation of Euro is considered as the event of interest for the analysis,
and the event window is defined as ten years prior to the event and ten years
after the event. Inclusion of ten year periods before and after the event is
suggested by Dasgupta et al. (1998). Following Binder (1998), the event period
and one year prior and after the event have been excluded to avoid any bias.
Hence pre-Euro period is 1988 to 1997 and post-Euro period is 2001 to 2010.
For this study, the ratio of trade over GDP has been termed as trade intensity

YF37-04: Asian Currency Unit and ASEAN Trade Prospect
PAFTAD International Secretariat Crawford School of Public Policy
College of Asia and the Pacific The Australian National University
Canberra ACT 0200 Australia
(TI). Thus, trade intensity is interpreted as the amount of trade against every
dollar of GDP. The Euro model consists of the initial Euro members.1
Unlike the gravity model, a major advantage of this method is the model’s ability
to forecast the impact of a proposed currency union. Methodically this model
performs the cross-sectional analysis and the time-series analysis at two
different stages, and then combines together, and thus performs as similar to the
panel analysis.
In this study, euro is the only choice as the comparing coefficient in spite of its
ongoing criticism. Particularly there is no alternative complete economic and
monetary union available, which would provide a better benchmark.
3.2 Model Specification
The model is designed with two parts. First, the model analyses the trade
enhancement factor of a selected benchmark. Hence, we term this part as
benchmark analysis tool. For the current study, implementation of Euro has been
selected as a benchmark. Hence the first part of the model (benchmark analysis)
is developed focusing the Euro area. The second part of the model is a
forecasting tool, which is developed for forecasting the additional trade benefit
of a potential currency union. For the current study, the event study model
forecast the possible trade benefit of Asian currency Unit for the Southeast Asian
(ASEAN) countries.
The benchmark analysis part of the event study model begins by calculating the
trade intensity for each of the EU members for the pre- and post-event periods.
Following implementation of Euro in 1999, the pre-event period is considered
from 1988 to 1997 and the post-event period from 2001 to 2010. The immediate
year prior and after the event are excluded to avoid biasness. Hence, the trade
intensity for the EU members is calculated as:
pre
pre
pre
it
it
itGDP
TradeTI … … … (1)
1A list of the countries is provided in Table 1

YF37-04: Asian Currency Unit and ASEAN Trade Prospect
PAFTAD International Secretariat Crawford School of Public Policy
College of Asia and the Pacific The Australian National University
Canberra ACT 0200 Australia
post
post
post
it
it
itGDP
TradeTI … … … (2)
Here, TI (Trade/GDP) is the trade intensity; i (=1, ……, 45) refers to number of
country pairs; tpre (=1988 – 1997) is the pre-event period and tpost (=2001 – 2010)
is the post-event period.2 A major advantage of using trade intensity is that both
trade and GDP are estimated in the same currency, hence the ratio itself
neutralizes the effects of any exchange rate changes.
The calculated trade intensities of the pre- and post-event periods are
aggregated across time for each of the country-pair events. This process returns
the cumulative trade intensity (CTI) as follows:
1997
1988
)(pre
pre
t
itprei TIECTI … … … (3)
2010
2001
)(post
post
t
itposti TIECTI … … … (4)
Here, Epre stands for the per-event periods in the EU and Epost stands for the post-
event periods in the EU.
The aggregation across time and event is done by calculating the cumulative
average of trade intensity (CATI) as follows:
)(1
)(1
pre
N
i
ipre ECTIN
ECATI
… … … (5)
)(1
)(1
post
N
i
ipost ECTIN
ECATI
… … … (6)
where, N stands for the number of country pairs (45 in this case).3
Finally, the trade enhancement has been calculated from the cumulative average
trade intensity (CATI) for the pre- and post-event periods:
2 Here GDP refers to the reporting country’s GDP.
3 For being consistent with Event study literature, unweighted averages are used rather than averages
based on country size in terms of trade or GDP.

YF37-04: Asian Currency Unit and ASEAN Trade Prospect
PAFTAD International Secretariat Crawford School of Public Policy
College of Asia and the Pacific The Australian National University
Canberra ACT 0200 Australia
)(
)(
pre
post
ECATI
ECATIcementTradeEnhan … … … (7)
The second part of the model is developed for forecasting trade benefit of a
potential currency union. This study intends to forecast the trade benefit for
ASEAN countries fuelled by Asian Currency Unit. For this, a hypothetical event of
currency union is assumed in the year 2012. Hence, the pre-event period is taken
as 2001 to 2010. Thus the relation for trade intensity stands as:
pre
pre
pre
it
it
itGDP
TradeTI … … … (8)
Here, the number of country pairs i ranges from 1 to 35 and the pre-event period
tpre ranges from 2001 – 2010.
Following this, the relationships for cumulative trade intensity (CTI) and the
cumulative average of trade intensity (CATI) are:
2010
2001
)(pre
pre
t
itprei TIACTI … … … (9)
)(1
)(1
pre
N
i
ipre ACTIN
ACATI
… … … (10)
Apre stands for the per-event period for ASEAN and N is the number of country
pairs (35 in this case).
Following the definition of trade enhancement used in this chapter, trade
enhancement can be calculated as:
)(
)(
pre
post
ACATI
ACATIcementTradeEnhan … … … (11)
where, Apost stands for the post-event period for ASEAN.
The core hypothesis of this study is to observe the impact of an ASEAN currency
union on members’ intra-regional trade, provided the level of ASEAN regional
integration can achieve the same level as that of the EU. According to this
assumption, the trade enhancement of the EU and ASEAN should be equal.

YF37-04: Asian Currency Unit and ASEAN Trade Prospect
PAFTAD International Secretariat Crawford School of Public Policy
College of Asia and the Pacific The Australian National University
Canberra ACT 0200 Australia
Hence, Equation (7) and Equation (11) must be equal. This relation can be
written as:
)(
)(
)(
)(
pre
post
pre
post
ECATI
ECATI
ACATI
ACATI … … … (12)
After rearranging, Equation (12) becomes:
)()(
)()( pre
pre
post
post ACATIECATI
ECATIACATI … … … (13)
Equation (13) returns the amount of cumulative average trade intensity that can
be achieved from an ASEAN currency union if the ASEAN level of regional
integration reaches a similar level of integration as did the EU.
4. Data Analysis and Results
4.1 Description and sources of data
Table 1: Selected country-pairs of the EU members4
Trade
Austria Finland France Germany Greece Ireland Italy Netherlands Portugal
Finland France Germany Greece Ireland Italy Netherlands Portugal Spain
France Germany Greece Ireland Italy Netherlands Portugal Spain
Germany Greece Ireland Italy Netherlands Portugal Spain
Greece Ireland Italy Netherlands Portugal Spain
Ireland Italy Netherlands Portugal Spain
Italy Netherlands Portugal Spain
Netherlands Portugal Spain
Portugal Spain
Spain
Analysis proceeds in two stages. First, a benchmark of trade enhancement factor
has been estimated from the EU economy, which refers how much additional
trade has been performed by the Euro members following implementation of a
4 Countries in the 1
st row are considered as reporting countries for EU trade
YF37-04: Asian Currency Unit and ASEAN Trade Prospect
PAFTAD International Secretariat Crawford School of Public Policy
College of Asia and the Pacific The Australian National University
Canberra ACT 0200 Australia
common currency. Second, the estimated trade enhancement factor is applied to
ASEAN economy to observe the trade prospect of Asian Currency Unit.
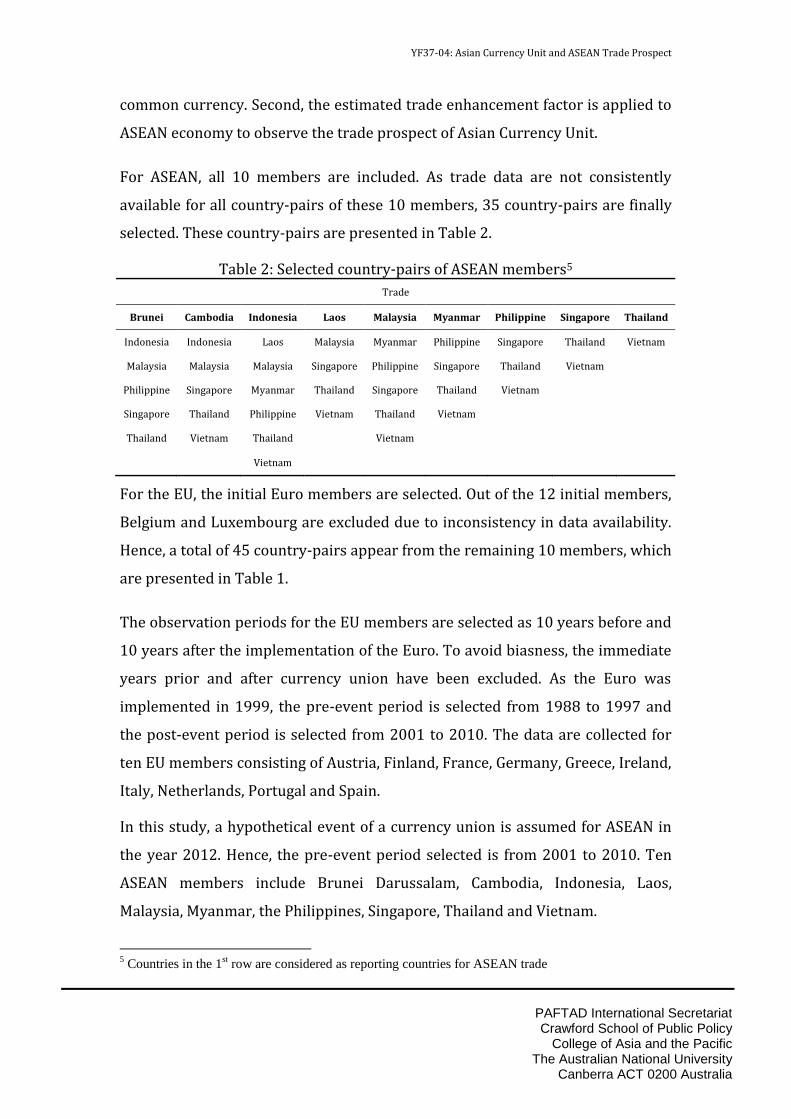
For ASEAN, all 10 members are included. As trade data are not consistently
available for all country-pairs of these 10 members, 35 country-pairs are finally
selected. These country-pairs are presented in Table 2.
Table 2: Selected country-pairs of ASEAN members5
Trade
Brunei Cambodia Indonesia Laos Malaysia Myanmar Philippine Singapore Thailand
Indonesia Indonesia Laos Malaysia Myanmar Philippine Singapore Thailand Vietnam
Malaysia Malaysia Malaysia Singapore Philippine Singapore Thailand Vietnam
Philippine Singapore Myanmar Thailand Singapore Thailand Vietnam
Singapore Thailand Philippine Vietnam Thailand Vietnam
Thailand Vietnam Thailand Vietnam
Vietnam
For the EU, the initial Euro members are selected. Out of the 12 initial members,
Belgium and Luxembourg are excluded due to inconsistency in data availability.
Hence, a total of 45 country-pairs appear from the remaining 10 members, which
are presented in Table 1.
The observation periods for the EU members are selected as 10 years before and
10 years after the implementation of the Euro. To avoid biasness, the immediate
years prior and after currency union have been excluded. As the Euro was
implemented in 1999, the pre-event period is selected from 1988 to 1997 and
the post-event period is selected from 2001 to 2010. The data are collected for
ten EU members consisting of Austria, Finland, France, Germany, Greece, Ireland,
Italy, Netherlands, Portugal and Spain.
In this study, a hypothetical event of a currency union is assumed for ASEAN in
the year 2012. Hence, the pre-event period selected is from 2001 to 2010. Ten
ASEAN members include Brunei Darussalam, Cambodia, Indonesia, Laos,
Malaysia, Myanmar, the Philippines, Singapore, Thailand and Vietnam.
5 Countries in the 1
st row are considered as reporting countries for ASEAN trade

YF37-04: Asian Currency Unit and ASEAN Trade Prospect
PAFTAD International Secretariat Crawford School of Public Policy
College of Asia and the Pacific The Australian National University
Canberra ACT 0200 Australia
For each member, the annual data on exports and imports are collected from the
IMF Direction of Trade Statistics (DOTS) against other partners in the selected
country-pairs. A small amount of export and import data are unavailable in the
IMF series, which are collected from the UN COMTRADE database and adjusted
with the IMF series. Data on GDP are collected from the World Bank World
Development Indicator (WDI) database.
4.2 Benchmark analysis: EU’s trade benefit from the Euro
The analysis begins with calculating the trade benefit of Euro members that was
fuelled by implementation of Euro. The analysis proceeds at three stages; first,
calculation of individual trade intensities, second, calculation of cumulative trade
intensities, and finally, calculating the trade enhancement factor. The trade
enhancement factor will suggest how much intra- EU trade has increased over 10
year’s period of post-Euro era.
4.2.1 Individual Trade Intensities for Euro zone
Figure 1 presents the calculated trade intensities of the 45 selected EU country-
pairs for the pre-implementation period of the Euro (1988–1997). For most of
the pairs, trade intensities are less than 0.05, suggesting that trade of these
country-pairs are mostly at or below 5 cents for every dollar of the respective
reporting country’s GDP.6 Five country-pairs, namely, Austria-Germany, Finland-
Germany, France-Germany, Portugal-Spain and Ireland-Netherlands appear as
exceptions.
The trade intensity of the Austria-Germany pair ranges from 0.19 to 0.24 in the
pre-Euro period, implying that trade between Austria and Germany is between
19 to 24 cents for every dollar of Austrian GDP. The trade intensity of the
Portugal-Spain pair is about 0.07 till 1993, and then the intensity starts to
increase and reaches 0.1 in 1997. This result suggests that trade between
Portugal and Spain is about 7 cents for every dollar of Portuguese GDP till 1993
and gradually increases to 10 cents in 1997. The trade intensity of the France-
6 List of reporting countries of the EU is presented in Table 1

YF37-04: Asian Currency Unit and ASEAN Trade Prospect
PAFTAD International Secretariat Crawford School of Public Policy
College of Asia and the Pacific The Australian National University
Canberra ACT 0200 Australia
Germany pair is about 0.06 till 1991, and then it increases and stays at or slightly
above 0.07. This result implies that trade between France and Germany pair is
about 6 cents for every dollar of French GDP till 1991, and then increases to
about 7 cents.
Figure 1: Per-Euro EU Trade Intensity (1988-1997)
Source: Author’s calculation based on data collected from IMF Direction of Trade Statistics
(DOTS), UNCOMTRADE database and World Bank World Development Indicator (WDI) database
The trade intensity of the Finland-Germany pair varies from 0.056 to 0.066,
implying that trade between Finland and Germany varies between 5.6 to 6.6
cents for every dollar of Finish GDP. The trade intensity of the Ireland-
Netherlands pair varies from 0.047 to 0.06, suggesting that trade between
Ireland and Netherlands varies between 4.7 to 6 cents for every dollar of Irish
GDP.
Figure 2 presents the calculated trade intensities of the 45 selected EU country-
pairs for the post-implementation period of the Euro (2001–2010). Trade
intensities of most of the country-pairs are less than 0.05, implying that their

YF37-04: Asian Currency Unit and ASEAN Trade Prospect
PAFTAD International Secretariat Crawford School of Public Policy
College of Asia and the Pacific The Australian National University
Canberra ACT 0200 Australia
trade is at or below 5 cents for every dollar of the respective reporting country’s
GDP. Four exceptions appear in this case, which are Austria-Germany, Portugal-
Spain, Finland-Germany, France-Germany and Germany-Netherlands.
The trade intensity of the Austria-Germany pair ranges from 0.28 to 0.33 in the
post-Euro period, suggesting that the implementation of the Euro increases trade
between Austria and Germany to a range of 28 to 33 cents for every dollar of
Austrian GDP. Similarly, the introduction of the Euro increases the trade
intensity of the Portugal-Spain pair to a range of 0.12 to 0.18, implying that the
post-Euro trade between Portugal and Spain increases to a range of 12 to 18
cents for every dollar of Portuguese GDP.
Figure 2: Post-Euro EU Trade Intensity (2001-2010)
Source: Author’s calculation based on data collected from IMF Direction of Trade Statistics
(DOTS), UNCOMTRADE database and World Bank World Development Indicator (WDI) database
The trade intensity of the Finland-Germany pair ranges from 0.075 to 0.092 and
the France-Germany pair ranges from 0.076 to 0.082 in the post-Euro period.
This result suggests that the currency union increases trade between Finland

YF37-04: Asian Currency Unit and ASEAN Trade Prospect
PAFTAD International Secretariat Crawford School of Public Policy
College of Asia and the Pacific The Australian National University
Canberra ACT 0200 Australia
and Germany to a range of 7.5 to 9.2 cents for every dollar of Finish GDP, while
trade between France and Germany increases to a range of 7.6 to 8.2 cents for
every dollar of French GDP. In the period of 2007 to 2009, the trade intensity of
the Germany-Netherlands pair is observed in the range of 0.058 to 0.067,
suggesting that their trade increases to a range of 5.8 to 6.7 cents for every dollar
of Greek GDP during 2007 to 2009. For most country-pairs, a declining trend of
trade intensities is observed in 2009, which revives in 2010.
4.2.2 Cumulative Trade Intensities for Euro zone
Figure 3 presents the cumulative EU trade intensity for each of the 45 country-
pairs for the 10 years prior to the currency union. The maximum cumulative
trade intensity value of 2.1 is observed for the Austria-Germany pair, which
implies that the cumulative trade between Austrian and Germany during the pre-
Euro period is 2.1 dollar for every dollar of Austrian GDP.
Figure 3: Per-Euro Cumulative EU Trade Intensity (1988-1997)
Source: Author’s calculation based on data collected from IMF Direction of Trade Statistics
(DOTS), UNCOMTRADE database and World Bank World Development Indicator (WDI) database
The cumulative trade intensities of the Finland-Germany, the France-Germany,
the Ireland-Netherlands and the Portugal-Spain pairs vary from 0.5 to 1,
implying that the cumulative trade between Finland and Germany, France and
Germany, Ireland and Netherlands and Portugal and Spain during the pre-Euro
YF37-04: Asian Currency Unit and ASEAN Trade Prospect
PAFTAD International Secretariat Crawford School of Public Policy
College of Asia and the Pacific The Australian National University
Canberra ACT 0200 Australia
period are 50 cents to 1 dollar for every dollar of Finish, French, Irish and
Portuguese GDP respectively. The cumulative trade intensities of five country-
pairs are observed to vary from 0.2 to 0.3. These country-pairs are the France-
Italy, the German-Italy, the German-Netherlands, the Greece-Italy and the
Ireland-Italy. These ratios imply that the cumulative trade between France and
Italy, German and Italy, German and Netherlands, Greece and Italy and Ireland
and Italy during the pre-Euro period are 20 to 30 cents for every dollar of
French, German, Greek and Irish GDP respectively.
The cumulative trade intensities of 15 country-pairs, namely, Austria-France,
Austria-Ireland, Austria-Italy, Austria-Netherland, Finland-France, Finland-Italy,
Finland-Netherlands, France-Netherlands, France-Spain, Germany-Spain, Greece-
Netherlands, Ireland-Spain, Italy-Netherlands, Italy-Spain and Netherlands-Spain
vary from 0.1 to 0.3, meaning that the cumulative trade between these country-
pairs during the pre-Euro period are 10 to 30 cents for every dollar of their
respective reporter’s GDP. For the rest 20 country-pairs, the cumulative trade
intensities are observed to be below 0.1, implying that the cumulative trade
between these country-pairs during the pre-Euro period are less than 10 cents
for every dollar of their respective reporter’s GDP.
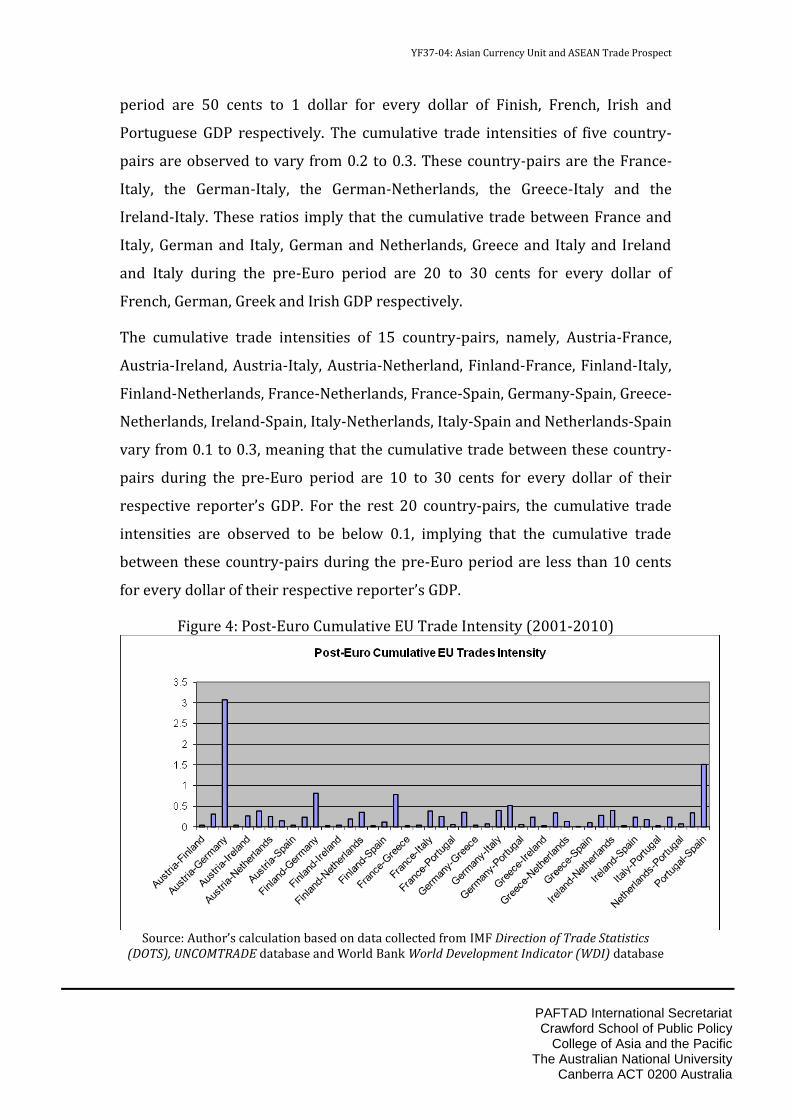
Figure 4: Post-Euro Cumulative EU Trade Intensity (2001-2010)
Source: Author’s calculation based on data collected from IMF Direction of Trade Statistics
(DOTS), UNCOMTRADE database and World Bank World Development Indicator (WDI) database

YF37-04: Asian Currency Unit and ASEAN Trade Prospect
PAFTAD International Secretariat Crawford School of Public Policy
College of Asia and the Pacific The Australian National University
Canberra ACT 0200 Australia
Figure 4 presents the cumulative trade intensity for each of the 45 EU country-
pairs for the 10 years following the currency union. The maximum cumulative
trade intensity is 3.08 observed for the Austria-Germany pair, which means that
the currency union increases the cumulative trade between Austrian and
Germany to 3.08 dollars for every dollar of Austrian GDP. The second highest
cumulative trade intensity of 1.51 is observed for the Portugal-Spain pair, which
implies that the currency union increases the cumulative Portuguese trade with
Spain to 1.51 dollar for every dollar of Portuguese GDP. For three country-pairs,
the cumulative trade intensities is observed between 0.5 to 1, implying that the
cumulative trade of these country-pairs during the post-Euro period are 50 cents
to 1 dollar for every dollar of their respective reporter’s GDP. These country-
pairs are Finland-Germany, France-Germany and Germany-Netherlands.
The cumulative trade intensities of eight country-pairs, namely, Austria-Italy,
Finland- Netherlands, France-Italy, France-Spain, Germany-Italy, Greece-Italy,
Ireland-Netherlands and Netherlands-Spain vary from 0.3 to 0.5, implying that
the cumulative exports of these country-pairs during the post-Euro period are 30
to 50 cents for every dollar of their respective reporter’s GDP. For fifteen
country-pairs, the cumulative trade intensities is observed between 0.1 to 0.3,
implying that the cumulative trade of these country-pairs during the post-Euro
period are 10 to 30 cents for every dollar of their respective reporter’s GDP.
These country-pairs are Austria-France, Austria-Ireland, Austria-Netherland,
Austria-Portugal, Finland-France, Finland-Italy, Finland-Spain, France-
Netherlands, German-Spain, Greece-Netherlands, Greece-Spain, Ireland-Italy,
Ireland-Spain, Italy-Netherlands and Italy-Spain. For the rest 17 country-pairs,
the cumulative trade intensities are observed to be below 0.1, implying that the
cumulative trade of these country-pairs during the post-Euro period are less
than 10 cents for every dollar of their respective reporter’s GDP.
In summary, cumulative trade intensity of the EU country-pairs show substantial
trade improvement following implementation of Euro except for trade between
Ireland-Italy and Ireland-Netherland. During pre-Euro period, Ireland used to

YF37-04: Asian Currency Unit and ASEAN Trade Prospect
PAFTAD International Secretariat Crawford School of Public Policy
College of Asia and the Pacific The Australian National University
Canberra ACT 0200 Australia
trade 32 cents with Italy and 53 cents with Netherlands against every dollar of
their own GDP. However, the amount reduced to 29 cents for Ireland-Italy trade
and to 39 cents for Ireland-Netherland trade during post-Euro period. In general,
the Euro is able to remarkably enhance intra-EU trade.
4.2.3 Trade Enhancement for Euro zone
Table 3 presents the calculation of the possible ASEAN trade enhancement from
a currency union. The first part of the calculation represents results for
benchmark analysis, which is done for the Euro members. The second part of the
calculation represents results for forecast of prospective currency union, which
is done for ASEAN members.
Table 3: Calculation of possible ASEAN trade enhancement from a Currency Union
European Union ASEAN
Cumulative Average
Trade Intensity
(CATI)
Trade Enhancement
Factor
Cumulative Average Trade
Intensity (CATI)
Possible Trade Enhancement
Pre-Event period
0.223627097
1.342377104
0.6057567712
0.2073972491 Post-Event period
0.300191894 0.81315402
The benchmark analysis shows the calculation for the trade enhancement factor
achieved by the European Union by developing the Euro zone. The cumulative
average trade intensities (CATI) for the European Union are calculated as 0.2234
for the pre-Euro period and 0.3002 for the post-Euro period. This result suggests
that on average, 22 cents of trade occurs between the EU members for every
dollar of their GDP in the 10 years prior to the currency union. On the other
hand, an average 30 cents of trade occurs between the EU members for every
dollar of their GDP in the 10 years following the currency union. Based on these
results, the trade enhancement factor is estimated as 1.3424, implying that the
currency union increases the average intra- EU trade by nearly 34 per cent over
the 10 years’ post-event windows.

YF37-04: Asian Currency Unit and ASEAN Trade Prospect
PAFTAD International Secretariat Crawford School of Public Policy
College of Asia and the Pacific The Australian National University
Canberra ACT 0200 Australia
Earlier, applying panel approach, Glick and Rose (2002) suggested that bilateral
trade almost doubles between a country-pair sharing a common currency
However, applying the multilateral-trade-resistance index, Rose and Wincoop
(2001) projected 59% for trade enhancement among Euro members. Instead,
Nardis and Vicarelli (2003) showed that the Euro increases extra-EMU trade by
6.3% and only a 2.6% increase of intra-EMU trade after immediate
implementation of Euro. Those studies were limited to initial impact of Euro on
EU trade. The current study observes a relatively longer term effect of Euro on
intra-Euro trade, and the result is realistic compare to Glick and Rose (2002) and
Rose and Wincoop (2001).
4.3 Calculation of ASEAN trade prospect
The first part of the analysis reveals that the Euro enhances 35 per cent of intra-
EU trade among the initial Euro members. The second part focuses on calculating
possible intra-ASEAN trade enhancement if Asian Currency Unit can be
implemented. The underlying assumption is that pre-currency union ASEAN
members achieve the same level of regional integration of the Euro members
before implementation of Euro. The analysis proceeds at three stages; first,
calculation of individual trade intensities of ASENA members, second, calculation
of cumulative trade intensities, and finally, applying the trade enhancement
factor of the Euro model to the ASEAN model for forecasting of possible intra-
ASEAN trade enhancement. The result will suggest how much intra-ASEAN trade
would increase if the ACU is implemented and provided ASEAN leaders accept
the ACU.
4.3.1 Individual Trade Intensities for ASEAN
Figure 3 presents the calculated trade intensities of the 35 selected ASEAN
country-pairs from 2001 to 2010. ASEAN trade intensities appear to be more
heterogeneous with higher magnitudes than that of the EU. Trade intensity of
Laos-Thailand pair is about 0.3 till 2004, increases to 0.49 in 2008 and then
reduces to 0.4 in 2009. This result implies that trade between Laos and Thailand
is 30 cents for every dollar of Laos’s GDP till 2004, increasing to 49 cents in 2008

YF37-04: Asian Currency Unit and ASEAN Trade Prospect
PAFTAD International Secretariat Crawford School of Public Policy
College of Asia and the Pacific The Australian National University
Canberra ACT 0200 Australia
and then dropping to 32.5 cents in 2009. Trade intensity of the Malaysia-
Singapore pair is 0.51 in 2000, which declines to 0.31 in 2009, implying that
trade between Malaysian and Singapore is 51 cents for every dollar of Malaysian
GDP in 2000, gradually reducing to 31 cents in 2009.
Figure 5: ASEAN Trade Intensity (2001-2010)
Source: Author’s calculation based on data collected from IMF Direction of Trade Statistics
(DOTS), UNCOMTRADE database and World Bank World Development Indicator (WDI) database
Trade intensity of the Brunei-Singapore pair varies from 0.18 to 0.325, while
trade intensity of the Brunei-Thailand pair varies from 0.166 to 0.363. These
results indicate that Brunei trades 18 to 32.5 cents with Singapore and 16.6 to
36.3 cent with Thailand for every dollar of their GDP. Similarly, trade intensity of
the Brunei-Malaysia pair varies from 0.085 to 0.157, suggesting that Brunei
trades 8.5 to 15.7 cents with Malaysia for every dollar of their GDP. Trade
intensity of the Brunei-Indonesia pair is 0.007 in 2000, increases to 0.19 in 2008
and then reduces to 0.051 in 2009. This result implies that trade between

YF37-04: Asian Currency Unit and ASEAN Trade Prospect
PAFTAD International Secretariat Crawford School of Public Policy
College of Asia and the Pacific The Australian National University
Canberra ACT 0200 Australia
Bruneian and Indonesia is about 0.7 cents for every dollar of Bruneian GDP in
2000, increasing to 19 cents in 2008 and then dropping to 5.1 cents in 2009.
For the Cambodia-Thailand pair, trade intensity is observed to be around 0.05,
though peaks are observed in 2001 and 2007 with values of 0.128 and 0.178
respectively. This result implies that trade between Cambodia and Thailand is
about 5 cents for every dollar of Cambodian GDP, though peaks of 12.8 cents and
17.8 cents are observed in 2001 and 2007 respectively. For the other country-
pairs, trade intensities remain at less than 0.1, indicating that trade between
these country-pairs is at or below 10 cents for every dollar of the respective
reporting country’s GDP.7
Among the country-pairs, a common phenomenon is the sharp drop of trade
intensities during 2009, followed by substantial improvement in 2010. This
shows that ASEAN countries have recovered quickly from the GFC.
4.2.2 Cumulative Trade Intensities for ASEAN
Figure 6: Cumulative ASEAN Trade Intensity (2001-2010)
Source: Author’s calculation based on data collected from IMF Direction of Trade Statistics
(DOTS), UNCOMTRADE database and World Bank World Development Indicator (WDI) database
7 List of reporting countries of ASEAN is presented in Table 2
YF37-04: Asian Currency Unit and ASEAN Trade Prospect
PAFTAD International Secretariat Crawford School of Public Policy
College of Asia and the Pacific The Australian National University
Canberra ACT 0200 Australia
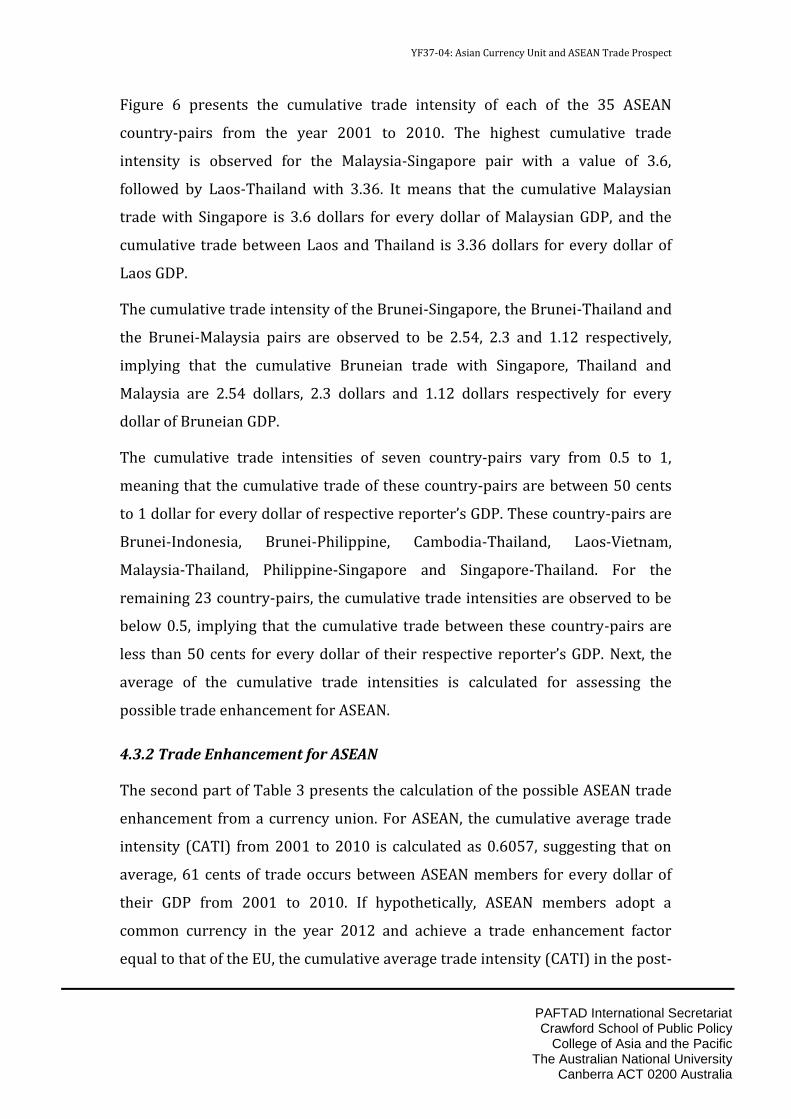
Figure 6 presents the cumulative trade intensity of each of the 35 ASEAN
country-pairs from the year 2001 to 2010. The highest cumulative trade
intensity is observed for the Malaysia-Singapore pair with a value of 3.6,
followed by Laos-Thailand with 3.36. It means that the cumulative Malaysian
trade with Singapore is 3.6 dollars for every dollar of Malaysian GDP, and the
cumulative trade between Laos and Thailand is 3.36 dollars for every dollar of
Laos GDP.
The cumulative trade intensity of the Brunei-Singapore, the Brunei-Thailand and
the Brunei-Malaysia pairs are observed to be 2.54, 2.3 and 1.12 respectively,
implying that the cumulative Bruneian trade with Singapore, Thailand and
Malaysia are 2.54 dollars, 2.3 dollars and 1.12 dollars respectively for every
dollar of Bruneian GDP.
The cumulative trade intensities of seven country-pairs vary from 0.5 to 1,
meaning that the cumulative trade of these country-pairs are between 50 cents
to 1 dollar for every dollar of respective reporter’s GDP. These country-pairs are
Brunei-Indonesia, Brunei-Philippine, Cambodia-Thailand, Laos-Vietnam,
Malaysia-Thailand, Philippine-Singapore and Singapore-Thailand. For the
remaining 23 country-pairs, the cumulative trade intensities are observed to be
below 0.5, implying that the cumulative trade between these country-pairs are
less than 50 cents for every dollar of their respective reporter’s GDP. Next, the
average of the cumulative trade intensities is calculated for assessing the
possible trade enhancement for ASEAN.
4.3.2 Trade Enhancement for ASEAN
The second part of Table 3 presents the calculation of the possible ASEAN trade
enhancement from a currency union. For ASEAN, the cumulative average trade
intensity (CATI) from 2001 to 2010 is calculated as 0.6057, suggesting that on
average, 61 cents of trade occurs between ASEAN members for every dollar of
their GDP from 2001 to 2010. If hypothetically, ASEAN members adopt a
common currency in the year 2012 and achieve a trade enhancement factor
equal to that of the EU, the cumulative average trade intensity (CATI) in the post-

YF37-04: Asian Currency Unit and ASEAN Trade Prospect
PAFTAD International Secretariat Crawford School of Public Policy
College of Asia and the Pacific The Australian National University
Canberra ACT 0200 Australia
currency union period appears to be 0.8131. This result suggests that on
average, 81 cents of trade would occur between ASEAN members for every
dollar of their GDP in the post-currency union period.
From the difference between the pre-event and the post-event cumulative
average trade intensities, trade enhancement is calculated as 0.2074, suggesting
that the ASEAN currency union would enhance their intra-regional trade by
about 21 cents for every dollar of their GDP.
The analysis summarizes two issues on ASEAN regional integration. First, the
intra-regional trade patterns of the European Union members are substantially
homogeneous in both the pre-Euro and post-Euro observation periods, while
notable heterogeneity exists in the case of ASEAN trade patterns. Second,
intensity value for ASEAN in terms of trade is much higher than for the European
Union, indicating that the currency union could have more impact on ASEAN
trade. Particularly, the intra-regional trade benefit of an ASEAN currency union
is suggested to be 21 per cent of ASEAN GDP, provided the change in their level
of integration is similar to that of the EU. Thus, an ASEAN currency union would
be economically feasible if the cost of achieving the desired level of ASEAN
integration is less than 21 per cent of ASEAN GDP. However, high level of
heterogeneity raises question about the cost effectiveness of the expected
macroeconomic correction process among ASEAN members.
5. The Testimony of Gravity
The event study approach of trade, which is developed in this study, is a non-
parametric method. In this section, the model efficiency of this approach is
justified by re-estimating trade enhancement factor of Euro using Gravity model
of trade. In literature, Gravity model is a commonly used parametric model for
trade analysis.
Gravity model of trade was first proposed by Tinbergen (1962) and Pöyhönen
(1963) in which the trade between two countries is proportional to their product
of masses (GDP) and inversely proportional to their distance. Eventually this was

YF37-04: Asian Currency Unit and ASEAN Trade Prospect
PAFTAD International Secretariat Crawford School of Public Policy
College of Asia and the Pacific The Australian National University
Canberra ACT 0200 Australia
a replication of the gravity model of physics. Though theoretically the distance
refers to the economic distance, geographic distance replaces economic distance
in practice (Kalirajan, 2008). Following Tinbergen and Pöyhönen, Anderson
(1979) and Bergstrand (1985, 1989) show the ‘theoretical foundation’ of the
model. They also derive bilateral trade as a ‘function of income and transport
costs’.
The standard gravity equation for trade takes the following econometric form:
ijijjiij EDGGT ... 321 … … … (3.1)
Here Tij is the bilateral trade flows (exports or imports) between country i and
country j, Gi is the economic mass of country i, Gj is the economic mass of country
j, Dij is the geographical distance between the capitals of country i and country j,
and Eij is the error term. The model is augmented with different parameters and
policy variables over time (for detail, see Anderson, 2011).
Rose (2000) applies the gravity model of international trade to observe the
cross-country variation in international with different currency arrangements. In
his study, he shows that the effect of a common currency is larger in magnitude
than the elimination of exchange rate volatility but having separate currencies.
The distinctive role of gravity approach in evaluating trade effects of regionalism
was also supported by Greenaway and Milner (2002). In a similar model, Glick
and Rose (2002) applied panel gravity approach to figure out the trade effect of a
country after joining or leaving a currency union, rather than calculating the
additional amount of trade made possible by common currency members.
Instead, Nardis and Vicarelli (2003) investigate the commercial transactional
impact of euro adoption among EMU members using a dynamic panel data
approach. However, this study stick to static panel approach due to shorter span
of observation period inherited within the model.
This study applies the panel gravity approach for estimating the trade
enhancement factor of Euro members following the implementation of Euro. The
model is as follows:

YF37-04: Asian Currency Unit and ASEAN Trade Prospect
PAFTAD International Secretariat Crawford School of Public Policy
College of Asia and the Pacific The Australian National University
Canberra ACT 0200 Australia
ttt clclbcudistgdpgdptrade 121261254123221112 lnlnlnln
.. ... … (14)
Here, trade12t is the trade variable between country 1 (reporting country) and
country 2 (partner country) at time t while gdp1t (gdp2t ) is a measure of income
of country 1(2) at time t. dist12 is the distance between countries 1 and 2, α is
constant, β ( i =1,...,6 ) are parameters of the equation, and ε12t is a white noise
disturbance term. All variables are in logs, meaning the estimated coefficients
are interpreted as elasticity. cut is a currency union dummy variable. The
variable takes on the value of 1 to show the implementation of currency union
and 0 otherwise. Clb12 is the common land border dummy which is 1 if two
countries share the border and 0 otherwise. Cl12 is the common language
dummy, which is 1 if people of two countries talk in same language and 0
otherwise. The coefficients of standard variables are expected to be as β1 > 0, β2
> 0 and β3 < 0.
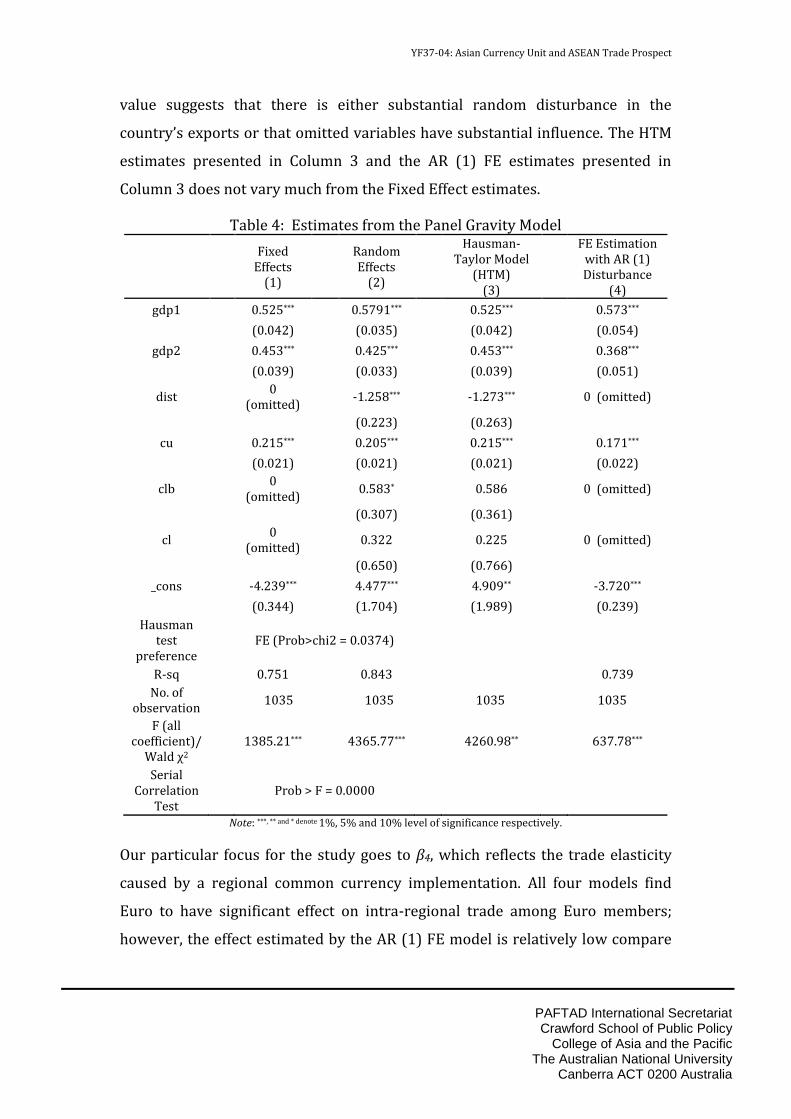
Table 4 presents the results of gravity estimation. Estimates for fixed effect
estimators and random effect estimators are presented in Column 1 and 2
respectively. The Hausman test supports the FE estimators, indicating to the
existence of correlation between the error terms and the regressors (for detail,
see Hausman, 1978). Similarly, the serial correlation test rejects the null
hypothesis that there is no serial correlation (Drukker, 2003). Results are
verified using Hausman-Taylor Model (HTM) and AR (1) FE model (for detail, see
Egger, 2002; Hausman and Taylor, 1981). Results for HTM are presented in
Column 3 and AR (1) FE model are presented in Column 4.
As the variables are measured in natural logarithms, the estimated coefficients
represent elasticity, i.e. the coefficients can be interpreted as the percentage
change in trade due to a one unit change in each variable. The estimation
estimates for the Fixed effect and Random effect variables are found to be
generally statistically significant and with the expected sign, though the common
language effect is insignificant. The model’s ability to explain ASEAN export is
moderate except for intra-ASEAN exports, which is remarkably low. A low R2
YF37-04: Asian Currency Unit and ASEAN Trade Prospect
PAFTAD International Secretariat Crawford School of Public Policy
College of Asia and the Pacific The Australian National University
Canberra ACT 0200 Australia
value suggests that there is either substantial random disturbance in the
country’s exports or that omitted variables have substantial influence. The HTM
estimates presented in Column 3 and the AR (1) FE estimates presented in
Column 3 does not vary much from the Fixed Effect estimates.
Table 4: Estimates from the Panel Gravity Model
Fixed Effects
(1)
Random Effects
(2)
Hausman-Taylor Model
(HTM) (3)
FE Estimation with AR (1) Disturbance
(4)
gdp1
0.525***
0.5791***
0.525***
0.573***
(0.042)
(0.035)
(0.042)
(0.054)
gdp2
0.453***
0.425***
0.453***
0.368***
(0.039)
(0.033)
(0.039)
(0.051)
dist
0 (omitted)
-1.258***
-1.273***
0 (omitted)
(0.223)
(0.263)
cu
0.215***
0.205***
0.215***
0.171***
(0.021)
(0.021)
(0.021)
(0.022)
clb
0 (omitted)
0.583*
0.586
0 (omitted)
(0.307)
(0.361)
cl
0 (omitted)
0.322
0.225
0 (omitted)
(0.650)
(0.766)
_cons
-4.239***
4.477***
4.909**
-3.720***
(0.344)
(1.704)
(1.989)
(0.239)
Hausman test
preference
FE (Prob>chi2 = 0.0374)
R-sq
0.751
0.843
0.739
No. of observation
1035
1035
1035
1035
F (all coefficient)/
Wald χ2
1385.21***
4365.77***
4260.98**
637.78***
Serial Correlation
Test
Prob > F = 0.0000
Note: ***, ** and * denote 1%, 5% and 10% level of significance respectively.
Our particular focus for the study goes to β4, which reflects the trade elasticity
caused by a regional common currency implementation. All four models find
Euro to have significant effect on intra-regional trade among Euro members;
however, the effect estimated by the AR (1) FE model is relatively low compare

YF37-04: Asian Currency Unit and ASEAN Trade Prospect
PAFTAD International Secretariat Crawford School of Public Policy
College of Asia and the Pacific The Australian National University
Canberra ACT 0200 Australia
to that of other 3 models. Following Rose (2000), impact of Euro on intra-
regional trade between the initial Euro members is e0.215 or 1.24 for FE and HT
model, e0.205 or 1.228 for RE model and e0.171 or 1.186 for AR (1) FE model. Thus
the gravity estimation captures about 18 to 23 per cent intra-regional trade
enhancement by the initial Euro members following implementation of Euro.
The result is lower compare to the calculated result of the event study method
(which was 34 per cent).
5.1 Trade Enhancement for ASEAN using Gravity Coefficient
Now, we forecast the potential intra-ASEAN trade enhancement by applying the
gravity panel estimated trade enhancement factor to Equation 13. Similar
calculation was performed in Section 4.3; however, the trade enhancement
factor was calculated using the benchmark analysis of Event Study model instead
of the Gravity model.
Table 4: Calculation of possible ASEAN trade enhancement from a Currency Union using the Gravity estimates
Estimated Model
“CU” coefficient
(A)
Estimated trade impact:
e(A)
(B)
ASEAN Cumulative
Average Trade Intensity (CATI)
(C)
Estimated ASEAN CATI for post-ACU
(Asian Currency
Unit) (D = B*C)
Possible Trade
Enhancement
(E = D - C)
FE/ HTM 0.215 1.240 0.606 0.751 0.145 RE 0.205 1.228 0.606 0.744 0.138
AR (1) FE 0.171 1.186 0.606 0.719 0.113
Table 4 presents the results for calculation of possible ASEAN trade
enhancement by implementing Asian Currency Unit (ACU). The Gravity
estimates are used for this calculation. Column (A) presents the estimated
coefficients of common currency implementation, results are presented for Fixed
effect model, Hausman-Taylor model, Random effect model and FE Estimation
with AR (1) Disturbances. Column (B) presents the estimated trade impacts,
which are calculated as exponential of the estimated coefficients presented in
Column (A).8 Estimated trade impact is 1.24 for both Fixed effect method and
8 For detail of the process, please see Rose (2000)

YF37-04: Asian Currency Unit and ASEAN Trade Prospect
PAFTAD International Secretariat Crawford School of Public Policy
College of Asia and the Pacific The Australian National University
Canberra ACT 0200 Australia
Hausman-Taylor method, thus implying that Euro has increased 24 percent of
intra-Euro land trade during 2000-2010, following the implementation of Euro.
The result of estimated trade impact is 1.228 for Random effect method,
indicating to about 23 percent increase of intra-Euro land trade during 2000-
2010; and is 1.22 for AR (1) Disturbances method, indicating to 22 percent
increase of intra-Euro land trade during the same period. Interestingly, the
calculated result of estimated trade impact using the benchmark analysis of
Event Study model indicates 34 per cent increase of intra-Euro land trade during
2000-2010. Clearly, Event Study Approach overestimates the benchmark impact
compare to the Gravity approach.
Column C to Column E presents the calculation of the possible ASEAN trade
enhancement from a currency union. In Column C, the cumulative average trade
intensity (CATI) of the ASEAN members from 2001 to 2010 which is calculated
in Section 4.3. The calculated CATI is 0.6057, suggesting that on average, 61
cents of trade occurs between ASEAN members for every dollar of their GDP
from 2001 to 2010. If hypothetically Asian Currency Unit is adopted in the year
2012, and ASEAN members achieve a trade enhancement factor equal to that of
the EU by accepting Asian Currency Unit, the cumulative average trade intensity
(CATI) in the post-currency union period appears to be 0.751 according to the
Fixed effect method and the Hausman-Taylor method. This result suggests that
on average, 75 cents of trade would occur between ASEAN members for every
dollar of their GDP in the post-currency union period. This result is presented in
Column D.
From the difference between the pre-event and the post-event cumulative
average trade intensities, trade enhancement is calculated as 0.145, suggesting
that the Asian Currency Unit would enhance ASEAN intra-regional trade by
about 14.5 cents for every dollar of their GDP. This result is presented in Column
E. With similar calculation, intra-ASEAN trade enhancement due to Asian
Currency Unit is calculated as 0.138 using the Random effect estimated
coefficient and as 0.113 using the AR (1) Disturbances method estimated

YF37-04: Asian Currency Unit and ASEAN Trade Prospect
PAFTAD International Secretariat Crawford School of Public Policy
College of Asia and the Pacific The Australian National University
Canberra ACT 0200 Australia
coefficient. Results for these calculations are presented in Column C, D and E
respectively.
Clearly a common currency would create additional intra-ASEAN trade; this
study establishes the argument by applying two different approaches. The first
approach entirely involves Event Study method to analyse the Euro benchmark
in calculating the trade enhancement effect of a currency union, then forecasting
the intra-ASEAN trade enhancement by applying the benchmark factor. This
approach discovers the intra-ASEAN trade benefit of Asian Currency Unit to be
21 per cent of ASEAN GDP, provided their level of regional integration is similar
to that of the EU. The second approach uses Gravity model of trade to analyse the
Euro benchmark, then uses Event Study method for applying the benchmark
factor and forecasting the intra-ASEAN trade enhancement. This approach
discovers the intra-ASEAN trade benefit of Asian Currency Unit to be 11 to 14
per cent of ASEAN GDP, depending on the estimation method of coefficients. If
the cost for achieving the required level of economic convergence among the
ASEAN members is more than 10 per cent of their combined GDP, net intra-
regional trade benefit of Asian Currency Unit for the ASEAN members will
remain low. Tough Lee and Koh (2012) suggests for ASEAN monetary union
(instead of East Asia wide currency union) considering increased symmetry of
regional shocks, quantification of the cost for required level of ASEAN
macroeconomic convergence is missing in literature.
6. Conclusion
This study develops a new trade forecasting model and applies it to investigate
the possible intra-ASEAN trade benefit of the Asian Currency Unit. To do this, the
event study approach has been applied in trade analysis, and the European
Union is assumed as a benchmark. Most of the previous studies employ the event
study approach to analyse the impact of different events related to corporate
finance issues. Instead, this study presumes the currency union as an event, and
measures the possible trade impact that would occur due to this event. The
model has been extended with two parts, one is the benchmark analysis tool for

YF37-04: Asian Currency Unit and ASEAN Trade Prospect
PAFTAD International Secretariat Crawford School of Public Policy
College of Asia and the Pacific The Australian National University
Canberra ACT 0200 Australia
analysing a selected benchmark, and the other is the forecasting tool to forecast
outcome of a future event by applying the estimated benchmark. The results for
the benchmark analysis are verified by using traditional gravity approach of
trade.
The study observes a substantial level of difference between the European Union
and ASEAN in the pattern of movement of their trade intensities, though the
intensities of ASEAN members are higher in magnitude than those of the EU. In
spite of notable heterogeneity in the movement of trade intensities among the
members, the Asian Currency Unit is expected to provide about 21 cents of intra-
ASEAN trade benefit for every dollar of their GDP. The gravity approach of
benchmark analysis, however, observes the estimated trade benefit between 11
to 14 per cent of ASAEN GDP. Thus the benchmark analysis tool of Event study
method shows tendency to overestimate. Instead, the forecasting tool of the
model can be used is future research for estimating possible outcome of a future
economic event, i.e. currency union, economic integration, trade agreement.
The study has important policy implication for ASEAN leaders. The estimated
amount of intra-ASEAN trade benefit is possible from a currency union provided
ASEAN members achieve a similar level of regional integration as in the EU for
getting desired benefit of Asian Currency Unit. However, the level of
macroeconomic heterogeneity is still substantial among ASEAN members (Yeh,
2013). The cost of the correction process of the existing asymmetry and
heterogeneity must not offset the estimated trade benefit. Or else, the proposed
ACU cannot offer much benefit to ASEAN members at least in terms of intra-
regional trade.
References:
Aminian, N., K.C. Fung, and F. Ng. 2009. A comparative analysis of trade and economic integration in East Asia and Latin America. Economic Change and Restructuring 42 (1): 105-37.
Anderson, J.E. 1979. A Theoretical Foundation for the Gravity Equation. American Economic Review 69 (1): 106-16.
Anderson, J.E. (2011). The Gravity Model Annual Review of Economics (Vol. 3, pp. 133-160). Massachusetts: Boston College, and NBER, Cambridge.
YF37-04: Asian Currency Unit and ASEAN Trade Prospect
PAFTAD International Secretariat Crawford School of Public Policy
College of Asia and the Pacific The Australian National University
Canberra ACT 0200 Australia
Ashley, J.W. 1962. Stock Prices and Changes in Earnings and Dividends: Some Empirical Results. Journal of Political Economy 70 (3): 82-85.
Bacha, O.I. 2008. A common currency area for ASEAN? Issues and feasibility. Applied Economics 40 (4): 515-29.
Ball, R., and P. Brown. 1968. An empirical evaluation of accounting income numbers. Journal of Accounting Research 6 (2): 159-78.
Bayoumi, T., and B. Eichengreen. 1997. Ever Close to Heaven? An Optimum-Currency-Area Index for European Countries. European Economic Review 41 (3-5): 761-70.
Berger, H., and V. Nitsch. 2008. Zooming Out: The Trade Effect of the Euro in Historical Perspective. Journal of International Money and Finance 27 (8): 1244-60.
Bergstrand, J. 1985. The Gravity Equation in International Trade: Some Microeconomic Foundations and Empirical Evidence. Review of Economics and Statistics 67 (3): 474-81.
Bergstrand, J. 1989. The Generalized Gravity Equation, Monopolistic Competition, and the Factor-Proportions Theory in International Trade. Review of Economics and Statistics 71 (1): 143-53.
Binder, J. 1998. The Event Study Methodology Since 1969. Review of Quantitative Finance and Accounting 11 (2): 111–37.
Bowman, R.G. 1983. Understanding and Conducting Event Studies. Journal of Business Finance and Accounting 10 (4): 561-84.
Campbell, J.Y., A.W. Lo, and A.C. MacKinlay. 1997. Event Study Analysis. In The Econometrics of Financial Markets: Princeton University Press, Princeton.
Dasgupta, S., B. Laplante, and N. Mamingi. 1998. Capital Market Responses to Environmental Performance in Developing Countries. World Bank Policy Research Working Paper 1909 (April).
Drukker, D. M. (2003). Testing for serial correlation in linear panel-data models. The Stata Journal 3, 168-177.
Egger, P. (2002). An Econometric View on the Estimation of Gravity Models and the Calculation of Trade Potentials. World Economy 25, 297-312.
Fama, E. F., L. Fisher, M. C. Jensen, and R. Roll. 1969. The Adjustment of Stock Prices to New Information. International Economic Review 10 (February): 1-27.
Glick, R., and A. Rose. 2002. Does a currency union affect trade? The time-series evidence. European Economic Review 46 (6): 1125 - 51.
Greenaway, D., and C. Milner. 2002. Regionalism and Gravity. Scottish Journal of Political Economy 49 (5): 574-85
Hashmi, S.M., and Y.T. Lee. 2008. Towards East Asian Economic Integration. European Journal of Economics, Finance and Administrative Sciences (12): 116-22.
Hausman, J.A. 1978. Specification tests in econometrics. Econometrica 46 (6): 1251-71.
Hausman, J.A., & Taylor, W.E. (1981). Panel data and unobservable individual effects. Econometrica 49, 1377–98.
Kalirajan, K. 2008. Gravity model specification and estimation: revisited. Applied Economic Letters 15:1037-39.
Lee, J.-W., K. Shin, and Y. Park. 2004. A Currency Union in East Asia. In Monetary and Financial Integration in East Asia: The Way Ahead, ed. A. D. Bank: Palgrave MacMillan
Lee, G.H.Y., and M. Azali. 2010. The endogeneity of the Optimum Currency Area criteria in East Asia. Economic Modelling 27 (1): 165-70.

YF37-04: Asian Currency Unit and ASEAN Trade Prospect
PAFTAD International Secretariat Crawford School of Public Policy
College of Asia and the Pacific The Australian National University
Canberra ACT 0200 Australia
Lee, G.H.Y., and S.G.M. Koh. 2012. The prospects of a monetary union in East Asia. Economic Modelling 29 (2): 96-102.
Madhur, S. 2002. Cost and Benefit of a Common Currency for ASEAN. ERD working paper 12. Asian Development Bank.
MacKinlay, A. C. 1997. Event Studies in Economics and Finance. Journal of Economic Literature 35 (1): 13-39.
Matthes, J. 2009. Ten Years EMU – Reality Test for the OCA Endogeneity Hypothesis, Economic Divergences and Future Challenges. Intereconomics 44 (2): 114-28.
Micco, A., E. Stein, and G. Ordon˜ez. 2003. The currency union effect on trade: early evidence from EMU. Economic Policy 18 (37): 315-56.
Mundell, R. A. 1961. A Theory of Optimum Currency Areas. The American Economic Review, 51 (4): pp. 657-65.
Mundell, R. 2003. Prospects for an Asian currency area. Journal of Asian Economics 14 (1): 1-10.
Nardis, S. D., and C. Vicarelli. 2003. The Impact of the Euro on Trade The (Early) Effect Is Not So Large. European Network of Economic Policy Research Institutes Working Paper 17.
Nguyen, T. 2010. An analysis of East Asian currency area: Bayesian dynamic factor model approach. International Review of Applied Economics 24 (1): 103 - 17.
Peterson, P. P. 1989. Event Studies: A Review of Issues and Methodology. Quarterly Journal of Business and Economics 28 (3): 36-66.
Pomfret, R. 2005. Currency Areas in Theory and Practice. The Economic Record 81 (253): 166–76.
Pöyhönen, P. 1963. A Tentative Model for the Volume of Trade between Countries. Weltwirtschaftliches Archiv/Review of World Economics 90 (1): 93-100.
Rose, A. K. 2000. One Money, One Market: The Effect of Common Currencies on Trade. Economic Policy, 15 (30): 9-45. Blackwell Publishing on behalf of the Centre for Economic Policy Research, Center for Economic Studies, and the Maison des Sciences de l'Homme.
Rose, A. K., and E. van Wincoop. 2001. National Money as a Barrier to International Trade: The Real Case for Currency Union. American Economic Review 91 (2): 386-90.
Sato, K., and Z. Zhang. 2006. Real Output Co-movements in East Asia: Any Evidence for a Monetary union? The World Economy 29 (12): 1671–89.
Shimizutani, S. 2009. Asian Common Currency as a Driving Force of Economic Integration in East Asia: A Prospect. Asia-Pacific Review 16 (2): 26-41.
Tinbergen, J. 1962. Shaping the World Economy-Suggestions for an International Economic Policy. New York: The Twentieth Century Fund.
Thom, R., and B. Walsh. 2002. The effect of a common currency on trade: Ireland before and after the sterling link. European Economic Review 46: 1111-23.
Thong, S. K. 2014. Asean Economic Transition. Presented at the 3rd International Conference On Management, Economics And Finance, 27 -28 October 2014, Primula Beach Hotel, Kuala Terengganu, Malaysia.
Yeh, K. C. 2013. An Asian Currency Unit: Simulations for Its Effects on East Asia. The World Economy 36 (12): 1611–31.