Embed Size (px)
Citation preview

Discussion
Paper
|D
iscussionP
aper|
Discussion
Paper
|D
iscussionP
aper|
Atmos. Chem. Phys. Discuss., 11, 13829–13865, 2011www.atmos-chem-phys-discuss.net/11/13829/2011/doi:10.5194/acpd-11-13829-2011© Author(s) 2011. CC Attribution 3.0 License.
AtmosphericChemistry
and PhysicsDiscussions
This discussion paper is/has been under review for the journal Atmospheric Chemistryand Physics (ACP). Please refer to the corresponding final paper in ACP if available.
The Brewer-Dobson circulation and totalozone from seasonal to decadal timescalesM. Weber1, S. Dikty1, J. P. Burrows1, H. Garny2, M. Dameris2, A. Kubin3,J. Abalichin3, and U. Langematz3
1Institut fur Umweltphysik, Universitat Bremen FB1, Bremen, Germany2Institut fur Atmosphare, Deutsches Zentrum fur Luft- und Raumfahrt e.V., Oberpfaffenhofen,Germany3Institut fur Meteorologie, Freie Universitat Berlin, Berlin, Germany
Received: 25 March 2011 – Accepted: 23 April 2011 – Published: 6 May 2011
Correspondence to: M. Weber ([email protected])
Published by Copernicus Publications on behalf of the European Geosciences Union.
13829
Discussion
Paper
|D
iscussionP
aper|
Discussion
Paper
|D
iscussionP
aper|
Abstract
The effect of the winter Brewer-Dobson circulation (BDC) on the seasonal and decadalevolution of total ozone in both hemispheres is investigated using satellite total ozonedata and outputs from two chemistry-climate models (CCM). Combining data from bothhemispheres a linear relationship between the winter cumulative extratropical 100 hPa5
eddy heat flux and the ozone ratio with respect to fall ozone levels exists and is sta-tistically significant for tropical as well as polar ozone. The high correlation at highlatitudes persists well into the summer months until the onset of the next winter sea-son. The anti-correlation of the cumulative eddy heat flux with tropical ozone ratios,however, breaks down in spring as the polar vortex erodes and changes to a weak10
positive correlation similar to that observed at high latitudes. The inter-annual variabil-ity and decadal evolution of ozone in each hemisphere in winter, spring, and summerare therefore driven by the cumulative effect of the previous winter’s meridional circu-lation. This compact linear relationship is also found in two different CCMs (EMAC-FUB, DLR-E39C-A) indicating that current models realistically describe the variability15
in stratospheric circulation and its climate effect on total ozone. Both models showa positive trend in the winter mean eddy heat flux (and winter BDC strength) in bothhemispheres until year 2050, however the inter-annual variability (peak-to-peak) is twoto three times larger than the mean change between 1960 and 2050. It is, therefore,possible to detect a shift in this compact linear relationship related to past and future20
changes in the stratospheric halogen load. A similar shift is difficult to derive from ob-servational data since the satellite era now spanning more than thirty years is still fairlyshort.
1 Introduction
For many years the main focus in studies of long-term ozone changes was the im-25
pact on chemical ozone loss from halogen containing anthropogenic ozone depleting
13830

Discussion
Paper
|D
iscussionP
aper|
Discussion
Paper
|D
iscussionP
aper|
substances (ODS) (WMO, 1999). Chemical mechanisms leading to chemical ozonelosses, in particular heterogeneous ozone loss in the polar region (polar ozone loss),are now generally well understood (Solomon, 1999; WMO, 2003, 2007, 2011). Morerecently studies of dynamical aspects, related to stratospheric circulation and meteo-rology, on ozone changes have become more important in particular with respect to the5
impact of climate change on ozone and vice versa. Ozone levels have started rising inaccordance with the slowdown and reversal of stratospheric halogen increases, a con-sequence of the global phase-out of many ODS from the successful implementation ofthe Montreal Protocol and its amendments (WMO, 2007, 2011). The question ariseshow the climate and, in particular, associated changes in the stratospheric circulation,10
will impact the speed of ozone recovery in coming decades.The Brewer-Dobson circulation (BDC) generally describes the meridional transport
of trace gases from the tropics to the poles (Brewer, 1949; Dobson, 1956). This circula-tion is now understood as a residual circulation since the general air flow remains zonaland planetary waves in the extratropics disturb this flow and cause a slow meridional15
drift (Haynes et al., 1991; Rosenlof and Holton, 1993; Newman et al., 2001; Plumb,2002). The transport time of air in the stratosphere from the equator to the lowermostpolar stratosphere is in the range of a few years (e.g., Waugh and Hall, 2002). Thepoleward transport of ozone is most effective in the winter hemisphere (e.g., Chipper-field and Jones, 1999). Several climate models and CCMs indicate that the strength20
of the winter BDC will increase with increasing greenhouse gas concentrations (GHG)and accelerate the expected ozone recovery (e.g., Rind et al., 1998, 2002; Butchartand Scaife, 2001; Schnadt et al., 2002; Sigmond et al., 2004; Eichelberger and Hart-mann, 2005; Butchart et al., 2006, 2010; Jiang et al., 2007; Li et al., 2007; Eyring et al.,2007; Fomichev et al., 2007; Garcia and Randel, 2008).25
The planetary wave activity driving the BDC is usually described by the convergenceof the Eliassen-Palm (EP) flux F , i.e. −∇ ·F . The convergence of the EP flux in thestratosphere is a measure for easterly momentum deposited to decelerate the westerlyzonal flow in winter (Newman et al., 2001). Geostrophic balance then requires a small
13831
Discussion
Paper
|D
iscussionP
aper|
Discussion
Paper
|D
iscussionP
aper|
meridional flow component that initiates the meridional or residual circulation (Andrewset al., 1987). The vertical component of the EP flux vector, F z, which is proportionalto the eddy heat flux, v ′T ′, is a measure of the vertical propagation of planetary wavesfrom the troposphere. Both EP flux convergence and the eddy heat flux are frequentlyused to describe variations in the BDC driving.5
Fusco and Salby (1999) and Salby and Callaghan (2004a) showed that inter-annualvariation of the eddy heat flux well correlates with year-to-year changes of extratrop-ical column ozone and at the same time anti-correlates with ozone changes in thetropics, documenting the year-to-year variation in hemispheric ozone transport. Partof the long-term trend in extratropical total ozone in the Northern Hemisphere can be10
explained by changes in the winter BDC (Fusco and Salby, 1999; Randel et al., 2002;Dhomse et al., 2006). The magnitude of this contribution to the overall ozone trendstrongly depends on the choice and details of dynamical proxy terms used in the trendregression (Steinbrecht et al., 1998; Hood and Soukharev, 2005; Reinsel et al., 2005;Dhomse et al., 2006; Wohltmann et al., 2007). Various proxies have been used in the15
trend models individually and in combination to describe dynamical ozone changes,like the potential vorticity or tropopause height, teleconnection patterns, e.g. Arctic Os-cillation (AO), equivalent latitude proxy, and eddy heat flux. They are, however, notindependent of each other as is discussed for the AO and eddy heat flux as an exam-ple in the following.20
Figure 1 shows the evolution of middle latitude December to February (DJF) totalozone in the Northern Hemisphere starting in the 1960s. Also shown are the DJF Arcticoscillation in the middle panel (which is closely related to the North-Atlantic oscillation(NAO) defined by the surface pressure difference between Azores/Lisbon and Iceland)and the stratospheric halogen load (inverse scale for clarity) as represented by the25
equivalent effective stratospheric chlorine (EESC) (e.g., Newman et al., 2007) in thebottom panel.
The winter AO index represents changes in stratospheric dynamics in recentdecades and they correlate with ozone changes (see smoothed lines in figure and
13832

Discussion
Paper
|D
iscussionP
aper|
Discussion
Paper
|D
iscussionP
aper|
Appenzeller et al., 2001). The long-term changes in the AO index indicate possiblelong-term changes in the BDC (Fusco and Salby, 1999; Randel et al., 2002). Winterswith extreme positive (negative) NAM values (northern annular mode, a new term forthe Arctic oscillation, see Thompson et al., 2003), correspond to years with small (high)winter eddy heat fluxes and strong (weak) polar night jets (Hartmann et al., 2000). An5
extreme negative AO index combined with an easterly QBO (quasi-biennial oscillation)phase lead to very high total ozone throughout the Northern Hemisphere (NH) in 2010(Steinbrecht et al., 2011). The study by Kiesewetter et al. (2010a) showed that for win-ters in a high (low) annular mode state, negative (positive) upper stratospheric ozoneanomalies in fall result in low (high) column ozone anomalies in polar spring. Low10
ozone in winter/spring is also expected from low winter planetary wave activity (weakBDC) and low polar temperatures during the winter season (Weber et al., 2003; Kawaet al., 2005; Sinnhuber et al., 2006).
Figure 1 seems to indicate that long-term ozone changes are correlated to bothchanges in stratospheric halogen and atmospheric dynamics. This close coupling be-15
tween atmospheric dynamics and chemistry is also evident on inter-annual time scalesas shown by the compact linear relationship between the cumulative hemispheric win-ter eddy heat flux and spring-to-fall polar total ozone ratio combining data from bothhemispheres as reported by Weber et al. (2003). They also showed a correspondinganti-correlation with OClO columns from GOME observations, an indication of chlorine20
activation inside the polar vortex, that prove year-to-year variability in polar ozone lossare driven by coupled variations in atmospheric dynamics and polar chemistry (Weberet al., 2003; Tegtmeier et al., 2008).
The goal of this paper is to elucidate further on the compact linear relationship be-tween winter eddy heat flux and the ozone build-up as reported in our earlier study25
(Weber et al., 2003) by using in addition to observations results from two CCMs. First,CCMs are compared to current observations and secondly the CCM data are used tolook how such a dynamics-chemistry coupling may change in the future in connectionwith climate change and ozone recovery. Section 2 briefly describes the total ozone
13833
Discussion
Paper
|D
iscussionP
aper|
Discussion
Paper
|D
iscussionP
aper|
data sets and the two CCMs (DLR-E39C-A and EMAC-FUB) used in this study. Sec-tion 3 summarises results on the similarity of changes in the winter eddy heat flux,stratospheric temperature, and observed spring ozone in both hemispheres since thestart of the satellite era at the end of the 1970s. The update on the compact linearrelationship between the winter BDC and spring-to-fall ozone ratio using more years5
of data from the GOME, SCIAMACHY, and GOME2 merged data set (GSG data) ispresented in Sect. 4. The ozone anomaly as observed in spring persists throughoutthe summer months until begin of next fall and its connection to the previous winter’sBDC is described and discussed in Sect. 5. Model results are presented in Sect. 6.The implications on future changes in the ozone – BDC interaction are also discussed10
in this section followed by conclusions from this study.
2 Data
2.1 Observations
The GOME/SCIAMACHY/GOME2 total ozone merged data set, also called in shortthe GSG data set, has been compiled from observations made by GOME (Coldewey-15
Egbers et al., 2005; Weber et al., 2005), SCIAMACHY (Bracher et al., 2005), andGOME2 (Weber et al., 2007) instruments and starts in 1995. In the GSG data setthe SCIAMACHY (2002–present) and GOME2 (2007–present) data have been ad-justed to the GOME data record (1995–present) by determining a mean scaling fac-tor (GOME2 and SCIAMACHY) and trend (SCIAMACHY only) in the monthly mean20
zonal mean ratios. Using the criterion of maximum global sampling, the GSG dataset is then composed of GOME until June 2003, SCIAMACHY (2003–2006), andGOME2 after 2006. More details can be found at and data are available fromhttp://www.iup.uni-bremen.de/gome/wfdoas/.
We also use the TOMS/SBUV merged total ozone data sets (http://acdb-ext.gsfc.25
nasa.gov/Data services/merged/), which combines TOMS, SBUV(/2), and OMI total
13834

Discussion
Paper
|D
iscussionP
aper|
Discussion
Paper
|D
iscussionP
aper|
ozone data by removing biases and drifts between data sets in overlapping periods(Stolarski and Frith, 2006). These data encompass the time period from 1978 topresent and the latest version is MOD V8. Since this data at the moment of writingonly extends to end of 2009, OMI data (2004–2010) are also shown based on theTOMS V8 retrieval, also called OMTO3 (OMI-ATBD (2002), http://disc.sci.gsfc.nasa.5
gov/Aura/data-holdings/OMI/omto3 v003.shtml).
2.2 Chemistry-climate models
The output from two CCMs is used to compare with observations and to discuss pastand future changes in the relationship between the BDC and ozone. A major differ-ence between the CCM EMAC-FUB and DLR-E39C-A is that the first is a high-top10
model with altitude levels up to the mesosphere (0.01 hPa) and the latter a low topmodel (10 hPa) with better vertical resolution in the UTLS (upper troposphere lowerstratosphere). Both models have taken part in the SPARC CCMval activities (Eyringet al., 2005, 2007; SPARC-CCMVal, 2010). The DLR-E39C-A model is based on thegeneral circulation model ECHAM4, coupled with the chemistry module CHEM and15
contains 39 layers extending to 10 hPa (Stenke et al., 2009). The EMAC-FUB CCMconsists of the ECHAM5-MESSy CCM (Jockel et al., 2006) and includes the interac-tive chemistry module MECCA (Sander et al., 2005) as well as an improved short-waveradiation parameterisation (Nissen et al., 2007). It was run with a horizontal resolutionof T42 (2.8×2.8) and 39 levels with the top at 0.01 hPa.20
In this study model runs from 1960 until 2050 with prescribed GHG concentrationsfrom the A1B scenario (IPCC, 2000) and surface mixing ratios of ozone depleting sub-stances (ODS) based on the halogen A1 scenario from WMO (2007) are used. Bothmodels include volcanic aerosols and assumed background stratospheric aerosols af-ter year 2006. Sea surface temperature and sea ice coverage are prescribed in the25
CCMs according to climate model projections. The solar activity cycles as well as theQBO are considered in both CCMs to include their impact on ozone-climate interac-tion. Details of the respectively chosen boundary conditions can be found in Eyringet al. (2008) and Morgenstern et al. (2010).
13835
Discussion
Paper
|D
iscussionP
aper|
Discussion
Paper
|D
iscussionP
aper|
3 Coupling of chemistry and dynamics of total ozone
A key parameter for coupling atmospheric dynamics and chemistry is the stratospherictemperature (Newman et al., 2001; Salby and Callaghan, 2002). At lower tempera-tures the gas-phase catalytic cycles destroying ozone in the upper stratosphere slowdown (Jonsson et al., 2004). This would mean that in a future changing climate with5
a stratosphere getting colder due to enhanced infrared GHG emission (e.g., Shindellet al., 1999), a super ozone recovery (a recovery to higher ozone levels than in the1960s) could be expected (WMO, 2007). In the lower stratosphere, where the largestfraction of the total ozone column resides, temperature changes are primarily driven byatmospheric dynamics. An enhancement in planetary wave activity results in instan-10
taneous adiabatic compression in the polar region, in extreme cases in major strato-spheric warmings, and corresponding adiabatic expansion in the tropics and cooling,driving temperatures in each case away from radiation equilibrium (Andrews et al.,1987; Kodera, 2006; Salby, 2008). The relaxation back to equilibrium temperaturesthen drives the residual or diabatic circulation with slow ascent in the tropics and de-15
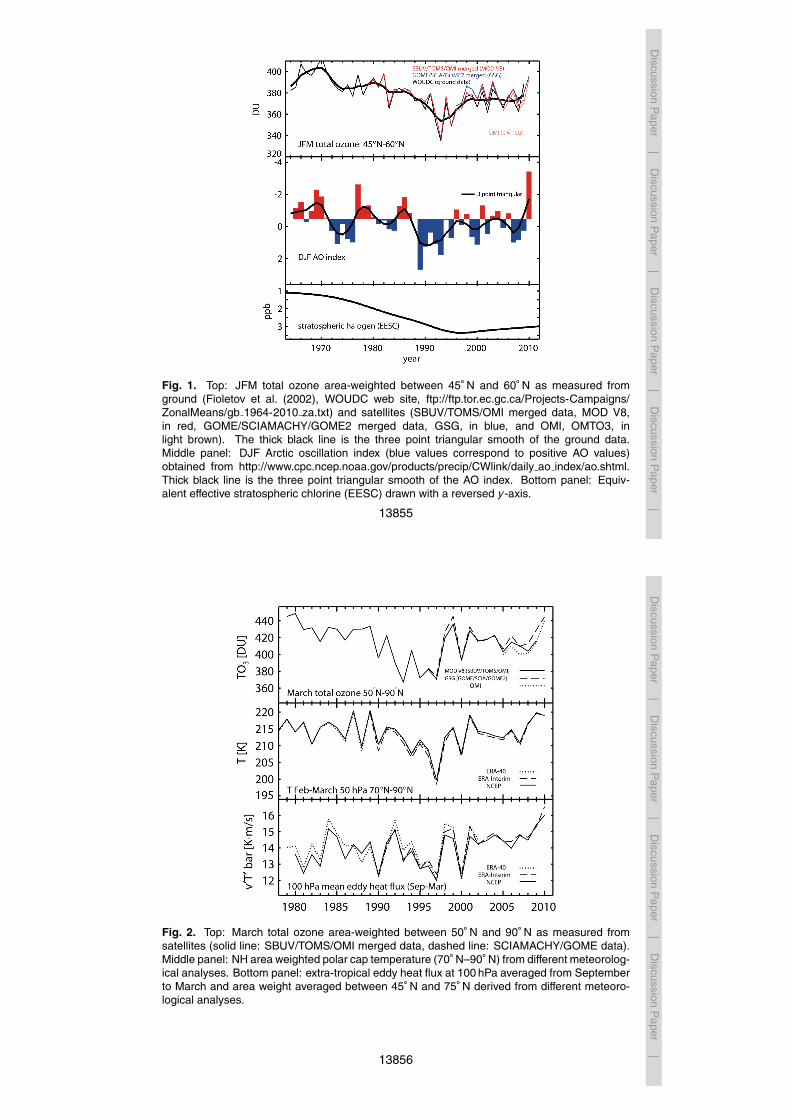
scent in the polar region (Fels, 1982; Andrews et al., 1987).The coupling of winter polar stratospheric temperature variations from year to year
with corresponding changes in the winter mean eddy heat flux and NH polar ozonein spring is shown in Fig. 2. Atmospheric dynamics drives the inter-annual variabilityof polar stratospheric temperatures and ozone transport into the polar region (repre-20
sented by the winter eddy heat flux) during winter. Another important aspect is thattemperature controls polar ozone loss due to heterogeneous chemistry requiring polarstratospheric clouds to be formed (usually below 195 K). The inter-annual variation ofchlorine activation with variations in the winter eddy heat flux was shown from OClOdata from GOME (Weber et al., 2003) that are indicative for chlorine activation and sub-25
sequent catalytic ozone losses inside the polar vortex (Solomon, 1999; Wagner et al.,2001; Richter et al., 2005). Figure 3 shows the corresponding figure for the SH. Thecorrelation between temperature, winter planetary wave activity, and spring ozone in
13836

Discussion
Paper
|D
iscussionP
aper|
Discussion
Paper
|D
iscussionP
aper|
each hemisphere is particularly good for the late period after the middle 1990s andsomewhat lower before.
The nearly linear decrease in SH polar spring ozone in the 1980s is not accom-panied with corresponding changes in planetary wave activity and can be thereforemore directly associated with upward trends in the halogen loading (see bottom of5
Fig. 1). The impact of the stratospheric aerosols from the Mt. Pinatubo major eruptionin 1991 apparently also reduces this correlation. Following the Pinatubo event an in-crease in the winter mean eddy heat flux is evident in each hemisphere, but withoutcorresponding increases in polar ozone. Sulfate aerosols contribute to ozone deple-tion via heterogeneous reactions that needs not to be limited to the polar vortex (Hof-10
mann et al., 1994). However studies have shown that polar stratospheric temperatureswhere reduced in subsequent NH winters as well as tropical lowermost stratospherictemperature increased (Dhomse et al., 2006, Fig. 15) a typical signature of a reducedBrewer-Dobson circulation. Several other studies indicate that the stratospheric circu-lation was reduced and winter AO enhanced following the Pinatubo eruption (see for15
instance Stenchikov et al. (2004) and Fig. 1 in this paper)
4 Linear correlation between BDC and ozone build-up
The compact linear relationship between spring-to-fall polar ozone ratio and the wintermean eddy heat flux calculated for each hemisphere, respectively, is shown in Fig. 4.This figure combines data from the Southern and Northern Hemisphere and is an20
update from Weber et al. (2003) and WMO (2007, Chap. 4) and includes more recentozone data from SCIAMACHY and GOME2 and covers the period 1995 to 2009. Thetriangles show the SH data and circles the NH data. The SH winter eddy heat flux isnegative but plotted here in absolute (positive) values. By combining data from bothhemispheres the broad range of variation in the winter BDC strength from minimum25
values in the SH up to maximum values typical for NH winters and associated changesin the winter ozone build-up is visualised.
13837
Discussion
Paper
|D
iscussionP
aper|
Discussion
Paper
|D
iscussionP
aper|
The spring ozone distribution is shown for selected winter seasons at the top of thisfigure demonstrating the gradual changes from ozone hole conditions typically in theSH to ozone rich distributions seen only in the NH. The BDC is known to be weakerin the SH, where polar ozone loss outweighs the net transport into high latitudes, thusproviding ozone ratios below one. One exception is the perturbed Antarctic ozone hole5
anomaly with the first major stratospheric warming observed in the SH (e.g., Weberet al., 2003; Sinnhuber et al., 2003; Richter et al., 2005; von Savigny et al., 2005)where the spring-to-fall polar ozone ratio is well above one. Polar ozone losses in theNH are more sporadic and ozone transport is generally more effective.
Normally the winter build up of ozone is strongest after late fall (November) as dis-10
cussed in Fioletov and Shepherd (2003) and Salby and Callaghan (2004b), but herewe use September in the NH and March in the SH, respectively, as starting point for thewinter build-up. They are the months in the seasonal cycle where total ozone reachesits minimum (Weber et al., 2003; Fioletov and Shepherd, 2003).
Severe ozone losses in March were observed during the cold Arctic winters in the15
1990s (1995/96, 1996/97, and 1999/2000) (Chap. 4 in WMO, 2007). Both the coldArctic winters in the 1990s and the Antarctic ozone hole anomaly of 2002 representin terms of the linear relationship shown in Fig. 4 an intermediate case between typ-ical Antarctic and Arctic winters. The Antarctic winter 2006 was characterized by thelargest ozone hole area (area covered by total ozone below 220 DU) observed in the20
GOME/SCIAMACHY era and was a result of an extremely weak winter BDC fosteringvery low polar stratospheric temperatures and, therefore, is located at the left lower endof the linear relationship shown in Fig. 4. Nevertheless, all special events, the Antarcticozone hole in 2006, the ozone hole anomaly in 2002, and the cold Arctic winters arewell covered by the linear relationship observed in Fig. 4.25
13838

Discussion
Paper
|D
iscussionP
aper|
Discussion
Paper
|D
iscussionP
aper|
5 Seasonal persistence of total ozone variability
In several studies it was shown that the inter-annual variations seen in polar total ozoneanti-correlate with tropical ozone changes as a result of the overturning BDC (Fuscoand Salby, 1999; Salby and Callaghan, 2004b). This is also evident from the changeof the positive correlation of the winter accumulated eddy heat flux with polar ozone5
ratios into an anticorrelation in the tropics as is shown in Fig. 5. Here, the ozoneratios of February over September (NH) and August over March (SH) are displayed forseveral zonal bands ranging from the tropics to the polar region.This corresponds toa five month winter build up of ozone starting from September (NH) and March (SH),respectively. The correlation coefficients are very high and close to 0.9 and −0.9 in the10
polar and tropical region, respectively. The turnaround latitude where the correlationchanges sign is within the latitude band between 40◦ and 50◦, which can be interpretedas the zonal band where upwelling at low latitudes changes to downwelling in theextratropics as branches of the residual circulation.
Ozone anomalies at the end of winter persist throughout the summer months in the15
extratropics until fall, when photochemical equilibrium is reached and the residual cir-culation starts building up ozone for the next winter (Fioletov and Shepherd, 2003). Thesummertime changes in ozone are mainly governed by NOx chemistry in the absenceof dynamic activity (Bruhl et al., 1998; Bruhl and Crutzen, 2000). As a consequencesummertime trends are closely tied to winter trends (Fioletov and Shepherd, 2003,20
2005).In Fig. 6 the correlation coefficients of the linear relationship between ozone ratios
and the average eddy heat flux for various zonal bands are plotted as a function of timefrom fall to fall next year. North of 45◦ latitude the correlation is positive and negativeat lower latitudes throughout the winter and early spring similar to that shown in Fig. 525
for a specific winter month. The positive correlation remains high for polar latitudesuntil next fall. In late spring and early summer the region of positive correlation extendsfrom the polar region to the subtropics. A possible explanation is the break-up of the
13839
Discussion
Paper
|D
iscussionP
aper|
Discussion
Paper
|D
iscussionP
aper|
polar vortex and the removal of the polar transport barrier that mixes or dilutes polar airinto middle latitudes and to the subtropics (e.g., Knudsen and Grooß, 2000; Ajtic et al.,2004; Fioletov and Shepherd, 2005). The anticorrelation observed at tropical latitudesgoes to zero by early summer. The most likely explanation is the absence of dynamicactivity in the summer hemisphere. Since variations in the tropics are lower than at5
high latitudes, the photochemical equilibrium is probably reached much faster than inthe extratropics.
6 Model results
The analysis of the BDC impact on total ozone variability on time scales from seasonalto inter-annual described so far provides a valuable diagnostics for CCMs. The ques-10
tion arises how well do models compare with observations and what can models tellus about past and future changes. In Figs. 7 and 8 the seasonal correlation maps areshown for both CCMs, DLR-E39C-A and EMAC-FUB, respectively. The model dataare shown for years 1985 to 2010 to be comparable to observations shown in Fig. 6.The correlation maps with positive values in polar latitudes and negative in the trop-15
ics are qualitatively very similar to observations. The transition to summer conditionsas characterized by the expansion of the positive correlation into middle latitudes alsoagrees with observations. The overall patterns in the winter/summer correlation appearrealistic and are consistent with observations.
Differences between models and observations are found in the transition zone from20
positive to negative correlations during winter. Observations indicate 45◦ latitude(Fig. 6), while it lies equatorward of 40◦ in both models. Figures 7 and 8 also showthe changes with time in the transition zone. The dotted and dashed lines show thecorrelation of the 30◦–40◦ zonal bands for the periods 1960–1985 (past) and 2010–2050 (future), respectively. In the DLR model it appears that the transition zone is25
nearly unaltered, only in the past it was slightly shifted to lower latitudes as evidentfrom the higher and positive correlation. The FUB model shows a different behavior. In
13840

Discussion
Paper
|D
iscussionP
aper|
Discussion
Paper
|D
iscussionP
aper|
both past and future decades the transition is closer to about 35◦ latitude and slightlyshifted to higher latitudes in the period 1985–2010. The rough position of the modeledtransition near 35◦ latitude is close to the latitude separating tropical upwelling at lowerlatitudes from downwelling at higher latitudes shown in other model data (Austin andLi, 2006).5
During the summer months the correlation of polar ozone (and the anti-correlation oftropical ozone) with the average eddy heat flux from last winter starts to weaken abouta month earlier in the DLR model compared to the FUB model and observations.
Figures 9 and 10 show the relationship of the spring-to-fall polar total ozone ratio(September over March in the SH and March over September ratio in the NH) for the10
DLR and FUB models, respectively. Also shown are the GSG data set from Fig. 4.All model data from 1960–2050 are shown. Different colors are representing differenttime periods, grey for the past (1960–1985), black the present (1985–2010), and bluethe future period (2010–2049). The corresponding regression line (dashed) for thethree different periods is also shown. Since the ozone values in the DLR model show15
a consistent bias of about 50 DU with respect to observations, an offset of −50 DU wasapplied to all DLR model data.
In general, the correlation in the relationship between polar ozone ratio and wintereddy heat flux is remarkably high and reproduces very well the observations. However,there are some differences with respect to observations. The spring-to-fall polar ozone20
ratios in the SH are in most cases above one, while observations are always below oneexcept for the anomalous Antarctic ozone hole in 2002 indicating that ozone transportoutweighs SH polar ozone loss in the models as opposed to observations. In bothhemispheres the ozone ratios are in most cases higher than observations. A possibleexplanation for this could be that either modeled polar ozone losses are too low or that25
the polar vortex is more permeable due to numerical diffusion, meaning more mixingwith middle latitude air occurs in the model (Austin et al., 2010).
One interesting aspect from the model studies is the evolution of this compact linearrelationship on decadal time scales from the past into the future. The ozone ratios
13841
Discussion
Paper
|D
iscussionP
aper|
Discussion
Paper
|D
iscussionP
aper|
are smallest during the present period (1985–2010) compared to the past and futurein both models. The long-term changes in the linear fits in Figs. 9 and 10 coincideswith changes in the halogen loading (see Fig. 1 and Newman et al., 2007). Duringthe period 1985–2010 the halogen loading reached a maximum and ozone losses inspring were maximum leading to lower spring-to-fall ozone ratios under identical mete-5
orological/dynamical conditions of the polar winter stratosphere. Due to the phase-outof ozone depleting substances (WMO, 2007, 2011), the stratospheric halogen startsa slow decrease so that an increase in future ozone ratio and thus an upward shift inthe linear fit curves as shown in Figs. 9 and 10 is expected.
The upward shift of the regression line is smaller for the EMAC-FUB model than10
for DLR-E39C-A. This indicates that the ozone recovery is slower in the FUB model.However, both models are among the CCMs with faster ozone recovery (Austin et al.,2010; SPARC-CCMVal, 2010).
First signs of ozone recovery related to the turnaround in the halogen loading wereobserved in the upper stratosphere (Newchurch et al., 2003; Steinbrecht et al., 2009).15
However in the lower stratosphere, where the dominant contribution to the total ozonecolumn comes from, the fingerprint of recovery is less clear due to the large influencefrom atmospheric dynamics (see Fig. 1). The largest contribution to the strong increasein NH total ozone in the extratropics since the middle 1990s is due to changes in thestratospheric circulation (Dhomse et al., 2006; Wohltmann et al., 2007; Harris et al.,20
2008). Nevertheless, the upward shift in the linear regression in Figs. 9 and 10 confirmsthat ozone will steadily increase with sinking stratospheric halogen loading despite thelarge variability seen from year-to-year.
The variability in the modelled winter eddy heat fluxes (Figs. 9 and 10) is quite largein each hemisphere (spread across the x-direction of the plots) and is mostly in the25
range what is seen in the observations. The variability in the NH is somewhat smallerfor the FUB model, when compared to the DLR model and observations. Both FUBand DLR model have individual NH winters with extremely low winter eddy heat fluxesand spring-to-fall ozone ratios that are similar to Antarctic values. Such cases have not
13842

Discussion
Paper
|D
iscussionP
aper|
Discussion
Paper
|D
iscussionP
aper|
been seen in observations during the satellite era (since 1978). On the other hand,none of the models was able to produce SH conditions similar to the Antarctic ozonehole anomaly observed in 2002.
No significant changes with time in the ranges of the winter eddy heat flux are evidentin the models so that the largest changes with time in the compact linear relationship5
appear be due to changes in halogens and associated ozone chemistry. In Fig. 11 thetime evolution of the CCM winter eddy heat flux in each hemisphere (averaged fromSeptember to March in the NH and March to September in the SH) is displayed. Alsoshown are the decadal means of the same quantities (blue for SH and red for NH) andthe linear fit to the decadal means. A slow increase in the strength of the winter BDC10
and winter eddy heat flux from 1960 until 2050 is evident, which is ∼+0.5 K m s−1 overthe ninety year time span. The year-to-year variations are on the order of 1–2 K m s−1
which strongly masks the long-term trend. For a few decades the trends may evenbecome reversed, e.g. 1990–2010 in the NH (DLR model) and 2000–2020 in the SH(FUB model), such that polar ozone losses can be intensified for one to two decades15
despite the slow decline in the stratospheric halogen loading.In Fig. 11 the decadal means from NCEP reanalysis during the satellite period
(1980–2010) are also shown. Over the three decades of the satellite era the increasein the observed winter eddy heat flux is a factor of two to three larger than the long-term change seen in the CCMs. From the variability evident in the model data it is20
most likely that the current observed trend may not be maintained over a longer timeperiod into the future. Also, it is clear that the 30-yr satellite data record is still compar-atively short for a complete disentangling of long-term changes in ozone columns dueto atmospheric dynamics and halogen changes.
7 Summary and conclusion25
In this paper we investigated the impact of the BDC on total ozone from seasonalto decadal time scales using satellite observations and two CCMs. From the long-term data record it is clear that long-term changes in total ozone in the extratropics,
13843
Discussion
Paper
|D
iscussionP
aper|
Discussion
Paper
|D
iscussionP
aper|
representative for lower stratospheric ozone, have contributions from changes in theupper atmospheric circulation (atmospheric dynamics) and in ozone chemistry (polarozone losses and gas-phase losses) due to the halogen load. The chemical trendsare tied to changes in meteorology and atmospheric dynamics as shown in Fig. 1.This is also evident on shorter time scales when looking at inter-annual variations in5
stratospheric temperatures (as a proxy for chemistry), extratropcial ozone, and BDCstrength, here expressed by the winter eddy heat flux in each hemisphere (Figs. 2 and3).
Combining data from both hemispheres a compact linear relationship exists betweenthe winter eddy heat flux and the spring-to-fall ozone ratio as shown in Fig. 4. This10
figure is an update of Fig. 3 in Weber et al. (2003) with more years of data addedand now showing even a higher correlation coefficient (r =0.992). This compact linearrelationship marks as one extreme the Antarctic winters with a weak BDC, colder polarlower stratospheric temperatures, the ozone hole, and the other extreme the Arcticwinters with higher stratospheric temperatures, larger ozone transport, and reduced15
polar ozone losses. The anomalous SH ozone hole (Sinnhuber et al., 2003; Richteret al., 2005; von Savigny et al., 2005) with unusually enhanced ozone transport intopolar latitudes and the cold Arctic winters in the 1990s with reduced ozone transportand larger polar ozone losses fit into this remarkable relationship. The tropical ozoneratios in contrast are anti-correlated to the winter-eddy heat flux as shown in Fig. 5.20
The correlation between the eddy heat flux averaged from fall to the respective monthand the corresponding ozone ratios remain high throughout spring until the end of thesummer (Fig. 6). The positive correlation as seen in the extratropics during late springand summer also extends into the tropical region after the polar vortex breaks up. Thisis consistent with results from Fioletov and Shepherd (2003, 2005) who investigated25
the seasonal autocorrelation of total ozone and its impact on long-term trends. Thetransition zone between negative correlation (tropics) and positive correlation (extrat-ropics) during winter is at about 45◦ latitude. This is consistent with the fact that thesign of stratospheric temperature departure from radiative equilibrium reverses at the
13844

Discussion
Paper
|D
iscussionP
aper|
Discussion
Paper
|D
iscussionP
aper|
same latitude, meaning it is negative equatorward (tropical cooling and upwelling) andpositive poleward of this latitude as noted by Ueyama and Wallace (2010).
The seasonal correlation pattern as shown for observational data is also very wellreproduced by two chemistry-climate models, the DLR-E39C-A and the EMAC-FUB(Figs. 7 and 8), that were run from year 1960 to 2050. One notable difference with5
respect to observations is that the transition zone between positive correlations in theextratropics and negative correlations in the tropics is somewhat shifted towards lowerlatitudes near 35◦ latitudes. A compact linear relationship between polar spring-to-fallozone ratio and the modelled winter eddy heat flux is seen in both models, clearlyindicating that the overall BDC pattern on total ozone is well reproduced by the models10
(Figs. 9 and 10). However, the spring-to-fall ozone ratios are generally higher thanthe observed ones. The linear regression of this relationship shifts due to the reversalof the stratospheric halogen trends meaning that under near identical meteorologicalconditions and dynamic state of the atmosphere the recovery of total ozone in the futureis evident. A similar shift in the linear regression is difficult to derive from observations15
since the satellite data record now spanning more than 30 yr appears to be still tooshort.
Both models show a positive trend in the winter eddy heat flux indicating that ina changing climate the BDC may intensify in coming decades, a feature which is ob-served by many other CCMs (see Sect. 1). Nevertheless the year-to-year variability20
in the winter BDC strength is a factor of three to four higher than the decadal meanchange from 1960 to 2050. For one or two decades as e.g. 1990–2010 in the NH (DLRmodel) and 2000–2020 in the SH (FUB model) a negative trend in the winter eddy heatflux may occur that could lead to more severe polar ozone loss despite the slow declinein the stratospheric halogen load.25
When attributing processes to the current total ozone trends, it is difficult to clearlyseparate chemical and dynamical contributions (Kiesewetter et al., 2010b), which isunderstandable from the fact that both processes are closely coupled as shown in thisstudy.
13845
Discussion
Paper
|D
iscussionP
aper|
Discussion
Paper
|D
iscussionP
aper|
Acknowledgements. This work was supported by the DFG Research Unit FOR 1095“Stratospheric Change and its Role for Climate Prediction” (SHARP) and the SHARP-OCFProject, Geschaftszeichen BU 688/22-1, and SHARP-BDC, Geschaftszeichen DA 233/3-1 andLA 1025/13-1. Part of this work was also funded by the State of Bremen. ECMWF reanaly-sis data has been provided by the ECMWF Special Project DECDIO. FUB would like to thank5
Patrick Jockel (DLR) for helpful advice and support with the EMAC-FUB CCM.
References
Ajtic, J., Connor, B. J., Lawrence, B. N., Bodeker, G. E., Hoppel, K. W., Rosenfield, J. E., andHeuff, D. N.: Dilution of the Antarctic ozone hole into southern midlatitudes, 1998–2000, J.Geophys. Res., 109, D17107, doi:10.1029/2003JD004500, 2004. 1384010
Andrews, D. G., Holton, J. R., and Leovy, C. B.: Middle Atmosphere Dynamics, AcademicPress, San Diego, 1987. 13832, 13836
Appenzeller, C., Weiss, A. K., and Staehelin, J.: North Atlantic Oscillation modulates total ozonewinter trends, Geophys. Res. Lett., 27, 1131–1134, 2001. 13833
Austin, J. and Li, F.: On the relationship between the strength of the Brewer-Dobson15
circulation and the age of stratospheric air, Geophys. Res. Lett., 330, L178070,doi:10.1029/2006GL026867, 2006. 13841
Austin, J., Struthers, H., Scinocca, J., Plummer, D. A., Akiyoshi, H., Baumgaertner, A. J. G.,Bekki, S., Bodeker, G. E., Braesicke, P., Bruhl, C., Butchart, N., Chipperfield, M. P.,Cugnet, D., Dameris, M., Dhomse, S., Frith, S., Garny, H., Gettelman, A., Hardiman, S. C.,20
Jockel, P., Kinnison, D., Kubin, A., Lamarque, J. F., Langematz, U., Mancini, E., Marc-hand, M., Michou, M., Morgenstern, O., Nakamura, T., Nielsen, J. E., Pitari, G., Pyle, J.,Rozanov, E., Shepherd, T. G., Shibata, K., Smale, D., Teyssedre, H., and Yamashita, Y.:Chemistry-climate model simulations of spring Antarctic ozone, J. Geophys. Res., 115,D00M11, doi:10.1029/2009JD013577, 2010. 13841, 1384225
Bracher, A., Lamsal, L. N., Weber, M., Bramstedt, K., Coldewey-Egbers, M., and Burrows, J. P.:Global satellite validation of SCIAMACHY O3 columns with GOME WFDOAS, Atmos. Chem.Phys., 5, 2357–2368, doi:10.5194/acp-5-2357-2005, 2005. 13834
Brewer, A. W.: Evidence for a world circulation provided by measurements of helium and watervapor distribution in the stratosphere, Q. J. Roy. Meteor. Soc., 75, 351–363, 1949. 1383130
13846

Discussion
Paper
|D
iscussionP
aper|
Discussion
Paper
|D
iscussionP
aper|
Bruhl, C. and Crutzen, P. J.: NOx-catalyzed ozone destruction and NOx activation at midlati-tudes to high latitudes as the main cause of the spring to fall ozone decline in the NorthernHemoisphere, J. Geophys. Res., 105, 12163–12168, 2000. 13839
Bruhl, C., Crutzen, P. J., and Grooss, J.: High-latitude, summertime NOx activation and sea-sonal ozone decline in the lower stratosphere: model calculations based upon HALOE on5
UARS, J. Geophys. Res., 103, 3587–3597, 1998. 13839Butchart, N. and Scaife, A. A.: Removal of chlorofluorocarbons by increased mass exchange
between the stratosphere and troposphere in a changing climate, Nature, 410, 799–802,2001. 13831
Butchart, N., Scaife, A. A., Bourqui, M., de Grandpre, J., Hare, S. H. E., Kettleborough, J.,10
Langematz, U., Manzini, E., Sassi, F., Shibata, K., Shindell, D., and Sigmond, M.: Simulationsof anthropogenic change in the strength of the Brewer-Dobson circulation, Clim. Dynam., 27,727–741, 2006. 13831
Butchart, N., Cionni, I., Eyring, V., Shepherd, T. G., Waugh, D. W., Akiyoshi, H., Austin, J.,Bruhl, C., Chipperfield, M. P., Cordero, E., Dameris, M., Deckert, R., Dhomse, S., Frith, S. M.,15
Garcia, R. R., Gettelman, A., Giorgetta, M. A., Kinnison, D. E., Li, F., Mancini, E., McLan-dress, C., Pawson, S., Pitari, G., Plummer, D. A., Rozanov, E., Sassi, F., Scinocca,J. F., Shibata, K., Steil, B., and Tian, W.: Chemistry-climate model simulations of21st century stratospheric climate and circulation changes, J. Climate, 23, 5349–5374,doi:10.1175/2010JCLI3404.1, 2010. 1383120
Chipperfield, M. P. and Jones, R. L.: Relative influences of atmospheric chemistry and transporton Arctic ozone trends, Nature, 400, 551–554, 1999. 13831
Coldewey-Egbers, M., Weber, M., Lamsal, L. N., de Beek, R., Buchwitz, M., and Burrows, J. P.:Total ozone retrieval from GOME UV spectral data using the weighting function DOAS ap-proach, Atmos. Chem. Phys., 5, 1015–1025, doi:10.5194/acp-5-1015-2005, 2005. 1383425
Dhomse, S., Weber, M., Wohltmann, I., Rex, M., and Burrows, J. P.: On the possible causesof recent increases in northern hemispheric total ozone from a statistical analysis of satellitedata from 1979 to 2003, Atmos. Chem. Phys., 6, 1165–1180, doi:10.5194/acp-6-1165-2006,2006. 13832, 13837, 13842
Dobson, G. M.: Origin and distribution of the polyatomic molecules in the atmosphere, Proc. R.30
Soc. Lon. Ser.-A, 236, 187–193, 1956. 13831Eichelberger, S. J. and Hartmann, D.: Changes in the strength of the Brewer-Dobson circulation
in a simple AGCM, Geophys. Res. Lett., 32, L15807, doi:10.1029/2005GL022924, 2005.
13847
Discussion
Paper
|D
iscussionP
aper|
Discussion
Paper
|D
iscussionP
aper|
13831Eyring, V., Harris, N., Rex, M., Sheperd, T. G., Fahey, D. W., Amanatidis, G. T., Austin, J., Chip-
perfield, M. P., Dameris, M., De, P. M., Forster, F., Gettelman, A., Graf, H. F., Nagashima, T.,Newman, P. A., Pawson, S., Prather, M. J., Pyle, J. A., Salawitch, R. J., Santer, B. D., andWaugh, D. W.: A strategy for process-oriented validation of coupled chemistry-climate mod-5
els, B. Am. Meteorol. Soc., 86, 1117, doi:10.1175/BAMS-86-8-1117, 2005. 13835Eyring, V., Waugh, D. W., Bodeker, G. E., Cordero, E., Akiyoshi, H., Austin, J., Beagley, S. R.,
Boville, B. A., Braesicke, P., Bruhl, C., Butchart, N., Chipperfield, M. P., Dameris, M.,Deckert, R., Deushi, M., Frith, S. M., Garcia, R. R., Gettelman, A., Giorgetta, M. A., Kin-nison, D. E., Mancini, E., Manzini, E., Marsh, D. R., Matthes, S., Nagashima, T., New-10
man, P. A., Nielsen, J. E., Pawson, S., Pitari, G., Plummer, D. A., Rozanov, E., Schraner, M.,Scinocca, J. F., Semeniuk, K., Shepherd, T. G., Shibata, K., Steil, B., Stolarski, R. S.,Tian, W., and Yoshiki, M.: Multi-model projections of stratospheric ozone in the 21st cen-tury, J. Geophys. Res., 112, D16303, doi:10.1029/2006JD008332, 2007. 13831, 13835
Eyring, V., Gettelman, A., Harris, N. R. P., Pawson, S., Shepherd, T. G., Waugh, D. W., Akiyoshi,15
H., Butchart, N., Chipperfield, M. P., Dameris, M., Fahey, D. W., Forster, P. M. F., Newman, P.A., Rex, M., Salawitch, R. J., and Santer, B. D.: Overview of the new CCMVal reference andsensitivity simulations in support of upcoming ozone and climate assessments and plannedSPARC CCMVal, SPARC Newsletter, 30, 20–26, 2008. 13835
Fels, S. B.: A parameterization of scale-dependent radiative damping rates in the middle atmo-20
sphere, J. Atmos. Sci., 39, 1141–1152, 1982. 13836Fioletov, V. E. and Shepherd, T. G.: Seasonal persistence of midlatitude total ozone anomalies,
Geophys. Res. Lett., 30, 1417, doi:10.1029/2002GL016739, 2003. 13838, 13839, 13844Fioletov, V. E. and Shepherd, T. G.: Summertime total ozone variations over middle and po-
lar latitudes, Geophys. Res. Lett., 32, L04807, doi:10.1029/2004GL022080, 2005. 13839,25
13840, 13844Fioletov, V. E., Bodeker, G. E., Miller, A. J., McPeters, R. D., and Stolarski, R.: Global and zonal
total ozone variations estimated from ground-based and satellite measurements: 1964–2000, J. Geophys. Res., 107, 4647, doi:10.1029/2001JD001350, 2002. 13855
Fomichev, V. I., Jonsson, A. I., de Grandpre, J., Beagley, S. R., McLandress, C., Semeniuk, K.,30
and Shepherd, T. G.: Response of the middle atmosphere to CO2 doubling: results from theCanadian Middle Atmosphere Model, J. Climate, 20, 1121–1144, doi:10.1175/JCLI4030.1,2007. 13831
13848

Discussion
Paper
|D
iscussionP
aper|
Discussion
Paper
|D
iscussionP
aper|
Fusco, A. C. and Salby, M. L.: Interannual variations of total ozone and their relationship tovariations of planetary wave activity, J. Climate, 12, 1619–1629, 1999. 13832, 13833, 13839
Garcia, R. R. and Randel, W. J.: Acceleration of the Brewer-Dobson circulation due to increasesin greenhouse gases, J. Atmos. Sci., 65, 2731–2739, doi:10.1175/2008JAS2712.1, 2008.138315
Harris, N. R. P., Kyro, E., Staehelin, J., Brunner, D., Andersen, S.-B., Godin-Beekmann, S.,Dhomse, S., Hadjinicolaou, P., Hansen, G., Isaksen, I., Jrrar, A., Karpetchko, A., Kivi, R.,Knudsen, B., Krizan, P., Lastovicka, J., Maeder, J., Orsolini, Y., Pyle, J. A., Rex, M., Van-icek, K., Weber, M., Wohltmann, I., Zanis, P., and Zerefos, C.: Ozone trends at north-ern mid- and high latitudes – a European perspective, Ann. Geophys., 26, 1207–1220,10
doi:10.5194/angeo-26-1207-2008, 2008. 13842Hartmann, D. L., Wallace, J. M., Limpasuvan, V., Thompson, D., and Holton, J. R.: Can ozone
depletion and global warming interact to produce rapid climate change?, P. Natl. Acad. Sci.,97, 1412–1417, 2000. 13833
Haynes, P. H., Marks, C. J., McIntyre, M. E., Shepherd, T. G., and Shine, K. P.: On the “down-15
ward control” of extratropical diabatic circulations by eddy-induced mean zonal forces, J.Atmos. Sci., 48, 651–678, 1991. 13831
Hofmann, D., Oltmans, S., Komhyr, W., Harris, J., Lathrop, J., Deshler, T., Johnson, B., Tor-res, A., and Matthews, W.: Ozone loss in the lower stratosphere over the United States in1992–1993: evidence for heterogeneous chemistry on the Pinatubo aerosol, Geophys. Res.20
Lett., 21, 65–68, 1994. 13837Hood, L. L. and Soukharev, B. E.: Interannual variations of total ozone at northern midlatitudes
correlated with EP flux and potential vorticity, J. Atmos. Sci., 62, 3724–3740, 2005. 13832IPCC: Special Report on Emissions Scenarios: a Special Report of Working Group III of the
Intergovernmental Panel on Climate Change, Cambridge University Press, Cambridge, UK,25
2000. 13835Jiang, X., Eichelberger, S. J., Hartmann, D., Shia, R., and Yung, Y. L.: Influence of doubled
CO2 on ozone via changes in the Brewer-Dobson circulation, J. Atmos. Sci., 64, 2751–2755,2007. 13831
Jockel, P., Tost, H., Pozzer, A., Buhl, C., Buchholz, J., Ganzeveld, L., Hoor, P., Kerk-30
weg, A., Lawrence, M. G., Sander, R., Steil, B., Stiller, G., Tanarhte, M., Taraborrelli, D.,van Aardenne, J., and Lelieveld, J.: The atmospheric chemistry general circulation modelECHAM5/MESSy1: consistent simulation of ozone from the surface to the mesosphere, At-
13849
Discussion
Paper
|D
iscussionP
aper|
Discussion
Paper
|D
iscussionP
aper|
mos. Chem. Phys., 6, 5067–5104, doi:10.5194/acp-6-5067-2006, 2006. 13835Jonsson, A., de Grandpre, J., Fomichev, V., McConnell, J., and Beagley, S.: Doubled CO2-
induced cooling in the middle atmosphere: Photochemical analysis of the ozone radiativefeedback, J. Geophys. Res., 109, D24103, doi:10.1029/2004JD005093, 2004. 13836
Kawa, S. R., Newman, P. A., Stolarski, R. S., and Bevilacqua, R. M.: Fall vortex ozone as a5
predictor of springtime total ozone at high northern latitudes, Atmos. Chem. Phys., 5, 1655–1663, doi:10.5194/acp-5-1655-2005, 2005. 13833
Kiesewetter, G., Sinnhuber, B.-M., Vountas, M., Weber, M., and Burrows, J. P.: A long-termstratospheric ozone dataset from assimilation of satellite observations: high-latitude ozoneanomalies, J. Geophys. Res., 115, D10307, doi:10.1029/2009JD013362, 2010a. 1383310
Kiesewetter, G., Sinnhuber, B.-M., Weber, M., and Burrows, J. P.: Attribution of stratosphericozone trends to chemistry and transport: a modelling study, Atmos. Chem. Phys., 10, 12073–12089, doi:10.5194/acp-10-12073-2010, 2010b. 13845
Knudsen, B. M. and Grooß, J.-U.: Northern midlatitude stratospheric ozone dilution in springmodeled with simulated mixing, J. Geophys. Res., 105, 6885–6890, 2000. 1384015
Kodera, K.: Influence of stratospheric sudden warming on the equatorial troposphere, Geophys.Res. Lett., 33, L06804, doi:10.1029/2005GL024510, 2006. 13836
Li, F., Austin, J., and Wilson, J.: The strength of the Brewer-Dobson circulation in a changingclimate: coupled chemistry-climate model simulations, J. Climate, 21, 40–57, 2007. 13831
Morgenstern, O., Giorgetta, M. A., Shibata, K., Eyring, V., Waugh, D. W., Shepherd, T. G.,20
Akiyoshi, H., Austin, J., Baumgaertner, A. J. G., Bekki, S., Braesicke, P., Bruhl, C., Chipper-field, M. P., Cugnet, D., Dameris, M., Dhomse, S., Frith, S. M., Garny, H., Gettelman, A.,Hardiman, S. C., Hegglin, M. I., Jockel, P., Kinnison, D. E., Lamarque, J., Mancini, E.,Manzini, E., Marchand, M., Michou, M., Nakamura, T., Nielsen, J. E., Olivie, D., Pitari,G., Plummer, D. A., Rozanov, E., Scinocca, J. F., Smale, D., Teyssedre, H., Toohey, M.,25
Tian, W., and Yamashita, Y.: Review of the formulation of present-generation stratosphericchemistry-climate models and associated external forcings, J. Geophys. Res., 115, D00M02,doi:10.1029/2009JD013728, 2010. 13835
Newchurch, M. J., Yang, E. S., Cunnold, D. M., Reinsel, G. C., Zawodny, J. M., and RusselIII, J. M.: Evidence for slowdown in stratospheric ozone loss: first stage of ozone recovery,30
J. Geophys. Res., 108, 4507, doi:10.1029/2003JD003471, 2003. 13842Newman, P. A., Nash, E., and Rosenfield, J.: What controls the temperature of the Arctic
stratosphere during the spring? J. Geophys. Res., 106, 19999–20010, 2001. 13831, 13836
13850

Discussion
Paper
|D
iscussionP
aper|
Discussion
Paper
|D
iscussionP
aper|
Newman, P. A., Daniel, J. S., Waugh, D. W., and Nash, E. R.: A new formulation of equivalent ef-fective stratospheric chlorine (EESC), Atmos. Chem. Phys., 7, 4537–4552, doi:10.5194/acp-7-4537-2007, 2007. 13832, 13842
Nissen, K. M., Matthes, K., Langematz, U., and Mayer, B.: Towards a better representa-tion of the solar cycle in general circulation models, Atmos. Chem. Phys., 7, 5391–5400,5
doi:10.5194/acp-7-5391-2007, 2007. 13835OMI-ATBD: OMI Algorithm Theoretical Basis Document Volume II OMI Ozone Products, Tech.
rep., NASA-GSFC, edited by: Barthia, P. K., ATB-OMI-02, Version 2.0, available at: http://eospso.gsfc.nasa.gov/eos homepage/for scientists/atbd/docs/OMI/ATBD-OMI-02.pdf (lastaccess: May, 2011), 2002. 1383510
Plumb, R. A.: Stratospheric transport, J. Meteorol. Soc. Jpn., 80, 793–809, 2002. 13831Randel, W. J., Wu, F., and Stolarski, R. S.: Changes in column ozone correlated with the
stratospheric EP flux, J. Meteorol. Soc. Jpn., 80, 849–862, 2002. 13832, 13833Reinsel, G., Miller, A. J., Weatherhead, E. C., Flynn, L. E., Nagatani, R. M., Tiao, G. C., and
Wuebbles, D. J.: Trend analysis of total ozone data for turnaround and dynamical contribu-15
tions, J. Geophys. Res., 110, D16306, doi:10.1029/2004JD004662, 2005. 13832Richter, A., Wittrock, F., Weber, M., Beirle, S., Kuhl, S., Platt, U., Wagner, T., Wilms-Grabe, W.,
and Burrows, J. P.: GOME observations of stratospheric trace gas distributions during thesplitting vortex event in the Antarctic winter 2002, Part I: Measurements, J. Atmos. Sci., 62,778–785, 2005. 13836, 13838, 1384420
Rind, D., Shindell, D., Lonergan, P., and Balachandran, N. K.: Climate change and the middleatmosphere. Part III: The double CO2 climate revisited, J. Climate, 11, 876–894, 1998. 13831
Rind, D., Lerner, J., Perlwitz, J., McLinden, C., and Prather, M.: Sensitivity of tracer transportsand stratospheric ozone to sea surface temperature patterns in the doubled CO2 climate, J.Geophys. Res., 107, 4800, doi:10.1029/2002JD002483, 2002. 1383125
Rosenlof, K. H. and Holton, J. R.: Estimates of stratospheric residual circulation using thedownward principle, J. Geophys. Res., 98, 10465–10479, 1993. 13831
Salby, M.: Involvement of the Brewer-Dobson circulation in changes of strato-spheric temperature and ozone, Dynam. Atmos. Oceans, 44, 143–164,doi:10.1016/j.dynatmoce.2006.11.002, 2008. 1383630
Salby, M. L. and Callaghan, P. F.: Interannual changes of the stratospheric circulation: relation-ship to ozone and tropospheric structure, J. Climate, 15, 3673–3685, 2002. 13836
Salby, M. and Callaghan, P.: Systematic changes of northern hemispheric ozone and their
13851
Discussion
Paper
|D
iscussionP
aper|
Discussion
Paper
|D
iscussionP
aper|
relationship to random interannual changes, J. Climate, 17, 4512–4521, 2004a. 13832Salby, M. and Callaghan, P.: Interannual changes of the stratospheric circulation: influence on
the tropics and southern hemisphere, J. Climate, 17, 952–964, 2004b. 13838, 13839Sander, R., Kerkweg, A., Jockel, P., and Lelieveld, J.: Technical note: The new comprehensive
atmospheric chemistry module MECCA, Atmos. Chem. Phys., 5, 445–450, doi:10.5194/acp-5
5-445-2005, 2005. 13835Schnadt, C., Dameris, M., Ponater, M., Hein, R., Grewe, V., and Steil, B.: Interaction of at-
mospheric chemistry and climate and its impact on stratospheric ozone, Clim. Dynam., 18,501–517, 2002. 13831
Shindell, D. T., Rind, D., Balachandran, N., Lean, J., and Lonergan, P.: Solar cycle variability,10
ozone, and climate, Science, 284, 305–308, 1999. 13836Sigmond, M. P., Siegmund, C., Manzini, E., and Kelder, H.: A simulation of the separate climate
effects of middle atmospheric and tropospheric CO2 doubling, J. Climate, 17, 2352–2367,2004. 13831
Sinnhuber, B.-M., Weber, M., Amankwah, A., and Burrows, J. P.: Total ozone during the unusual15
Antarctic winter of 2002, Geophys. Res. Lett., 30, 1580, doi:10.1029/2002GL016798, 2003.13838, 13844
Sinnhuber, B.-M., von der Gathen, P., Sinnhuber, M., Rex, M., Konig-Langlo, G., and Olt-mans, S. J.: Large decadal scale changes of polar ozone suggest solar influence, Atmos.Chem. Phys., 6, 1835–1841, doi:10.5194/acp-6-1835-2006, 2006. 1383320
Solomon, S.: Stratospheric ozone depletion: a review of concepts and history, Geophys. Rev.,101, 275–316, 1999. 13831, 13836
SPARC-CCMVal: SPARC Report on the Evaluation of Chemistry-Climate Models, SPARCReport No. 5, WCRP-132, WMO/TD-No. 1526, edited by: Eyring, V., Shepherd, T. G.,and Waugh, D. W., available at: http://www.atmosp.physics.utoronto.ca/SPARC/ccmval final/25
index.php (last access: May 2011), 2010. 13835, 13842Steinbrecht, W., Claude, H., and Kohler, U.: Correlations between tropopause height and total
ozone: implications for long-term changes, J. Geophys. Res., 103, 19183–19192, 1998.13832
Steinbrecht, W., Claude, H., Schonenborn, F., McDermid, I. S., Leblanc, T., Godin-30
Beekmann, S., Keckhut, P., Hauchecorne, A., Gijsel, J. A. E. V., Swart, D. P. J.,Bodeker, G. E., Parrish, A., Boyd, I. S., Kampfer, N., Hocke, K., Stolarski, R. S., Frith, S. M.,Thomason, L. W., Remsberg, E. E., Savigny, C. V., Rozanov, A., and Burrows, J. P.: Ozone
13852

Discussion
Paper
|D
iscussionP
aper|
Discussion
Paper
|D
iscussionP
aper|
and temperature trends in the upper stratosphere at five stations of the Network for the De-tection of Atmospheric Composition Change, Int. J. Remote Sens., 30, 3875–3886, 2009.13842
Steinbrecht, W., Kohler, U., Claude, H., Weber, M., Burrows, J. P., and van der A, R. J.: Veryhigh ozone columns at northern mid-latitudes in 2010, Geophys. Res. Lett., 38, L06803,5
doi:10.1029/2010GL046634, 2011. 13833Stenchikov, A., Hamilton, K., Robock, A., Ramaswamy, V., and Schwarzkopf, M. D.: Arc-
tic oscillation response to the 1991 Pinatubo eruption in the SKYHI general circula-tion model with a realistic quasi-biennial oscillation, J. Geophys. Res., 109, D03112,doi:10.1029/2003JD003699, 2004. 1383710
Stenke, A., Dameris, M., Grewe, V., and Garny, H.: Implications of Lagrangian transport forsimulations with a coupled chemistry-climate model, Atmos. Chem. Phys., 9, 5489–5504,doi:10.5194/acp-9-5489-2009, 2009. 13835
Stolarski, R. S. and Frith, S. M.: Search for evidence of trend slow-down in the long-termTOMS/SBUV total ozone data record: the importance of instrument drift uncertainty, Atmos.15
Chem. Phys., 6, 4057–4065, doi:10.5194/acp-6-4057-2006, 2006. 13835Tegtmeier, S., Rex, M., Wohltmann, I., and Kruger, K.: Relative importance of dynamical
and chemical contributions to Arctic wintertime ozone, Geophys. Res. Lett., 35, L17801,doi:10.1029/2008GL034250, 2008. 13833
Thompson, D. W. J., Lee, S., and Baldwin, M. P.: Atmospheric processes governing the North-20
ern Hemisphere Annular Mode/North Atlantic Oscillation, in: The North Atlantic Oscillation:Climatic Significance and Environmental Impact, edited by: Hurrell, J. W., Kushnir, Y., Ot-tersen, G., and Visbeck, M., vol. 134 of Geophysical Monograph, 81–112, American Geo-physical Union, Washington, DC, 2003. 13833
Ueyama, R. and Wallace, J. M.: To what extent does high-latitude wave forcing drive25
tropical upwelling in the Brewer-Dobson circulation? J. Atmos. Sci., 67, 1232–1246,doi:10.1175/2009JAS3216.1, 2010. 13845
von Savigny, C., Rozanov, A., Bovensmann, H., Eichmann, K.-U., Noel, S., Rozanov, V. V.,Sinnhuber, B.-M., Weber, M., Burrows, J. P., and Kaiser, J.: The ozone hole break-up inSeptember 2002 as seen by SCIAMACHY on ENVISAT, J. Atmos. Sci., 62, 721–734, 2005.30
13838, 13844Wagner, T., Leue, C., Pfeilsticker, K., and Platt, U.: Monitoring of the stratospheric chlorine
activation by GOME OClO measurements in the austral and boreal winters 1995 through
13853
Discussion
Paper
|D
iscussionP
aper|
Discussion
Paper
|D
iscussionP
aper|
1999, J. Geophys. Res., 106, 4971–4996, 2001. 13836Waugh, D. W. and Hall, T. M.: Age of stratospheric air: theory, observations, and models,
Geophys. Rev., 40, 1010, doi:10.1029/2000RG000101, 2002. 13831Weber, M., Dhomse, S., Wittrock, F., Richter, A., Sinnhuber, B.-M., and Burrows, J. P.: Dynam-
ical control of NH and SH winter/spring total ozone from GOME observations in 1995–2002,5
Geophys. Res. Lett., 30, 1853, doi:10.1029/2002GL016799, 2003. 13833, 13836, 13837,13838, 13844
Weber, M., Lamsal, L. N., Coldewey-Egbers, M., Bramstedt, K., and Burrows, J. P.: Pole-to-polevalidation of GOME WFDOAS total ozone with groundbased data, Atmos. Chem. Phys., 5,1341–1355, doi:10.5194/acp-5-1341-2005, 2005. 1383410
Weber, M., Lamsal, L. N., and Burrows, J. P.: Improved SCIAMACHY WFDOAS total ozoneretrieval: steps towards homogenising long-term total ozone datasets from GOME, SCIA-MACHY, and GOME2, in: Proc. Envisat Symp. Montreux, Switzerland, 2007, ESA SP-636,European Space Agency, available at: http://envisat.esa.int/envisatsymposium/proceedings/posters/3P4/463281we.pdf (last access: May 2011), 2007. 1383415
WMO: Scientific Assessment of Ozone Depletion: 1998, Global Ozone Research and Monitor-ing Project Report 44, World Meteorological Organization, Geneva, 1999. 13831
WMO: Scientific Assessment of Ozone Depletion: 2002, Global Ozone Research and Mon-itoring Project Report 47, World Meteorological Organization, Geneva, available at: http://www.wmo.int/pages/prog/arep/gaw/ozone 2002/ozone 2002.html (last access: May 2011),20
2003. 13831WMO: Scientific Assessment of Ozone Depletion: 2006, Global Ozone Research and Mon-
itoring Project Report 50, World Meteorological Organization, Geneva, available at: http://www.wmo.int/pages/prog/arep/gaw/ozone 2006/ozone asst report.html (last access: May2011), 2007. 13831, 13835, 13836, 13837, 13838, 1384225
WMO: Scientific Assessment of Ozone Depletion: 2010, Global Ozone Research andMonitoring Project Report 52, World Meteorological Organization, Geneva, avail-able at: http://www.unep.ch/ozone/Assessment Panels/SAP/Scientific Assessment 2010/00-SAP-2010-Assement-report.pdf (last access: May 2011), 2011. 13831, 13842
Wohltmann, I., Lehmann, R., Rex, M., Brunner, D., and Mader, J. A.: A process-oriented regres-30
sion model for column ozone, J. Geophys. Res., 112, D12304, doi:10.1029/2006JD007573,2007. 13832, 13842
13854
Discussion
Paper
|D
iscussionP
aper|
Discussion
Paper
|D
iscussionP
aper|
Fig. 1. Top: JFM total ozone area-weighted between 45◦ N and 60◦ N as measured fromground (Fioletov et al. (2002), WOUDC web site, ftp://ftp.tor.ec.gc.ca/Projects-Campaigns/ZonalMeans/gb 1964-2010 za.txt) and satellites (SBUV/TOMS/OMI merged data, MOD V8,in red, GOME/SCIAMACHY/GOME2 merged data, GSG, in blue, and OMI, OMTO3, inlight brown). The thick black line is the three point triangular smooth of the ground data.Middle panel: DJF Arctic oscillation index (blue values correspond to positive AO values)obtained from http://www.cpc.ncep.noaa.gov/products/precip/CWlink/daily ao index/ao.shtml.Thick black line is the three point triangular smooth of the AO index. Bottom panel: Equiv-alent effective stratospheric chlorine (EESC) drawn with a reversed y-axis.
13855
Discussion
Paper
|D
iscussionP
aper|
Discussion
Paper
|D
iscussionP
aper|
Fig. 2. Top: March total ozone area-weighted between 50◦ N and 90◦ N as measured fromsatellites (solid line: SBUV/TOMS/OMI merged data, dashed line: SCIAMACHY/GOME data).Middle panel: NH area weighted polar cap temperature (70◦ N–90◦ N) from different meteorolog-ical analyses. Bottom panel: extra-tropical eddy heat flux at 100 hPa averaged from Septemberto March and area weight averaged between 45◦ N and 75◦ N derived from different meteoro-logical analyses.
13856

Discussion
Paper
|D
iscussionP
aper|
Discussion
Paper
|D
iscussionP
aper|
Fig. 3. Top: October total ozone area-weighted between 50◦ S and 90◦ S as measured fromsatellites (solid line: SBUV/TOMS/OMI merged data, dashed line: SCIAMACHY/GOME data).Middle panel: SH area weighted polar cap temperature (70◦ S–90◦ S) from different meteoro-logical analyses. Bottom panel: extra-tropical eddy heat flux at 100 hPa averaged from Marchto September and area weight averaged between 45◦ S and 75◦ S from different meteorologicalanalysis.
13857
Discussion
Paper
|D
iscussionP
aper|
Discussion
Paper
|D
iscussionP
aper|
Fig. 4. Spring-to-fall ratio of observed polar cap total ozone (>50◦) as a function of the absoluteextratropical winter mean eddy heat flux (September to March and March to September in therespective hemispheres) derived from ECMWF ERA-Interim data separately in the respectivehemisphere. Data from the Southern Hemisphere are the triangles (September over Marchozone ratios) and from the Northern Hemisphere are solid circles (March over September ra-tios).
13858

Discussion
Paper
|D
iscussionP
aper|
Discussion
Paper
|D
iscussionP
aper|
Fig. 5. Winter-to-fall ratio of observed total ozone for various zonal bands from the polar re-gion to the tropics as a function of the mean absolute extratropical cumulative eddy heat fluxbetween September and February in the NH and between March and August in the SH fromERA-Interim. Data from the Southern Hemisphere are the triangles (August over March ozoneratios) and from the Northern Hemisphere are solid circles (February over September ratios).Colors correspond to individual SH and NH winters as indicated in the bottom of Fig. 4.
13859
Discussion
Paper
|D
iscussionP
aper|
Discussion
Paper
|D
iscussionP
aper|
Fig. 6. Correlation between GOME/SCIAMACHY total ozone ratio (with respect to Septemberin the NH and March in the SH) and mean extratropical eddy heat flux averaged from startingmonth (September in the NH and March in the SH) to the respective month indicated on thex-axis for various zonal bands from the tropics to polar latitudes. Sample scatter plots forFebruary (NH) and August (SH) data are shown in Fig. 5.
13860

Discussion
Paper
|D
iscussionP
aper|
Discussion
Paper
|D
iscussionP
aper|
Fig. 7. Same as Fig. 6, but for CCM data from DLR-E39C-A model during the period 1985–2010. Dotted line shows the correlation of the 30◦–40◦ zonal band for the time period 1960–1985 (past) and the dashed line for 2010–2050 (future).
13861
Discussion
Paper
|D
iscussionP
aper|
Discussion
Paper
|D
iscussionP
aper|
Fig. 8. Same as Fig. 7, but for CCM data from EMAC-FUB model.
13862

Discussion
Paper
|D
iscussionP
aper|
Discussion
Paper
|D
iscussionP
aper|
Fig. 9. Spring-to-fall ratio of polar cap total ozone (> 50◦) as a function of the absolute extrat-ropical winter mean eddy heat flux from the DLR-E39C-A CCM. Data from the Southern Hemi-sphere are triangles (September over March ozone ratios) and from the Northern Hemisphereare circles (March over September ratios). Different colors for the model data correspond todifferent time periods: past (1960–1985, grey), present (1985–2010, black), and future (2010–2050, blue). The colored points are the observational data as shown in Fig. 4.
13863
Discussion
Paper
|D
iscussionP
aper|
Discussion
Paper
|D
iscussionP
aper|
Fig. 10. Same as Fig. 9, but for CCM data from EMAC-FUB model.
13864

Discussion
Paper
|D
iscussionP
aper|
Discussion
Paper
|D
iscussionP
aper|
Fig. 11. Time series of annual winter averaged extratropical eddy heat flux (September toMarch and March to September in the respective hemisphere) derived from the DLR-E39C-A (left panel) and EMAC-FUB models (right panel) between year 1960 and 2050 separate foreach hemisphere. The red and blue points as well as lines show the decadal means in theNH and SH, respectively, and the corresponding regression line. Also shown in green are thedecadal means from the NCEP reanalysis during the satellite era (1980–2010).
13865