Embed Size (px)
Citation preview

© Crown copyright Met Office
The Brewer-Dobson circulation in the CMIP5 simulations
Steven Hardiman and Neal Butchart (Met Office Hadley Centre)
Natalia Calvo (Universidad Complutense de Madrid)

© Crown copyright Met Office
Model simulations
Historical and RCP8.5 CMIP5 model simulations
Split into high top (lid above 1hPa) and low top (lid below 1hPa) models
Consider climatology and trends in tropical upwelling and turn-around latitudes
Look at Interannual variability and relation to ENSO/surface T
Talk outline

© Crown copyright Met Office
• More realistic double peak structure in high top models:
local equatorial minimum less pronounced in low top models (implications for tape recorder).
• Models don’t capture the hemispheric asymmety in the reanalysis (as in CCMVal).
• Surprisingly, trends strongest at the equator (suggests narrowing of the upwelling region and reduction of w* min on equator)
Residual vertical velocity w*(70hPa)

© Crown copyright Met Office
TA lats, where w* changes sign, slightly more equatorward in low top models(narrower tropical pipe)
Turn-around latitudes (70hPa)
Tropical pipe displaced towards the summer hemisphere, width of pipe is least in MAM and SON, and w* always min on the equator
Seviour, W. J. M., N. Butchart, and S. C. Hardiman (2012), The Brewer–Dobson circulation inferred from ERA-Interim, Q.J.R. Meteorol. Soc., 138: 878–888. doi:10.1002/qj.966

© Crown copyright Met Office
Width of tropical pipe is a fairly constant 76 degrees from 50hPa to 1hPa
Turn-around latitudes (annual mean)

© Crown copyright Met Office
Trend in TA lats suggests width of tropics is decreasing at 70hPa, by around 8deg/century (Consistent with 5deg/century found by Li et al, since RCP8.5 used here)
Trend in Turn-around latitudes (70hPa)
Li F, et al (2010), Geophys. Res. Lett., 37, doi:10.1029/2010GL043718

© Crown copyright Met Office
Width of tropical pipe decreases from 100hPa to 20hPa, but increases from 20hPa to 2hPa.
Trend in Turn-around latitudes (annual mean)
Consistently, McLandress and Shepherd (2011) show an equatorward trend in planetary and synoptic scale wave breaking at 50hPa (due to critical layers on equatorward side of subtropical jets moving upward into the lower stratosphere)

© Crown copyright Met Office
Tropical upwelling = integrated upwelling between Turn-around latitudes(necessary since position of pipe moves with the seasons)
• High top models show more upwelling at all heights, and better agreement with reanalysis, than do low top models.
• Steeper vertical gradient Not enough horizontal outflux (v*) in models.
Trend constant from 5hPa to 1hPa: suggest that planetary waves dominate below 10hPa, and gravity waves from 1hPa

© Crown copyright Met Office
PWD
GWD
?
Tropical upwelling = integrated upwelling between Turn-around latitudes(necessary since position of pipe moves with the seasons)
• High top models show more upwelling at all heights, and better agreement with reanalysis, than do low top models.
• Steeper vertical gradient Not enough horizontal outflux (v*) in models.
Trend constant from 5hPa to 1hPa: suggest that planetary waves dominate below 10hPa, and gravity waves from 1hPa
© Crown copyright Met Office
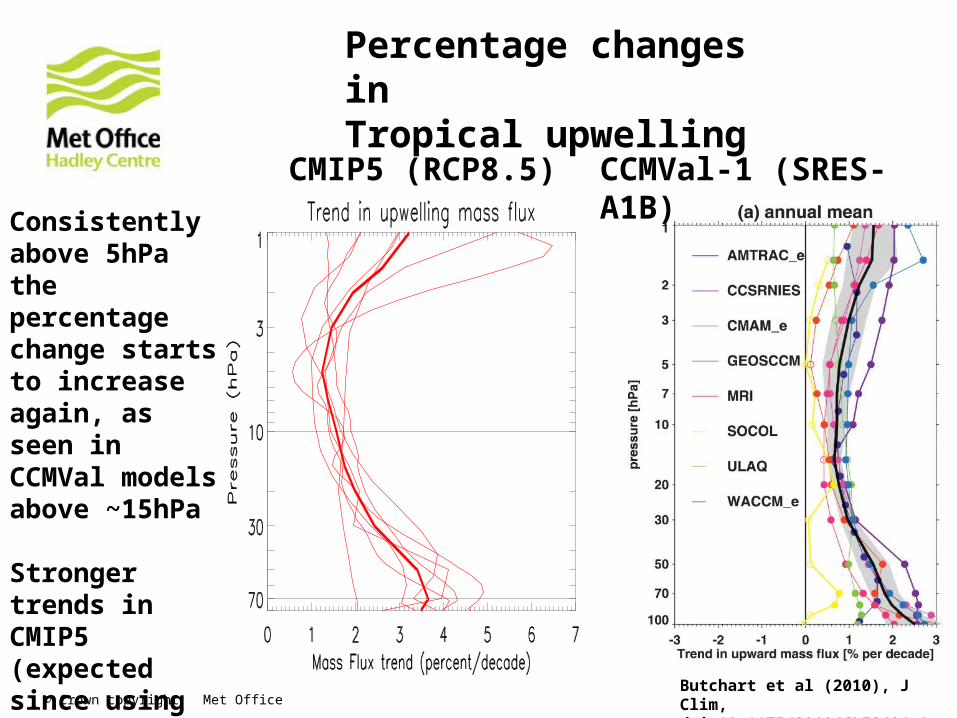
Consistently above 5hPa the percentage change starts to increase again, as seen in CCMVal models above ~15hPa
Stronger trends in CMIP5 (expected since using different scenarios)
Percentage changes inTropical upwelling
Butchart et al (2010), J Clim, doi:10.1175/2010JCLI3404.1
CMIP5 (RCP8.5) CCMVal-1 (SRES-A1B)

© Crown copyright Met Office
• More upwelling (and closer to reanalysis) in high top models
• Stronger trend in high top models• Absolute magnitude of seasonal
cycle is increasing …
Trend in upwelling
Seasonal cycle (70hPa)TREND

© Crown copyright Met Office
… but relative magnitude of seasonal cycle is not
Annual mean percentage changes are
High top : 27.0%Low top : 19.4%
Percentage change in mass upwelling (70hPa)

© Crown copyright Met Office
Interannual variability:Influence of SSTs
Correlation of ENSO index [T(1000hPa, 210E-270E, 5S-5N)] with zonal mean T(p, 30S-30N).
Figure from Hardiman, S. C., N. Butchart, P. H. Haynes, and S. H. E. Hare (2007), A note on forced versus internal variability of the stratosphere, Geophys. Res. Lett., 34, L12803, doi:10.1029/2007GL029726
• ENSO correlates positively with T throughout the troposphere and negatively with T throughout the stratosphere.
• No difference between high top and low top

© Crown copyright Met Office
Thus ENSO can influence the BDC:In Hardiman et al. (2007) the interannual correlation between mass upwelling and the ENSO index is 0.76
Influence of ENSO
w*
Downward control
© Crown copyright Met Office
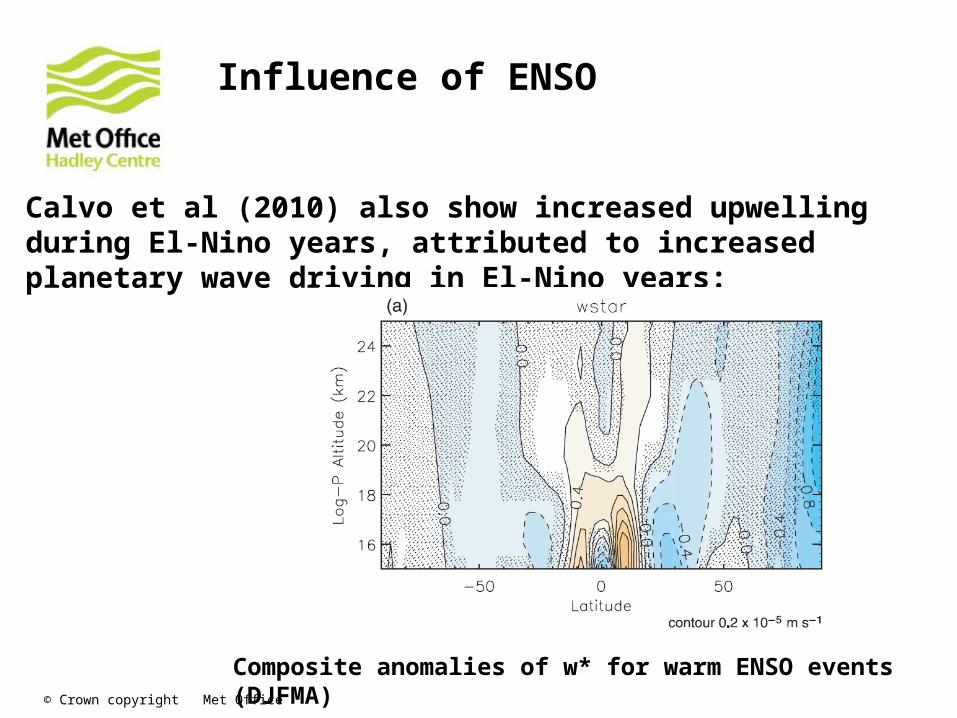
Calvo et al (2010) also show increased upwelling during El-Nino years, attributed to increased planetary wave driving in El-Nino years:
Influence of ENSO
Composite anomalies of w* for warm ENSO events (DJFMA)
© Crown copyright Met Office
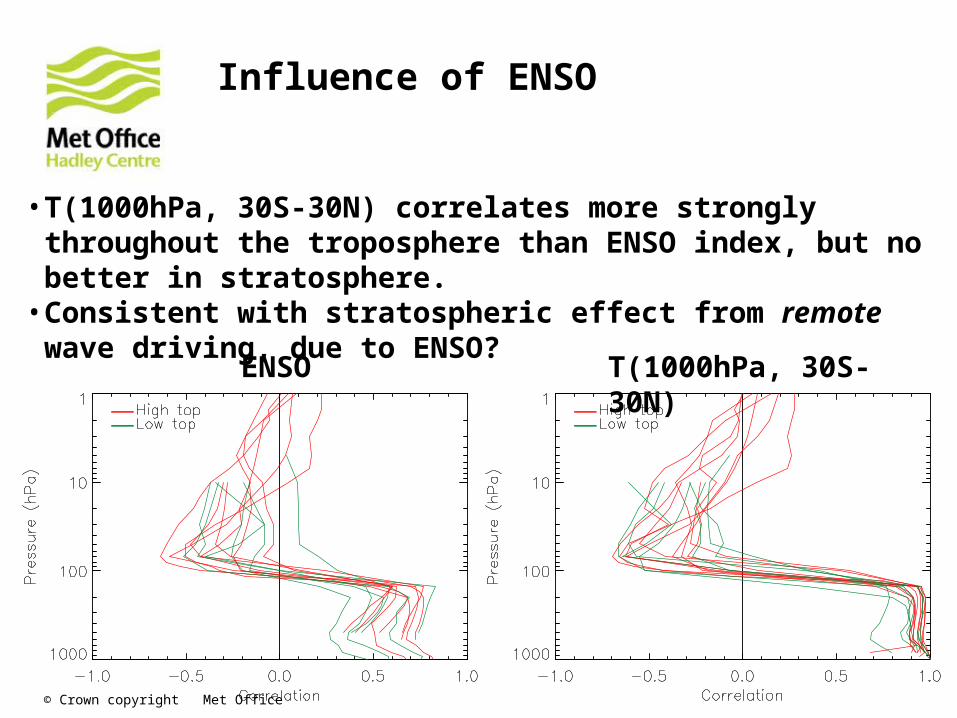
• T(1000hPa, 30S-30N) correlates more strongly throughout the troposphere than ENSO index, but no better in stratosphere.
• Consistent with stratospheric effect from remote wave driving, due to ENSO?
Influence of ENSO
ENSO T(1000hPa, 30S-30N)

© Crown copyright Met Office
Multi-Model Mean correlation of T(50hPa,30S-30N) with T(1000hPa) centres on ENSO region
Influence of ENSO

© Crown copyright Met Office
• A well resolved stratosphere is required to accurately simulated the Brewer-Dobson Circulation:
• More pronounced equatorial minimum in w* in high top models – better agreement with structure of w* seen in reanalysis
• Strength of BDC as measured by mean tropical upwelling is stronger in high top models than in low top models, and is closer to reanalysis in high top models
• Magnitude of increasing trend in BDC is greater in high top models
• Tropical pipe in lower stratosphere becomes narrower under climate change
• ENSO interannual variability projects onto tropical upwelling, and onto temperature throughout the stratosphere
Conclusions