Embed Size (px)
Citation preview
1
Roanoke Clean Air Plan
Ozone Early Action PlanFor
The Roanoke Ozone EarlyAction Compact Area
March 31, 2004
2
Roanoke Clean Air Plan
TABLE OF CONTENTS
1. BACKGROUNDA. Introduction & Project Background B. The 8-Hour Standard in Roanoke Valley RegionC. Ozone Early Action program (OEAP) D. Description of Early Action Area
2. PROJECT ORGANIZATION AND PROGRESS SUMMARYA. OrganizationB. Progress SummaryC. Stakeholder Involvement and Meetings
3. EMISSION REDUCTION STRATEGIESA. Local Control MeasuresB. State & Federal Control Measures
4. AIR QUALITY TECHNICAL SUPPORT ACTIVITIESA. BackgroundB. Model and Domain SelectionC. Episode SelectionD. Emissions Inventory & Control Measure SummaryE. Base Case ModelingF. Future Case Modeling
5. MAINTENANCE FOR GROWTH A. BackgroundB. Contingency MeasuresC. Other Air Quality Modeling Exercises
3
Roanoke Clean Air Plan
Ozone Early Action PlanFor the
Roanoke Ozone Early Action Compact Area
1. BACKGROUND
A. Introduction & Project Background
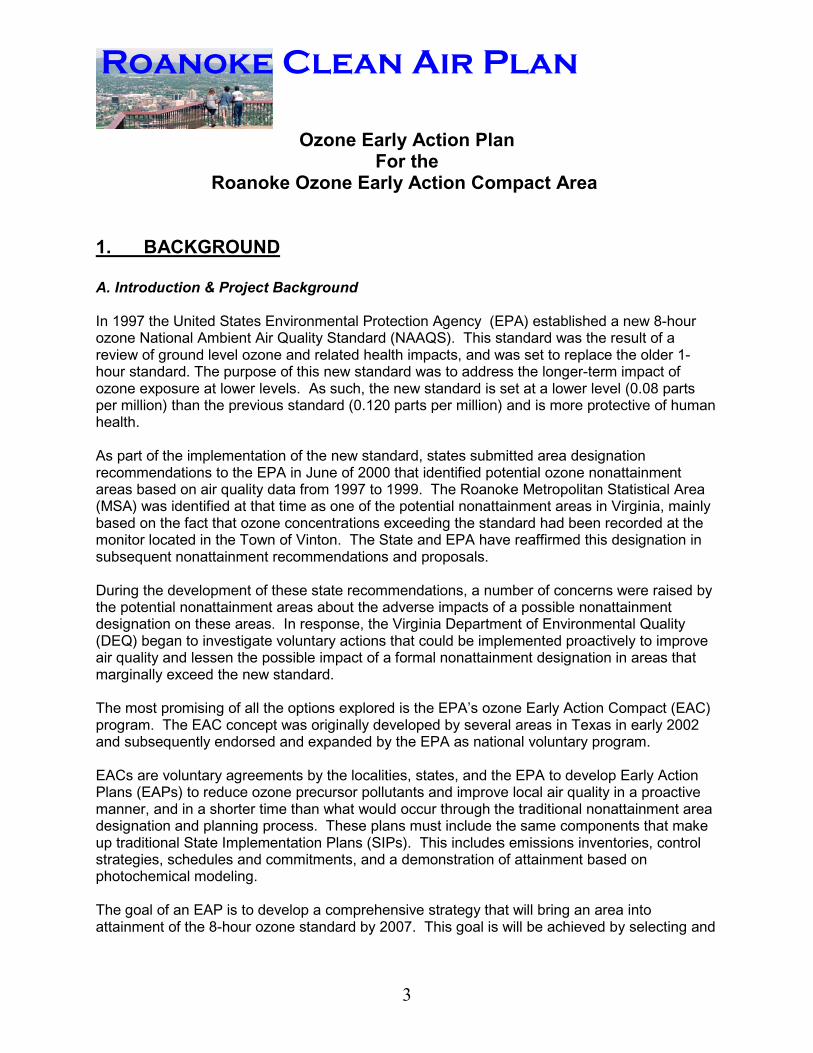
In 1997 the United States Environmental Protection Agency (EPA) established a new 8-hourozone National Ambient Air Quality Standard (NAAQS). This standard was the result of areview of ground level ozone and related health impacts, and was set to replace the older 1-hour standard. The purpose of this new standard was to address the longer-term impact ofozone exposure at lower levels. As such, the new standard is set at a lower level (0.08 partsper million) than the previous standard (0.120 parts per million) and is more protective of humanhealth.
As part of the implementation of the new standard, states submitted area designationrecommendations to the EPA in June of 2000 that identified potential ozone nonattainmentareas based on air quality data from 1997 to 1999. The Roanoke Metropolitan Statistical Area(MSA) was identified at that time as one of the potential nonattainment areas in Virginia, mainlybased on the fact that ozone concentrations exceeding the standard had been recorded at themonitor located in the Town of Vinton. The State and EPA have reaffirmed this designation insubsequent nonattainment recommendations and proposals.
During the development of these state recommendations, a number of concerns were raised bythe potential nonattainment areas about the adverse impacts of a possible nonattainmentdesignation on these areas. In response, the Virginia Department of Environmental Quality(DEQ) began to investigate voluntary actions that could be implemented proactively to improveair quality and lessen the possible impact of a formal nonattainment designation in areas thatmarginally exceed the new standard.
The most promising of all the options explored is the EPA’s ozone Early Action Compact (EAC)program. The EAC concept was originally developed by several areas in Texas in early 2002and subsequently endorsed and expanded by the EPA as national voluntary program.
EACs are voluntary agreements by the localities, states, and the EPA to develop Early ActionPlans (EAPs) to reduce ozone precursor pollutants and improve local air quality in a proactivemanner, and in a shorter time than what would occur through the traditional nonattainment areadesignation and planning process. These plans must include the same components that makeup traditional State Implementation Plans (SIPs). This includes emissions inventories, controlstrategies, schedules and commitments, and a demonstration of attainment based onphotochemical modeling.
The goal of an EAP is to develop a comprehensive strategy that will bring an area intoattainment of the 8-hour ozone standard by 2007. This goal is will be achieved by selecting and
4
Roanoke Clean Air Plan
implementing local ozone precursor pollutant control measures that when combined with othermeasures on the state and national level, are sufficient to bring the area into compliance withthe standard. If the area is successful in developing a plan that demonstrates attainment of the8-hour ozone standard by 2007, the EPA will defer the effective date of the nonattainmentdesignation for the area. This deferral will remain in place as long as certain milestones aremet, such as implementation of local controls by 2005. If all interim milestones are met and thearea demonstrates attainment of the standard during the period from 2005 to 2007 through airquality data, then the nonattainment designations will be withdrawn by EPA, without furtherregulatory requirements. If an area fails at any point in the process, it will revert back totraditional nonattainment status, with all the associated requirements of such a designation.
The Roanoke MSA area entered into an Early Action Compact with both the Commonwealthand EPA for the area including Botetourt and Roanoke Counties, the Cities of Roanoke andSalem, and the Town of Vinton. This Compact was signed by all the parties involved and thensubmitted to the EPA by the required date (December 31, 2002). The area has subsequentlyestablished and commissioned the Roanoke Early Action Plan Task Force to serve as the majorstakeholder group to coordinate the development of an early action plan for the area. This TaskForce has a diverse and knowledgeable membership, which greatly aided the development of acomprehensive plan.
Both this area, and the other Early Action Compact area in Virginia (Northern ShenandoahValley), are well suited for this project due to their geographic location and extent, marginalnonattainment air quality levels, and common influences of ozone transport and other externalfactors. Both areas are located in the western part of Virginia and would be separate andrelatively small nonattainment areas, if formally designated.
The remainder of this final plan and report describes the project area, the significant events andprogress made thus far, efforts to encourage public participation in the process, and thetechnical support activities completed support the overall planning effort.
B. The 8-Hour Standard in the Roanoke Metropolitan Statistical Area (MSA)
During the past several years air quality planning in the Roanoke MSA has intensified as ozoneconcentrations in the Roanoke MSA have exceeded the value permitted by the 8-hour ozoneNAAQS. Due to legal challenges to the NAAQS and ensuing litigation, EPA has not formallydesignated areas of the United States in violation of the 8-hour ozone NAAQS. The 8-hourNAAQS has been upheld and EPA anticipates nationwide designation of nonattainment areasby 2004. Based on recent monitoring data, it is probable that the Roanoke MSA will bedesignated a nonattainment area when formal designations occur.
The 8-hour ozone standard is determined by averaging three years of the fourth highest 8-hourozone levels in an area. This number, called the design value, must be lower than 85 parts perbillion (ppb) to meet the standard. Currently, the Roanoke MSA design value (averaging 2001,2002 and 2003) is 85 ppb. Each year this design value may vary. Data is available for theRoanoke MSA for the 8-hour ozone standard beginning in 1990. Ozone concentrations haveexceeded the standard a total of 30 times during the period from 1990 to 2003. The number ofexceedences recorded in Roanoke from 1991 to 2003 are shown below. Data from the

5
Roanoke Clean Air Plan
monitors in Wythe and Rockbridge Counties are also shown for comparison purposes:
Roanoke, VA (Vinton Monitor)
91 92 93 94 95 96 97 98 99 00 01 02 03 2 0 2 2 2 0 2 13 6 2 5 5 1
Wythe County, VA
91 92 93 94 95 96 97 98 99 00 01 02 030 0 3 3 1 0 1 6 4 2 1 6 2
Rockbridge County, VA
91 92 93 94 95 96 97 98 99 00 01 02 03(New Monitor beginning operation in 1999) 2 0 1 0 0
Figure 1 – Roanoke 8-hour Ozone Standard Monitor Data
In 2002 and 2003, the Roanoke monitor recorded 8-hour exceedences on the following days:
2002 2003
June 11 91 ppb June 25 91 ppbJuly 17 94 ppbAugust 10 85 ppbAugust 11 92 ppb
8-Hour Ozone Exceedences (1990 to 2003)
05
1015
1990
1991
1992
1993
1994
1995
1996
1997
1998
1999
2000
2001
2002
2003
Year
Exc
eede
nces
Roanoke Wythe Rockbridge

6
Roanoke Clean Air Plan
August 13 99 ppb
C. OZONE EARLY ACTION PROGRAM (OEAP)
The region agreed and committed itself to the OEAP process to expedite air cleanup for futurepublic health and welfare. The OEAP was developed according to protocol endorsed by EPARegion 6 on June 19, 2002. The Protocol offers a more expeditious time line for achievingclean air than expected under EPA’s 8-hour implementation rulemaking.
The principles of the OEAP to be executed by Local, State and EPA officials are:
• Early planning, implementation, and emission reductions leading to expeditious attainmentand maintenance of the 8-hour ozone standard;
• Local control of the measures to be employed, with broad-based public input;• State support to ensure technical integrity of the OEAP;• Formal incorporation of the OEAP into the SIP;• Deferral of the effective date of nonattainment designation and related requirements so long
as all OEAP terms and milestones are met; and• Safeguards to return areas to traditional SIP requirements should OEAP terms and/or
milestones be unfulfilled, with appropriate credit given for emission reduction measuresimplemented.
The Roanoke MSA OEAP has two principal components:
1. The Early Action Compact (EAC) — EAC was the Memorandum of Agreement toprepare and implement an Early Action Plan (EAP). More specifically, the EACestablished measurable milestones for developing and implementing the EAP.
2. The Early Action Plan (EAP) — This EAP serves as Roanoke MSA’s official air qualityimprovement plan, with quantified emission-reduction measures. The EAP will includeall necessary elements of a comprehensive air quality plan, (like the plans in Richmond,VA), but will be tailored to local needs and driven by local decisions. Moreover, the EAPwill be incorporated into the formal SIP and the region will be legally required to carryout this plan just as in nonattainment areas. For example, development of EAP willrequire the same scientific diligence and undergo the same scrutiny as thenonattainment areas’ SIPs, so that the emission reduction strategies selected will beadequate to ensure the region stays in attainment of the 8-hour standard.
OEAP Versus Traditional Nonattainment
A major advantage of the region’s participation in an OEAP is the flexibility afforded to thesignatories in selecting emission reduction measures and programs that are best suited to local needs and circumstances. Recognizing the varied social and economic characteristics of theregion, not all measures can or should be implemented by every entity.
• The OEAP allows for more local control in selecting emission-reduction measures.• The OEAP provides deferral of nonattainment designation and related requirements, as long
7
Roanoke Clean Air Plan
as Plan requirements and milestones are met. This would prevent any related stigma
associated with a nonattainment designation.• The OEAP is designed to achieve clean air faster than under the traditional SIP process.• Should any milestones be missed in designing or implementing the Plan, the area would
automatically revert to the traditional SIP requirements, with appropriate credit given foremission reduction measures already implemented.
The Roanoke MSA’s OEAP is designed to enable a local, proactive approach to ensuringattainment of the 8-hour ozone NAAQS, and so protect human health. Using the OEAPapproach, the region could begin implementing by 2005 emission-reduction measures directedat attaining the 8-hour standard. This allows for a significantly earlier start than waiting for formalEPA nonattainment designation and it gives more flexibility in choosing which emissionreduction strategies to implement. The area is then required to demonstrate compliance withthe ozone standard by 2007 through ozone monitoring data.
D. Description of the Early Action Compact Area
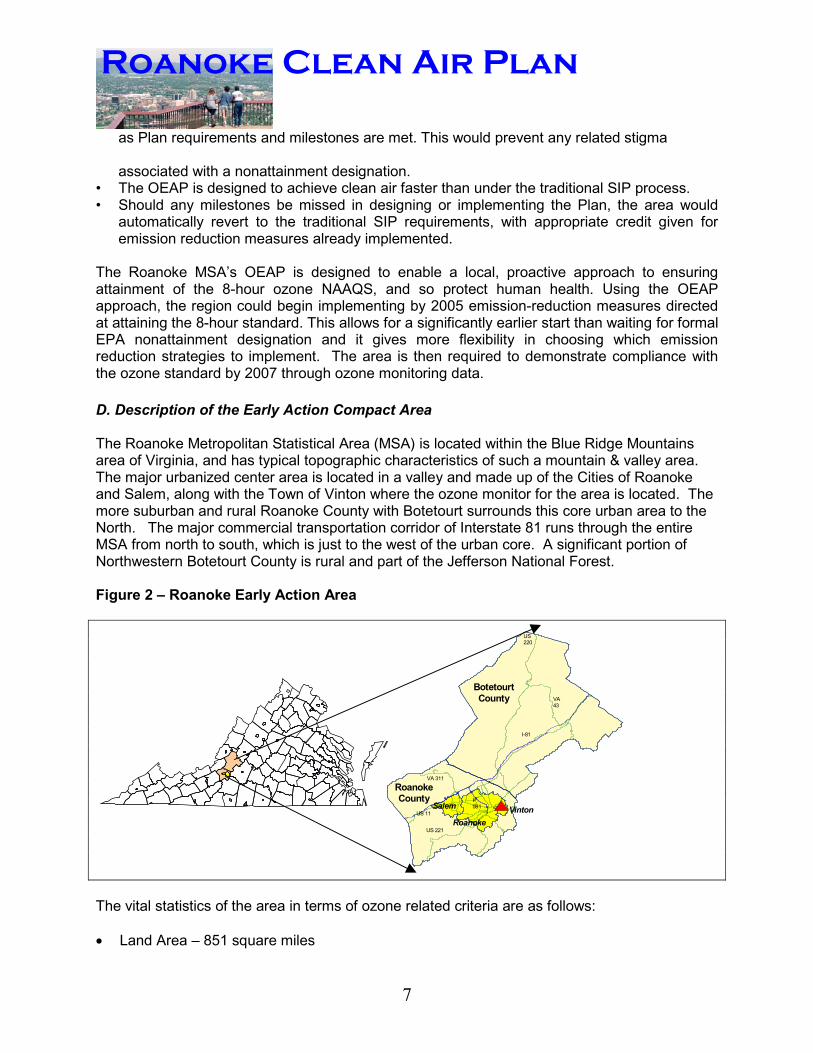
The Roanoke Metropolitan Statistical Area (MSA) is located within the Blue Ridge Mountainsarea of Virginia, and has typical topographic characteristics of such a mountain & valley area.The major urbanized center area is located in a valley and made up of the Cities of Roanokeand Salem, along with the Town of Vinton where the ozone monitor for the area is located. Themore suburban and rural Roanoke County with Botetourt surrounds this core urban area to theNorth. The major commercial transportation corridor of Interstate 81 runs through the entireMSA from north to south, which is just to the west of the urban core. A significant portion ofNorthwestern Botetourt County is rural and part of the Jefferson National Forest.
Figure 2 – Roanoke Early Action Area
The vital statistics of the area in terms of ozone related criteria are as follows:
� Land Area – 851 square miles
US220
US 221
I-81
VA 311
VA43
I-581
US 11
BotetourtCounty
RoanokeCounty
Salem
RoanokeVinton

8
Roanoke Clean Air Plan
� Population (2000) – 235,932
� Population density (2000) – 277 per square mile� Projected Population (2010) – 244,499� Volatile Organic Compound Emissions (2002) – 45 tons per day� Oxides of Nitrogen Emissions (2002) – 50 tons per day� Prevailing Ozone Season Wind Direction – From the Southwest� 8-hour Ozone Design Value (2001 – 2003) – 0.085 parts per million
2. PROJECT ORGANIZATION & PROGRESS SUMMARY
The Ozone Early Action Plan development process is a joint effort of the Roanoke Valley AreaMetropolitan Planning Organization and the Virginia Department of Environmental Quality. TheRoanoke Valley-Alleghany Regional Commission (RVARC) is the administrative agency for theRoanoke Valley Area Metropolitan Planning Organization. Staff with the Commission have been
detailed to work on the Ozone Early Action Plan and to manage the involvement of a consultant,E.H. Pechan & Associates, which assisted with development of the plan.
A. Project Organization
The Ozone Early Action Plan Task Force was established to guide the consultant and RoanokeValley-Alleghany Regional Commission staff in the development of the Ozone Early Action Planwhen it is not practical to engage the public at large on every minor detail. The Task Force isstaffed by the RVARC, making Wayne Strickland the Task Force’s ex-officio director.
B. Progress Summary
On June 30, 2003, the 1st Semi-Annual Status Report was submitted to EPA. That reportfulfilled the first reporting milestone required by the EAC.
The 2nd Semi-Annual Status Report in December 2003 provided a list of the control measuresunder consideration for adoption by the Roanoke areas. This report listed and described eachmeasure and provided the likely implementation dates, a current assessment of the amount ofemission reductions expected to be achieved through implementation of the measure, and thegeographical area in which each control measure is anticipated to apply.
The specific process used to select and evaluate local control measures is presented below:
� During the August taskforce meeting, all participating members cast initial votes for potentialcontrol measures to be carried forward in process from the original June 16th potential localcontrol measure list that was submitted to EPA. The top measures from this voting werethose the group generally believed were most likely to be effective and acceptable ifincluded in the final local control plan.
� Three subcommittees made up of taskforce members were established during theSeptember meeting to individually evaluate each potential local control measure that was

9
Roanoke Clean Air Plan
May 2, 2003 Ozone EAP Task Force
previously voted forward in the process. These subcommittees covered the followingcategories of potential local controls:
1. Heavy Duty Diesel and Diesel equipment strategies2. Air-quality action day, public education, and stationary sources strategies3. Lawn and garden equipment strategies
The individual committees met continuously during October to define, evaluate, and quantify themeasures in each category. Once this process was completed, a draft local control plan wasdeveloped and presented to the whole task force in November and accepted for inclusion in thestatus report during the December taskforce.
The subsequent draft final Early Action Plan (EAP) was then developed and presented forformal adoption to each the governing body of each jurisdiction involved. In turn, eachjurisdiction has formally adopted the plan and committed to its subsequent implementation. Theformal resolutions of adoption are present in Appendix B.
C. Stakeholder Involvement and Meetings
The “Task Force” is staffed by the RVARC, making Wayne Strickland the ex-officio director ofthe “Task Force.” Thus far, we have not turned away any stakeholder interested in serving onthe Ozone EAP Task Force. Thus, the complete make-up of the Task Force is not static;however, its approximate current makeup includes representation from the followingorganizations at a minimum ( Blue Ridge Bicycle Club, Roanoke Regional Chamber ofCommerce, Blue Ridge Environmental Network, US Forest Service, PiedmontEnvironmental Council, RIDE Solutions, Salem – Roanoke County Chamber ofCommerce, Virginia Tech, Norfolk Southern Corp., Southern Environmental Law Center,Clean Valley Council, Roanoke Valley Greenways Commission, Roanoke Valley Asthmaand Air Quality Coalition, Sierra Club – Virginia Chapter, Roanoke Valley EconomicDevelopment Partnership, Roanoke Valley Resource Authority, Virginia HealthDepartment, City of Roanoke, City of Salem, County of Roanoke, County of Botetourt,Town of Vinton, Virginia DEQ, Virginia DOT (VDOT), Federal Highway Administration)Many other organizations have participated on an ad hoc basis. There is room for neworganizations to participate as the planning process continues.
� Monday December 16, 2002 Early Action Compact (EAC) Signing Ceremony, Publicand Press Invited, Press Releasespreceded the event, a media pack wasdeveloped in conjunction with RVARC’son call PR Consultant.
� January 14, 2003 Ozone EAP TaskForce Kickoff meeting (*see Task ForceMakeup Above)
� Wednesday February 19, 2003 – EAPwas featured in Leadership RoanokeValley Air Quality Program at RoanokeCounty Fire and Rescue Training

10
Roanoke Clean Air Plan
May 29, 2003 Public Meeting
Center (LRV Quality of Life Program – All Day)
� February 28, 2003 – EAP Task Force Meeting – Consultant Presentations andSelection of finalist for contract.
� March 28,2003 – EAP Task Force Meeting – Air Quality Modeling Presentation andDiscussion – Virginia DEQ
� March 10, 2003 – Oral Presentation to Cosmopolitan Club (Mark McCaskill, LunchMeeting, Q&A included)
� April 10, 2003 – Oral Presentation to Roanoke Regional Chamber of CommerceTransportation Committee concerning the EAP. (Mark McCaskill, 12:00 pm, Q&Aincluded)
� April 23, 2003 – Oral Presentation to Roanoke Valley Greenways Commissionconcerning the EAP. (Mark McCaskill, 5:00 pm, Q&A included)
� May 1, 2003 – Media Interview Channel 10 6:00 O’clock News� May 2, 2003 – EAP Task Force Meeting – E.H. Pechan Associates – Draft Strategies
Menu Discussion� May 15, 2003 Advertisement sent to Roanoke Times and Roanoke Tribune for May
29, 2003 public input meeting. Advertisement will run in the Sunday May 18, 2003Edition (Roanoke Times) and Thursday May 22, 2003 edition (Roanoke Tribune).
� May 16, 2003 – Distribution of Draft Strategies List to “Regional Mayor’s and Chairs”meeting (Local Elected and Chief Administrative Officers for the Region)
� May 16, 2003 – Notice of May 29th public meeting in Roanoke Regional Chamber’sMonthly Electronic Newsletter “Member Connections”
� May 19, 2003 – EAP Task Force teleconference meeting with E.H. Pechan concerningdraft strategies.
� May 19, 2003 – May 29th meeting press release to following recipients (Joe McKean,WDBJ-TV; Melissa Preas, WSLS-TV; Ray Reed, The Roanoke Times; Chris Kahn,Associated Press; William Little, Fincastle Herald; Claudia Whitworth, The RoanokeTribune; Jeff Walker, The Vinton Messenger; Meg Hibbert, Salem Times Register; RickMattioni, WVTF-FM (Public Radio); Kevin LaRue, WFIR-FM (Roanoke's News Radio)
� May 27, 2003 –Retransmission ofabove pressrelease
� May 29, 2003 –Interview with DanHeyman WVTFNews concerningpublic meeting
� May 29, 2003 –Article published inRoanoke Timesconcerning publicmeeting (see file)

11
Roanoke Clean Air Plan
August 8,2003 Meeting
Notice Placed at Main Library
� May 29, 2003 – Public Meeting Roanoke County Headquarters Library (28 Attendees) –Public comments cataloged and transmitted to consultant (E.H. Pechan) for revision ofdraft strategies list.
� June 25, 2003 – Isak Howell (The Roanoke Times) requests the list of potentialstrategies to do an Ozone related story.
� June 26, 2003 – Isak Howell story appears in The Roanoke Times and mentions theOzone EAP and public participation.
� July 30, 2003 – Ozone EAP featured in July 29, 2003 edition of “Legislative Connection”email distributed by Roanoke Regional Chamber of Commerce.
� August 8, 2003 – Ozone EAP Task Force meeting. Initial “Voting” on strategies.� SEPTEMBER – Article featuring
Ozone EAP process and theRoanoke Valley’s participationfeatured in the NationalAssociation of DevelopmentOrganizations’ (NADO)“Economic DevelopmentDigest” September Edition –Kelly Novak Author
� September 4, 2003 – OzoneEAP Task Force meeting andestablishment of“subcommittees” to evaluatestrategies.
� September – November, 2003subcommittee meetings.
� November 14, 2003 – OzoneEAP Task Force Meeting.
� November 26, 2003 – Press Release to announce December 5, 2003 EAP Open House� November 30, 2003 – Advertisement of December 5, 2003 in Roanoke Times� December 1, 2003 – Notices
placed at City of RoanokeMain, Gainsboro, Jackson,Melrose and Williamson RoadLibrary Branches.
� December 2, 2003 – City ofRoanoke EnvironmentalInformation Officer placedNovember 26 Press Release inthe City’s “My Roanoke” emailnewsletter.
� December 2, 2003 – Noticesannouncing Open Houseplaced at Harrison Museum ofAfrican American Culture as

12
Roanoke Clean Air Plan
December 5, 2003 Open House
well as Refugee & Immigration Services.
� December 5, 2003 – Ozone Open House 11:00 am to 1:00 pm.� December 5, 2003 – Ozone Task force meeting.� January 11, 2004 – Legal advertisement in “Roanoke Times” announcing January 20,
2004 Public Hearing”� January 18, 2004 – Follow-up legal advertisement in “Roanoke Times” announcing
January 20, 2004Public Hearing”
� January 19, 2004 –Presentation toRegional Chamber ofCommerceconcerning OzoneEAP.
� January 20, 2004 –Ozone EAP DraftPublic Hearing.
� January 21, 2004 –Interview with WVTFPublic Radio forbroadcast.
� January 22, 2004 –Interview with News7 (CBS) for 5:00 p.m.and 6:00 p.m. news.
� January 20, 2004 – EAP formally adopted by resolution by the Town of Vinton.� January 27, 2004 – EAP formally adopted by resolution by Roanoke County.� January 29, 2004 – EAP formally adopted by resolution by the City of Salem� January 20, 2004 – EAP formally adopted by resolution by the Town of Vinton.� February 17, 2004 – EAP formally adopted by resolution by the City of Roanoke.� February 24, 2004 – EAP formally adopted by resolution by the Botetourt County.� February 27, 2004 - Ozone Task force meeting to discuss modeling progress and
results.
3. EMISSION REDUCTION STRATEGIES
This section describes the local control measures that have been adopted and included in thefinal local Early Action Plan. These measures, when combined with control strategies at thestate and federal levels are meant to significantly reduce ozone precursor emissions and bringthe Roanoke Valley area into compliance with the 8-hour ozone standard.
A. Local Control Measures
Described below is a summary of the local control strategies in the final Early Action Plan.These control measures are grouped according to the categories and subcommitteesestablished by the Taskforce to evaluate these measures. A detailed description all these
13
Roanoke Clean Air Plan
potential control measures and projected implementation dates is presented in the localEarly Action Plan document.
Heavy Duty Diesel and Diesel Equipment Strategies
#1 – Reduction of locomotive idling and resulting emissions. Through a local voluntaryagreement, the Norfolk Southern Railroad Company will implement an internal policy to limitlocomotive idling at its facilities/yards in the City of Roanoke. This measure will reduceemissions of both NOX and fine particulate matter (PM) and will be in addition to emissionreductions from federal locomotive controls. A detailed estimate of these reductions is currentlyunder development. This measure was not included in the estimate of EAP emissionsreductions or in the air quality modeling exercise.
#2 – Limitation of idling times for local school bus fleets. This measure will involve theexpansion of existing school bus idling restrictions to the entire EAP area. An initial estimate ofreductions expected from this measure is 0.7 tons/year of NOX and an undetermined amount ofPM.
#3 – Retrofit control technology for 100 Roanoke County school buses. This measure willinvolve the installation of oxidation catalysts on 100 school buses. An initial estimate of thereductions expected from this measure is 0.3 tons/year of VOCs, 0.07 tons/year of PM, and 1.2tons/year of Carbon Monoxide (CO). It is likely that the City of Roanoke will also participate inthis program which will increase the reduction estimate.
#4 – Purchase and use of bio-diesel compatible solid waste trucks by the City of Roanoke. Thismeasure will involve the conversion of five new garbage trucks to use bio-diesel fuels. An initialestimate of the reductions expected from this measure is approximately 250 kilograms/year ofNOX and 8 kilograms/year of PM.
#5 – Purchase and use of ethanol compatible alternative fuel vehicles by the City of Roanoke.This measure will involve the purchase and use of up to 26 alternatively fueled vehicles. Theestimate of reduction from this measure will be developed once the details are determined.
#6 – Purchase of bio-diesel ready trucks by the City of Roanoke. This measure involves theprior and future purchase and use of waste trucks utilizing bio-diesel fuels. The estimate ofreduction from this measure will developed once the details are determined.
#7 – Purchase of hybrid vehicles by the City of Roanoke. This measure will involve thepurchase and use of up to four hybrid vehicles. The estimate of reduction will depend on thenumber of vehicles purchased and will be developed once this is determined.
#8 – Purchase of more efficient, low-emission, or alternative fuel vehicles by Roanoke County.A plan is currently being developed by the County for these purchases, and the reductionsanticipated will be calculated once this plan is completed and approved. #10 – Educational and training program of vehicle use by Roanoke County. The County hasimplemented an educational program on “effective environmental driving”. Reductions will beestimated based on observed fuel use reductions achieved after the completion of the training.

14
Roanoke Clean Air Plan
Air Quality Action Day, Public Education, and Stationary Source Strategies
The center piece of the proposed local control plan will be a comprehensive air quality (ozone)action day program which will require restrictions on ozone precursor pollutant producingactivities by state/local governments and encourage voluntary restrictions of similar activities onlocal businesses and the public. The DEQ already issues local forecast of ozone levels for theRoanoke area during the typical ozone season. An enhanced forecasting tool for the Roanokearea is currently under development and will be used as part of this action day program.Another key component of this program will be an ongoing public awareness and educationprogram to notify and inform the public on action they can take to reduce their individual impacton the area’s air quality. To facilitate this program, regional and local air quality coordinators willbe assigned to implement and coordinate the efforts involved. The main components of the airquality action day program, along with several longer-term support activities are as follows:
#11 – Air quality action day program (hybrid approach). This program will consist of two mainefforts. First, local governments have made commitments to limit or ban certain ozoneprecursor forming activities during predicted high ozone days. These activities will includelandscaping, pesticide application, refueling vehicles, and use of other solvent based products.The State Department of Transportation, which performs many of the same activities in the localarea, has also made this commitment. Secondly, voluntary restrictions on these same activitieswill be requested of local business and the general public during potential high ozone days. Atthe same time businesses and the public would be encouraged to make alternative commuterchoices such as car or vanpools, public transit, telecommuting, and trip-chaining. As acontingency measure, if ozone exceedances continue or a shortfall in emission reductions isidentified after plan implementation, the area will reevaluate and determine if additionalmandatory restrictions are warranted.
#12 – Early morning or late evening refueling of vehicles. This measure will also have amandatory and voluntary component. Local governments and state agencies will restrict vehiclerefueling during high ozone days to the evening. At the same time, local gasoline distributorswill be encouraged to provide incentives to the public to refuel early or late in the day duringhigh ozone days.
#13 – Promotion of alternative fuel vehicles. As part of the public awareness and educationprogram, the environmental and economic benefits of alternative fuel vehicles will be identifiedas encouragement to purchase these vehicles.
#14 – Media and public relations concerning air quality action days. A comprehensive and year-round media and public relations program will be implemented and coordinated by a regional airquality and ride-sharing coordinator and assisted by local coordinators.
#15 – Public transit incentives (transit passes) for college students and local employers. Thiswill involve the purchase of at least 300 transit passes to be distributed to students andemployers for use during high ozone days or year-round.

15
Roanoke Clean Air Plan
#16 – Bicycle infrastructure and amenities. This program will encourage bicycle use during highozone days and encourage the expansion of bicycle related infrastructure.
#17 – School (K-12 and adult education) based public education. This will involve expansion ofan ongoing educational program to identify air quality issues and individual action that can betaken to reduce ozone precursor emissions at area primary and secondary schools.
#18 – Tree canopy/ urban forestry. This will involve an area-wide comprehensive tree- plantingprogram with the goal of reducing concentrations of certain pollutants including ozone and NOX .
#19 – Roanoke to Blacksburg public transit. Establishment of a bus route from Roanoke toBlacksburg (where Virginia Tech is located), and point in between. This will reduce vehicle tripswithin the compact area and produce a 0.9 ton/year reduction of NOX and 2 ton/year reductionof VOC.
Although it is very difficult to estimate ozone precursor emission reduction that will be achievedfrom these individual actions, it is not unreasonable to assume that all these actions combinedwill have the desired impact of reducing emissions to some extent. Through the evaluation ofthese types of programs in other areas, a general range of emission reductions that can beexpected from the combination of these types of voluntary measures of 3% from affectedactivities and emissions. Therefore, an initial estimate of a 3% reduction in ozone precursoremissions from these activities in the Roanoke area has been used to estimate the reductionsfrom the combination of these measures during predicted high ozone days. For those activitiesthat have a state/local mandatory component, a 5% reduction estimate has been used for thepurpose of determining emissions reductions. In total, this equates to a daily reduction of 1ton/day of VOC and 1.5 tons/day of NOX.
Lawn and Garden Equipment Strategies
#20 – Replacement of gasoline golf carts with electric carts. This measure will involve obtainingcommitments from up to four local golf courses to replace some or all of their golf carts withelectric carts. Replacement of 100 gas carts with electric carts would produce a VOC reductionof 25 tons over three years.
#21 – Gasoline powered lawnmower buyback program. This will involve providing incentives forthe public to trade in gasoline powered lawnmowers for zero emissions equipment (electric ormanual).
#22 & #23 – Restrictions on the use of lawn and garden equipment. This would be another two-part control measure with mandatory restrictions the use of gasoline powered lawn and gardenequipment for state/local governments and voluntary restrictions on local businesses and thepublic, during predicted high ozone days. Assuming a 5% percent reduction in lawn & gardenemissions from this measure, VOC emissions would be reduced by 0.2 tons/day.
#24 – Open burning bans/restrictions. Several jurisdictions have adopted local rules restrictingor prohibiting open burning. The other EAP jurisdictions will ban or restrict open burning during
16
Roanoke Clean Air Plan
predicted high ozone days. This will reduce area emissions by 0.56 tons/day of VOC, and 0.24tons/day of NOX.
B. State & Federal Control Measures
In addition to the local control measures identified in the preceding discussion, there are severalstate and federal actions that have or will produce substantial ozone precursor emissionreductions both inside and outside of the Roanoke Valley area. These reductions are aimed atreducing local emissions and the movement (transport) of pollution into the area. Thesemeasures, when combined with the local control program, are expected to lower area ozoneconcentrations to the level at or below the ozone standard.
At the state level, several significant actions have been taken. First, in response to EPA’s callfor the reduction of NOX emissions from large combustion sources (i.e., the NOX SIP Call), thestate has adopted and will implement a program to significantly reduce emissions of NOX aspart of a regional program to reduce ozone transport. This program alone is predicted to reduceozone forming NOX emissions by up to 30,000 tons per ozone season in Virginia. Secondly, thestate opted into the National Low Emission Vehicle program that began to require less pollutingvehicles in the state, beginning in 1999. Also in 1999, Stage I vapor recovery systems wererequired at gasoline stations in the Roanoke area which has reduced gas station VOCemissions by 1.7 tons/day. To further address local emissions, the state has recently adoptedReasonably Available Control Technology (RACT) controls for industries in the area, to furtherreduce the local contribution to ozone formation. The emission reduction expected from RACTin the area is 1.1 tons of VOC and 1.5 tons/day of NOX. Compliance with the RACT rule will berequired by the end of 2005.
On the federal level, numerous EPA programs have been or will be implemented to reduceozone pollution. These programs cover all the major categories of ozone generating pollutantsand are designed to assist many areas to come into compliance with the federal ozonestandard. A brief description of these measures is provided below:
Stationary & Area Source Controls: In addition NOX SIP Call program, the EPA hasdeveloped a number of control programs to address smaller “area” sources of emissions thatare significant contributors to ozone formation. These programs reduce emissions from suchsources as industrial/architectural paints, vehicle paints, metal cleaning products, and selectedconsumer products.
Motor Vehicle Controls: The EPA continues to make significant progress in reducing motorvehicle emissions. Several federal programs have established more stringent engine andassociated vehicle standards on cars, sport utility vehicles, and large trucks. These programscombined are expected to produce progressively larger emission reductions over the nexttwenty years as new vehicles replace older ones.
Non-Road Vehicle & Equipment Standards: The category of “non-road” sources that coverseverything from lawn & garden equipment to aircraft, has become a significant source of airpollutant emissions. In response, EPA has adopted a series of control measures to addressthese sources. These programs include engine emission standards for lawn & gardenequipment, construction equipment, boat engines, and locomotives.

17
Roanoke Clean Air Plan
All these measure have been developed to address both the creation of ozone producingemissions in the local area, as well as reducing the movement of ozone into the area as acomprehensive approach to reducing ozone levels.
4. AIR QUALITY TECHNICAL SUPPORT ACTIVITIES
A. Background
Air Quality analyses are used to simulate the combination of meteorology, emissions, andatmospheric chemistry that promote ozone formation and higher ambient concentrations in agiven area. Once a representative scenario, or episode conducive to ozone formation, basedon an actual observed ozone event is selected and validated, various emission reductionstrategies can be tested to predict whether they would succeed in reducing ozone and attainingthe ozone standard. The major steps involved in photochemical modeling is as follows:
� Selection of type and geographic scale of photochemical model� Selection of representative ozone episode(s)� Base case episode modeling and validation� Future year projection and attainment demonstration modeling
B. Model and Domain Selection
Due to the regional nature of ground level formation and transport that is prevalent in theEastern United States, combined with the reasonable assumption the early action area isimpacted by ozone transport, a regional photochemical modeling exercise has been selected forthis project. This selection will allow for the evaluation of the impact of transport on the studyarea, as well as the impact of regional and national control strategies in reducing ozonetransport into these areas.
The initial photochemical model selected for this purpose in EPA’s MODELS3/CMAQ model thatis EPA’s latest modeling platform for such analyses. The meteorological inputs required to runthe model will be developed using the MM5 meteorology model, and the emissions inputs willbe developed using the SMOKE emissions preprocessor model. The purpose of these modeldata input preprocessors is to temporally and spatially allocate these inputs to a grid systemused by the photochemical model to recreate the atmospheric interaction of all these factors inpromoting ozone formation.
Due the need to model a larger region for ozone transport assessment, a regional domain thatcovers a large portion of the Mid-Atlantic States has been chosen to support the early actionmodeling. This domain has been used in previous analyses by the State to assess transportand the regional effect of emission reductions. The domain will consist of a series ofdescending grid cells from 36 kilometers (km) at the edges of the domain, to 12 km in the Mid-Atlantic area. A local 4 km exercise for the project area may be added later to provide furtherresolution. In this way the resolution of the model and modeling results will be the highest inand around the early action planning areas. This modeling domain is shown in Figure 3.

18
Roanoke Clean Air Plan
Figure 3: Early Action Modeling Domain of 36 km & 12 km Resolution
C. Episode Selection
One of the key aspects of a modeling analysis of a particular area and air pollution problem is toselect one or more representative episodes to model. The selection process should reflect oneor more of the prevailing meteorological and emissions conditions that produce higher levels ofozone in the subject area. An additional consideration for this project is that EPA guidancerequires that the baseline emission inventory and subsequent episode(s) selected for an EAPare no older than 1999. Finally, since three states are developing plans in the same generalarea, an episode common to all three was selected.
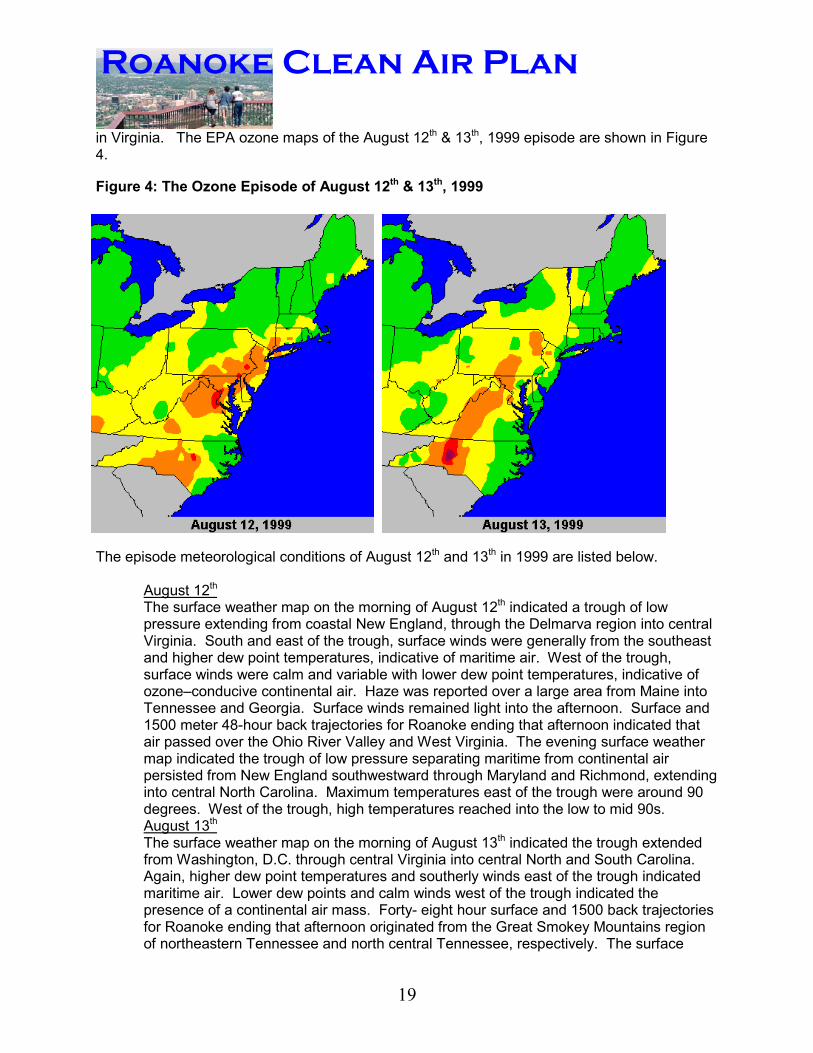
The result of this process produced an ozone episode that occurred on August 12th and 13th in1999. This episode was selected mainly because exceedences of the ozone standard wereobserved at all the area monitors involved in this effort (including Roanoke), during this period.This episode also involved the transport of ozone into Virginia from both the West andSouthwest. To adequately simulate the events leading up and following this episode, a 10 dayperiod from August 8th to the 18th will be modeled. After the completion of this modelingexercise, an additional episode, probably in 2002, will be selected and modeled to retest andconfirm the results of the initial modeling and to begin the analysis of other nonattainment areas
19
Roanoke Clean Air Plan
in Virginia. The EPA ozone maps of the August 12th & 13th, 1999 episode are shown in Figure4.
Figure 4: The Ozone Episode of August 12th & 13th, 1999
The episode meteorological conditions of August 12th and 13th in 1999 are listed below.
August 12th
The surface weather map on the morning of August 12th indicated a trough of lowpressure extending from coastal New England, through the Delmarva region into centralVirginia. South and east of the trough, surface winds were generally from the southeastand higher dew point temperatures, indicative of maritime air. West of the trough,surface winds were calm and variable with lower dew point temperatures, indicative ofozone–conducive continental air. Haze was reported over a large area from Maine intoTennessee and Georgia. Surface winds remained light into the afternoon. Surface and1500 meter 48-hour back trajectories for Roanoke ending that afternoon indicated thatair passed over the Ohio River Valley and West Virginia. The evening surface weathermap indicated the trough of low pressure separating maritime from continental airpersisted from New England southwestward through Maryland and Richmond, extendinginto central North Carolina. Maximum temperatures east of the trough were around 90degrees. West of the trough, high temperatures reached into the low to mid 90s.August 13th
The surface weather map on the morning of August 13th indicated the trough extendedfrom Washington, D.C. through central Virginia into central North and South Carolina.Again, higher dew point temperatures and southerly winds east of the trough indicatedmaritime air. Lower dew points and calm winds west of the trough indicated thepresence of a continental air mass. Forty- eight hour surface and 1500 back trajectoriesfor Roanoke ending that afternoon originated from the Great Smokey Mountains regionof northeastern Tennessee and north central Tennessee, respectively. The surface

20
Roanoke Clean Air Plan
trough separating the maritime air from the continental air persisted into the evening.High temperatures reached the mid-to-upper 90s in the region.
D. Emissions Inventory and Control Measures Summary
This section presents the various air pollutant emissions inventories developed to support theRoanoke Valley Ozone Early Action Plan. Typical daily inventories during the ozone season,expressed in tons per day, have been developed for this purpose. These inventories includebaseline, interim, and future projection years to determine historic, current, and future emissionslevels as part of the air quality plan development process. The major source categories used topresent this inventory data are:
� Stationary Point Sources - Large utility and industrial facilities with significant individualemissions.
� Mobile Sources - Motor vehicles operated on public roads such as interstates, freeways,and local roads.
� Area Sources - Small individual sources of emissions such as gasoline distribution andmarketing, solvent usage, and others.
� Non-road Mobile Sources - Motor vehicles and equipment such as lawn and garden tools,construction equipment, locomotives, and aircraft.
The first inventory developed for this process was the baseline emissions inventory. 1999 wasselected for this purpose, since the ozone episode being modeled to support the EAP processoccurred during the summer of 1999. This inventory serves as a baseline estimate of areaemissions during the time when the modeled episode occurred. This inventory reflects actualemissions in the area during this year.
The second inventory to be developed was the interim (current) year emissions inventory. 2002was selected for this purpose because this is the latest year for which a comprehensiveinventory for all sources has been developed. This inventory serves to represent existingemissions levels in the local area and can also be compared to the baseline inventory todetermine emissions trends. This inventory also reflects actual emissions in the area during thisyear.
The last two inventories developed for this process are predicted future year emissionsinventories that represent base case (uncontrolled) and control case (controlled) emissionsscenarios. The year selected for this purpose was 2007, which is the year by which the areamust come into compliance with the ozone standard. The future base case inventoryrepresents uncontrolled emissions projected with appropriate growth factors. The exception tothis is the mobile source inventory that contains some reductions associated with previousfederal/state motor vehicle controls. The future control case inventory represents theapplication of all control expected to be implemented in the local area by the attainment year.This includes the local impact of additional federal/state control measures, and the local controlmeasures selected as part of the EAP process. A summary table and bar graph of theseemissions inventories is presented in Figure 5. The various emissions inventories developed aspart of EAP process are presented on Pages 21 to 29. A table summarizing all emissions

21
Roanoke Clean Air Plan
control measures and predicted reductions from 2007 uncontrolled levels is presented on Page30.
Figure 5: Roanoke Valley EAP Emissions Inventory Summary
Source Category1999
(Baseline)2002
(Interim)2007
(Base Case)2007
(Control Case)Volatile Organic Compound (VOC) Emissions in tons/day
Point Sources 4.551 3.518 3.927 3.927Area Sources 18.845 19.360 20.044 15.300Non-road Sources 5.683 5.726 5.803 3.804Mobile Sources 16.770 16.188 11.732 10.489
Totals: 45.849 44.792 41.506 33.520Oxides of Nitrogen (NOX) Emissions in tons/day
Point Sources 9.312 7.231 7.876 6.343Area Sources 5.091 5.254 5.531 5.293Non-road Sources 7.807 8.049 8.480 6.285Mobile Sources 30.358 29.166 23.436 18.897
Totals: 52.568 49.700 45.323 36.818
0
10
20
30
40
50
60
Ton
s Per
Day
1999 2002 2007 (BC) 2007 (CC)Inventory year
VOCsNOx
-27% -30%

22
Roanoke Clean Air Plan
1999 Baseline Ozone Season Daily Emissions of Volatile Organic Compounds(VOC)
10%
37%
41%
12%
PointMobileAreaNonroad
Summary of the Roanoke Valley Baseline VOC Emissions Inventory for Calendar Year 1999
Major Source CategoriesEmissions(tons/day)
Major Stationary Point Sources28 individual facilities (Botetourt: 7, Roanoke Co.: 12, RoanokeCity: 5, Salem City: 4) - Description: Includes cementproduction, metal works, minerals production, gas terminals.
4.551 tpd
On-Road Mobile SourcesMotor Vehicles on Public Roads – Description: local andthrough traffic on the I-81 corridor. Large percentage of heavy-duty diesel trucks. Also, vehicle traffic on all other public roadsfrom major arterials to local roads.
16.770 tpd
Area SourcesUse of Solvent-based Products – Description: paints, cleaners,consumer products, & others.
11.229 tpd
Gasoline Distribution & Marketing – Description: Gasolinestorage & transfer operation at terminals and service stations
5.579 tpd
All Others – description: Open burning, landfills, & others 2.037 tpdNon-Road Mobile Sources
Non-road Equipment – Description: lawn & garden,construction, recreational vehicles.
5.490 tpd
All Others – Description: Locomotives, aircraft, boats 0.193 tpdTotal 45.849 tpd

23
Roanoke Clean Air Plan
1999 Baseline Ozone Season Daily Emissions of Oxides of Nitrogen (NOX)
18%
57%
10%
15%
PointMobileAreaNonroad
Summary of the Roanoke Valley Baseline NOX Emissions Inventory for Calendar Year 1999
Major Source Categories Emissions(tons/day)
Major Stationary Point Sources28 individual facilities (Botetourt: 7, Roanoke Co.: 12, RoanokeCity: 5, Salem City: 4) - Description: Includes cementproduction, metal works, minerals production, gas terminals.
9.312 tpd
On-Road Mobile SourcesMotor Vehicles on Public Roads - Description: local andthrough traffic on the I-81 corridor. Large percentage of heavy-duty diesel trucks. Also, vehicle traffic on all other public roadsfrom major arterials to local roads.
30.358 tpd
Area SourcesFuel Consumption – Description: Fuel consumption for heating,cooling, and other purposes in all sectors.
4.585 tpd
All Others – description: Open burning, landfills, & others 0.506 tpdNon-Road Mobile Sources
Non-road Equipment – Description: lawn & garden,construction, recreational vehicles.
5.450 tpd
All Others – Description: Locomotives, aircraft, boats. 2.357 tpdTotal 52.568 tpd

24
Roanoke Clean Air Plan
2002 Interim Ozone Season Daily Emissions of Volatile Organic Compounds(VOC)
8%
36%
43%
13%
PointMobileAreaNonroad
Summary of the Roanoke Valley Interim VOC Emissions Inventory for Calendar Year 2002
Major Source CategoriesEmissions(tons/day)
Major Stationary Point Sources28 individual facilities (Botetourt: 7, Roanoke Co.: 12, RoanokeCity: 5, Salem City: 4) - Description: Includes cementproduction, metal works, minerals production, gas terminals.
3.518 tpd
On-Road Mobile SourcesMotor Vehicles on Public Roads – Description: local andthrough traffic on the I-81 corridor. Large percentage of heavy-duty diesel trucks. Also, vehicle traffic on all other public roadsfrom major arterials to local roads.
16.188 tpd
Area SourcesUse of Solvent-based Products – Description: paints, cleaners,consumer products, & others.
11.426 tpd
Gasoline Distribution & Marketing – Description: Gasolinestorage & transfer operation at terminals and service stations
5.808 tpd
All Others – description: Open burning, landfills, & others 2.126 tpdNon-Road Mobile Sources
Non-road Equipment – Description: lawn & garden,construction, recreational vehicles.
5.524 tpd
All Others – Description: Locomotives, aircraft, boats 0.202 tpdTotal 44.792 tpd

25
Roanoke Clean Air Plan
2002 Baseline Ozone Season Daily Emissions of Oxides of Nitrogen (NOX)
15%
58%
11%
16%
PointMobileAreaNonroad
Summary of the Roanoke Valley Interim NOX Emissions Inventory for Calendar Year 2002
Major Source CategoriesEmissions(tons/day)
Major Stationary Point Sources28 individual facilities (Botetourt: 7, Roanoke Co.: 12, RoanokeCity: 5, Salem City: 4) - Description: Includes cementproduction, metal works, minerals production, gas terminals.
7.231 tpd
On-Road Mobile SourcesMotor Vehicles on Public Roads - Description: local andthrough traffic on the I-81 corridor. Large percentage of heavy-duty diesel trucks. Also, vehicle traffic on all other public roadsfrom major arterials to local roads.
29.166 tpd
Area SourcesFuel Consumption – Description: Fuel consumption for heating,cooling, and other purposes in all sectors.
4.724 tpd
All Others – description: Open burning, landfills, & others 0.530 tpdNon-Road Mobile Sources
Non-road Equipment – Description: lawn & garden,construction, recreational vehicles.
5.553 tpd
All Others – Description: Locomotives, aircraft, boats. 2.496 tpdTotal 49.700 tpd
26
Roanoke Clean Air Plan
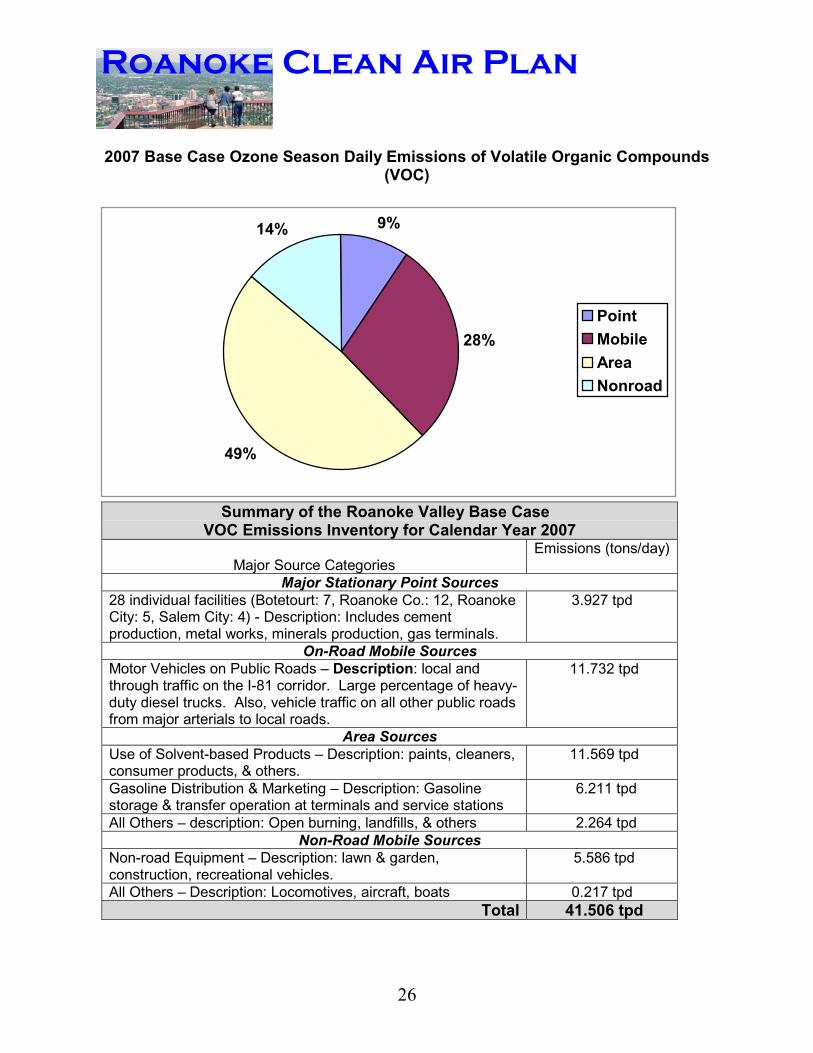
2007 Base Case Ozone Season Daily Emissions of Volatile Organic Compounds(VOC)
9%
28%
49%
14%
PointMobileAreaNonroad
Summary of the Roanoke Valley Base Case VOC Emissions Inventory for Calendar Year 2007
Major Source CategoriesEmissions (tons/day)
Major Stationary Point Sources28 individual facilities (Botetourt: 7, Roanoke Co.: 12, RoanokeCity: 5, Salem City: 4) - Description: Includes cementproduction, metal works, minerals production, gas terminals.
3.927 tpd
On-Road Mobile SourcesMotor Vehicles on Public Roads – Description: local andthrough traffic on the I-81 corridor. Large percentage of heavy-duty diesel trucks. Also, vehicle traffic on all other public roadsfrom major arterials to local roads.
11.732 tpd
Area SourcesUse of Solvent-based Products – Description: paints, cleaners,consumer products, & others.
11.569 tpd
Gasoline Distribution & Marketing – Description: Gasolinestorage & transfer operation at terminals and service stations
6.211 tpd
All Others – description: Open burning, landfills, & others 2.264 tpdNon-Road Mobile Sources
Non-road Equipment – Description: lawn & garden,construction, recreational vehicles.
5.586 tpd
All Others – Description: Locomotives, aircraft, boats 0.217 tpdTotal 41.506 tpd

27
Roanoke Clean Air Plan
2007 Base Case Ozone Season Daily Emissions of Oxides of Nitrogen (NOX)
17%
52%
12%
19%
PointMobileAreaNonroad
Summary of the Northern Shenandoah Valley Base Case NOX Emissions Inventory for Calendar Year 2007
Major Source CategoriesEmissions(tons/day)
Major Stationary Point Sources28 individual facilities (Botetourt: 7, Roanoke Co.: 12, RoanokeCity: 5, Salem City: 4) - Description: Includes cementproduction, metal works, minerals production, gas terminals.
7.876 tpd
On-Road Mobile SourcesMotor Vehicles on Public Roads - Description: local andthrough traffic on the I-81 corridor. Large percentage of heavy-duty diesel trucks. Also, vehicle traffic on all other public roadsfrom major arterials to local roads.
23.436 tpd
Area SourcesFuel Consumption – Description: Fuel consumption for heating,cooling, and other purposes in all sectors.
4.966 tpd
All Others – description: Open burning, landfills, & others 0.565 tpdNon-Road Mobile Sources
Non-road Equipment – Description: lawn & garden,construction, recreational vehicles.
5.733 tpd
All Others – Description: Locomotives, aircraft, boats 2.746 tpdTotal 45.323 tpd
28
Roanoke Clean Air Plan
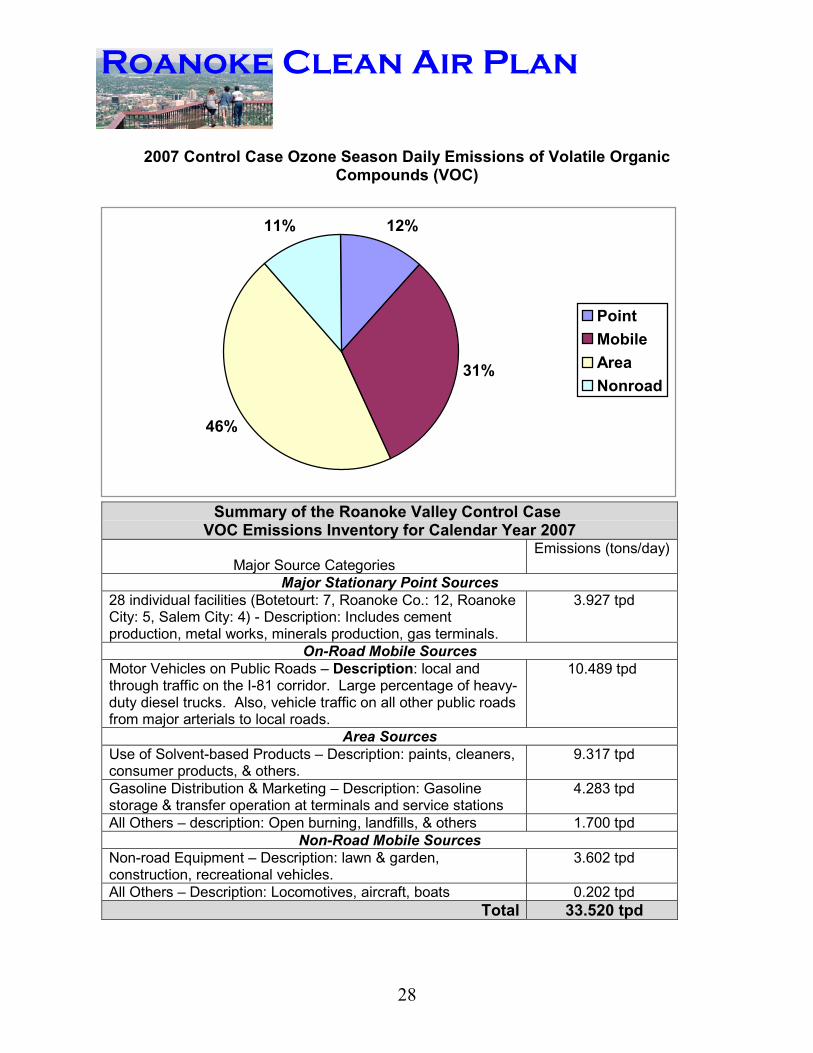
2007 Control Case Ozone Season Daily Emissions of Volatile OrganicCompounds (VOC)
12%
31%
46%
11%
PointMobileAreaNonroad
Summary of the Roanoke Valley Control Case VOC Emissions Inventory for Calendar Year 2007
Major Source CategoriesEmissions (tons/day)
Major Stationary Point Sources28 individual facilities (Botetourt: 7, Roanoke Co.: 12, RoanokeCity: 5, Salem City: 4) - Description: Includes cementproduction, metal works, minerals production, gas terminals.
3.927 tpd
On-Road Mobile SourcesMotor Vehicles on Public Roads – Description: local andthrough traffic on the I-81 corridor. Large percentage of heavy-duty diesel trucks. Also, vehicle traffic on all other public roadsfrom major arterials to local roads.
10.489 tpd
Area SourcesUse of Solvent-based Products – Description: paints, cleaners,consumer products, & others.
9.317 tpd
Gasoline Distribution & Marketing – Description: Gasolinestorage & transfer operation at terminals and service stations
4.283 tpd
All Others – description: Open burning, landfills, & others 1.700 tpdNon-Road Mobile Sources
Non-road Equipment – Description: lawn & garden,construction, recreational vehicles.
3.602 tpd
All Others – Description: Locomotives, aircraft, boats 0.202 tpdTotal 33.520 tpd

29
Roanoke Clean Air Plan
2007 Baseline Ozone Season Daily Emissions of Oxides of Nitrogen (NOX)
17%
52%
14%
17%
PointMobileAreaNonroad
Summary of the Roanoke Valley Control Case NOX Emissions Inventory for Calendar Year 2007
Major Source CategoriesEmissions (tons/day)
Major Stationary Point Sources28 individual facilities (Botetourt: 7, Roanoke Co.: 12, RoanokeCity: 5, Salem City: 4) - Description: Includes cementproduction, metal works, minerals production, gas terminals.
6.343 tpd
On-Road Mobile SourcesMotor Vehicles on Public Roads - Description: local andthrough traffic on the I-81 corridor. Large percentage of heavy-duty diesel trucks. Also, vehicle traffic on all other public roadsfrom major arterials to local roads.
18.897 tpd
Area SourcesFuel Consumption – Description: Fuel consumption for heating,cooling, and other purposes in all sectors.
4.966 tpd
All Others – description: Open burning, landfills, & others 0.327 tpdNon-Road Mobile Sources
Non-road Equipment – Description: lawn & garden,construction, recreational vehicles.
4.650 tpd
All Others – Description: Locomotives, aircraft, boats 1.634 tpdTotal 36.818 tpd

30
Roanoke Clean Air Plan
Control Measures & Estimated Emissions Reductions(From Uncontrolled Levels in 2007)
Emissions Control Measures VOC (tpd) NOX (tpd) State/Federal Area Source Controls
Stage I Vapor Recovery 1.756 0.000Architectural & Industrial Paints 0.372 0.000Consumer Products 0.178 0.000Metal Cleaning Solvents 0.163 0.000Motor Vehicle Refinishing 0.158 0.000Cutback Asphalt 0.005 0.000
Subtotals: 2.632 0.000Federal Non-road Source Controls
Small Gasoline Engine Standards 1.851 0.112Diesel Engine Standards 0.000 0.951Locomotive Engine Standards 0.000 1.112Large Gasoline Engine Standards 0.015 0.004Recreational Engine Standards 0.015 0.000
Subtotals: 1.881 2.179Federal Mobile Source Controls
Previous Motor Vehicle Standards (from 1999 levels) 5.038 6.922Tier 2 Vehicle Standards 0.917 3.799Heavy Duty Diesel Standards 0.001 0.156
Subtotals: 5.956 10.877Local Area Early Action Plan Controls
Existing Source CTG RACT Controls * 1.098 1.533Ozone Action Days Program ** 0.918 0.611Open Burning Restrictions (Area) 0.564 0.238All Other Local Programs (All Sources) 0.001 0.001
Subtotals: 2.581 2.383TOTALS: 13.050 17.618
* Implemented by State Regulation** To be supported by State Ozone Forecasts
E. Base Case Modeling
A 1997 episode was originally selected to support the development of the early action plansince emissions and meteorological data were readily available and quality assured. However,subsequent to this decision, EPA EAP guidance required that inventories and episodes no olderthan 1999 had to be used in this effort. As a result, the episode described above as beenselected to support the air quality planning effort. However, this change in the modeling planand episode has resulted in a change to the modeling project schedule as well.

31
Roanoke Clean Air Plan
DEQ has obtained the necessary meteorological data for the 1999 episode and hassuccessfully completed the processing of the data through the MM5 meteorological model.Several MM5 runs were required to adequately simulate the relatively complex meteorologicalconditions that existed during the selected ozone episode as previously described. Figures 6and 7 provide selected results of the meteorological modeling used as input into the regional airquality model.
Figure 6: Meteorological Modeling – Selected Results for Temperature and Winds
Figure 7: Meteorological Modeling – Observed and Predicted Temperatures and Winds
Observed/Predicted Temperature
280285290295300305310
8/ 8 8/ 9 8/10 8/11 8/12 8/13 8/14 8/15 8/16 8/17
K
ObsTemp PrdTemp
Predicted/Observed Humidity
05
10152025
8/ 8 8/ 9 8/10 8/11 8/12 8/13 8/14 8/15 8/16 8/17
g/kg
ObsHum PrdHum

Roanoke Clean Air Plan
Emissions data for 1999 from all state in the modeling domain has also been obtained from theNEI. This emissions data has been supplemented with state specific data from Virginia andWest Virginia. The conversion of this data to SMOKE input files and the preprocessing of thisdata through the SMOKE emission model has also been completed. Several problems wereencountered during the processing of the emissions data that delayed the commencement ofbase case modeling efforts. The most difficult problem dealt with the EPA requirement that allEAC modeling efforts used MOBILE6-based emissions for mobile sources. To do this we hadto use the latest draft version of the SMOKE emissions preprocessor (Version 1.5). Numerousproblems were encountered in attempting to install and run the mobile emissions through thisversion of the emissions model. Ultimately, the DEQ contracted the developers of SMOKE(Carolina Environmental Program to solve these problems and process the emissions datathrough this latest version of the emissions preprocessor. With this external assistance, theemissions preprocessing step has also been completed.
Once all the preprocessing steps were completed, the regional photochemical modelingexercise was begun. After several runs using the CMAQ model were completed, it becameobvious that the performance of the model was not up to EPA standards using the selectedepisode. After internal consultations, it was decided to change photochemical models fromCMAQ to the Comprehensive Air Quality Model with Extensions (CAMx). The modelingplatform was thus changed to use this alternative air quality model. After several runs usingCAMx, base case modeling results were produced that meet or exceed EPA’s acceptancecriteria for model performance. The base case results of the validated CAMx model arepresented below in graphic form (Figure 8) showing the simulation of the ozone episode days ofAugust 12th and 13th, 1999. Also presented below are selected comparisons of observed andmodel predicted ozone concentrations at several area monitors (Figure 9).
Figure 8: CAMx Photochemical Model Results – Base Case Modeling
32

33
Roanoke Clean Air Plan
Figure 9: Air Quality Model Validation – Observed & Predicted Ozone Concentrations
In summary, the base case modeling has been completed for the selected ozone episode andthe performance evaluation of the model indicates that:
� The EPA performance goals established for air quality models have been met for bothepisode days.
� The model performance is acceptable for use in future and control case modeling.
F. Future Case Modeling
Once the base case modeling and associated performance evaluation and validation wascompleted, work began on the future base and control case modeling scenarios. In order to dothis, a future year modeling emissions inventory had to be developed to predict future ozoneprecursor emissions levels in the EAC areas and the overall modeling domain to account forboth anticipated growth in unregulated emissions sources and reduction in emissions fromsources subject to local, state, and federal control strategies. In developing these future yearinventories, the DEQ worked with neighboring EAC states to ensure the consistency of thesefuture estimates. Standard emissions projection and control techniques were used to developthe projected emissions inventories for this purpose.
First, the base case inventory was developed based on the assumption of emissions growthcoming from unregulated or uncontrolled source categories, along with controlled estimates forsource categories subject to State/Regional/National control strategies already promulgated forthe control of ozone precursor emissions that were not directly relating to the controls to beimplemented through the local EAP. The controls included in this base case inventory include
Monitoring Stations for Model Validation
Rockbridge
Roanoke
Frederick
Luray

34
Roanoke Clean Air Plan
most of those identified in Section 3 (C) of this document. The subsequent modeling conductedwith this inventory produced substantial reductions in predicted ozone concentrations in the
EAC areas and throughout the entire modeling domain. In fact, the base case controls arepredicted to be sufficient to bring both the Virginia EAC areas as well as the panhandleEAC areas in West Virginia and Maryland into compliance with the ozone standard.
The second future case inventory involved the addition of the local control strategies containedin the EAP to serve as the control case inventory for this project, as identified in Section 3 (A) ofthis document. The combination of all the controls at all applicable levels (local, state, federal)produced the results shown in Figure 10 below.
Figure 10: CAMx Photochemical Model Results – Control Case Modeling
The results of this modeling shows that most areas within the modeling domain would be at orbelow the 8-hour ozone standard in 2007 under this episode scenario as a result of thecontrol strategies to be implemented during this time period. Future ozone levels in theVirginia EAC areas are predicted to be in the 62 to 65 ppb range under these sameconditions. Specifically, the Roanoke Valley area is predicted to experience a 22%relative reduction in local ozone concentrations. It is also predicted that the base casedesign value for the area of 90 parts per billion will be reduced to 70 parts per billion in2007. Therefore, the modeling exercise indicates that the desired result of reducing ozoneconcentrations to levels below the 8-hour ozone standard will be achieved by theimplementation of the controls included in this EAP, and combined with the control strategiesbeing implemented on the state and federal levels. A full description of the EAC modelingproject is contained in the “Virginia, West Virginia, and Maryland Early Action Compact

35
Roanoke Clean Air Plan
Modeling Report and Ozone Attainment Demonstration” which has been submitted with thisplan.
5. MAINTENANCE FOR GROWTH
A. Background
Beyond the attainment demonstration provided above, the Early Action Compact also calls for amechanism and demonstration that the area remains in attainment of the ozone standard after 2007. Although this demonstration of maintenance is not yet completed, the followingsupporting information is provided to support the assumption that the area will remain inattainment for a substantial time after the predicted attainment date of 2007.
B. Contingency Measures
As part of the local EAP, a mechanism is in place to monitor the progress towards implementingthe local controls and assessing their effectiveness. If it is found that progress is not beingmade or the level of emissions reductions expected is not achieved, the Task Force willreevaluate the existing strategies to enhance their effectiveness, or recommend the adoption ofadditional control measures. This mechanism represents the contingency measure portion ofthe local EAP. One or more enhanced or new strategies could be implemented after 2005, inresponse to continuing exceedances of the ozone standard or a shortfall in anticipated emissionreductions from the initial EAP. These additional strategies could also be implemented at anytime after 2007 if the situations warranted or called for additional local emission reductions inresponse to worsening air quality or unexpected increases in local emissions. These measureswould require more lead-time for implementation as well as additional work with an expandedgroup of stakeholders.
C. Other Air Quality Modeling Exercises
Although specific modeling of an additional future maintenance year has not been performed aspart of this project, other recent modeling exercises performed by the EPA to support regional ornational program provide some indication that many areas of the Country will attain the ozonestandard in the near term. These same modeling exercises also indicate that most of theseareas will remain in attainment for at least ten years after their projected attainment date. Thelatest of these EPA modeling projects, used to support the national “Clear Skies” legislation,indicates that most areas in Virginia will attain the ozone standard by 2010 and will remain inattainment at least out to 2020, even without the implementation of the Clear Skies program.
In addition, this modeling shows that predicted ozone concentrations will be trending downwardduring this period. The specific prediction of this modeling for the Roanoke area is thatconcentrations in 2010 will be at 67 parts per billion, and then will reduce down to 59 parts perbillion in 2020.