Embed Size (px)
Citation preview

OVERWINTERING BRAZILIAN FREE-TAILED BATS (TADARIDA BRASILIENSIS)
IN CENTRAL TEXAS: BASELINE POPULATION ESTIMATES AND
MICROCLIMATE HABITAT ANALYSIS
THESIS
Presented to the Graduate Council of
Texas State University-San Marcos
in Partial Fulfillment
of the Requirements
for the Degree
Master of SCIENCE
by
Sara P. Weaver, B.S.
San Marcos, Texas
August 2012

OVERWINTERING BRAZILIAN FREE-TAILED BATS (TADARIDA BRASILIENSIS)
IN CENTRAL TEXAS: BASELINE POPULATION ESTIMATES AND
MICROCLIMATE HABITAT ANALYSIS
Committee Members Approved:
____________________________
Thomas R. Simpson, Chair
____________________________
John T. Baccus
____________________________
Floyd W. Weckerly
Approved:
______________________________
J. Michael Willoughby
Dean of the Graduate College

COPYRIGHT
by
Sara P. Weaver
2012

FAIR USE AND AUTHOR’S PERMISSION STATEMENT
Fair Use
This work is protected by the Copyright Laws of the United States (Public Law 94-533,
section 107). Consistent with fair use as defined in the Copyright Laws, brief quotations
from this material are allowed with proper acknowledgement. Use of this material for
financial gain without the author’s express written permission is not allowed.
Duplication Permission
As the copyright holder of this work I, Sara P. Weaver, refuse permission to copy in
excess of the “Fair Use” exemption without my written permission.

v
ACKNOWLEDGMENTS
First, I would like to thank Dr. Simpson, my advisor, for the many years of
learning and guidance he has provided me. This thesis and the knowledge and skills I
have gained would not have been possible without him. I would also like to thank my
other committee members, Dr. Baccus and Dr. Weckerly, for their wealth of knowledge
and for answering the many questions I had throughout my project. Thank you to Dr.
Shwartz’s lab for supplying field equipment that made my data collection possible.
Thank you to Fran Hutchins, Jim Kennedy, and Mylea Bayless with Bat Conservation
International who supplied equipment, field assistance, helped with my experimental
design, and conducting my population estimates. I would like to include a special thank
you to the land owners that provided me access to my sites. I also want to thank my
friends and lab mates for all the help in the field and for the priceless advice I was given
during the course of my degree. Finally, I want to thank my family, namely my husband
and children for allowing me to complete my thesis. The countless trips into the field and
hours away from home were made so much easier by your support and love. I could not
have done any of this without you. And to my aunt Judy and my brother Robert who
inspired me to pursue a degree in Wildlife Ecology. I love you.
This manuscript was submitted on July 24, 2012

vi
TABLE OF CONTENTS
Page
ACKNOWLEDGMENTS ...................................................................................................v
LIST OF TABLES ............................................................................................................ vii
LIST OF FIGURES ......................................................................................................... viii
ABSTRACT ....................................................................................................................... ix
CHAPTER
I. INTRODUCTION ................................................................................................1
II. MATERIALS AND METHODS ........................................................................4
III. RESULTS ........................................................................................................10
VI. DISCUSSION ..................................................................................................20
LITERATURE CITED ......................................................................................................27

vii
LIST OF TABLES
Table Page
1. Population estimates and 95% confidence intervals for Brazilian free-tailed bats at 4
overwintering roosts in December 2010 and 2011. ...........................................................12
2. Temperature (°C) and absolute humidity (g/m3) summaries of all roosts from
December 2010 through January 2011. .............................................................................13
3. Temperature (°C) and absolute humidity (g/m3) summaries of all roosts from
December 2011 through January 2012. ..........................................................................13
4. Linear mixed effect model (LME) results between mean weekly temperatures (°C) at
roosts with and without overwintering Brazilian free-tailed bats from December-January
of 2010-2011 and 2011-2012. ............................................................................................14
5. Linear mixed effect model (LME) results on mean weekly absolute humidity (g/m3) at
roosts with and without overwintering Brazilian free-tailed bats from December-January
of 2010-2011 and 2011-2012. ............................................................................................14
viii
LIST OF FIGURES
Figure Page
1. Locations of six Brazilian free-tailed bat roosts (Bracken Bat Cave, D’Hanis Bridge,
Old Tunnel State Park, Chiroptorium, Davis Blowout Cave, and James River Bat Cave) I
studied in winter 2010-2011 and 2011-2012. ......................................................................9
2. Average weekly patterns of internal versus external temperature (°C) (A) 2010-2011
and (B) 2011-2012 and absolute humidity (g/m3) (C) 2010-2011 and (D) 2011-2012 at
James River Cave ...............................................................................................................15
3. Average weekly patterns of internal versus external temperature (°C) (A) 2010-2011
and (B) 2011-2012 and absolute humidity (g/m3) (C) 2010-2011 and (D) 2011-2012 at
Davis Blowout Cave ..........................................................................................................16
4. Average weekly patterns of internal versus external temperature (°C) (A) 2010-2011
and (B) 2011-2012 and absolute humidity (g/m3) (C) 2010-2011 and (D) 2011-2012 at
Old Tunnel State Park ........................................................................................................17
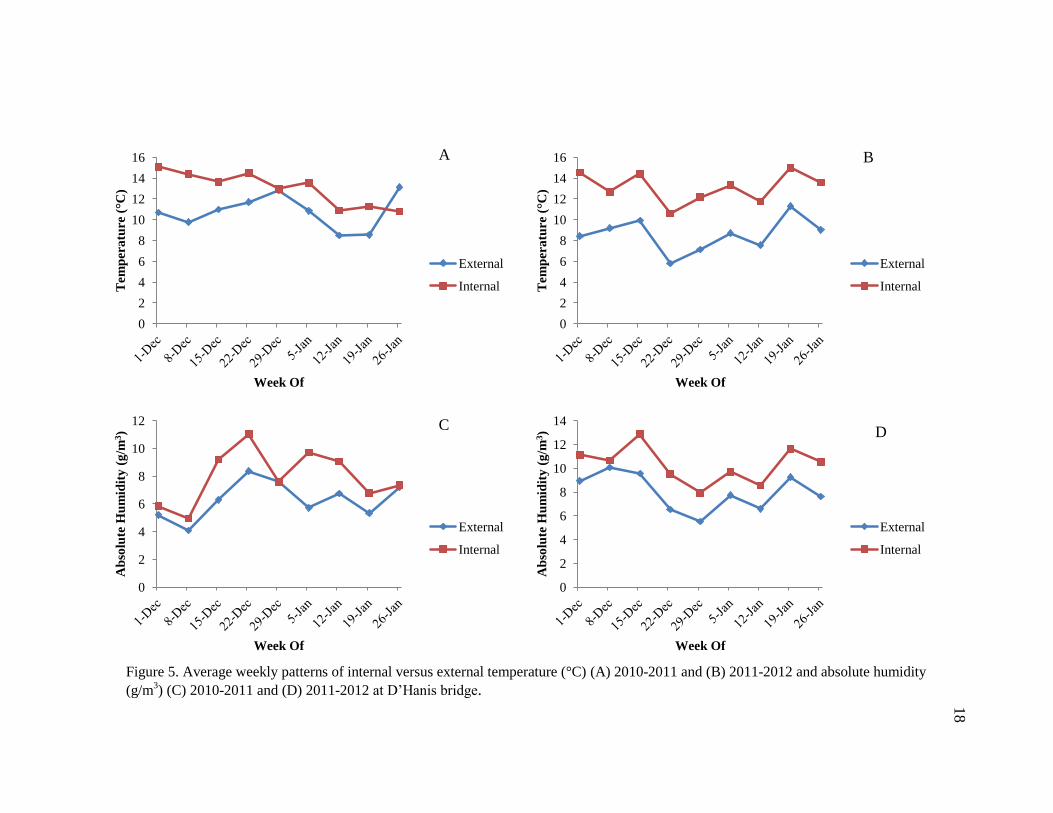
5. Average weekly patterns of internal versus external temperature (°C) (A) 2010-2011
and (B) 2011-2012 and absolute humidity (g/m3) (C) 2010-2011 and (D) 2011-2012 at
D’Hanis bridge ...................................................................................................................18
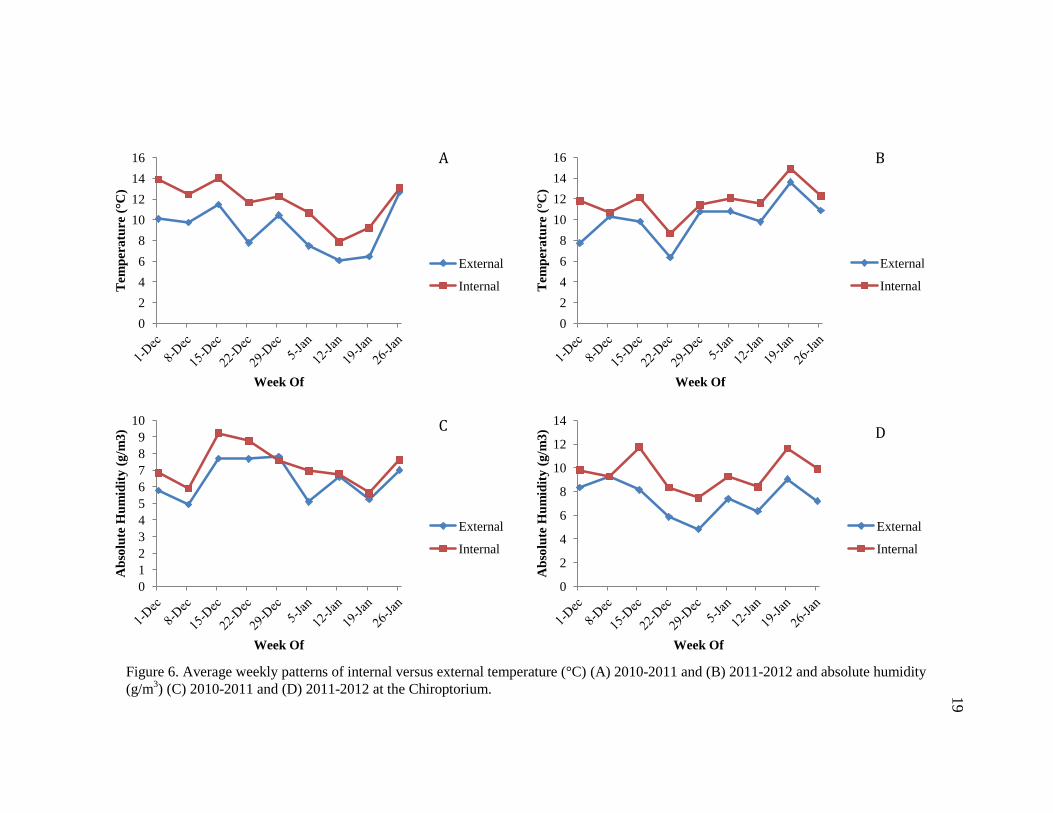
6. Average weekly patterns of internal versus external temperature (°C) (A) 2010-2011
and (B) 2011-2012, and absolute humidity (g/m3) (C) 2010-2011 and (D) 2011-2012 at
the Chiroptorium ................................................................................................................19

ix
ABSTRACT
OVERWINTERING BRAZILIAN FREE-TAILED BATS (TADARIDA BRASILIENSIS)
IN CENTRAL TEXAS: BASELINE POPULATION ESTIMATES AND
MICROCLIMATE HABITAT ANALYSIS
by
Sara P. Weaver, B.S.
Texas State University-San Marcos
August 2012
SUPERVISING PROFESSOR: THOMAS R. SIMPSON
Colonies of Brazilian free-tailed bats (Tadarida brasiliensis) roost in central
Texas from March through November. These bats have historically migrated south in late
fall leaving summer roosts unoccupied during winter. Recently, new overwintering
populations have been discovered in central Texas. The objectives of my study were to

x
confirm the presence or absence of overwintering free-tailed bat colonies at six summer
roosts, conduct baseline population estimates, and evaluate temperature and absolute
humidity of habitats with and without overwintering bats during winters of 2010-2011
and 2011-2012. I placed 3 Hygrochron iButton data loggers within each roost and 1
outside to monitor temperature and humidity hourly. I entered each roost once a month
(November-February) to determine bat presence. I recorded digital images with a laser
caliper at 2 roosts with overwintering Brazilian free-tailed bat populations. I analyzed and
estimated population sizes using ImageJ software. I estimated population size at a bridge
using crevice measurements combined with previously established roosting densities for
bridges. I estimated the population at a bat house roost containing Brazilian free-tailed
bats using the percentage of space occupied based on dimensions and previously
established roosting densities for bat houses. Two roosts were vacant and treated as
control sites. My results indicated a difference in temperature (P = 0.086) but not
absolute humidity (P = 0.813) between unoccupied and occupied overwintering roosts
(α = 0.10). The populations increased at all occupied roosts from 2010 to 2011. I also
report the northern-most occurrence of overwintering Brazilian free-tailed bats known in
Texas. Overall, these data may lead to a greater understanding of the natural history of
Brazilian free-tailed bats and identification and protection of potential overwintering sites
in central Texas.

1
CHAPTER I
INTRODUCTION
The Brazilian free-tailed bat (Tadarida brasiliensis; hereafter free-tailed bat) is
one of the most abundant, wide ranging mammalian species in North America
(McCracken 2003). Free-tailed bats range throughout Mexico to Oregon and from
California to North Carolina (Wilkins 1989). These bats are of great economic
importance throughout the region because major crop pests are their main food sources,
and they perform a vital role in ecosystems as insectivores (Cleveland et al. 2006; Lee
and McCracken 2002). Cleveland et al. (2006) estimated that free-tailed bats provided
$741,000/year in economic assistance in pest control in south-central Texas and models
predicted they reduced cotton crop damages by 43%-50% (Federico et al. 2008).
The estimated summer free-tailed bat population in central Texas was historically
hundreds of millions (Constantine 1967; Davis et al. 1962; Wahl 1993). Betke et al.
(2008) suggested a population decline due either to earlier inaccurate surveying methods
or an overall natural decrease in population size. Free-tailed bats inhabited caves, bridges,
and abandoned mines and tunnels in central Texas from March through October or
November. These populations have long been considered migratory, traveling to more
southern latitudes during winter (Glass 1958; Villa 1956; Villa and Cockrum 1962).
Small populations of free-tailed bats have been documented as overwintering in Texas for
many years (Glass 1982; Keeley and Keeley 2004; Krutzsch and Sulkin 1958; Spenrath
and LaVal 1974; Tuttle 2003). Recent observations indicated overwintering populations

2
had established at new roosts in central Texas with several believed to be increasing in
size (pers. comm., F. Hutchins, Bat Conservation International, and S. Fulton, Bamberger
Ranch). This may be related to multiple factors, including but not limited to the presence
of a previously unavailable food source such as overwintering migratory moths (Vaughan
1976; Westbrook 2008), changes in roosting sites within the winter range (Kunz 1982;
Tuttle 1977), as well as global climate change (Frick et al. 2010; Popa-Lisseanu and
Voigt 2009; Scheel et al. 1996). Climate change has been suggested as a key factor
influencing migratory behavior of birds (Bezzel and Jetz 1995; Bradley et al. 1999;
Pulido and Berthod 2010) and might also influence the migratory behavior of bats (Popa-
Lisseanu and Voigt 2009). Minimal survey and environmental data have been collected
on overwintering populations of free-tailed bats in central Texas because this
phenomenon is relatively new. Recent research conducted in New Mexico verified an
overwintering population at Carlsbad Cavern (Geluso 2008); however, no published
studies on overwintering populations in Texas exist. Populations of free-tailed bats
overwintering in central Texas may be disturbed by guano mining during winter at large
summer roost sites. Thus, there is a need for assessing the impacts of guano mining in
winter roosts.
Baseline surveys are necessary for biologists to properly evaluate population
trends and fluctuations, changes in habitat parameters, and responses to management
(Duff and Morrell 2007). General knowledge of colony size is also required to analyze
and interpret the ecology of these gregarious animals (Hristov et al. 2010), and the
limited information about the status of free-tailed bat populations, such as colony size, in
Texas as well as North America are continuing concerns (McCracken 2003).

3
Recently, the need for information about overwintering populations has become
increasingly important due to the spread of White-Nose Syndrome, a cold-adapted fungus
that has killed millions of bats throughout the eastern United States. White-Nose
Syndrome was discovered in an Oklahoma cave used by free-tailed bats for roosting
during summer (Cohn 2012); however, the fungus has not been verified as existing in a
bat population in a Texas cave.
Microclimate is a key factor influencing roost site selection during winter (Martin
et al. 2006). Minimal data have been collected on the microclimate of overwintering
roosts compared to the microclimate of roosts used by free-tailed bats when large
maternity colonies are formed throughout central Texas (Herreid 1963; Kunz and Robson
1995; Reichard et al. 2009),
The objectives of my study were to a) confirm the presence or absence of
overwintering (November, December, January, and February) free-tailed bat colonies at
known summer roosts, b) obtain baseline estimates of overwintering populations, c)
measure microclimate variables of temperature and absolute humidity at 6 known
summer roosts during winter 2010-2011 and 2011-2012, and d) examine microclimate
differences between roosts with and roosts without overwintering free-tailed bat
populations.
4
CHAPTER II
MATERIALS AND METHODS
I visited 6 free-tailed bat summer roosts in central Texas (Fig. 1) during winter
(November, December, January, February) 2010-2011 and 2011-2012. Four of these
summer roosts had overwintering bat populations, including Bracken Bat Cave (Comal
County, 29°41’13”N, 98°21’34”W), D’Hanis Bridge (Medina County, 29°19’34”N,
99°17’40”W), Old Tunnel State Park (Kendall County, 30°06’01”N, 98°49’14”W), and
the Chiroptorium (Blanco County, 30°11’14”N, 98°28’34”W). Two roosts did not have
confirmed overwintering populations--Davis Blowout Cave (Blanco County,
30°27’17”N, 98°34’07”W) and James River Bat Cave (Mason County, 30°34’14”N,
99°19’59”W). I visited each roost once per month (total of 8 visits per location during 2
winters). I did not use data from a seventh roost with a confirmed overwintering
population, Frio Bat Cave (Uvalde County), due to data logger problems.
Population Estimation.--- I estimated overwintering bat populations in December of 2010
and 2011. I used different methods to estimate populations at each roost because of
structural diversity of roosting locations as well as roosting habits of bats. I used digital
photography and a laser caliper with a setting of 15.2 cm for roosting area estimates and
population counts at Bracken Bat Cave and Old Tunnel State Park (Meretsky et al. 2010).
I took digital images perpendicular to roosting clusters using a Canon EOS Rebel T2i
with a 70-300mm lens and a Canon Speedlite 430EX II flash. The laser caliper and

5
camera were mounted on a metal plate with two bubble levels parallel to the camera lens
axis. The complete assembly was stabilized with a tripod. I reviewed the digital quality of
the images as pictures were taken in the field. Disturbance to roosting bats was reduced
whenever possible by only using enough light from the laser caliper to identify clusters
and their outlines and focusing my camera. I used ImageJ (National Institute of Health,
USA), a public domain software program, to analyze all photos (Abramoff et al. 2004).
At Bracken Bat Cave, I included the entire cluster of roosting bats in 1 image and
used the known distance from the laser caliper to set the scale in ImageJ. This allowed
me to draw polygons around a roosting cluster and determine roosting surface area.
Polygons were drawn 10 times in each photo and an average of resultant areas was
determined. However, bats roosted approximately 38 m from the cave floor during both
seasons, which prevented me from obtaining the resolution necessary to count individual
bats for density estimates. Current and historical estimates of Brazilian free-tailed bat
populations using extrapolation calculated densities at either 2,153 or 3,229 adult bats/m2
(Constantine 1967; Kennedy 2003). I conservatively estimated the population density at
2,153/m2 and extrapolated to the area based on the average size of polygons.
Bats were spaced much closer at Old Tunnel State Park, and I took quality photos
for enhancement. I used ImageJ to enhance images and estimate numbers of bats/m2. I
created a 30.5 x 30.5 cm square on the enhanced images using the laser caliper distance
as a reference. I counted each bat inside of this square. A digitized point was placed on
each bat’s nose to eliminate double counting. Old Tunnel State Park presented its own
unique challenges. The roosting surface covered by bats was too long to incorporate into
a single photo or stitch together in a series of images. The bats also did not cover the

6
entire area evenly. Therefore, I took pictures at random points within the occupied roost
area and measured the roost width along the tunnel length occupied by bats. I then placed
a grid on each photo using ImageJ and estimated percent area covered by bats in each
square to get a mean percent cover of bats in each photo. The mean percent cover of bats
in each photograph was then averaged to estimate the percentage of the entire roost
covered by bats. I multiplied the measured area by total percent cover and number of
bats/m2 to produce a final estimate. This gave me an estimated roost population.
Bats roosted inside crevices at D’Hanis Bridge. A previously established range of
431-538 bats/m2
was averaged and combined with crevice measurements of occupied
roosting space taken with a 100-m measuring tape (pers. comm., Mylea Bayless, Bat
Conservation International). Lastly, the Chiroptorium contains 7 bat houses of varying
sizes, which housed all overwintering bats during both seasons. I measured dimensions of
each bat house and took pictures of colonies inside to visually estimate the percent of
each bat house occupied. I then used the accepted measurement of 2 bats/linear inch
(pers. comm., Mylea Bayless, Bat Conservation International) and applied this to total
linear inches occupied.
Microclimate Habitat Analysis.---I placed 3 Hygrochron iButton data loggers (Maxim
Dallas Semiconductor Corp., Dallas, Texas) inside and 1 outside each roost to monitor
microclimate data on the first visit to each location in November 2010. I positioned data
loggers inside each roost as close to roosting bats as possible (most within 1 m). I could
not position data loggers in Bracken Bat Cave close enough to roosting bats to obtain
measurements representative of the roosting environment, and therefore, I eliminated this

7
roost from microhabitat analysis. I placed data loggers in areas occupied by bats during
summer at unoccupied winter roosts as evidenced by the presence of guano at a minimum
of 15 m apart. Each data logger recorded temperature and relative humidity at 60 min
intervals during November, December, January, and February. I downloaded data in
February 2011 and 2012. I converted relative humidity to absolute humidity (g/m3) using
the recorded temperature and relative humidity data (Vaisala 2010):
where AH represents absolute humidity, Pw represents water vapor pressure in
hectoPascals (hPa), Tk and Tc represent temperature in degrees Kelvin and Celsius,
respectively, represents saturation water vapor pressure in hPa and RH represents
relative humidity. I used absolute humidity because it is a better measure of air moisture
than relative humidity and is independent of temperature (Colloff 2009; Hillman et al.
2009).
Safety precautions were taken by all who entered roosting sites due to the risk of
histoplasmosis, potential exposure to rabies, and concern for (WNS). I used incandescent
flashlight headlamps and respirators in all locations where histoplasmosis was a concern
and bats were never handled. I also followed the U.S. Fish and Wildlife Service’s quick
reference for White–Nose Syndrome (WNS) containment and decontamination
procedures for cave activity (United States Fish and Wildlife Service 2011). All research
was conducted under the Texas State University IACUC permit number 1029_0909_24.

8
Statistical Analysis.---I determined confidence intervals for population estimates for each
roost individually due to differences in methodology. I calculated the 95% confidence
intervals using standard deviation of area estimates for Bracken Bat Cave. I used standard
deviation of the number of bats estimated/m2 to calculate confidence intervals at Old
Tunnel State Park. I did not determine confidence intervals for the Chiroptorium because
bat house estimates were based on assumed amount of space required for a single
individual. No range of densities has been reported and no methods for determining bat
house population estimates have been published. Finally, I calculated the D’Hanis Bridge
confidence intervals using the range of bats estimated/m2 (pers. comm., Mylea Bayless,
Bat Conservation International). I analyzed differences between mean weekly
temperature and absolute humidity of roosts with over-wintering bats and roosts without
bats with linear mixed-effects models (LME). I considered a P-value < 0.10 statistically
significant due to low sample size. Microclimate analyses were done using R statistical
software program (R Development Core Team 2004).

9
Figure 1. Locations of six Brazilian free-tailed bat roosts (Bracken Bat Cave, D’Hanis Bridge, Old Tunnel State Park, Chiroptorium, Davis Blowout Cave, and James River Bat Cave) I studied
in winter 2010-2011 and 2011-2012.

10
CHAPTER III
RESULTS
Free-tailed bats occupied Bracken Bat Cave, the Chiroptorium, Old Tunnel State
Park, and D’Hanis Bridge during November, December, January, and February of 2010-
2011 and 2011-2012. James River Bat Cave was unoccupied both years. Davis Blowout
Cave was occupied only in February of 2011 and 2012 by migratory populations of free-
tailed bats. Also, the Old Tunnel State Park population increased in November 2010
(pers. comm., Nyta Brown, Texas Parks and Wildlife Department). I assumed free-tailed
bat migration was in progress during November and February and restricted analyses to
data from non-migratory winter months of December and January.
The largest free-tailed bat population during winter 2010-2011 was at D’Hanis
Bridge with 216,128 bats (± 24,013). I estimated Old Tunnel State Park had 65,015 (±
1,948) free-tailed bats and Bracken Bat Cave had 15,233 (± 1,223) free-tailed bats during
winter 2010-2011. The Chiroptorium contained the smallest population of 635 free-tailed
bats (Table 1).
I observed the largest population of free-tailed bats, 254,502 (± 9,255), during
winter 2011-2012 at Old Tunnel State Park. D’Hanis Bridge had the second largest
population with an estimated 226,349 (± 25,150) free-tailed bats. I estimated Bracken Bat
Cave contained 88,834 (± 2,232) free-tailed bats. The Chiroptorium again had the
smallest estimated population at 885 free-tailed bats. Populations of free-tailed bats at all

11
roosts increased from 2010 to 2011 with Bracken Bat Cave and Old Tunnel State Park
roosts showing the largest increases of 480% and 277%, respectively (Table 1).
James River Cave had the lowest mean absolute humidity during both seasons
(5.98 g/m3
in 2010-2011 and 8.00 g/m3 in 2011-2012). The highest mean absolute
humidity was recorded at Davis Blowout Cave for both seasons (9.65 g/m3 in 2010-2011
and 11.9 g/m3 in 2011-2012). The lowest mean temperature was recorded in Old Tunnel
State Park for both seasons (8.58°C in 2010-2011 and 9.21°C in 2011-2012). The highest
mean temperature was recorded in Davis Blowout Cave for 2010-2011 and 2011-2012 at
16.6 °C and 17.3 °C, respectively. Temperatures appeared to be most stable at roosts
without bats. The temperature at Davis Blowout Cave only fluctuated 8.34 °C during
2010-2011 and 6.84 °C during 2011-2012. Temperature ranges at James River Bat Cave
were similar to Davis Blowout Cave at 8.85 °C during 2010-2011 and 8.35 °C during
2011-2012 (Tables 2 and 3).
Internal temperatures for both Davis Blowout Cave and James River Bat Cave did
not follow the same trends as external temperatures during either season (Figs. 2 and 3).
James River Bat Cave had similar internal absolute humidity fluctuations as the external
environment; however, Davis Blowout Cave did not (Figs. 2 and 3). Old Tunnel State
Park most closely followed external temperatures and absolute humidity during both
seasons (Fig. 4). Both the Chiroptorium and D’Hanis Bridge had trends similar to the
external environment with occasional divergences (Figs. 5 and 6).
Results of the LME indicated a statistical difference in winter temperature (P =
0.086, Table 4) but not absolute humidity (P = 0.813, Table 5) between roosts with and
roosts without overwintering free-tailed bats. There was also a difference in mean weekly

12
temperatures between roosts (P = 0.001, Table 4) and a difference in absolute humidity
between years (P < 0.001, Table 5).
Table 1. Population estimates and 95% confidence intervals for Brazilian free-tailed bats at 4
overwintering roosts in December 2010 and 2011.
December 2010 December 2011
Site Estimate 95% CI Estimate 95% CI
Bracken 15,233 14,101-16,456
88,334 86,102-90,565
Chiroptorium 635 N/A
885 N/A
D'Hanis Bridge 216,128 192,115-240,140
226,349 201,199-251,499
Old Tunnel 65,015 63,067-66,963 254,502 245,248-263,757

Table 2. Temperature (°C) and absolute humidity (g/m3) summaries of all roosts from December 2010 through January 2011.
2010-2011
Site
Average Abs. Humidity
(g/m3)
Average Temp.
(⁰C)
Minimum Temp.
(⁰C)
Maximum Temp.
(⁰C)
Temp. Range
(⁰C)
Davisa 9.65 16.61 12.47 20.81 8.34
James Rivera 5.98 14.15 9.62 18.47 8.85
Chiroptorium 7.25 11.68 3.93 28.31 24.38
D'Hanis 7.94 13.00 7.11 19.48 12.37
Old Tunnel 7.44 8.58 0.06 16.95 16.89 awithout bats
Table 3. Temperature (°C) and absolute humidity (g/m3) summaries of all roosts from December 2011 through January 2012.
2011-2012
Site
Average Abs. Humidity
(g/m3)
Average Temp
(⁰C)
Minimum Temp
(⁰C)
Maximum Temp
(⁰C)
Temp. Range
(⁰C)
Davisa 11.90 17.30 14.47 21.31 6.84
James Rivera 8.00 14.94 11.29 19.64 8.35
Chiroptorium 9.53 11.73 4.60 24.48 19.88
D'Hanis 10.27 13.11 7.45 19.31 11.92
Old Tunnel 8.63 9.21 1.91 17.95 16.04
a without bats
13

14
Table 4. Linear mixed effect model (LME) results between mean weekly temperatures (°C) at
roosts with and without overwintering Brazilian free-tailed bats from December-January of 2010-
2011 and 2011-2012.
Variable Estimate SE d.f. t p
Intercept 16.51 1.43 82 11.51 0.000
Bats Present -4.56 1.81 3 -2.52 0.086
Week -0.19 0.05 82 -3.58 0.001
Season 0.43 0.27 82 1.60 0.114
Table 5. Linear mixed effect model (LME) results on mean weekly absolute humidity (g/m3) at
roosts with and without overwintering Brazilian free-tailed bats from December-January of 2010-
2011 and 2011-2012.
Variable Estimate SE d.f. t p
Intercept 8.04 1.17 82 6.87 0.000
Bats Present -0.38 1.47 3 -0.26 0.813
Week -0.03 0.05 82 -0.65 0.520
Season 2.01 0.25 82 7.99 0.000

0
2
4
6
8
10
12
14
16
18
Tem
per
atu
re (
°C)
Week Of
External
Internal
0
2
4
6
8
10
12
14
16
18
Tem
per
atu
re (
°C)
Week Of
External
Internal
0
1
2
3
4
5
6
7
8
Ab
solu
te H
um
idit
y (
g/m
3)
Week Of
External
Internal
0
1
2
3
4
5
6
7
8
9
10
Ab
solu
te H
um
idit
y (
g/m
3)
Week Of
External
Internal
Figure 2. Average weekly patterns of internal versus external temperature (°C) (A) 2010-2011 and (B) 2011-2012 and absolute humidity
(g/m3) (C) 2010-2011 and (D) 2011-2012 at James River Cave.
A B
C
D
15

0
2
4
6
8
10
12
14
16
18
20
Tem
per
atu
re (
°C)
Week Of
External
Internal
0
2
4
6
8
10
12
14
16
18
20
Tem
per
atu
re (
°C)
Week Of
External
Internal
0
2
4
6
8
10
12
Ab
solu
te H
um
idit
y (
g/m
3)
Week Of
External
Internal
0
2
4
6
8
10
12
14
Ab
solu
te H
um
idit
y (
g/m
3)
Week Of
External
Internal
A B
C
D
Figure 3. Average weekly patterns of internal versus external temperature (°C) (A) 2010-2011 and (B) 2011-2012 and absolute humidity
(g/m3) (C) 2010-2011 and (D) 2011-2012 at Davis Blowout Cave.
16

0
2
4
6
8
10
12
Tem
per
atu
re (
°C)
Week Of
External
Internal
0
2
4
6
8
10
12
Tem
per
atu
re (
°C)
Week Of
External
Internal
0
2
4
6
8
10
12
Ab
solu
te H
um
idit
y (
g/m
3)
Week Of
External
Internal
0
2
4
6
8
10
12
Ab
solu
te H
um
idit
y (
g/m
3)
Week Of
External
Internal
Figure 4. Average weekly patterns of internal versus external temperature (°C) (A) 2010-2011 and (B) 2011-2012 and absolute humidity
(g/m3) (C) 2010-2011 and (D) 2011-2012 at Old Tunnel.
D
C
B A
17
0
2
4
6
8
10
12
14
16
Tem
per
atu
re (
°C)
Week Of
External
Internal
0
2
4
6
8
10
12
14
16
Tem
per
atu
re (
°C)
Week Of
External
Internal
0
2
4
6
8
10
12
Ab
solu
te H
um
idit
y (
g/m
3)
Week Of
External
Internal
0
2
4
6
8
10
12
14
Ab
solu
te H
um
idit
y (
g/m
3)
Week Of
External
Internal
A B
C
D
Figure 5. Average weekly patterns of internal versus external temperature (°C) (A) 2010-2011 and (B) 2011-2012 and absolute humidity
(g/m3) (C) 2010-2011 and (D) 2011-2012 at D’Hanis bridge.
18
0
2
4
6
8
10
12
14
16
Tem
per
atu
re (
°C)
Week Of
External
Internal
0
2
4
6
8
10
12
14
16
Tem
per
atu
re (
°C)
Week Of
External
Internal
0
1
2
3
4
5
6
7
8
9
10
Ab
solu
te H
um
idit
y (
g/m
3)
Week Of
External
Internal
0
2
4
6
8
10
12
14
Ab
solu
te H
um
idit
y (
g/m
3)
Week Of
External
Internal
A B
C
D
Figure 6. Average weekly patterns of internal versus external temperature (°C) (A) 2010-2011 and (B) 2011-2012 and absolute humidity
(g/m3) (C) 2010-2011 and (D) 2011-2012 at the Chiroptorium.
19

20
CHAPTER IV
DISCUSSION
I confirmed the presence of overwintering free-tailed bat populations and
established baseline estimates at 4 roosts. Recoveries of banded free-tailed bats in central
Texas during winter were reported as early as 1952 (Glass 1982). However, no attempts
were made to determine roosting locations. It was also concluded that they did not occur
above the southern edge of the Edward’s Plateau region of Texas, and their winter range
was between 29°N and 20°N latitudes (Glass 1982). All roosts with overwintering bats
occurred north of the 29°N latitude. I also discovered populations overwintering at 2
bridges in Hays County, Texas. One located in San Marcos at I-35 and Centerpoint Road
(Hays County, 29°49’40”N, 97°59’07”W), and another in Wimberley on Ranch Road 12
at the Cypress Creek crossing (Hays County, 29°59’48”N, 98°05’51”W). Both locations
are also north of 29°N latitude. Another overwintering, breeding population was reported
at McNeil Bridge on I-35 (Round Rock, Travis County, 30°29’59”N, 97°40’45”W)
(Keeley and Keeley 2004). A large number of free-tailed bats died at this site after
prolonged freezing temperatures in late January and early February of 2011. This to my
knowledge is the northern-most occurrence of free-tailed bats during winter in Texas
north of 30°N latitude. These results might indicate a northward expansion in Texas of
the winter range of the species.

21
The combined free-tailed bat populations from all winter roosts totaled 297,011
bats in 2010 and 570,070 in 2011, almost doubling from 2010 to 2011. This increase
might be due to weather driven fluctuations rather than an increasing overwintering
population. Eads et al. (1957) reported no overwintering bats at Bracken Bat Cave during
3 consecutive winters suggesting a slight northward expansion of the winter range over
the last 50 years. Continued monitoring of overwintering roosts and populations are
needed to document any further northward expansion of the overwintering range of free-
tailed bats.
I found conducting population estimates of the free-tailed bats was challenging.
Combining digital photographs with a laser caliper greatly increases the accuracy of
population estimates when clusters of free-tailed bats can be included in 1 photograph or
stitched together in a series of images (Meretsky et al. 2010). However, this was not
possible at Old Tunnel State Park since the population roosted in groups up to 68 m in
length and 4.88 m wide. Use of thermal imaging equipment would appear to be the best
method in such situations (Betke et al. 2008). However, thermal imaging requires bats to
emerge from their roosting site. Bats do not predictably emerge during winter (Geluso
2008). Studies on the activity patterns of overwintering free-tailed bats in central Texas
are needed to determine the best method for population estimates at Old Tunnel State
Park. It is important to note photos should be taken at the same zoom and distance from
the roost if digital photography is used for this site. There are irregularly shaped guano
mounds located randomly throughout the tunnel that make this a challenge. Analyzing
photographs also does not account for irregularities in walls and ceilings of roosts.

22
Therefore, my population estimates for Old Tunnel State Park and Bracken Bat Cave are
conservative.
I did not obtain confidence intervals for the bat house population estimates in the
Chiroptorium due to a lack of published methodology for accepted roosting densities. It is
not clear how and where density estimates were established (pers. comm., Jim Kennedy,
Bat Conservation International). Other methods for obtaining population estimates for bat
houses include emergence counts (Brittingham and Williams 2000). This was not a
feasible option because of the unpredictability of bat emergence in response to variable
winter weather conditions. I could not determine bat roosting densities in Bracken Bat
Cave because of challenges due to equipment capabilities. Lighting was insufficient to
count individual bats due to the distance of bats from the camera. I recommend a brighter
flash to obtain high quality photos in future winter surveys.
Microclimate results of my research indicate free-tailed bats are selecting colder,
less stable environments during winter in central Texas. Free-tailed bats enter obligate
torpor when temperatures are below 22 °C with thermal conductance remaining
independent of ambient temperatures from 13.6-26 °C (Soriano et al. 2002). They survive
only 1/3 to 1/4 as long as hibernating vespertilionid species when exposed to conditions
similar to hibernating environments (Herreid 1963). While mean temperatures were
below 22 °C at non-wintering sites, the mean temperatures were 4.56 °C higher (Table 2),
and more stable than roosts with bats. Hays et al. (1992) and Speakman and Racey (1991)
suggested that bats inhabiting winter sites with strongly correlated internal and external
roost temperatures can evaluate external conditions without emerging, which is
energetically costly. Correlation of internal to external roost temperatures has been

23
discovered in hibernacula of several other species of bats (Daan 1973; Ransom 1968). It
has also been demonstrated that bats preferentially emerge during warmer evenings
(Avery 1985; Brack and Twente 1985; Ransome 1968) and will not emerge on cold
nights when food is unavailable (Hays et al. 1992). The temperature patterns at sites
without overwintering free-tailed bat populations did not appear to correlate with external
temperatures as strongly as roosts with free-tailed bats based on visually analyzing
graphed data and might be an explanation why free-tailed bats were not found at James
River Bat Cave and Davis Blowout Cave.
Only 1 other bat species was encountered during both years of my study. A single
cave myotis (Myotis velifer) was discovered in the Chiroptorium in January of 2012. No
other hibernating species were found at James River Bat Cave or Davis Blowout Cave,
which supports conclusions that higher temperatures along with stable temperatures are
problematic for free-tailed bats during winter. Hibernating cave myotis (Tinkle and
Patterson 1965) and tri-colored bats (Perimyotis subflavus) (Briggler and Prather 2003)
require thermally stable hibernacula and both hibernate in sites throughout central Texas
(Fitch et al. 1981; Fujita and Kunz 1984), but both species were not found at my roosts
without overwintering free-tailed bats. This suggests higher temperatures may also
influence roost selection for hibernating bats during winter.
Absolute humidity was not a factor influencing roost site selection in my study.
James River Bat Cave had the lowest absolute humidity and Davis Blowout Cave had the
highest both years. The range of humidity values recorded at my sites was within the
accepted range for survival of free-tailed bats (Herreid 1963; Twente 1956). Only 2 of
my winter roost sites lacked overwintering populations, therefore, humidity as a factor

24
influencing roost site selection cannot be ruled out due to low sample size. It is possible
that humidity may be a factor at other sites. Also, there might be other variables that I did
not measure influencing roost site selection, such as airflow (Tuttle and Stevenson 1981).
While Davis Blowout Cave did not have an overwintering free-tailed bat
population during my study, Krutzsch and Sulkin (1958) reported a few free-tailed bats
occurred in the cave during winter. It is not mentioned whether these bats survived
through winter or were transients staying at the cave for any length of time. It is possible
the James River and Davis Blowout caves are transient sites used briefly but not as
permanent winter roosts. I only entered each site once a month, so bats could have been
present in either James River or Davis Blowout Cave when external temperatures were
warm enough to allow successful foraging. However, on several visits to these sites,
external temperatures were above 22 °C and bats were not present. Therefore, I do not
think these sites were used between visits.
Two subspecies of Brazilian free-tailed bats are documented in Texas, the
Brazilian free-tailed bat, also called guano bat (T. b. mexicana), and Le Conte’s free-
tailed bat (T. b. cynocephala) (Schwartz 1955). The subspecies are usually identified
based on their migratory differences. The Mexican free-tailed bat is considered migratory
and occurs throughout Texas, while Le Conte’s free-tailed bat is resident and typically
found in east Texas (Davis 1974; Schmidly 1977). I did not attempt to distinguish
between subspecies during my study, so it could be argued bats at my sites are Le
Conte’s free-tailed bats that are expanding their range westward from east Texas.
However, Le Conte’s are known to form much smaller colonies, typically in man-made
structures such as buildings (McCracken 2003). McCracken and Gassel (1997) suggested

25
genetic differences between subspecies are within range of what would be expected at the
species level. It should be determined which subspecies is overwintering in central Texas.
If it is concluded they are T. b. mexicana this could give additional support to claims that
there is not a need for subspecies classification. Brazilian free-tailed bats display a wide
range of behaviors (McCracken and Gassel 1997); therefore, distinguishing subspecies
based on behavioral differences may be a specious conclusion.
It is not clear at this time if free-tailed bats present during winter are summer
residents of the respective roost sites, or northern migrants that are short stopping
historical migration routes into Mexico (Geluso 2008). In either case, shifts in winter
range of free-tailed bats could be related to their prey species. Free-tailed bats primary
food sources during summer in central Texas are the corn earworm (Helicoverpa zea)
and fall armyworm (Spodoptera frugiperda) moths. Both are facultative migratory insects
considered major crop pests in Texas (Lee and McCracken 2002; Whitaker et al. 1996).
McCracken et al. (2008) suggested distribution of free-tailed bats in Texas can be
associated with distributions of these migratory moths. It is possible that as free-tailed
bats are expanding their winter range northward, so are their prey species, which could
have economic implications for both Texas and Mexico due to their profound impacts on
the agricultural industry (Cleveland et al. 2006; Federico et al. 2008).
If global climate change is impacting shifts in overwintering range for free-tailed
bats, then continued changes in winter distribution can be expected (Popa-Lisseanu and
Voigt 2009; Scheel et al. 1996). It is also important to continue monitoring the bat
populations as White-Nose Syndrome spreads throughout the United States (Blehert et al.
2009; Cohn 2012). It is not known what impact, if any, White-Nose Syndrome will have

26
on free-tailed bats, but it affects sympatric species (Blehert et al. 2009), so the potential
for free-tailed bats to spread the disease is of great concern.

27
LITERATURE CITED
ABRAMOFF, M. D., P. J. MAGALHAES, AND S. J. RAM. 2004. Image Processing with
ImageJ. Biophotonics International 11:36-42.
AVERY, M. I. 1985. Winter activity of pipistrelle bats. Journal of Animal Ecology
54:721-738.
BETKE, M., D. E. HIRSH, N. C. MAKRIS, G. F. MCCRACKEN, M. PROCOPIO, N. I. HRISTOV,
S. TANG, A. BAGCHI, J. D. REICHARD, J. W. HORN, S. CRAMPTON, C. J.
CLEVELAND, AND T. H. KUNZ. 2008. Thermal imaging reveals significantly
smaller Brazilian free-tailed bat colonies than previously estimated. Journal of
Mammalogy 89:18-24.
BEZZEL, E., AND W. JETZ. 1995. Delay of the autumn migratory period in the Blackcap
(Sylvia atricappila) 1966-1993: a reaction to global warming? Journal of
Ornithology 136:83-87.
BLEHERT, D. S., A. C. HICKS, M. BEHR, C. U. METEYER, B. M. BERLOWSKI-ZIER, E. L.
BUCKLES, J. T. H. COLEMAN, S. R. DARLING, A. GARGAS, R. NIVER, J. C.
OKONIEWSKI, R. J. RUDD, AND W. B. STONE. 2009. Bat white-nose syndrome: an
emerging fungal pathogen? Science 323:227.
BRACK, V., AND J. W. TWENTE. 1985. The duration of the period of hibernation of three
species of vespertilionid bats. I. Field Studies. Canadian Journal of Zoology
65:1240-1242.

28
BRADLEY, N. L., A. C. LEOPOLD, J. ROSS, AND W. HUFFAKER. 1999. Phenological
changes reflect climate change in Wisconsin. Proceedings of the National
Academy of Sciences of the United States of America 96:9701-9704.
BRIGGLER, J. T., AND J. W. PRATHER. 2003. Seasonal use and selection of caves by the
eastern pipistrelle bat (Pipistrellus subflavus). American Midland Naturalist
149:406-412.
BRITTINGHAM, M. C., AND L. M. WILLIAMS. 2000. Bat boxes as alternative roosts for
displaced bat maternity colonies. Wildlife Society Bulletin 28:197-207.
CLEVELAND, C. J., M. BETKE, P. FEDERICO, J. D. FRANK, T. G. HALLAM, J. HORN, J. D.
LOPEZ JR., G. F. MCCRACKEN, R. A. MEDELLIN, A. MORENO-VALDEZ, C. G.
SANSONE, J. K. WESTBROOK, AND T. H. KUNZ. 2006. Economic value of the pest
control service provided by Brazilian free-tailed bats in south-central Texas.
Frontiers in Ecology and the Environment 4:238-243.
COHN, J. P. 2012. Bats and white nose syndrome still a conundrum. BioScience 62:444-
444.
COLLOFF, M. J. 2009. Dust mites. Springer, Netherlands. 583 p.
CONSTANTINE, D. G. 1967. Activity patterns of the Mexican free-tailed bat. University
of New Mexico Press Bulletin Biological Series 7:1-79.
DAVIS, T. B., C. F. HERREID II, AND H. L. SHORT. 1962. Mexican free-tailed bats in
Texas. Ecological Monographs 32:311-346.
DAVIS, W. B. 1974. Mammals of Texas. Texas Parks and Wildlife Department, Austin,
Texas, USA.

29
DUFF, A. A., AND T. E. MORRELL. 2007. Predictive occurrence models for bat species in
California. Journal of Wildlife Management 71:693-700.
EADS, R. B., J. S. WISEMAN, AND G. C. MENZIES. 1957. Observations concerning the
Mexican free-tailed bat, Tadarida mexicana, in Texas. Texas Journal of Science
9:227-242.
FEDERICO, P., T. G. HALLAM, G. F. MCCRACKEN, S. T. PURUCKER, W. E. GRANT, A. N.
CORREA-SANDOVAL, J. K. WESTBROOK, R. A. MEDELLIN, C. J. CLEVELAND, C. G.
SANSONE, J. D. LOPEZ JR., M. BETKE, A. MORENO-VALDEZ, AND T. H. KUNZ.
2008. Brazilian free-tailed bats as insect pest regulators in transgenic and
conventional cotton crops. Ecological Applications 18:826-837.
FITCH, J. H., K. A. SHUMP, JR., AND A. U. SHUMP. 1981. Myotis velifer. Mammalian
Species 149:1-5.
FRICK, W. F., D. S. REYNOLDS, AND T. H. KUNZ. 2010. Influence of climate and
reproductive timing on demography of little brown myotis Myotis lucifugus.
Journal of Animal Ecology 79:128-136.
FUJITA, M. S., AND T. H. KUNZ. 1984. Pipistrellus subflavus. Mammalian Species 228:1-
6.
GELUSO, K. 2008. Winter activity of Brazilian free-tailed bats (Tadarida brasiliensis) at
Carlsbad Cavern, New Mexico. The Southwestern Naturalist 53:243-247.
GLASS, B. P. 1958. Returns of Mexican freetail bats banded in Oklahoma. Journal of
Mammalogy 39:435-437.

30
GLASS, B. P. 1982. Seasonal movements of Mexican free-tailed bats Tadarida
brasiliensis mexicana banded in the Great Plains. Southwestern Naturalist
27:127-133.
HAYS, G. C., J. R. SPEAKMAN, AND P. I. WEBB. 1992. Why do brown long-eared bats
(Plecotus auritus) fly in winter? Physiological Zoology 65:554-567.
HERREID, C. F., II. 1963. Temperature regulation and metabolism in Mexican freetail
bats. Science 142:1573-1574.
HILLMAN, S. S., P. C. WITHERS, R. C. DREWES, AND S. D. HILLYARD. 2009. Ecological
and Environmental Physiology of Amphibians. Oxford University Press, New
York. 467 p.
HRISTOV, N. I., M. BETKE, D. E. H. THERIAULT, A. BAGCHI, AND T. H. KUNZ. 2010.
Seasonal variation in colony size of Brazilian free-tailed bats at Carlsbad Cavern
based on thermal imaging. Journal of Mammalogy 91:183-192.
KEELEY, A. T. H., AND B. W. KEELEY. 2004. The mating system of Tadarida
brasiliensis (Chiroptera: Molossidae) in a large highway bridge colony. Journal of
Mammalogy 85:113-119.
KENNEDY, J. 2003. Winter survey of Fern Cave, Val Verde County, Texas. The Nature
Conservancy, Technical Report.
KRUTZSCH, P. H., AND S. E. SULKIN. 1958. The laboratory care of the Mexican free-
tailed bat. Journal of Mammalogy 39:262-265.
KUNZ, T. H. 1982. Roosting ecology of bats. Pp. 1-55, in Ecology of bats (T. H. Kunz,
ed.). Plenum Press, New York.

31
KUNZ, T. H., AND S. K. ROBSON. 1995. Postnatal growth and development in the
Mexican free-tailed bat (Tadarida brasiliensis mexicana): birth size, growth rates,
and age estimation. Journal of Mammalogy 76:769-783.
LEE, Y-F., AND G. F. MCCRACKEN. 2002. Foraging activity and resource use by
Brazilian free-tailed bats Tadarida brasiliensis (Molossidae). Ecoscience 9:306-
313.
MARTIN, K. W., D. M. LESLIE JR., M. E. PAYTON, W. L. PUCKETTE, AND S. L. HENSLEY.
2006. Impacts of passage manipulation on cave climate: conservation
implications for cave-dwelling bats. Wildlife Society Bulletin 34:137-143.
MCCRACKEN, G. F. 2003. Estimates of population sizes in summer colonies of Brazilian
free-tailed bats (Tadarida brasiliensis). Pages 21-30 inT. J. O’Shea and M. A.
Bogan, editors, Monitoring trends in bat populations of the United States and
territories: problems and prospects . United States Geological Survey, Biological
Resources Discipline, Sciences Division, Washington, D.C., Information and
Technology Report USGS/BRD/ITR-2003-003:1-274.
MCCRACKEN, G. F., AND M. F. GASSEL. 1997. Genetic structure of migratory and
nonmigratory populations of Brazilian free-tailed bats. Journal of Mammalogy
78:348-357.
MCCRACKEN, G. F., E. H. GILLAM, J. K. WESTBROOK, Y. LEE, M. L. JENSEN, AND B. B.
BALSLEY. 2008. Brazilian free-tailed bats (Tadarida brasiliensis: Molossidae,
Chiroptera) at high altitude: links to migratory insect populations. Integrative and
Comparative Biology 48:107-118.

32
MERETSKY, V. J., V. BRACK, T. C. CARTER, R. CLAWSON, R. R. CURRIE, T. A.
HEMBERGER, C. J. HERZOG, A. C. HICKS, J. A. KATH, J. R. MACGREGOR, R. A.
KING, AND D. H. GOOD. 2010. Digital photography improves consistency and
accuracy of bat counts in hibernacula. Journal of Wildlife Management 74:166–
173.
POPA-LISSEANU, A. G., AND C. C. VOIGT. 2009. Bats on the move. Journal of
Mammalogy 45:1283-1289.
PULIDO, F., AND P. BERTHOLD. 2010. Current selection for lower migratory activity will
drive the evolution of residency in a migratory bird population. Proceedings of the
National Academy of Sciences of the United States of America 107:7341-7346.
R DEVELOPMENT CORE TEAM. 2006. R: a language and environment for statistical
computing. R Foundation for Statistical Computing, Vienna, Austria.
RANSOME, R. D. 1968. The distribution of the greater horse-shoe bat, Rhinolophus
ferrumequinum, during hibernation, in relation to environmental factors. Journal
of Zoology 154:77-112.
REICHARD, J. D., L. E. GONZALEZ, C. M. CASEY, L. C. ALLEN, N. I. HRISTOV, AND T. H.
KUNZ. 2009. Evening emergence behavior and seasonal dynamics in large
colonies of Brazilian free-tailed bats. Journal of Mammalogy 90:1478-1486.
SCHEEL, D., T. L. S. VINCENT, AND G. N. CAMERON. 1996. Global warming and the
species richness of bats in Texas. Conservation Biology 10:452-464.
SCHMIDLY, D. J. 1977. The mammals of Trans-Pecos Texas. Texas A&M University
Press, College Station, Texas, USA.

33
SCHWARTZ, A. 1955. The status of the brasiliensis group of the genus Tadarida. Journal
of Mammalogy 36:106-109.
SORIANO, P. J., A. RUIZ, AND A. ARENDS. 2002. Physiological responses to ambient
temperature manipulation by three species of bats from Andean cloud forests.
Journal of Mammalogy 83:445-457.
SPEAKMAN, J. R., AND P. A. RACEY. 1991. Effects of disturbance on the energy
expenditure of hibernating bats. Journal of Applied Ecology 28:1087-1104.
SPENRATH, C. A., AND R. K. LAVAL. 1974. An ecological study of a resident population
of Tadarida brasiliensis in eastern Texas. Occasional Papers, The Museum,
Texas Tech University 21:1-14.
TINKLE, D. W., AND I. G. PATTERSON. 1965. A study of hibernating populations of
Myotis velifer in northwestern Texas. Journal of Mammalogy 46:612-633.
TUTTLE, M. D. 1977. Gating as a means of protecting cave dwelling bats. Pages 77-82 in
T. Aley and D. Rhodes, editors. National Cave Management Symposium
Proceddings, Speleobooks, Albuquerque, New Mexico, USA.
TUTTLE, M. D. 2003. Texas bats. Bat Conservation International, Austin, Texas, USA.
TUTTLE, M. D., AND D. E. STEVENSON. 1981. Variation in the cave environment and its
biological implications. Pp. 46-59 in Cave gating, a handbook. 2nd
ed. (R. Stitt,
ed.). National Speleological Society, Huntsville, Texas.
TWENTE, J. W. JR. 1956. Ecological observations on a colony of Tadarida mexicana.
Journal of Mammalogy 37:42-47.

34
VAISALA, O. 2010. Humidity conversion formulas. <http://www.vaisala.com/Vaisal
a%20Documents/Brochures%20and%20Datasheets/Humidity_Conversion_Form
ulas_B210973EN-B-lores.pdf>. Accessed 29 Jul. 2011. 17 p.
VAUGHAN, T. A. 1976. Nocturnal behavior of the African false vampire bat
(Cardioderma cor). Journal of Mammalogy 57:227-248.
VILLA, B. R. 1956. Tadarida braziliensis mexicana (Saussure), el murcielago guanero,
es una subspecie migratoria. Acta Zoologica Mexicana 1:1-11. [In Spanish.]
VILLA, B. R., AND E. L. COCKRUM. 1962. Migration in the guano bat Tadarida
brasiliensis mexicana (Saussure). Journal of Mammology 43:43-64.
UNITED STATES FISH AND WILDLIFE SERVICE. 2011. White-nose syndrome
decontamination protocol.
WAHL, R. 1993. Important Mexican free-tailed bat colonies in Texas. Pp. 47-50 in
Proceedings of 1989 national cave management symposium (J. R. Jorden and R.
K. Obele, eds.). Texas Cave Management Association and Texas Parks and
Wildlife Department, Austin, Texas, USA.
WESTBROOK, J. K. 2008. Noctuid migration in Texas within the nocturnal aeroecological
boundary layer. Integrative and comparative Biology 48:99-106.
WHITAKER, J. O. JR, C. NEEFUS, T. H. KUNZ. 1996. Dietary variation in the Mexican free-
tailed bat (Tadarida brasiliensis) during evening and morning feeding bouts.
Journal of Mammalogy 77:716–24.
WILKINS, K. T. 1989. Tadarida brasiliensis. Mammalian Species 331:1-10.

VITA
Sara Patricia Weaver was born on August 12, 1980 to James and Terry Neel in
Dallas, Texas. She graduated from Newman Smith High School in 1998. Sara attended
Texas State University-San Marcos where she received a Bachelor of Science in Biology,
while graduating Summa Cum Laude in 2009. During the summer of 2007, Sara worked
as a public educator at Bat Conservation International in Austin, Texas. She also interned
at Wild Basin Preserve in Austin where she lead public educational tours of the property
and helped with the upkeep and care of the preserve. Sara entered the Graduate College
of Texas State University-San Marcos in the fall of 2010 where she was an Instructional
Assistant for Modern Biology II, Ecology, and Vertebrate Physiology.
Permanent email: [email protected]
This thesis was typed by Sara Patricia Weaver