Embed Size (px)
Citation preview

Sandia is a multiprogram laboratory operated by Sandia Corporation, a Lockheed Martin Company,
for the United States Department of Energy’s National Nuclear Security Administration
under contract DE-AC04-94AL85000.
Paul VeersDistinguished Member of the Technical Staff
Wind and Water Power Technologies
Sandia National Laboratories
Albuquerque, NM, USA
Purdue University
April 8, 2010
Overview:
Wind Energy Technology
Fundamentals , the 20%
Scenario, and Innovation
Opportunities

Sandia National Laboratories“Exceptional Service in the National Interest”
• National Security
Laboratory
• Broad mission in
developing science and
technology applications
to meet our rapidly
changing, complex
national security
challenges
• Safety, security and
reliability of our
nation’s nuclear
weapons stockpile

Sandia Sites
WIPP,
New Mexico
Tonopah, Nevada
Kauai,
Hawaii
Pantex, Texas
Livermore,
California
Albuquerque,
New Mexico
Yucca Mountain,
Nevada
8500 Employees
>7000 in New Mexico

Energy Overview - 4
Outline
• Wind Turbine design evolution
• Typical modern turbine
• How it works:
Limitations
Opportunities
• 20% wind scenario
• Efforts to enhance the
technology

Energy Overview - 5

Energy Overview - 6
Wind Turbine Size

Wind Power – large and small
Small Wind
(1-100 kW)
American Wind Energy Association
www.awea.org
Utility-Scale Wind
(1-5 MW)
1
2

Energy Overview - 8
• Utility-Scale Wind Power
1,000-3,000 kW wind turbines– Installed on wind farms, 10–700 MW
– Interconnected to transmission
– Professional maintenance crews
– Class 4-6 (quality) wind resource
• Small Wind Powerup to 100 kW wind turbines
– Installed at individual homes, farms, businesses, schools, etc.
– Interconnected to distribution, on the “customer side” of the meter
– Few moving parts, high reliability, low maintenance
– Class 2-4 (marginal) wind resource
Small Wind Turbines
Are Different1,500
kW
10 kW
80 ft
212 - 250 ft
Courtesy Jim Green, NREL

Energy Overview - 9
Example Small Wind SystemsBergey Windpower
BWC XL.11 kW, 8.2 ft Dia.
Battery-Charging
Southwest Windpower
Skystream 3.71.8 kW
12 ft Dia.
Grid-Connect
Northern Power
Systems
NorthWind 100/21100 kW, 69 ft dia.
Grid-Connect
Courtesy Jim Green, NREL
Endurance Wind Power Inc.
Endurance S-2504.25 kW, 18 ft Dia.
Grid-Connect
Endurance S-2504.25 kW, 18 ft Dia.
Grid-Connect

Energy Overview - 10
The Change from Small Machines
to Large Multi-Mega-Watt Machines
• Above: Tehachapi, CA
– 65kW, 900kW, and
3MW machines
• Left: Palm Springs, CA
– field of 65kW with
four lager machines in
foreground (~750kW)

Energy Overview - 11
GE 1.5 MW machines in Fort Sumner, NM
and Bonus (Siemens) 2.0 MW machines in Copenhagen Harbor
Energy Overview - 12
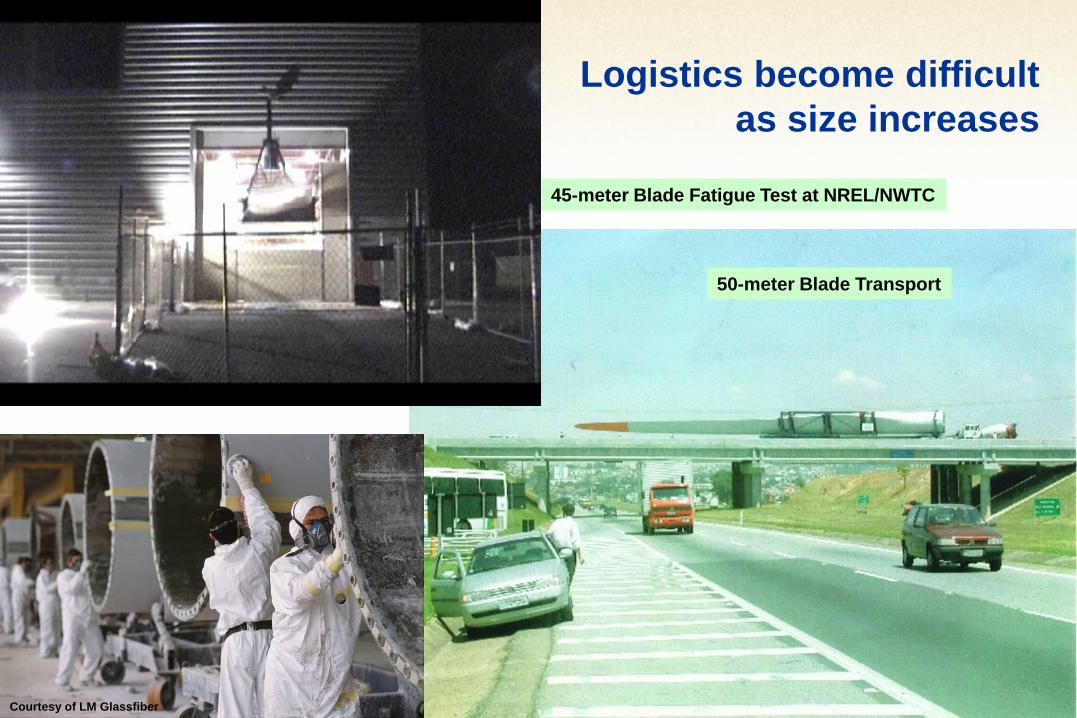
Logistics become difficult
as size increases
50-meter Blade Transport
45-meter Blade Fatigue Test at NREL/NWTC
Courtesy of LM Glassfiber
Energy Overview - 13
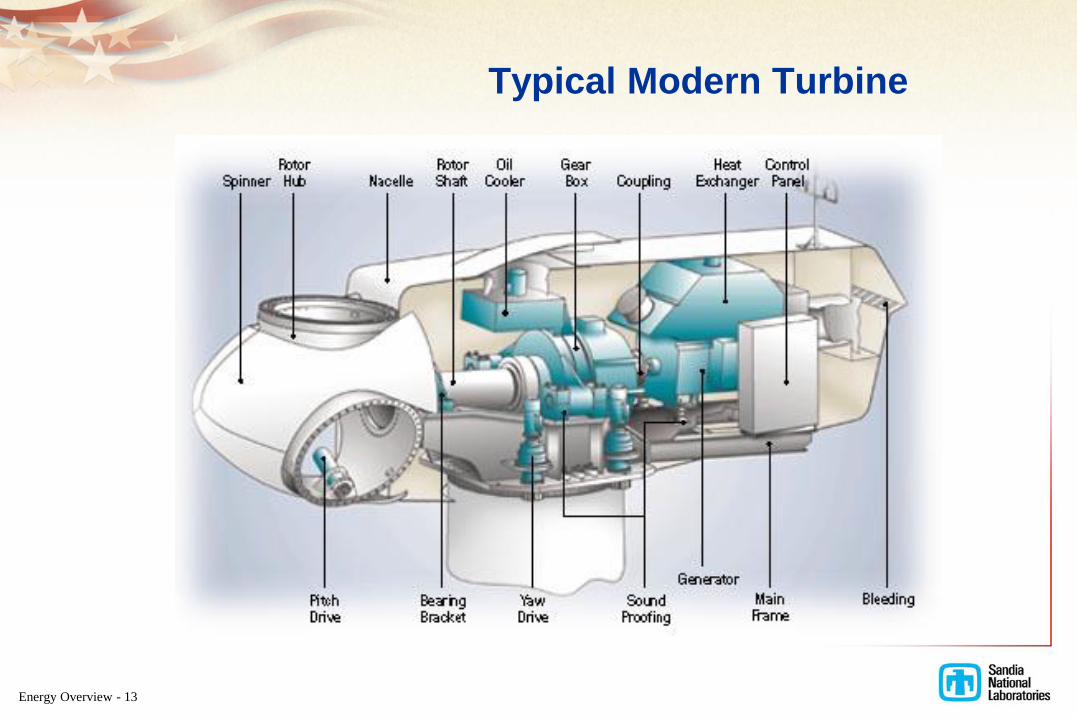
Typical Modern Turbine
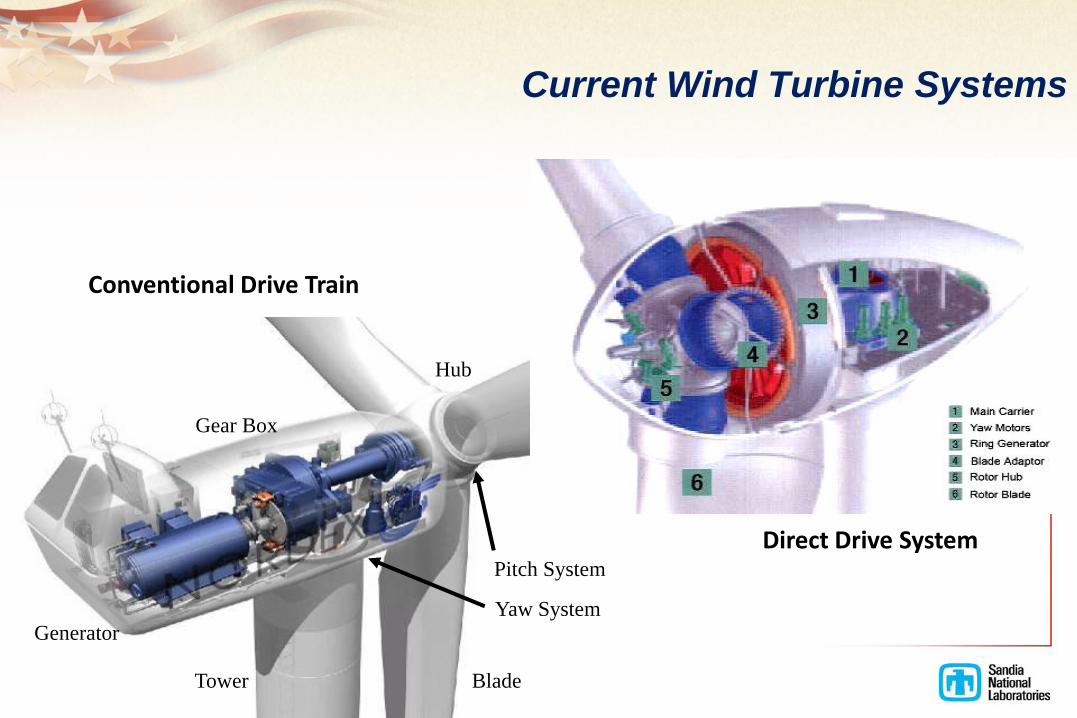
Current Wind Turbine Systems
Hub
BladeTower
Gear Box
Generator
Pitch System
Yaw System
Conventional Drive Train
Direct Drive System
Energy Overview - 15
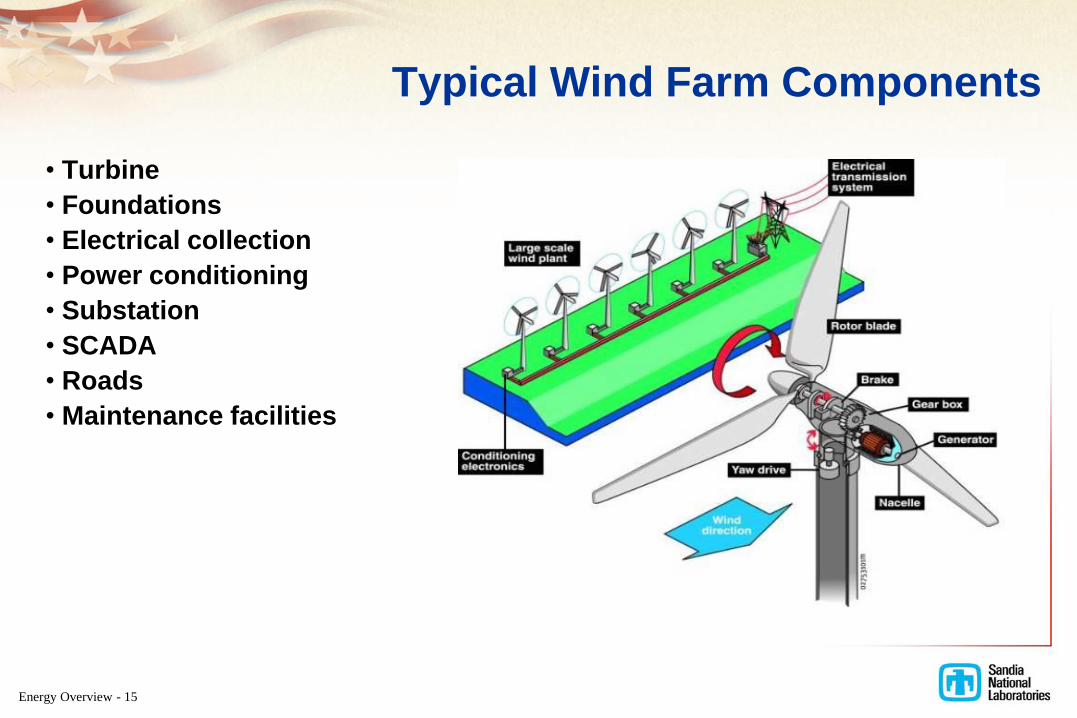
Typical Wind Farm Components
• Turbine
• Foundations
• Electrical collection
• Power conditioning
• Substation
• SCADA
• Roads
• Maintenance facilities
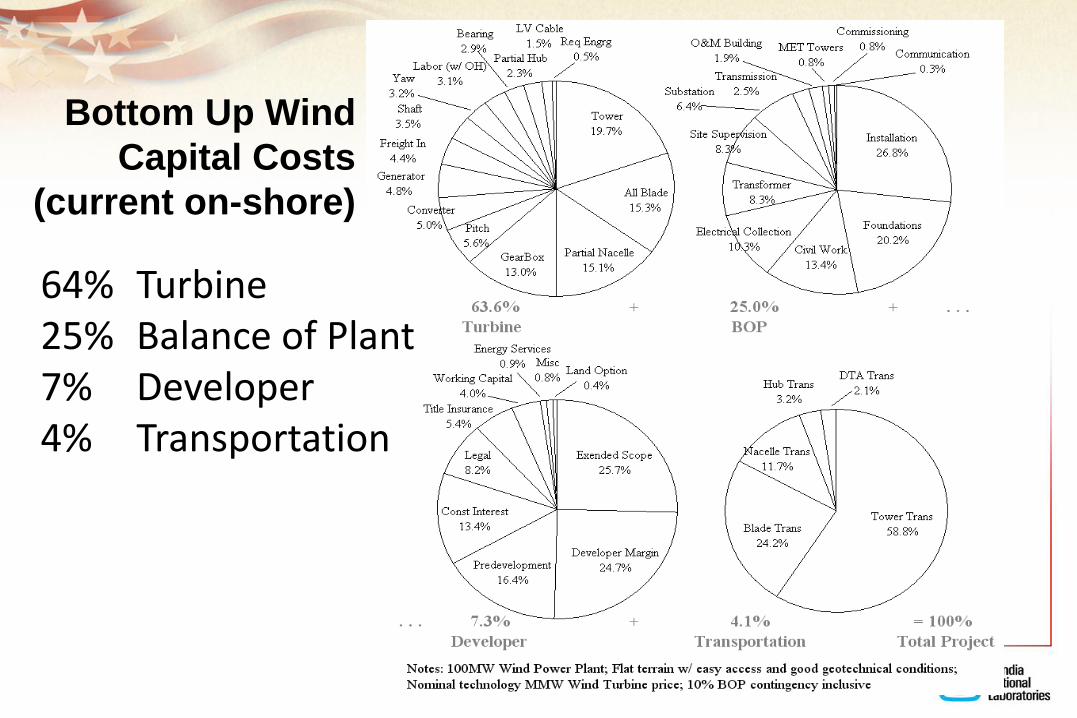
Bottom Up Wind
Capital Costs
(current on-shore)
64% Turbine25% Balance of Plant7% Developer4% Transportation
Energy Overview - 17
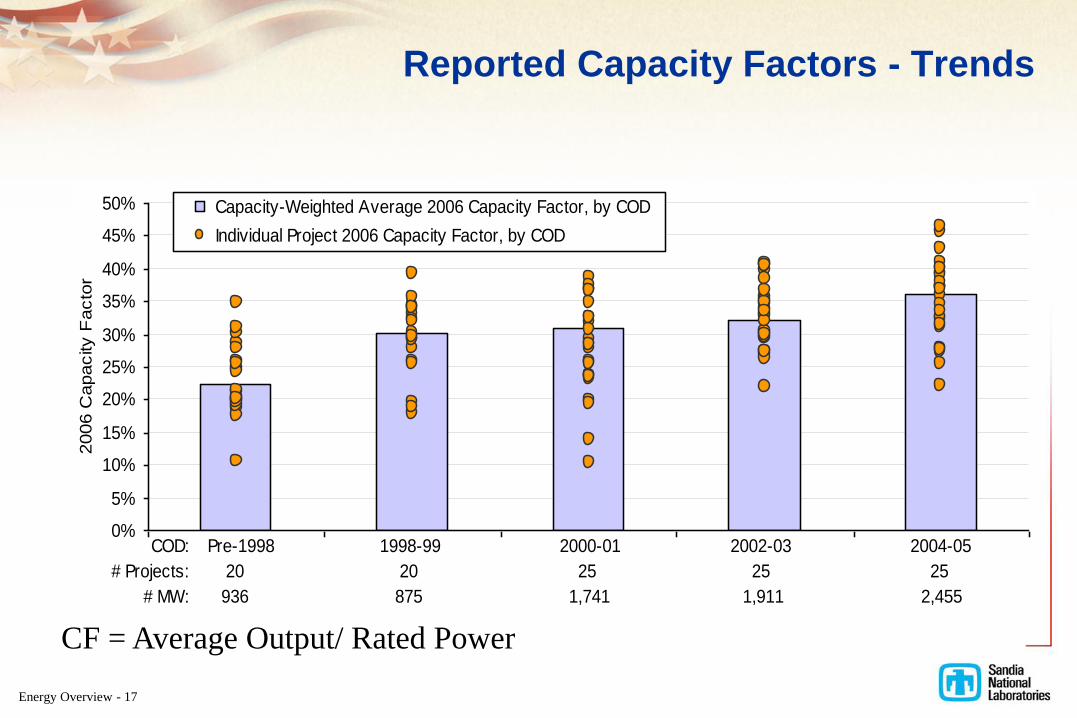
Reported Capacity Factors - Trends
0%
5%
10%
15%
20%
25%
30%
35%
40%
45%
50%
2006 C
apacity F
acto
r
Capacity-Weighted Average 2006 Capacity Factor, by COD
Individual Project 2006 Capacity Factor, by COD
COD:
# Projects:
# MW:
Pre-1998 1998-99 2000-01 2002-03 2004-05
20 20 25 25 25
936 875 1,741 1,911 2,455
Source: Berkeley Lab database
CF = Average Output/ Rated Power
Energy Overview - 18
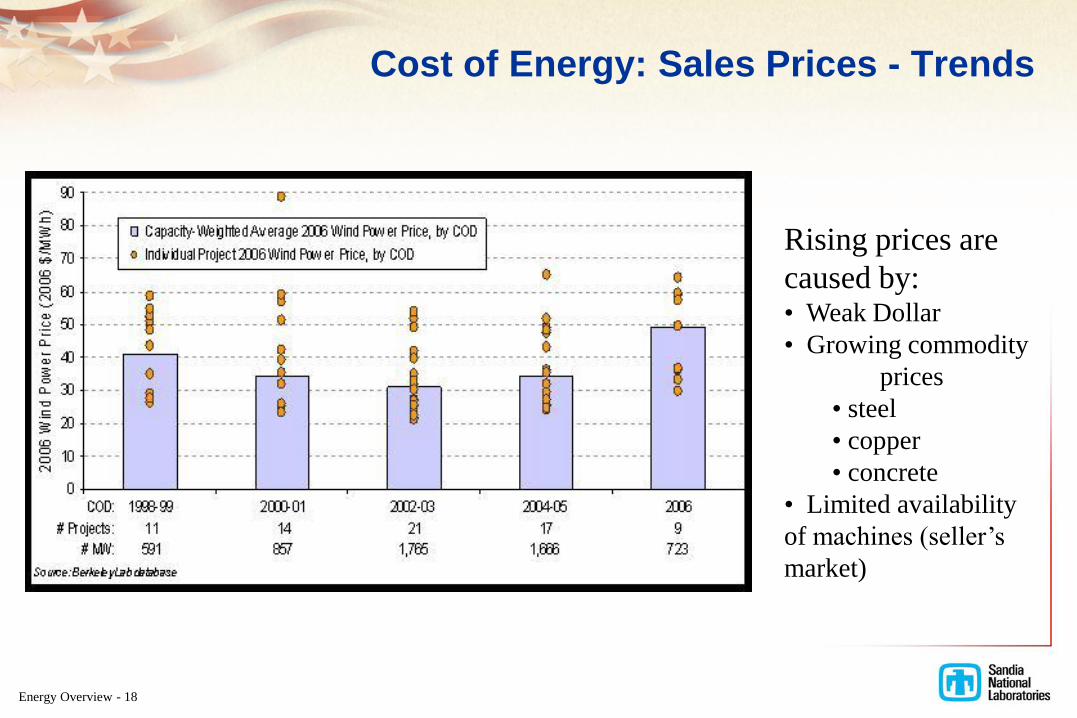
Cost of Energy: Sales Prices - Trends
Rising prices are
caused by:• Weak Dollar
• Growing commodity
prices
• steel
• copper
• concrete
• Limited availability
of machines (seller’s
market)
Energy Overview - 19
20% Wind Energy by 2030
• The Scenario
• Costs
• Benefits
• Summary

Energy Overview - 20
The 20% Technical Report
• Explores one scenario for reaching 20% wind energy by
2030 and contrasts it to a scenario in which no new U.S.
wind power capacity is installed
• Is not a prediction, but an analysis based on one
scenario
• Does not assume specific policy support for wind
• Is the work of more than 100 individuals involved from
2006 - 2008 (government, industry, utilities, NGOs)
• Analyzes wind’s potential contributions to energy
security, economic prosperity and environmental
sustainability

20% Wind by 2030 Scenario Requires 300 GW
0
50
100
150
200
250
300
2000 2006 2012 2018 2024 2030
Cu
mu
lati
ve
In
sta
lle
d C
ap
ac
ity
(G
W) Offshore
Land-based
Actual
20% by 2030
Scenario
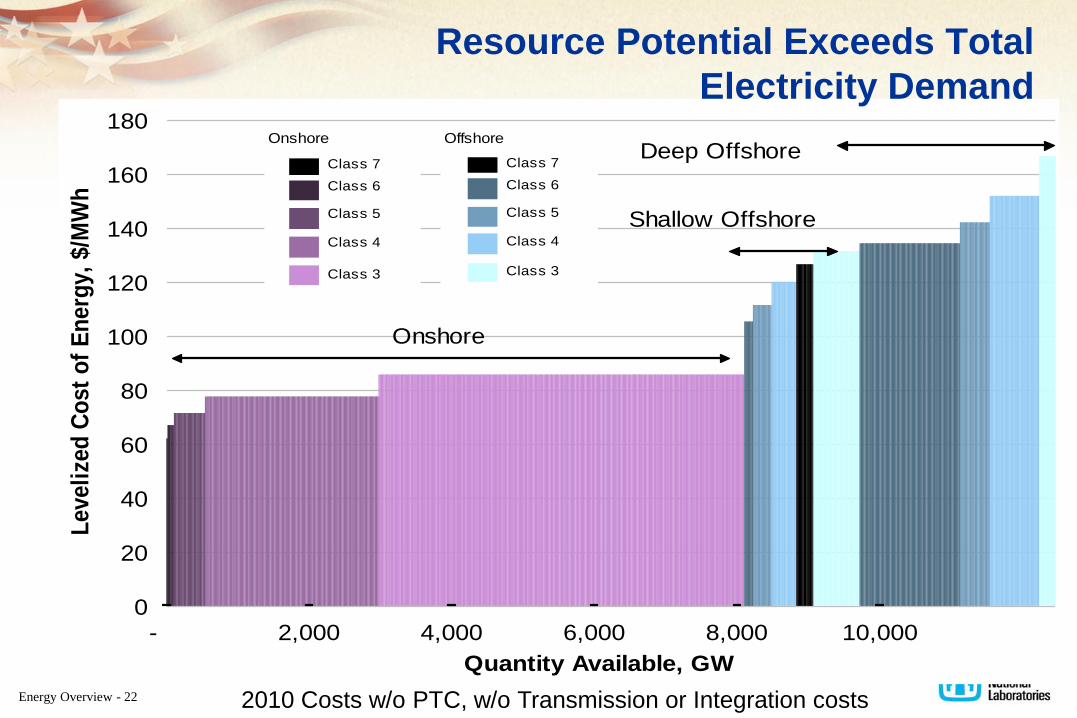
Energy Overview - 22 2010 Costs w/o PTC, w/o Transmission or Integration costs
- 2,000 4,000 6,000 8,000 10,0000
20
40
60
80
100
120
140
160
180
Quantity Available, GW
Leveli
zed
Co
st
of
En
erg
y,
$/M
Wh
Onshore
Class 6
Class 4
Class 7
Class 5
Class 3
Offshore
Class 6
Class 4
Class 7
Class 5
Class 3
Onshore
Shallow Offshore
Deep Offshore
Resource Potential Exceeds Total
Electricity Demand
Energy Overview - 23
- 200 400 600 800 1,0000
20
40
60
80
100
120
140
160
Quantity Available, GW
Leveli
zed
Co
st
of
En
erg
y,
$/M
Wh
Onshore
Class 6
Class 4
Class 7
Class 5
Class 3
Offshore
Class 6
Class 4
Class 7
Class 5
Class 3
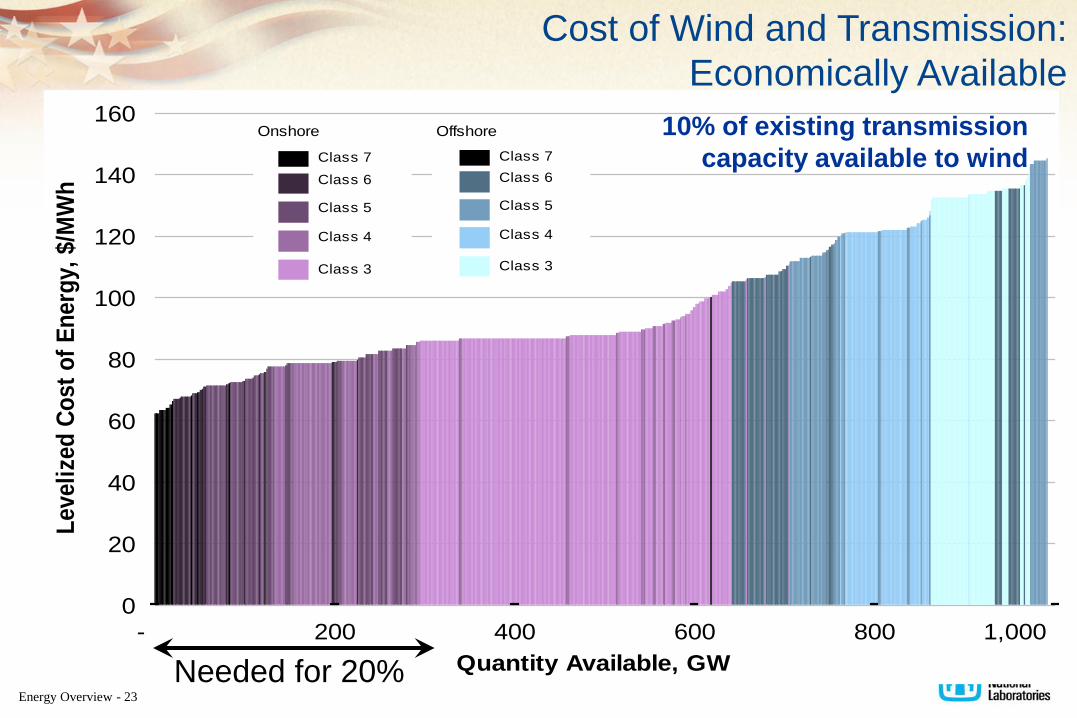
10% of existing transmission
capacity available to wind
Cost of Wind and Transmission:
Economically Available
Needed for 20%

Energy Overview - 24
46 States Will Have Wind Development by
2030 under the 20% Wind Scenario
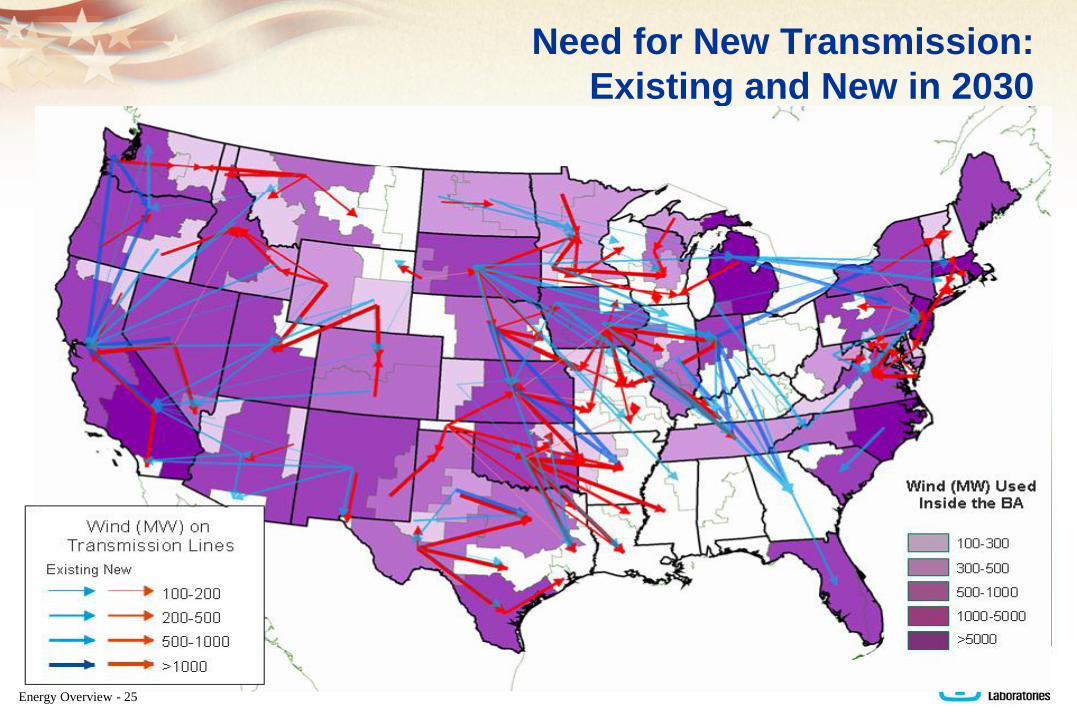
Energy Overview - 25
Need for New Transmission:
Existing and New in 2030

Energy Overview - 26
$0
$500
$1000
$1500
$2000
$2500
$3000
Bill
ions o
f 2006 D
olla
rs
20% WindNo New Wind
Wind O&M Costs
Transmission Costs
Wind Capital Costs
Fuel Costs
Conventional O&M Costs
Conventional Capital Costs
Economic Costs of 20% Wind Scenario
2% investment
difference between
20% Wind and
No New Wind
Incremental investment cost of 20% Wind
Scenario
$60 Billion additional
Transmission cost
$43 Billion net
additional cost
Energy Overview - 27
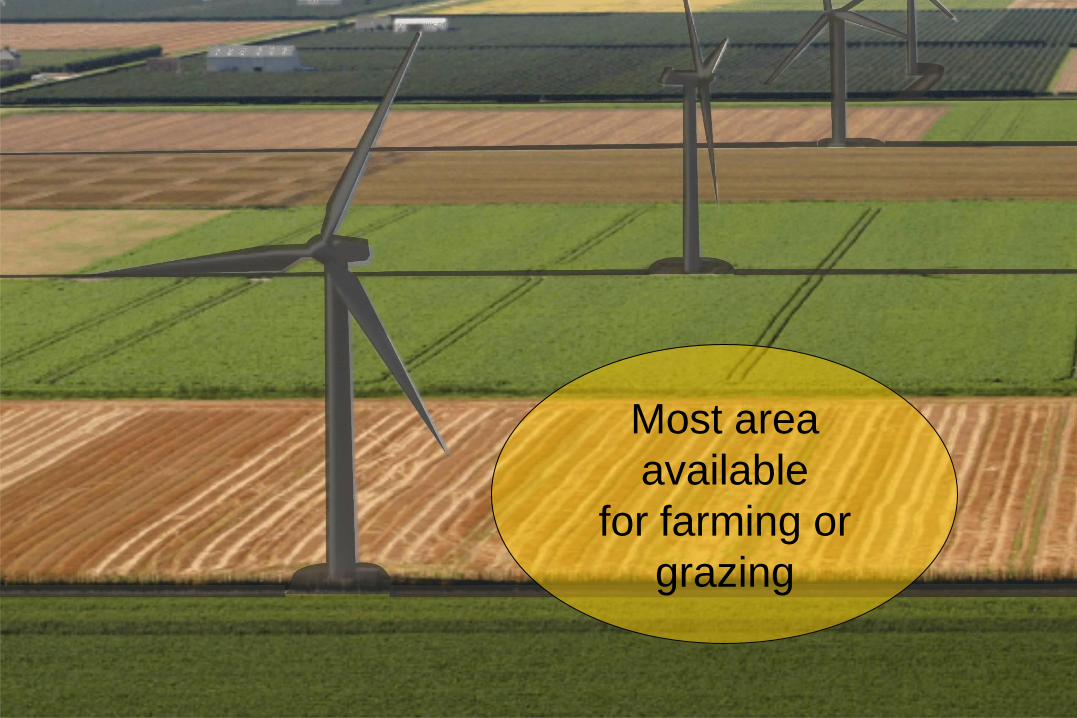
Most area
available
for farming or
grazing
Energy Overview - 28
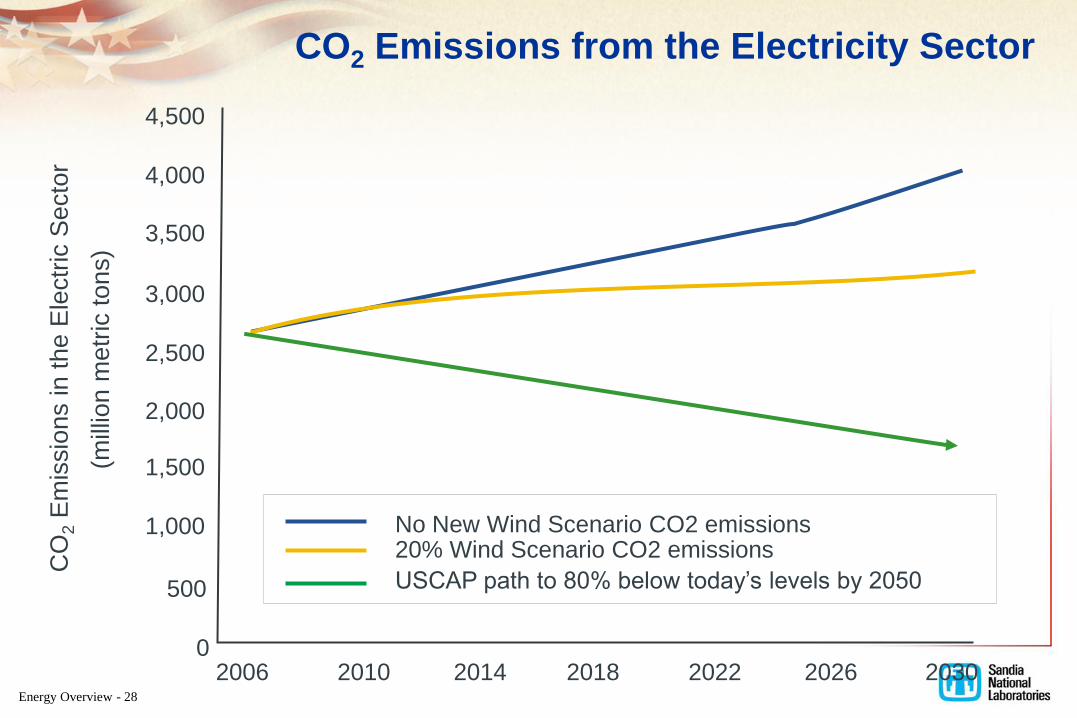
02006 2010 2014 2018 2022 2026 2030
500
1,000
1,500
2,000
2,500
3,000
3,500
4,000
4,500
No New Wind Scenario CO2 emissions20% Wind Scenario CO2 emissions
USCAP path to 80% below today’s levels by 2050
CO
2E
mis
sio
ns in t
he E
lectr
ic S
ecto
r
(mill
ion m
etr
ic t
ons)
CO2 Emissions from the Electricity Sector

Energy Overview - 29
Significant Water Use Savings
Cumulatively, the 20% Wind Scenario would avoid the
consumption of 4 trillion gallons of water
through 2030.
The 20% Wind Scenario cuts electric
sector water consumption by 17%
in 2030.
Energy Overview - 30
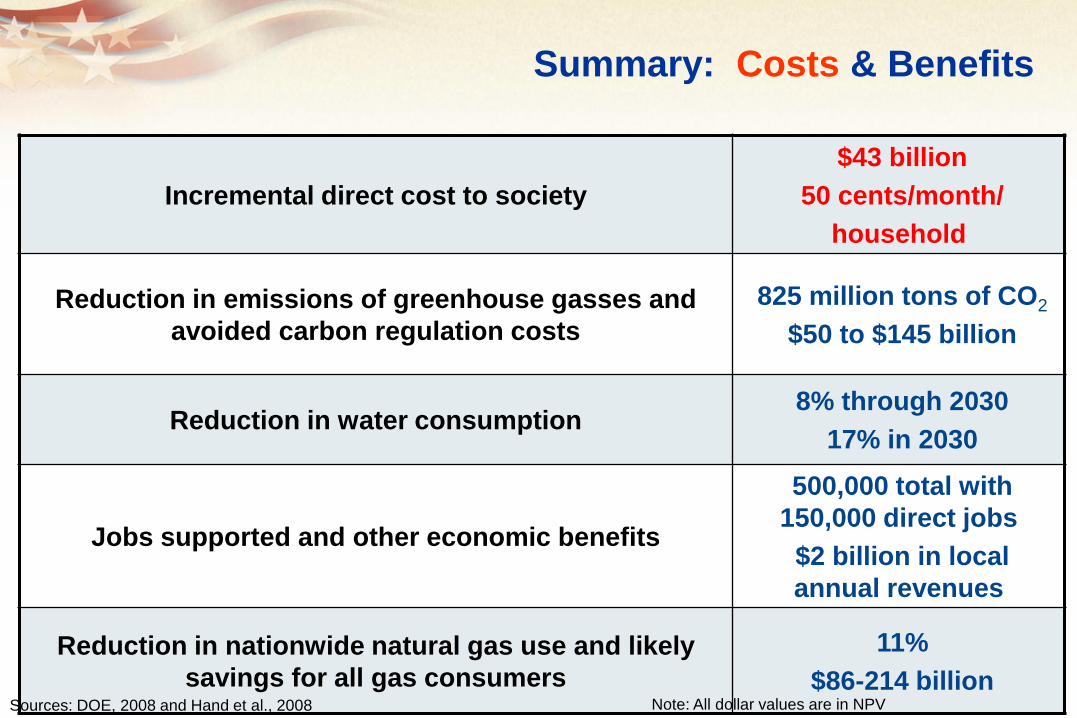
Incremental direct cost to society
$43 billion
50 cents/month/
household
Reduction in emissions of greenhouse gasses and
avoided carbon regulation costs
825 million tons of CO2
$50 to $145 billion
Reduction in water consumption8% through 2030
17% in 2030
Jobs supported and other economic benefits
500,000 total with
150,000 direct jobs
$2 billion in local
annual revenues
Reduction in nationwide natural gas use and likely
savings for all gas consumers
11%
$86-214 billion
Summary: Costs & Benefits
Sources: DOE, 2008 and Hand et al., 2008 Note: All dollar values are in NPV
Technology Fundamentals
Energy Overview - 31

Energy Overview - 32
Measuring and Modeling Dynamic Stall and Unsteady Aerodynamics
NASA Ames 80’ by 120’
Wind Tunnel Test
Smoke Test
Field Test
Visualizing the flow through the rotor

Energy Overview - 33
Wind Power Basics
Wind Power output is
proportional to wind speed
cubed.
(Drag)
(Lift)59.0
3.0
max
max
3
2
1
P
P
P
C
C
VACWindPower
Air DensityRotor Area
Wind Speed
The Betz Limit
Courtesy Jim Green, NREL
Efficiency

Energy Overview - 34
Turbine Power: What is available and what is useable?
Wind Turbine Power Curve
Regions of the Power Curve
Region I – not enough power to
overcome friction
Region II – Operate at maximum
efficiency at all
times
Region III – Fixed power
operation
“Rated Power” governs the size and
cost of the entire turbine
infrastructure
Energy Overview - 35
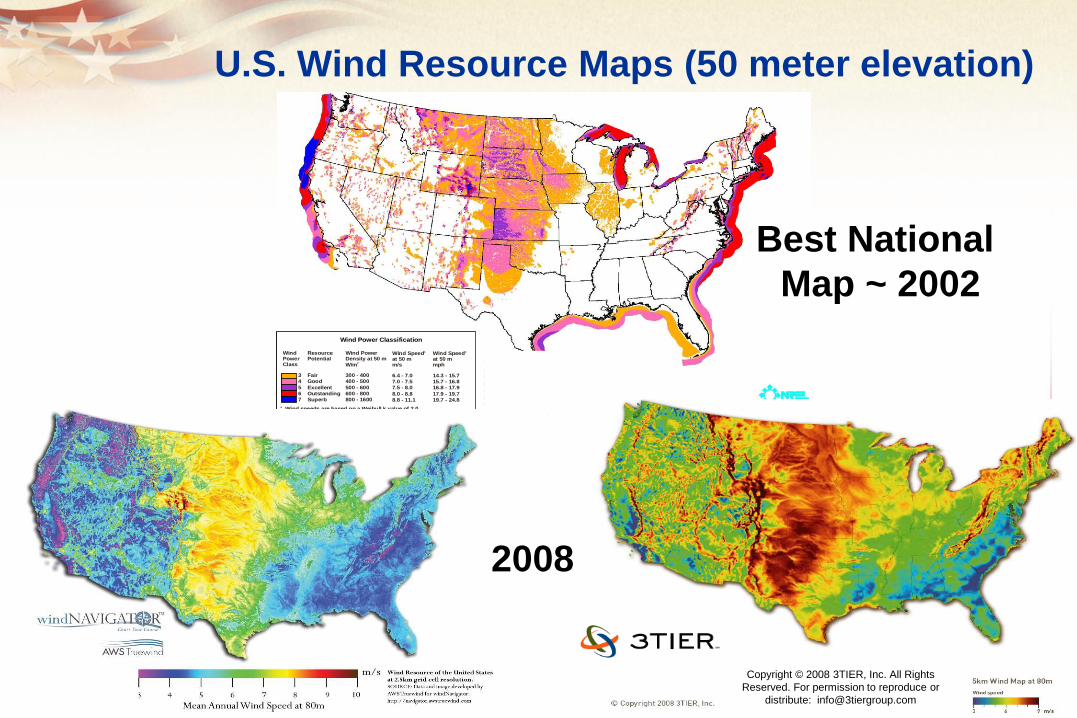
WindPowerClass
ResourcePotential
Wind PowerDensity at 50 m
W/m2
Wind Speedat 50 mm/s
aWind Speedat 50 mmph
a
3
4
5
6
7
Fair
Good
Excellent
Outstanding
Superb
300 - 400
400 - 500
500 - 600
600 - 800
800 - 1600
6.4 - 7.0
7.0 - 7.5
7.5 - 8.0
8.0 - 8.8
8.8 - 11.1
14.3 - 15.7
15.7 - 16.8
16.8 - 17.9
17.9 - 19.7
19.7 - 24.8
a Wind speeds are based on a Weibull k value of 2.0
Wind Power Classification
U.S. Wind Resource Maps (50 meter elevation)
Copyright © 2008 3TIER, Inc. All Rights
Reserved. For permission to reproduce or
distribute: [email protected]
Best National
Map ~ 2002
2008

Energy Overview - 36
The wind resource is much better
as you go higher above ground
50 meters 100 meters70 meters
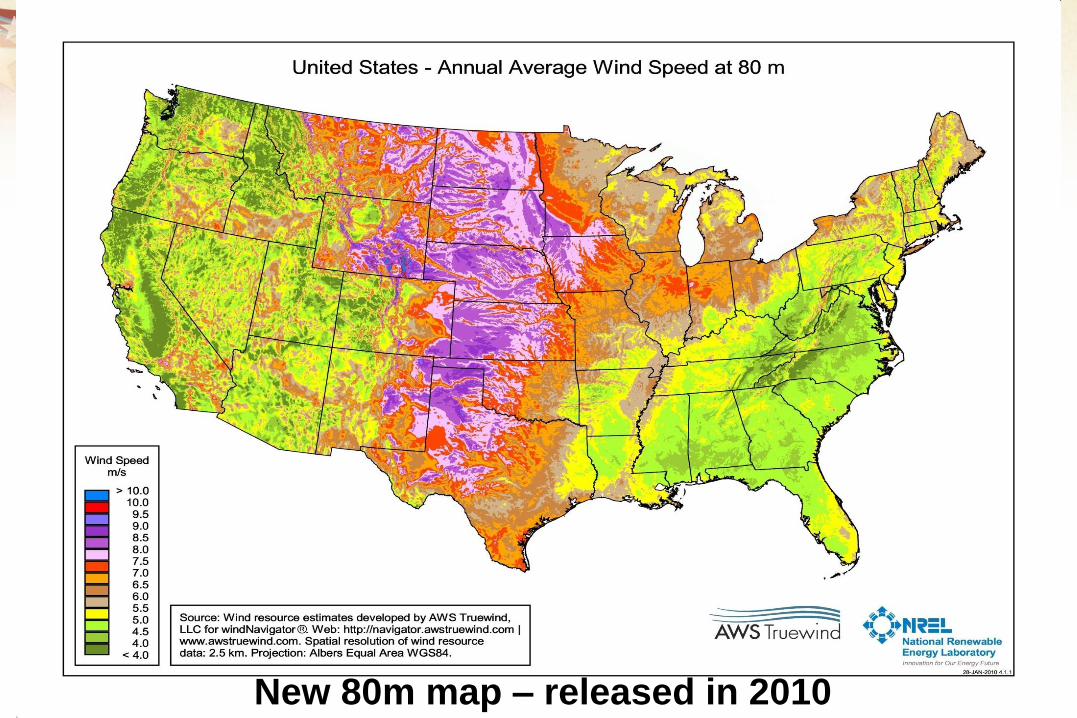
New 80m map – released in 2010

Energy Overview - 38
Power Curve
0
500
1000
1500
2000
2500
3000
3500
4000
0 5 10 15 20 25 30 35 40
Windspeed (m/s)
Po
wer
(kW
)
Turbine pow er Betz Pow er
Performance Enhancement Options
Wind, Energy
0 5 10 15 20 25 30 35 40
Windspeed (m/s)
Rayleigh Probability Weibull Probability
Wind, Energy
0 5 10 15 20 25 30 35 40
Windspeed (m/s)
Weibull Betz Turbine Energy Weibull Cp
Power Resource Energy
Larger Rotor Greater OutputTaller Tower
Rotor costs increase with
diameter cubed, Rotor
power grows with the
diameter squared
Tower costs increase
with height to the fourth
power (constrained
base diameter)
The cost benefits are
constrained by the
squared-cubed law
We can only win this battle if we build rotors that are smarter and
components that are lighter to beat the squared-cubed law.
Imperfect
Conversion
Losses
Lost Energy
from Rating

Energy Overview - 39
Wind Turbine Rotor
Design Challenge
Numerous existing manufacturers
of large composite structures in
Military and Aerospace
Technology/Expertise does not
generally transfer
High-end military
~ $1000/lb
Commercial
Aerospace
~ $100/lb
Wind Turbine Blade
~ $6/lb
106
cycles 106
cycles 108 cycles

Technology Challenges from the 20% Report
Challenges:
• Cost of Energy (Capital Cost / Energy Production)
• Reliability and Maintenance Cost
• Public acceptance and Investor Confidence
Potential Impact from Rotor Enhancements:
• Greater energy capture on a given tower/drivetrain
• Lower tower-top mass for given rotor size
• Lower Cost of Energy (COE)
• Increased deployment of wind power

Technology Advancements Under
Sandia’s Blade Program• Prototype Sub-scale Blades
Manufactured (9 meters)– CX-100
• Carbon spar cap
• Glass skin and shear web
– TX-100• Carbon triax in skin for passive
bend-twist coupling
– BSDS (Blade System Design Study)
• Flatback airfoils
• Carbon spar cap
• Constant spar cap thickness
TX-100 skin w/ off-axis carbon fiber
Weight
0
100
200
300
400
500
600
700
800
1 2 3 4 5
Design Generation
lbs
~1990 2002 2004 2004 2005
ER
S
SE
RI8
CX
TX
BS
DS

Passive Bend-Twist
Coupled Blade
Courtesy: NREL
Previous Load Control Concepts
Past work has investigated blade load control
• Individual blade pitch (rather than collective)
‒ Pitches entire blade (slow response)
‒ Responds to some “average” blade load
‒ Current “state-of-the-art” in industry research
• Passive bend/twist or sweep/twist blade load control (load causes blade to
twist and reduce load)
‒ Response fixed at time of design
‒ Unable to tailor to specific site/wind conditions
STAR Sweep-Twist Coupled Blade

Knight & Carver Swept (STAR) Blade
Energy Overview - 43

Smart-Blade Approach
Investigate use of distributed active aerodynamic load
control devices to reduce locally fluctuating blade loads
• Improved load control capability
– Respond to loads at locations along blade
– Respond to site-specific conditions
• Utilize full system dynamic simulations
– Analyze system response
– Develop control system
• Develop prototype control devices
– Microtabs, microflaps, morphing trailing edges
– Fast response, low loads
– Study impact on flow field (UC Davis)
• Analytical (2-D and 3-D CFD)/experimental
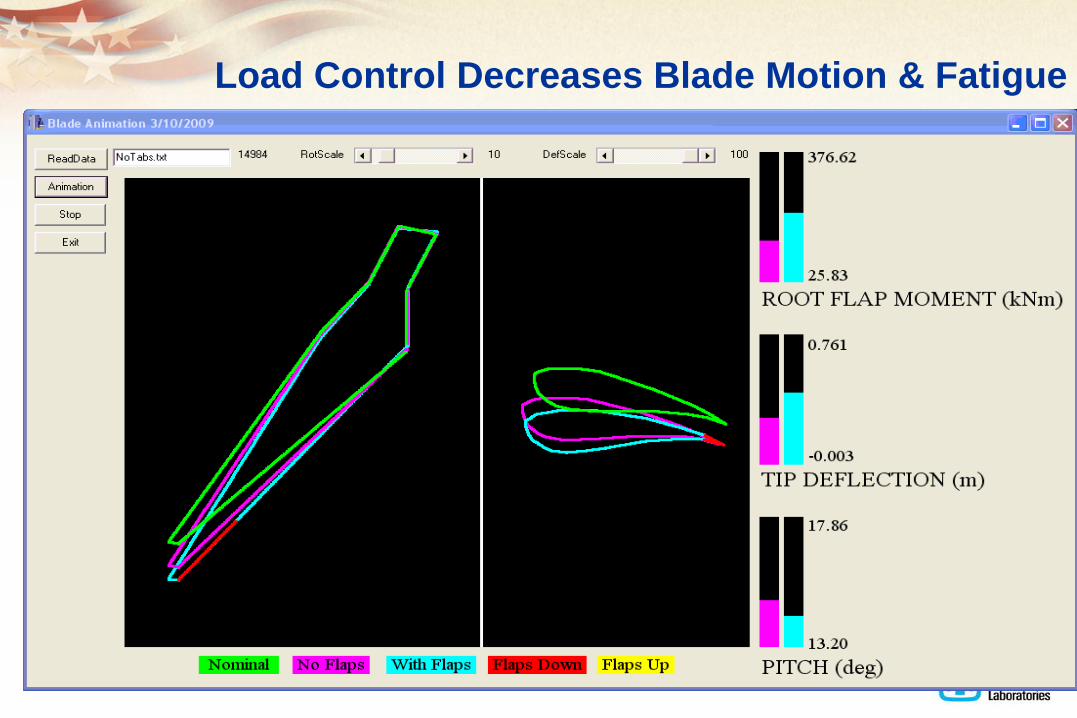
Load Control Decreases Blade Motion & Fatigue

Grow the Rotor (GTR) ConceptComparable Blade Flap Fatigue Damage – 1.5MW

Energy Overview - 47
Typical Offshore Wind Turbine
Credit: GE Energy
Horns
Rev

Energy Overview - 48
Land-based sites are not close to population centers
Cities are close to offshore wind sites
Why Offshore Wind ?
US Population Concentration U.S. Offshore Wind Resource
Graphic Credit: Bruce Bailey AWS Truewind
28 coastal states use 78% of the electricity in US

Energy Overview - 49

Energy Overview - 50
Floating Wind Turbines
Statoil/Hydro
(Norway)
tested a
floating system
in 2009.

Grid Integration and Transmission
Energy Overview - 51

• Inability to dispatch
– Weather determines output
• Variability
– Makes it more difficult to balance load
• Uncertainty
– Can be forecasted to a large extent
• Different electrical characteristics
– Lower inertia, voltage tolerance, reactive controls
– Still compatible with the grid
Wind Grid Integration and Transmission Challenges
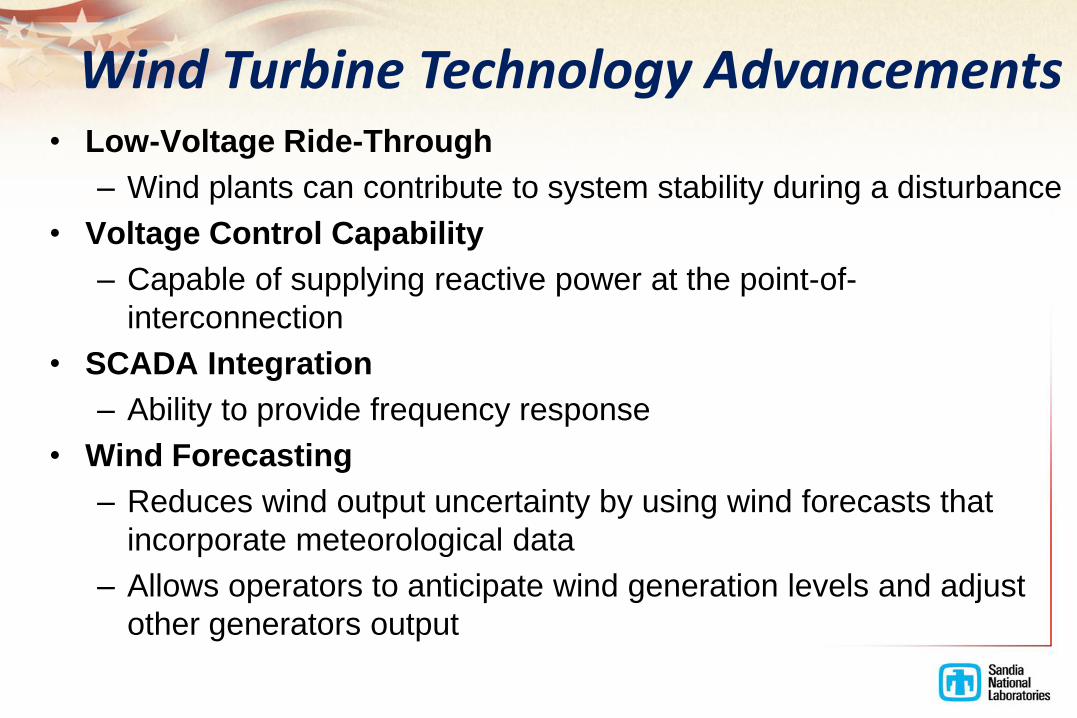
• Low-Voltage Ride-Through
– Wind plants can contribute to system stability during a disturbance
• Voltage Control Capability
– Capable of supplying reactive power at the point-of-
interconnection
• SCADA Integration
– Ability to provide frequency response
• Wind Forecasting
– Reduces wind output uncertainty by using wind forecasts that
incorporate meteorological data
– Allows operators to anticipate wind generation levels and adjust
other generators output
Wind Turbine Technology Advancements
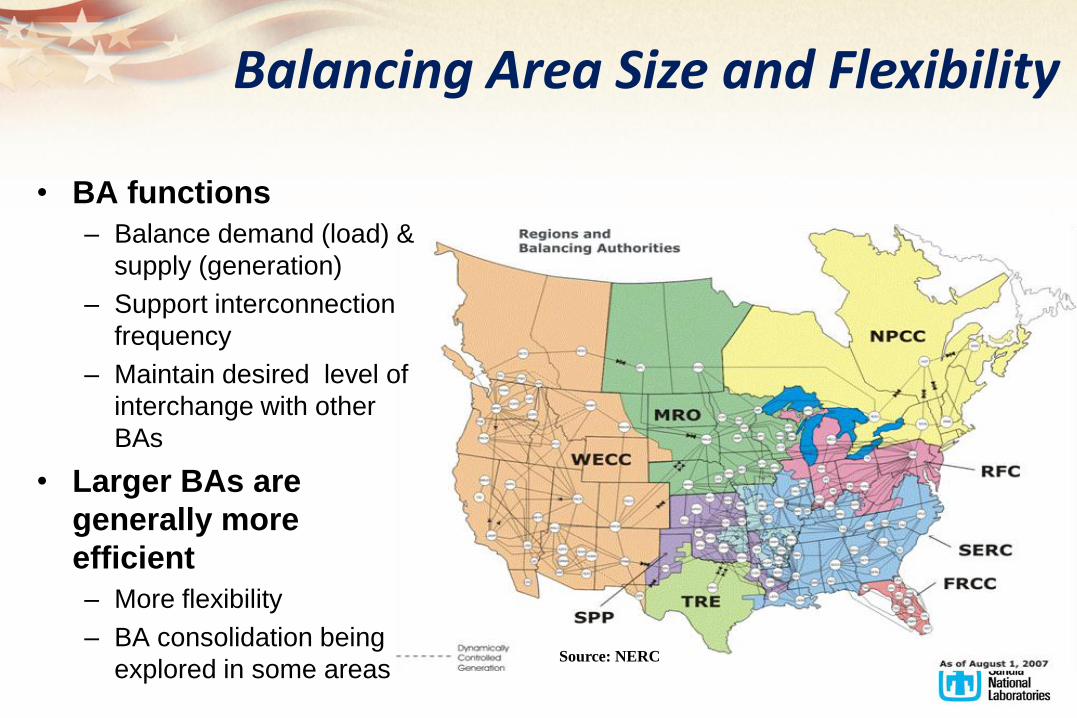
• BA functions
– Balance demand (load) &
supply (generation)
– Support interconnection
frequency
– Maintain desired level of
interchange with other
BAs
• Larger BAs are
generally more
efficient
– More flexibility
– BA consolidation being
explored in some areasSource: NERC
Balancing Area Size and Flexibility

• Substantially reduces short-term and long term variability
Geographic Diversity
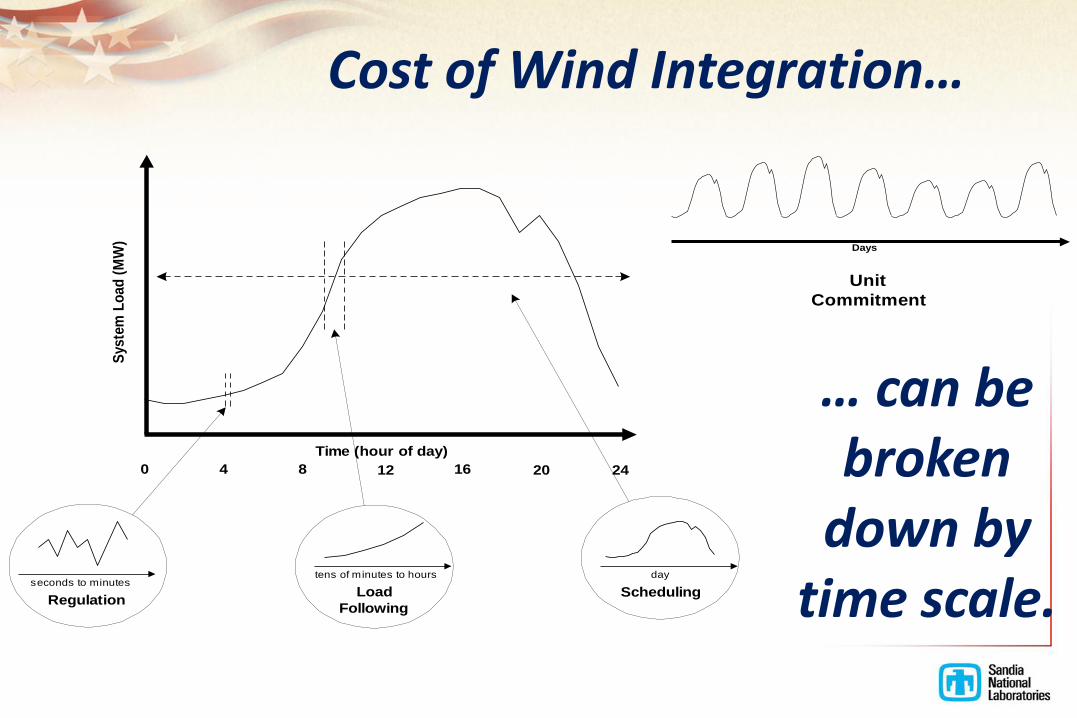
Time (hour of day)
0 4 8 12 16 20 24
Syste
m L
oad
(M
W)
seconds to minutes
Regulation
tens of minutes to hours
Load
Following
day
Scheduling
Days
Unit
Commitment
Cost of Wind Integration…
… can be broken
down by time scale.

Date Study Wind Capacity
Penetration (%)
Regulation
Cost ($/MWh)
Load Following
Cost ($/MWh)
Unit Commit-
ment Cost
($/MWh)
Gas Supply
Cost
($/MWh)
Tot Oper. Cost
Impact
($/MWh)
May 03 Xcel-UWIG 3.5 0 0.41 1.44 na 1.85
Sep 04 Xcel-MNDOC 15 0.23 na 4.37 na 4.60
June 06 CA RPS 4 0.45* trace na na 0.45
Feb 07 GE/Pier/CAIAP 20 0-0.69 trace na*** na 0-0.69***
June 03 We Energies 4 1.12 0.09 0.69 na 1.90
June 03 We Energies 29 1.02 0.15 1.75 na 2.92
2005 PacifiCorp 20 0 1.6 3.0 na 4.60
April 06 Xcel-PSCo 10 0.20 na 2.26 1.26 3.72
April 06 Xcel-PSCo 15 0.20 na 3.32 1.45 4.97
Dec 06 MN 20% 31** 4.41**
Jul 07 APS 14.8 0.37 2.65 1.06 na 4.08
* 3-year average; total is non-market cost
** highest integration cost of 3 years; 30.7% capacity penetration corresponding to 25% energy penetration;
24.7% capacity penetration at 20% energy penetration
*** found $4.37/MWh reduction in UC cost when wind forecasting is used in UC decision
Source: UWIG
Cost of Wind Integration is<0.5 cents/kWh

• Grid Integration of wind has technical and cost impacts– Reasonable 25% penetration level by energy
– Dedicated “backup generation” or storage not required
• Things that can be done to reduce impacts– Geographical diversity
– Better forecasting and implementation in operations
– Larger balancing areas
– More flexibility with generation (and load)
– Perform detailed wind integration studies
Grid Issues: Summary

WHAT DO PEOPLE REALLY CARE
ABOUT?
Energy Overview - 59
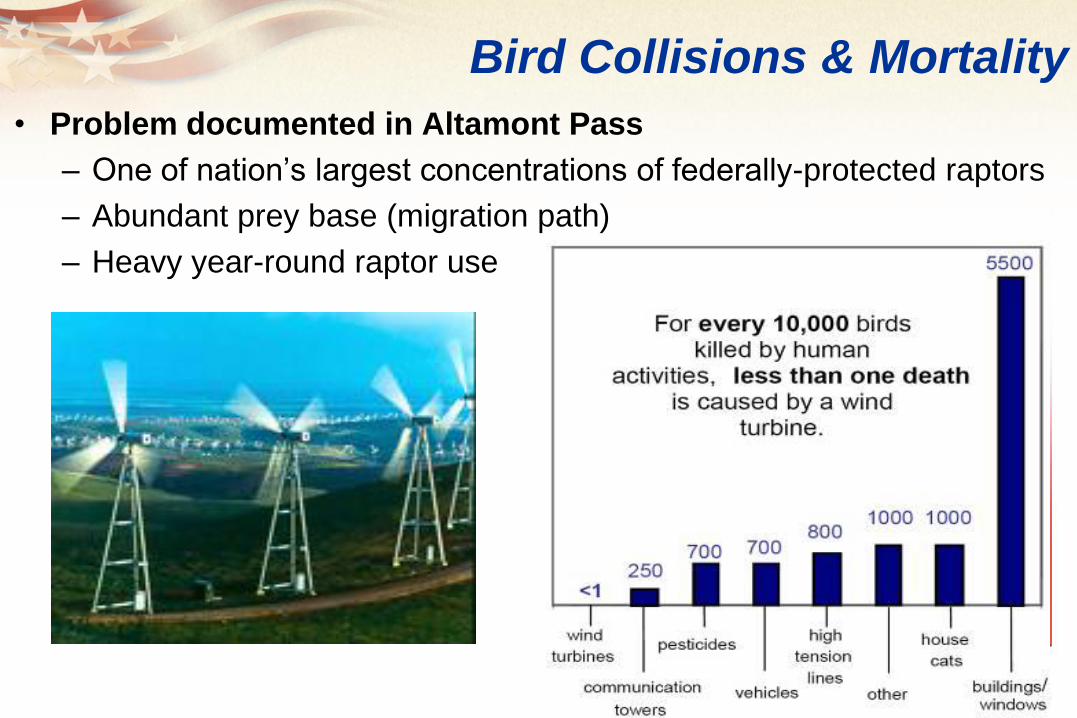
Bird Collisions & Mortality
• Problem documented in Altamont Pass
– One of nation’s largest concentrations of federally-protected raptors
– Abundant prey base (migration path)
– Heavy year-round raptor use
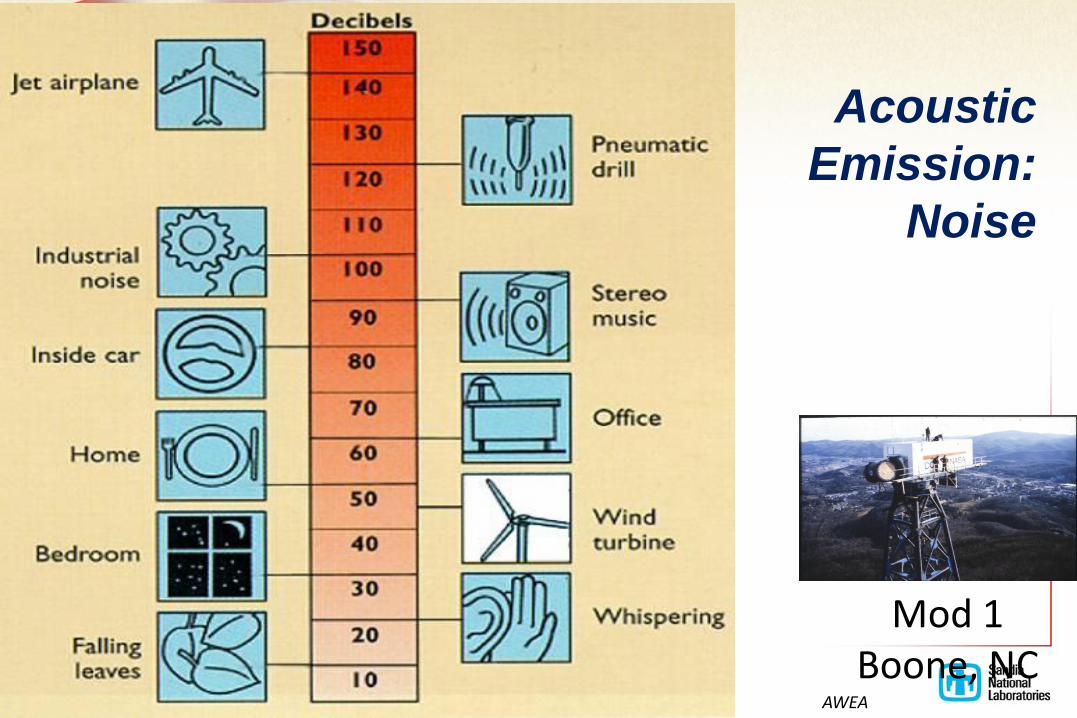
Acoustic
Emission:
Noise
AWEA
Mod 1Boone, NC
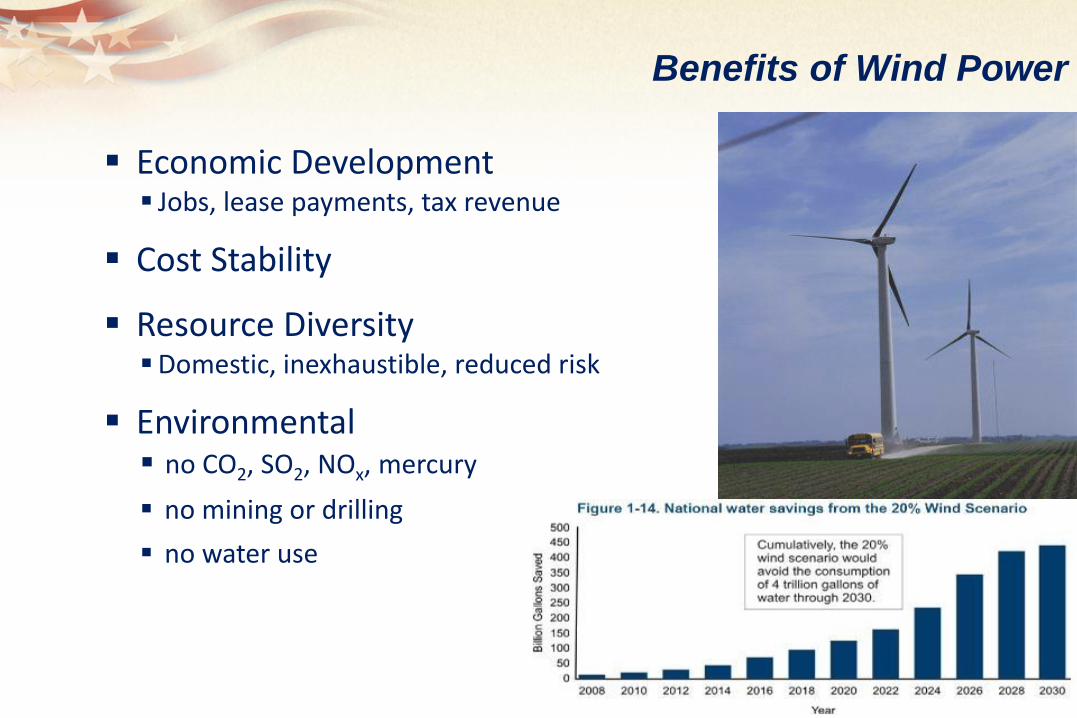
Benefits of Wind Power
Economic Development Jobs, lease payments, tax revenue
Cost Stability
Resource DiversityDomestic, inexhaustible, reduced risk
Environmental no CO2, SO2, NOx, mercury
no mining or drilling
no water use
A complete portfolio of supply options: renewables, fossil, nuclear
Highly efficient and environmentally benign technologies
Fault-tolerant, self-healing infrastructures
Enhance physical and cyber security and safety
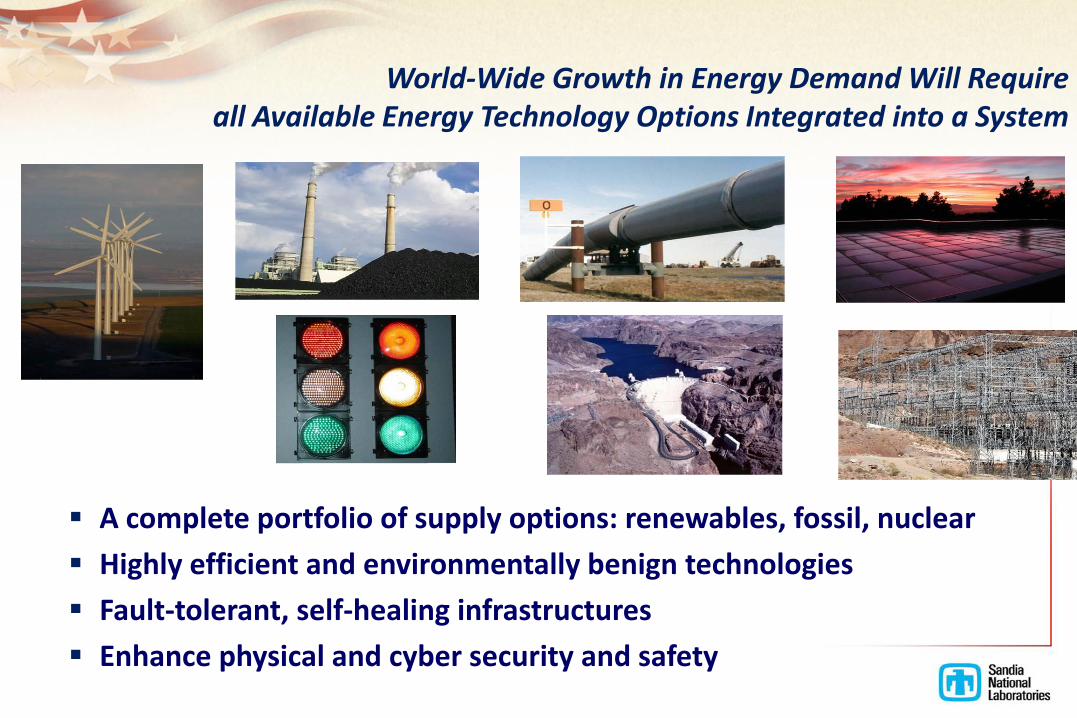
World-Wide Growth in Energy Demand Will Require all Available Energy Technology Options Integrated into a System

Energy Overview - 64
Questions?The view from 250 feet…
… is encouraging