Embed Size (px)
Citation preview

Overview of the service and
validation of the database
A part of BMT in Energy and Environment
Reference: RP_A870
Date: February 2017
www.waveclimate.com

BMT ARGOSS Overview of the service and validation of the database _____________________________________________________________________________________________________
_______________________________________________________________________________________________________
A870 February 2017 © BMT ARGOSS
Document status sheet
Title : Overview of the service and validation of the database
Reference : RP_A870
Issue : 12
Date : February, 2017
Author(s) : Peter Groenewoud
Reviewed by : Cees de Valk, Martin Williams
Revision history:
Issue Date Comment
12 February 2017 Model upgrade. Separate report on model data validation 1979-2013.
11 June 2011 Updated model data validation 1992-2009. Re-organised this report.
10 April 2010 Included satellite data 2009 in the validation
9 June 2009 Included satellite data 2008 in the validation
8 May 2008 Included satellite data 2007 in the validation
7 June 2007 Included satellite data 2006 in the validation
6 May 2006 Included satellite data 2005 and model data 1992-2004 in the validation
5 June 2005 Included satellite data 2004 in the validation
4 April 2004 Included satellite data 2003 in the validation; model data 1998-2002
3 October 2003 Introduced model hindcast data 1998-1999
2 April 2002 Included satellite data 2001 in the validation
1 October 2001 Validation of the initial version of the satellite database
More information on versions can be found online at the history page of waveclimate.com.
There are separate documents on model validation and the shallow water wave ray model.

BMT ARGOSS Overview of the service and validation of the database _____________________________________________________________________________________________________
_______________________________________________________________________________________________________
A870 February 2017 © BMT ARGOSS
Contents
1. INTRODUCTION ............................................................................................................................. 3
1.1. OBJECTIVES OF THIS DOCUMENT .................................................................................................. 3
1.2. EXECUTIVE SUMMARY ................................................................................................................. 3
1.3. THE ONLINE SERVICE IN RELATION TO IN-HOUSE CONSULTANCY ..................................................... 5
1.4. FITNESS FOR USE OF THE ONLINE SERVICE ................................................................................... 6
1.5. STRUCTURE OF THIS DOCUMENT .................................................................................................. 7
2. OVERVIEW OF WAVECLIMATE.COM .......................................................................................... 8
2.1. CONTENT OF THE DATABASE ........................................................................................................ 8
2.2. DATA PROCESSING ...................................................................................................................... 8
2.3. DATA ACCURACY ......................................................................................................................... 9
2.4. CLIMATE STATISTICS PROVIDED BY THE ONLINE SERVICE ............................................................. 10
3. ALTIMETER AND SCATTEROMETER DATA ............................................................................. 11
3.1. ERROR STATISTICS OF RAW SATELLITE DATA PER MISSION AND PER YEAR .................................... 11
3.2. CALIBRATION OF SATELLITE DATA WITH BUOYS ........................................................................... 15
3.3. CALIBRATION COEFFICIENTS FOUND FOR SATELLITE DATA ........................................................... 17
3.4. ERROR STATISTICS OF SATELLITE DATA AFTER CALIBRATION WITH BUOYS .................................... 18
4. SAR DATA .................................................................................................................................... 22
4.1. ERROR STATISTICS OF RAW SAR DATA PER REGION ................................................................... 22
4.2. CALIBRATION OF SAR DATA ...................................................................................................... 24
APPENDICES ....................................................................................................................................... 26
APPENDIX A- BUOYS USED FOR VALIDATION .............................................................................. 27
APPENDIX B- PARAMETERS USED FOR ERROR STATISTICS ..................................................... 29
APPENDIX C- FRAME OF REFERENCE ............................................................................................ 31

BMT ARGOSS Overview of the service and validation of the database _____________________________________________________________________________________________________
_______________________________________________________________________________________________________
A870 February 2017 © BMT ARGOSS
List of tables
Table 1 Wind and sea state data contained in the global data base at BMT ARGOSS. ........................ 8 Table 2 Accuracy of satellite and wave model wave height provided by the online service. ................. 9 Table 3 Accuracy of satellite and wave model wind speed provided by the online service. .................. 9 Table 4 Available products and corresponding data sources. ............................................................. 10 Table 5 Error statistics of raw wave height from altimeter based on all buoys. .................................... 11 Table 6 Error statistics of raw wind speed from altimeter based on all buoys. ..................................... 12 Table 7 Error statistics of raw wind speed from scatterometer based on all buoys. ............................. 12 Table 8 Error statistics of raw wave height from Topex altimeter based on all buoys. ......................... 13 Table 9 Error statistics of raw wind speed from Topex altimeter based on all buoys. .......................... 13 Table 10 Calibration coefficients found for wave height from altimeter based on all buoys. ................ 17 Table 11 Calibration coefficients found for wind speed from altimeter based on all buoys. ................. 17 Table 12 Calibration coefficients found for wind speed from scatterometer based on all buoys. ......... 17 Table 13 Error statistics of calibrated wave height from altimeter based on all buoys. ........................ 18 Table 14 Error statistics of calibrated wind speed from altimeter based on all buoys. ......................... 18 Table 15 Error statistics of calibrated wind speed from scatterometer based on all buoys. ................. 18 Table 16 Statistics of raw wave height based on SAR/ECMWF spectra per region. ........................... 22 Table 17 Statistics of raw mean period based on SAR/ECMWF spectra per region............................ 22 Table 18 Statistics of raw zero-crossing period based on SAR/ECMWF spectra period per region. ... 23 Table 19 Statistics of raw height of long waves based on SAR/ECMWF spectra per region. .............. 23 Table 20 List of NOAA buoys used for validation of satellite data. ...................................................... 28

BMT ARGOSS Overview of the service and validation of the database _____________________________________________________________________________________________________
_______________________________________________________________________________________________________
A870 February 2017 © BMT ARGOSS
List of figures
Figure 1 Global and regional hindcast models........................................................................................ 3 Figure 2 Location and average significant wave height of NOAA buoys. ............................................... 4 Figure 3 Bias and STD of error of raw wave height per year of Topex altimeter and all buoys. .......... 13 Figure 4 Bias and STD of error of raw wind speed per year of GFO altimeter and all buoys. ............. 14 Figure 5 Bias and STD of error of raw wave height per year of GFO altimeter and all buoys. ............ 14 Figure 6 Least squares fit of raw wave height for Topex altimeter and all buoys. ................................ 16 Figure 7 Bias and STD of error of raw wave height per year of GFO altimeter and all buoys. ............ 19 Figure 8 Bias and STD of error of corrected wave height per year of GFO altimeter and all buoys. ... 19 Figure 9 Least squares fit of raw wave height for Ers-1 altimeter and all buoys. ................................. 20 Figure 10 Least squares fit of corrected wave height for Ers-1 altimeter and all buoys. ...................... 20 Figure 11 Least squares fit of raw wind speed for Jason-2 altimeter and all buoys. ............................ 21 Figure 12 Least squares fit of corrected wind speed for Jason-2 altimeter and all buoys. ................... 21

BMT ARGOSS Overview of the service and validation of the database _____________________________________________________________________________________________________
_______________________________________________________________________________________________________
A870 February 2017 © BMT ARGOSS Page 3
1. Introduction
1.1. Objectives of this document
Our internet service www.waveclimate.com provides worldwide wave and wind climate
information based on wave model computations and satellite measurements stored in a
database at BMT ARGOSS. This report gives an overview of fitness for use and the products
of the online service and of the processing and quality of the model and satellite data stored
in the database. The waveclimate.com database covers the period 1992 to present.
There’s a separate wave model validation document.
1.2. Executive summary
At BMT ARGOSS metocean consultancy products and related web services are primarily
based on hindcast data from our in-house database, currently covering the years 1979-2016.
BMT ARGOSS runs a global wave hindcast model in all major ocean basins as well as local models in semi-closed basins such as the Mediterranean (see Figure 1 below).
Figure 1 Global and regional hindcast models.
Wave model data are calibrated with satellite data to remove any systematic error. The
satellite data are calibrated with buoy data. The positive effect of this calibration is
substantiated by comparing the model data to “true” buoy measurements before and after the
calibration with satellite data.
With reference to buoys, it is demonstrated that the quality of satellite data has increased
after each step of the processing chain: the relative error in wave height is reduced from 15%
to 11%. The resulting ‘best’ satellite wave height and wind speed observations are practically

BMT ARGOSS Overview of the service and validation of the database _____________________________________________________________________________________________________
_______________________________________________________________________________________________________
A870 February 2017 © BMT ARGOSS Page 4
un-biased. Proof is given that, with reference to buoys, calibration with these ‘best’ satellite
observations does indeed improve the quality of our wave model.
Basic processing of satellite data is performed under the responsibility of the space agencies
that supply the data. Sensors are altimeter (measuring significant wave height and wind
speed), scatterometer (measuring the wind vector) and SAR Wave Mode (providing spectral
wave information such as periods and directions). Satellites include GeoSat, ERS-1/2,
Topex/Poseidon, GFO, Jason-1/2, Envisat, Quikscat and MetOp-A.
Buoy observations come from deep-water NOAA buoys around North America and Hawaii
shown below in Figure 2.
Figure 2 Location and average significant wave height of NOAA buoys.
Validation and, if necessary, calibration of wind and wave data in the database is done by
BMT ARGOSS after each update of the database, usually once a year.

BMT ARGOSS Overview of the service and validation of the database _____________________________________________________________________________________________________
_______________________________________________________________________________________________________
A870 February 2017 © BMT ARGOSS Page 5
1.3. The online service in relation to in-house consultancy
The Waveclimate.com online service was developed to provide easily obtainable, “entry level”
metocean information for situations where the user does not need detailed expert analysis.
Note: as stated on the service website the user should always consider whether a more
extensive appraisal is appropriate, in which case BMT ARGOSS’ metocean specialists can
assist.
As demonstrated in this document, BMT ARGOSS carries out a level of automated quality
control, validation and calibration of the data underpinning the online service, that is
systematic, robust and commensurate with the above service objective. It is for the user to
decide whether or not this automated processing is sufficient for his needs (if in doubt through
direct contact with BMT ARGOSS), but to assist in the decision-making process this section
describes some key differences in methods and tools used in the online service and in the
more detailed consultancy projects.
The online service provides information about the “normal” climate only and use of
the online data for extreme value analysis is not advised, particularly if no additional
site specific calibration is carried out. BMT ARGOSS’ metocean experts routinely
undertake this work in consultancy projects, and can provide advice and assistance.
Information on tropical storms is not provided in waveclimate.com. Satellite sampling
of tropical storms is sporadic and very high wind speeds and wave heights in affected
areas (e.g. Central America and the USA, the western Pacific) are unreliable. These
events are also not well represented in model hindcast data (other than dedicated
storm hindcasts). Waveclimate.com issues a warning when an area has been
selected where tropical storms occur; in such cases the user should contact BMT
ARGOSS for a more detailed analysis based on storm track data not available via the
online service.
Waveclimate.com provides model data for the global grid (0.5°x0.5°), the
Mediterranean, the Black Sea, the Red Sea, the Caspian Sea and the Persian Gulf
(1/4°x1/4°). High resolution EU shelf data (1/6° x 1/6°) is available for use out with the
online service.
The online service uses a traditional method to distinguish wind-sea and swell
components of a sea state. The wind-sea part of the wave spectrum is represented
by a Donnellan-Pierson spectrum and thus related to the corresponding wind. For
consultancy, wave steepness is used to separate wind-sea and swell: a distinct peak
of the wave spectrum with steepness above 0.03 will be classified as wind-sea.
Normally, at most two distinct spectral peaks are taken into consideration and
classified as either swell or wind-sea; additional swell peaks can be resolved if
required, for example off West Africa.
Altimeter and scatterometer data available through the online service are calibrated
separately for each mission, resulting in relative errors of 12% for altimeter wave
height and 15% for scatterometer wind speed after calibration with buoys (Table 2
and Table 3 in section 2.3). Recently, we created an improved set of satellite data
that we use to calibrate the wave model data available online; we also use this new
set of satellite data for consultancy. This improvement involves more advanced
processing of altimeter data such as spike removal and the creation of one set of
altimeter data consistent over time. Altimeter data from all missions are calibrated

BMT ARGOSS Overview of the service and validation of the database _____________________________________________________________________________________________________
_______________________________________________________________________________________________________
A870 February 2017 © BMT ARGOSS Page 6
with a ‘master’ satellite, merged and then calibrated with buoys. The relative error in
the resulting ‘best’ altimeter wave height now reduces to 11%
As noted above, consultancy projects provide BMT ARGOSS metocean specialists
with the opportunity to undertake more detailed analyses than are carried out for the
Waveclimate.com service. These projects are planned in consultation with the client
and may include, for example, additional calibration using site specific, in-situ
measurements, extreme value analysis and the derivation of metocean conditions
(particularly waves) in sheltered or shallow water locations.
The use of the shallow water models available through the online service also
requires a certain level of expertise, for instance the choice of the offshore boundary
for the wave ray model and pragmatic interpretation of the results.
To optimise the web site performance, waveclimate.com
Calibrates integrated wave model parameters (significant wave height and wave
period- see section 4.2), whereas in a typical project the wave spectra are calibrated
and hence all wave parameters, including direction are adjusted.
Retrieves encoded and compressed wave spectra from binary files; one file contains
the complete time series for one grid point. Compression introduces minor loss of
accuracy.
Does not append a high-frequency tail to the wave spectrum. As a consequence,
zero-crossing wave period in waveclimate.com is up to 10% higher in wind-sea
dominated areas.
Uses 25 spectral frequencies and 12 spectral directions, whereas 30 frequency and
24 direction bins are routinely analysed in consultancy projects.
1.4. Fitness for use of the online service
The information provided through waveclimate.com is intended for the preliminary appraisal of
metocean conditions, and without additional verification is not appropriate for engineering
design. If you are in any doubt as to the suitability of the information for your purpose, or you
would like to discuss more extensive metocean services, please contact us
([email protected]) and an experienced metocean advisor will be pleased to assist you.
Please also take note of the following important guideline for use of waveclimate.com:
The offshore climate data represent the average climate over the selected area or at the
selected location, so they are suitable for fully exposed sites in deep water. The
nearshore climate option, preferably the wave ray model, should be used wherever
sheltering occurs and on shallow water.
The shallow water models are meant to be applied in coastal areas of limited size, say of
up 200 kilometres wide. Translating offshore wave conditions over greater distances
might frustrate (better) wave propagation of the global model.

BMT ARGOSS Overview of the service and validation of the database _____________________________________________________________________________________________________
_______________________________________________________________________________________________________
A870 February 2017 © BMT ARGOSS Page 7
1.5. Structure of this document
In chapter 2 an overview given of the content of the global database, data processing and,
based on these data, products offered by the online service. The processing and accuracy of
altimeter and scatterometer satellite data presented by waveclimate.com are explained in
chapter 3. SAR data is addressed in chapter 4.
In the appendices A-C, detailed information is given concerning the set of buoys used (A), the
parameters used for the error statistics (B) and wind parameters mentioned in this report (C).

BMT ARGOSS Overview of the service and validation of the database _____________________________________________________________________________________________________
_______________________________________________________________________________________________________
A870 February 2017 © BMT ARGOSS Page 8
2. Overview of waveclimate.com
The content of the database, data processing, data accuracy and the products offered by the
online service are explained in the next sections.
2.1. Content of the database
The global database contains the wind and sea state data listed in Table 1 below.
Variable Wave hindcast model Grid Period covered
Wave spectral density and mean
direction per frequency band,
together with coincident wind
speed and direction
Global third generation
wave model Wavewatch III
driven by CFSR surface
wind analyses
See FAQs question / answer A01062802
Wave spectral density and mean
direction per frequency band,
together with coincident wind
speed and direction
Regional third generation
wave model Wavewatch III
driven by CFSR surface
wind analyses
Variable Satellite Sensor Satellite Period covered
Significant wave height Radar altimeter See FAQs question / answer A01062802
Significant wave height and wind
speed
Radar altimeter
Wind speed and direction Scatterometer
Wave spectral density and mean
direction per frequency band,
together with coincident wind
speed and direction
Synthetic aperture radar
(SAR) and scatterometer
Table 1 Wind and sea state data contained in the global data base at BMT ARGOSS.
2.2. Data processing
Data processing concerns quality control, correction and calibration as explained in chapter 3-
4 in this report. In summary:
Ambiguity in scatterometer wind direction has been removed at the supplying agency
by applying constraints on the spatial characteristics of the output wind field, such as
on rotation and divergence. At BMT ARGOSS, initial quality control of altimeter
(significant wave height and wind speed) and scatterometer (wind speed and
direction) data from our suppliers involves various automated procedures such as
range checks, checks for error flags, detection of outliers, check for consistency
between wind speed and wave height and for consistency in space. Next, significant
wave height (altimeter) and wind speed (altimeter and scatterometer) are corrected
for bias for each mission separately using in-situ data from buoys obtained from
NOAA and Environment Canada. See chapter 3.

BMT ARGOSS Overview of the service and validation of the database _____________________________________________________________________________________________________
_______________________________________________________________________________________________________
A870 February 2017 © BMT ARGOSS Page 9
SAR spectra with very low signal-to-noise levels and spectral features related to
surface slicks are removed. Some information on short waves, short swells in
particular, is missing in wave spectra retrieved from SAR spectra. This information is
obtained from ECMWF global wave model spectra. In the wave climate data
products, significant wave heights and wave periods derived from SAR data are
calibrated on-the-fly using altimeter wave height observations obtained over the same
area. See chapter 4.
Calibration coefficients for the wave model are determined offline for each model
point using the improved set of altimeter and scatterometer data (based on but
different from the dataset presented by the online service). Calibration coefficients for
wind speed are applied offline by the wave model to the driving winds fields. The
online service applies the calibration coefficients determined for wave height, thus
removing the systematic error from wave height and wave period generated by the
wave model. The creation of the set of satellite data used for model calibration and
the effect of this calibration explained in the wave model validation document.
2.3. Data accuracy
The accuracy of significant wave height and 1-hourly wind speed (at 10m above sea level)
obtained from the data sources in the database (listed in Table 1) is summarised below in
Table 2 and Table 3. Statistics are based on comparisons against buoy data (buoys are
depicted in Figure 2 and listed in Appendix A- Buoys used for validation).
The quality of the data is summarised in terms of the (relative) root-mean-square (RMS) error
explained in Appendix B- Parameters used for error statistics.
The two tables below list averages over the specified period. Apart from SAR wave height,
the figures reported relate to calibrated wave height and wind speed: altimeter and
scatterometer data were calibrated with buoy data before being used for model calibration.
Source Period #Samples Buoy mean (m) RMS error (m) Error (%)
Altimeter 1985-2009 34412 2.16 0.30 12
SAR 1993-2003 1317 2.31 0.44 17
Wave model Please refer to the separate wave model validation document
Table 2 Accuracy of satellite and wave model wave height provided by the online service.
Source Period #Samples Buoy mean (m/s) RMS error (m/s) Error (%)
Altimeter 1992-2009 31651 7.21 1.45 18
Scatterometer 1992-2009 82901 7.10 1.15 15
Wave model Please refer to the separate wave model validation document
Table 3 Accuracy of satellite and wave model wind speed provided by the online service.

BMT ARGOSS Overview of the service and validation of the database _____________________________________________________________________________________________________
_______________________________________________________________________________________________________
A870 February 2017 © BMT ARGOSS Page 10
2.4. Climate statistics provided by the online service
Statistical information is provided about the overall sea state (significant wave height, zero-
crossing wave period, mean wave period, peak period, mean wave direction) but also about
wind-sea only, or swell only. Wind-sea consists of the waves having crests moving no faster
than 1.2 times the wind speed, so they are growing. Longer, and therefore faster moving,
waves are called “swell”. Statistics of wind-sea and swell are derived from SAR and wave
model data.
The wave climate can be derived offshore, i.e. at a fully exposed location or area in relatively
deep water, or nearshore, where the water is shallow and sheltering might occur. Translation
of offshore wave conditions to any nearshore location of interest can be done with a very
simple model or with a more advanced wave ray model.
The wind and wave climate can be also determined for a particular season or month of
interest.
The table below indicates the various products which can be provided and the source of the
data from which the products are derived.
Product for waves and wind Source of data
Offshore Nearshore
Monthly distribution
Wave height (total sea state only) Hindcast/altimeter Hindcast
Wind speed Hindcast/altimeter Hindcast
Histogram
Wave height Hindcast/altimeter Hindcast
Wave period Hindcast/SAR Hindcast
Wind speed Hindcast/altimeter Hindcast
Scatter diagram 2D
Wave height vs. wave direction Hindcast/SAR Hindcast
Wave height vs. wave period Hindcast/SAR Hindcast
Wave height vs. wind speed Hindcast/altimeter Hindcast
Wind speed vs. wind direction Hindcast/scatterometer Hindcast
Scatter diagram 3D
Wave height vs. wave period per wave direction sector Hindcast Hindcast
Wave height vs. wind speed per wind direction sector Hindcast Hindcast
Wave height vs. wave period per wind speed class Hindcast Hindcast
Persistency Analysis
Wind speed, wave height and wave period Hindcast Hindcast
Time series
Wind speed, wave height, wave direction and wave period Hindcast Hindcast
Table 4 Available products and corresponding data sources.

BMT ARGOSS Overview of the service and validation of the database _____________________________________________________________________________________________________
_______________________________________________________________________________________________________
A870 February 2017 © BMT ARGOSS Page 11
3. Altimeter and scatterometer data
The set of altimeter and scatterometer satellite data described in this chapter is available via
waveclimate.com. This dataset currently covers the years 1985-2015. Validation results of
altimeter are based on co-located altimeter and buoy data from Jan 1985 until Dec 2009. For
scatterometer, results are based on data from Mar 1992 until Dec 2009. Comparison is done
separately for the different missions. Satellite data from SAR is described in the next chapter.
The parameters compared to buoy observations are significant wave height (from altimeter)
and wind speed (from scatterometer and altimeter). First, error statistics of altimeter and
scatterometer data before calibration with buoy data are addressed per mission and per year
(paragraph 3.1). Next, the calibration method is explained (3.2) and the calibration coefficients
found for each mission are given (3.3). Finally, error statistics of the satellite data after
calibration with buoy data are presented (3.4).This set of satellite data calibrated per mission
with buoys is used by the online service.
3.1. Error statistics of raw satellite data per mission and per year
Error statistics per mission
Below, the quality of the raw significant wave height obtained by the altimeters of the various
satellites is summarised. The Topex/Poseidon and the Geosat satellites deliver the most
accurate wave height estimates. Ers-1 altimeter data is somewhat less accurate. Table 5
shows the quality of the raw wave height obtained by the altimeters of the various satellites.
Satellite No. of samples
Buoy Mean [m]
STD Error [m]
Correlation Coefficient
[-]
Relative RMSE
[%]
Bias
[m]
Topex 7696 2.30 0.26 0.98 10 –0.02
Poseidon 524 2.27 0.32 0.97 12 0.02
Geosat 1598 2.31 0.29 0.97 11 -0.03
Ers-1 2706 2.35 0.37 0.96 22 -0.46
Ers-2 7433 2.07 0.36 0.96 16 –0.16
Jason-1 5421 2.05 0.31 0.96 14 –0.08
GFO 3849 2.17 0.26 0.98 14 –0.23
Envisat 4241 2.06 0.27 0.98 12 0.07
Jason-2 944 1.95 0.31 0.96 14 -0.03
Table 5 Error statistics of raw wave height from altimeter based on all buoys.
Raw wind speed is most reliably estimated by Quikscat and the Ers scatterometers. Wind
speed from Geosat altimeter is much less accurate than wind speed from other sources.
Therefore, Geosat wind speed is not used by the online service Table 6 and Table 7 show the
quality of the raw wind speed obtained by the various missions.

BMT ARGOSS Overview of the service and validation of the database _____________________________________________________________________________________________________
_______________________________________________________________________________________________________
A870 February 2017 © BMT ARGOSS Page 12
Satellite No. of samples
Buoy Mean [m/s]
STD Error [m/s]
Correlation Coefficient
[-]
Relative RMSE
[%]
Bias [m/s]
Topex 7696 7.50 1.55 0.91 19 0.06
Poseidon 524 7.86 1.70 0.90 20 0.10
Geosat 1598 7.74 2.47 0.77 30 -0.69
Ers-1 2706 7.82 1.59 0.91 19 -0.51
Ers-2 7433 7.05 1.57 0.91 21 –0.37
Jason-1 5421 6.99 1.47 0.91 19 –0.21
GFO 3849 7.01 1.43 0.93 19 0.37
Envisat 4241 6.98 1.37 0.92 18 0.12
Jason-2 944 6.84 1.55 0.90 22 0.64
Table 6 Error statistics of raw wind speed from altimeter based on all buoys.
Satellite No. of samples
Buoy Mean [m/s]
STD Error [m/s]
Correlation Coefficient
[-]
Relative RMSE
[%]
Bias [m/s]
Ers-1 9402 7.85 1.20 0.94 15 -0.54
Ers-2 8778 7.46 1.15 0.94 16 -0.56
Quikscat 64721 6.94 1.14 0.94 15 0.25
Table 7 Error statistics of raw wind speed from scatterometer based on all buoys.
Error statistics per year
We also analysed the statistics per satellite-sensor combination per year for all buoys in order
to search for irregularities over time. We provide some examples to illustrate the procedure.
Bias (satellite observation minus buoy observation) and standard deviation of the error in raw
Topex wave height is depicted below.

BMT ARGOSS Overview of the service and validation of the database _____________________________________________________________________________________________________
_______________________________________________________________________________________________________
A870 February 2017 © BMT ARGOSS Page 13
Figure 3 Bias and STD of error of raw wave height per year of Topex altimeter and all buoys.
From the figure above, we see that the bias in Topex raw wave height increases significantly
in 1998. This appears to be caused by a performance degradation of the chirp generator. A
switchover to the backup altimeter was successfully realised on Feb 9, 1999. Therefore, we
derived separate calibration coefficients for 1998 for wave height and wind speed from Topex.
Table 8 and Table 9 show the error statistics of Topex data for 1998 and for the years 1992-
2005, excluding 1998.
Period No. of samples
Buoy Mean [m]
STD Error [m]
Correlation Coefficient
[-]
Relative RMSE
[%]
Bias
[m]
1998 498 2.41 0.32 0.97 14 0.21
1992 – 2005 (excl. 1998)
7198 2.29 0.25 0.98 10 –0.04
Table 8 Error statistics of raw wave height from Topex altimeter based on all buoys.
Period No. of samples
Buoy Mean [m/s]
STD Error [m/s]
Correlation Coefficient
[-]
Relative RMSE
[%]
Bias
[m/s]
1998 498 7.96 1.45 0.91 17 0.12
1992 - 2005 (excl. 1998)
7198 7.46 1.59 0.91 19 0.05
Table 9 Error statistics of raw wind speed from Topex altimeter based on all buoys.
The quality of wind speed measured by Geosat follow-on (GFO) deteriorates as of 2007 as
shown below in Figure 4. For this reason, the online service only uses GFO wind speed from
the years 2002-2006.

BMT ARGOSS Overview of the service and validation of the database _____________________________________________________________________________________________________
_______________________________________________________________________________________________________
A870 February 2017 © BMT ARGOSS Page 14
Figure 4 Bias and STD of error of raw wind speed per year of GFO altimeter and all buoys.
The next plot does show however that wave height observations from GFO are reliable for all
years.
Figure 5 Bias and STD of error of raw wave height per year of GFO altimeter and all buoys.

BMT ARGOSS Overview of the service and validation of the database _____________________________________________________________________________________________________
_______________________________________________________________________________________________________
A870 February 2017 © BMT ARGOSS Page 15
3.2. Calibration of satellite data with buoys
Least square fits (see Figure 6 below) of linear relationships between raw satellite data and
buoy data of wave height and wind speed were determined per satellite-sensor pair. Satellite
data are on the vertical axis, buoy data on the horizontal axis. For reference, we also plotted
the ‘y=x’ line and the sorted satellite observations against the sorted buoy observations.
The fitting procedure applied is Total Least Squares, minimising the sum of squares of the
residuals measured orthogonal to the fitted line. Minimising distances in y-direction only, e.g.
assuming noise in satellite data only, proved to be sensitive to switching x and y, indicating
that this procedure would result in seriously biased estimates.

BMT ARGOSS Overview of the service and validation of the database _____________________________________________________________________________________________________
_______________________________________________________________________________________________________
A870 February 2017 © BMT ARGOSS Page 16
The figure below (Figure 6) shows the fit of raw Topex wave height against buoy
measurements.
Figure 6 Least squares fit of raw wave height for Topex altimeter and all buoys.
Calibration coefficients derived from these fits, i.e. slope () and intercept (), were found per
satellite-sensor combination in order to calibrate the raw satellite data:
raw
i
corrected
i HH
The use of non-linear curve fitting did not improve the fits significantly. Note that (the
smoothed version of) the sorted satellite versus buoy observations curve is such a non-linear
curve.

BMT ARGOSS Overview of the service and validation of the database _____________________________________________________________________________________________________
_______________________________________________________________________________________________________
A870 February 2017 © BMT ARGOSS Page 17
3.3. Calibration coefficients found for satellite data
Calibration coefficients for Topex are taken year-dependent. For the other satellites,
calibrations are valid for all relevant years. The following calibration coefficients were found:
Satellite Period [-] [m]
Topex 1998 1.07 -0.40
Topex 1992-2005 excl. 1998
1.06 –0.09
Poseidon 1992-2002 1.02 -0.05
Geosat 1985-1989 0.98 0.09
Ers-1 1991-1996 1.14 0.20
Ers-2 1995-2009 1.06 0.04
Jason-1 2002-2009 1.05 –0.03
GFO 2002-2008 1.08 0.07
Envisat 2003-2009 1.05 -0.19
Jason-2 2008-2009 1.02 -0.00
Table 10 Calibration coefficients found for wave height from altimeter based on all buoys.
Satellite Period [-] [m]
Topex 1998 1.00 -0.15
Topex 1992-2005 excl. 1998
0.93 0.51
Poseidon 1992-2002 0.95 0.34
Geosat 1985-1989 0.94 1.11
Ers-1 1991-1996 1.03 0.27
Ers-2 1995-2009 0.90 1.03
Jason-1 2002-2009 0.93 0.66
GFO 2002-2006 0.87 0.61
Envisat 2003-2009 0.95 0.22
Jason-2 2008-2009 0.88 0.23
Table 11 Calibration coefficients found for wind speed from altimeter based on all buoys.
Satellite Period [-] [m/s]
Ers-1 1992-1996 1.07 0.02
Ers-2 1996-2000 1.06 0.10
Quikscat 2000-2009 1.00 -0.24
Table 12 Calibration coefficients found for wind speed from scatterometer based on all buoys.
We apply the above calibration to the raw satellite data except for Geosat winds. Winds from
Geosat are too inaccurate, so they are not used by the online service. From Table 10-Table
12, we see that calibration increases wave height by up to 14% (for Ers-1 altimeter). They
also confirm that, at least in open sea ares, scatterometer winds are more reliable than
altimeter winds.
BMT ARGOSS Overview of the service and validation of the database _____________________________________________________________________________________________________
_______________________________________________________________________________________________________
A870 February 2017 © BMT ARGOSS Page 18
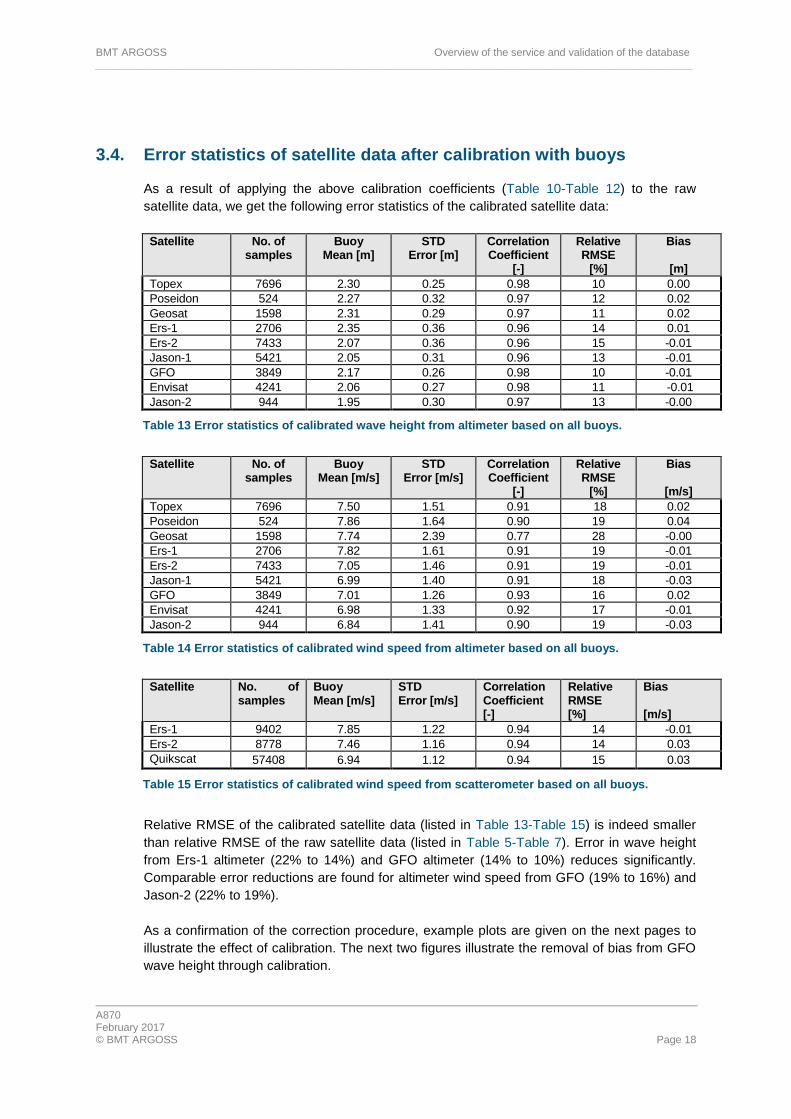
3.4. Error statistics of satellite data after calibration with buoys
As a result of applying the above calibration coefficients (Table 10-Table 12) to the raw
satellite data, we get the following error statistics of the calibrated satellite data:
Satellite No. of samples
Buoy Mean [m]
STD Error [m]
Correlation Coefficient
[-]
Relative RMSE
[%]
Bias
[m]
Topex 7696 2.30 0.25 0.98 10 0.00
Poseidon 524 2.27 0.32 0.97 12 0.02
Geosat 1598 2.31 0.29 0.97 11 0.02
Ers-1 2706 2.35 0.36 0.96 14 0.01
Ers-2 7433 2.07 0.36 0.96 15 -0.01
Jason-1 5421 2.05 0.31 0.96 13 -0.01
GFO 3849 2.17 0.26 0.98 10 -0.01
Envisat 4241 2.06 0.27 0.98 11 -0.01
Jason-2 944 1.95 0.30 0.97 13 -0.00
Table 13 Error statistics of calibrated wave height from altimeter based on all buoys.
Satellite No. of samples
Buoy Mean [m/s]
STD Error [m/s]
Correlation Coefficient
[-]
Relative RMSE
[%]
Bias
[m/s]
Topex 7696 7.50 1.51 0.91 18 0.02
Poseidon 524 7.86 1.64 0.90 19 0.04
Geosat 1598 7.74 2.39 0.77 28 -0.00
Ers-1 2706 7.82 1.61 0.91 19 -0.01
Ers-2 7433 7.05 1.46 0.91 19 -0.01
Jason-1 5421 6.99 1.40 0.91 18 -0.03
GFO 3849 7.01 1.26 0.93 16 0.02
Envisat 4241 6.98 1.33 0.92 17 -0.01
Jason-2 944 6.84 1.41 0.90 19 -0.03
Table 14 Error statistics of calibrated wind speed from altimeter based on all buoys.
Satellite No. of samples
Buoy Mean [m/s]
STD Error [m/s]
Correlation Coefficient [-]
Relative RMSE [%]
Bias [m/s]
Ers-1 9402 7.85 1.22 0.94 14 -0.01
Ers-2 8778 7.46 1.16 0.94 14 0.03
Quikscat 57408 6.94 1.12 0.94 15 0.03
Table 15 Error statistics of calibrated wind speed from scatterometer based on all buoys.
Relative RMSE of the calibrated satellite data (listed in Table 13-Table 15) is indeed smaller
than relative RMSE of the raw satellite data (listed in Table 5-Table 7). Error in wave height
from Ers-1 altimeter (22% to 14%) and GFO altimeter (14% to 10%) reduces significantly.
Comparable error reductions are found for altimeter wind speed from GFO (19% to 16%) and
Jason-2 (22% to 19%).
As a confirmation of the correction procedure, example plots are given on the next pages to
illustrate the effect of calibration. The next two figures illustrate the removal of bias from GFO
wave height through calibration.

BMT ARGOSS Overview of the service and validation of the database _____________________________________________________________________________________________________
_______________________________________________________________________________________________________
A870 February 2017 © BMT ARGOSS Page 19
Figure 7 Bias and STD of error of raw wave height per year of GFO altimeter and all buoys.
Figure 8 Bias and STD of error of corrected wave height per year of GFO altimeter and all buoys.

BMT ARGOSS Overview of the service and validation of the database _____________________________________________________________________________________________________
_______________________________________________________________________________________________________
A870 February 2017 © BMT ARGOSS Page 20
The plots below show fits of Ers-1 wave height and buoy data before and after the calibration.
Figure 9 Least squares fit of raw wave height for Ers-1 altimeter and all buoys.
Figure 10 Least squares fit of corrected wave height for Ers-1 altimeter and all buoys.

BMT ARGOSS Overview of the service and validation of the database _____________________________________________________________________________________________________
_______________________________________________________________________________________________________
A870 February 2017 © BMT ARGOSS Page 21
The effect of the calibration of Jason-2 wind speed is illustrated below.
Figure 11 Least squares fit of raw wind speed for Jason-2 altimeter and all buoys.
Figure 12 Least squares fit of corrected wind speed for Jason-2 altimeter and all buoys.

BMT ARGOSS Overview of the service and validation of the database _____________________________________________________________________________________________________
_______________________________________________________________________________________________________
A870 February 2017 © BMT ARGOSS Page 22
4. SAR data
4.1. Error statistics of raw SAR data per region
The set of SAR satellite data described in this chapter is available via waveclimate.com.
Validation results are based on SAR data and buoy data from Apr 1993 until Jun 2003.
Satellite data from altimeters and scatterometers is described in the previous chapter.
For the validation, the buoys are grouped into 5 geographical regions: Atlantic, Gulf of
Mexico, Newfoundland, Pacific and Hawaii. The wave climate within a region is more or less
uniform. The buoys and regions are depicted in Figure 2 and listed in Appendix A- Buoys
used for validation.
The results of the most important statistic parameters are given for the significant wave
height, mean period and zero-crossing period. The spectral SAR data are especially useful for
wave climates that exhibit large waves (wavelength > 200m and period > 12 sec). Therefore
we also considered the wave height for long waves (wave period exceeds 12 seconds).
The statistics for all buoys and years are collected in the tables below for the merged
SAR/ECMWF spectra.
Atlantic Gulf of Mexico Newfoundland Pacific Hawaii
N 348 193 69 454 313
Mean [m] 1.97 1.29 2.85 2.95 2.25
Bias [m] –0.08 –0.06 0.07 0.04 –0.08
StDev [m] 0.50 0.33 0.59 0.46 0.33
Rrmse [%] 22 22 19 14 14
Corr 0.89 0.92 0.91 0.95 0.88
Table 16 Statistics of raw wave height based on SAR/ECMWF spectra per region.
Atlantic Gulf of Mexico Newfoundland Pacific Hawaii
N 348 193 69 454 313
Mean [s] 7.20 5.92 8.61 9.32 8.80
Bias [s] 0.14 0.34 0.26 0.29 0.21
StDev [s] 0.99 1.60 0.90 0.73 0.63
Rrmse [%] 14 29 11 9 8
Corr 0.68 0.42 0.79 0.93 0.93
Table 17 Statistics of raw mean period based on SAR/ECMWF spectra per region.

BMT ARGOSS Overview of the service and validation of the database _____________________________________________________________________________________________________
_______________________________________________________________________________________________________
A870 February 2017 © BMT ARGOSS Page 23
Atlantic Gulf of Mexico Newfoundland Pacific Hawaii
N 348 193 69 454 313
Mean [s] 5.88 4.95 6.98 7.30 6.80
Bias [s] 0.00 0.01 0.25 0.24 0.14
StDev [s] 0.75 1.27 0.83 0.61 0.53
Rrmse [%] 13 25 13 9 8
Corr 0.70 0.40 0.74 0.92 0.92
Table 18 Statistics of raw zero-crossing period based on SAR/ECMWF spectra period per region.
Atlantic Gulf of Mexico Newfoundland Pacific Hawaii
N 348 193 69 454 313
Mean [m] 0.40 0.17 1.05 1.47 0.94
Bias [m] 0.08 0.13 0.14 0.12 0.03
StDev [m] 0.36 0.22 0.50 0.44 0.30
Rrmse [%] 71 135 41 25 27
Corr 0.64 0.64 0.85 0.94 0.90
Table 19 Statistics of raw height of long waves based on SAR/ECMWF spectra per region.
The best results are obtained in the Pacific and Hawaii and the worst results in the Gulf of
Mexico. This can be explained by the fact that SAR data is especially useful for a wave
climate that includes long waves, which are lacking in the Gulf of Mexico. This is also
reflected by the results in Table 19, i.e. the mean wave height for long waves in the Gulf of
Mexico is a fraction of the mean wave heights for the other regions.

BMT ARGOSS Overview of the service and validation of the database _____________________________________________________________________________________________________
_______________________________________________________________________________________________________
A870 February 2017 © BMT ARGOSS Page 24
4.2. Calibration of SAR data
Wave heights and wave periods derived from SAR are calibrated on-the-fly by the online
service with altimeter wave heights, in order to ensure consistency of the wave height
distributions from both data sources. The correction is performed on-the-fly as it depends on
the offshore area under investigation. Corrections of a few percent are typical. Maximum
correction for SAR wave height is about 15%. Note that this calibration has not been taken
into account in the validation results for SAR wave height presented in the previous section.
It is assumed that wave heights from altimeter and SAR are statistically correlated (altimeter
and SAR wave height samples used come from the same area but are not collocated in time).
Correction of total SAR wave height (based on the total spectrum) is done as follows:
ii
corrected
i sHH 2
where i counts the SAR samples, corrected
iH and iH denote the corrected and total SAR wave
height respectively, is slope and is intercept. The factor is ensures a smooth transition
near zero. It is found as
)exp(1 2
ii Hs
To correct height of wind-sea or swell, the ratio of corrected and uncorrected total wave
height is used:
i
corrected
ii
H
Hr
ii
corrected
i HswellrHswell
ii
corrected
i HsearHsea
where Hswell and Hsea satisfy
222
iii HHseaHswell .
Calibration of all wave periods (zero-crossing and mean wave period, either corresponding to
the total spectrum, the wind-sea part or the swell part), makes use of the same ratio:
ii
corrected
i TrT

BMT ARGOSS Overview of the service and validation of the database _____________________________________________________________________________________________________
_______________________________________________________________________________________________________
A870 February 2017 © BMT ARGOSS Page 25
Slope () and intercept () relate to the coefficients of the linear regression fit of SAR total
wave energy quantiles to altimeter wave energy quantiles:
bHaH ALTSAR
22
with ε a residual. Regression of SAR energy on altimeter energy assumes that altimeter wave
height is more accurate than SAR wave height, which is what we find in the validation against
buoys. In the regression, we minimize the sum of squares of ),25.0max( ALTH , so we
assume that the standard deviation of the residual is proportional to the altimeter wave height.
In the correction of total SAR wave height above,
a/1 and ab / .

BMT ARGOSS Overview of the service and validation of the database _____________________________________________________________________________________________________
_______________________________________________________________________________________________________
A870 February 2017 © BMT ARGOSS Page 26
Appendices

BMT ARGOSS Overview of the service and validation of the database _____________________________________________________________________________________________________
_______________________________________________________________________________________________________
A870 February 2017 © BMT ARGOSS Page 27
Appendix A- Buoys used for validation
The set of buoys depicted in Figure 2 has been divided into 5 regions with a more or less uniform
wave climate:
The Gulf of Mexico (GOM, buoy numbers start with 42)
The northern Atlantic east of Northern America (ATL, buoy numbers start with 41 or 440)
Offshore Newfoundland (NFL, buoy numbers start with 441)
The northern Pacific (PAC, buoy numbers start with 46)
The region around Hawaii (HAW, buoy numbers start with 51)
The buoys report hourly wind speed, significant wave height, zero-crossing wave period and
mean wave period. Some buoys provide spectral information.
The table below lists each buoy’s position, region, observation period and the number of
observations available.
Buoy Nobs Lat Lon Region Begin End
41001 149032 34.68 -72.64 ATL 01jan85 08jun08
41002 150946 32.27 -75.19 ATL 27feb85 30nov08
41006 99259 29.30 -77.40 ATL 26may82 21apr96
41010 250045 28.90 -78.53 ATL 10nov88 31dec09
42001 196010 25.93 -89.65 GOM 01jan85 31dec09
42002 193012 25.89 -93.57 GOM 01jan85 31dec09
42003 181573 25.94 -85.91 GOM 01jan85 31dec09
42039 64900 28.80 -86.06 GOM 01jan02 31dec09
42040 62004 29.21 -88.20 GOM 01jan02 05oct09
42041 23485 27.50 -90.46 GOM 08may02 16mar05
44004 158983 38.46 -70.69 ATL 01jan85 08mar08
44005 162817 42.90 -68.94 ATL 01jan85 31dec09
44008 63575 40.50 -69.43 ATL 01jan01 06dec09
44011 59007 41.08 -66.58 ATL 01jan01 22sep09
44137 36354 41.30 -61.40 NFL 30nov88 15oct97
44139 33325 44.30 -57.40 NFL 02dec88 21nov97
44140 25371 42.70 -50.60 NFL 05sep90 19nov96
44141 42892 42.10 -56.10 NFL 05sep90 08dec97
46001 179334 56.29 -148.18 PAC 01jan85 31dec09
46002 156312 42.53 -130.26 PAC 25jan85 28jul09
46003 100426 51.85 -155.92 PAC 01jan85 11aug99
46004 52622 50.90 -135.90 PAC 04aug88 31dec97
46005 158951 46.08 -131.00 PAC 01jan85 18dec08
46006 139094 40.84 -137.49 PAC 01jan85 21nov08

BMT ARGOSS Overview of the service and validation of the database _____________________________________________________________________________________________________
_______________________________________________________________________________________________________
A870 February 2017 © BMT ARGOSS Page 28
46035 167028 56.91 -177.81 PAC 13sep85 31dec09
46036 69879 48.30 -133.90 PAC 22sep87 31dec97
46047 66517 32.43 -119.53 PAC 01jan02 31dec09
46059 111158 37.98 -130.00 PAC 19oct94 09jan09
46066 46695 52.70 -155.00 PAC 01jan02 31dec09
46184 61634 54.00 -138.80 PAC 20sep87 31dec97
51001 180005 23.40 -162.30 HAW 01jan85 24dec09
51002 180215 17.20 -157.80 HAW 01jan85 31dec09
51003 179918 19.10 -160.80 HAW 01jan85 31dec09
51004 173696 17.40 -152.50 HAW 13feb85 07oct09
51026 30383 21.40 -157.00 HAW 16jan93 23nov96
51028 62081 0.00 -153.90 HAW 29oct97 14apr08
Table 20 List of NOAA buoys used for validation of satellite data.

BMT ARGOSS Overview of the service and validation of the database _____________________________________________________________________________________________________
_______________________________________________________________________________________________________
A870 February 2017 © BMT ARGOSS Page 29
Appendix B- Parameters used for error statistics
The error is defined as the difference between samples of two data sources, e.g. between
satellite observations and buoy measurements, so for wave height:
buoyi
satelliteii HHe
with satellite
iH the wave height of sample no. i retrieved from satellite data, and Hi
buoy the
coincident buoy measurement of the wave height. Coincident means that the retrieved
satellite observation is located within 50 km around the buoy and that the observations do not
differ more than 30 minutes in time. Bias, standard deviation of the error and correlation
coefficient are defined as
ni
ie enbias,..,1
1
ni
eienstde,..,1
21 )()1(
BS
SBncorrelatio
ni
buoy
mean
buoy
ibuoyB HHn,..,1
21 )()1(
where SBBS ,, denote the standard deviation of the satellite, the standard deviation of
the buoy and the co-variance of the satellite and the buoy respectively.
Apart from bias, standard deviation of the error and correlation coefficient, the quality of the
data can be expressed in terms of the relative root-mean-square error (RRMSE). The root-
mean-square error of say, significant wave height, is
ni
buoyi
satellitei HHnRMSE
,..,1
21
It is similar to the standard deviation, but also includes the bias error.
BMT ARGOSS Overview of the service and validation of the database _____________________________________________________________________________________________________
_______________________________________________________________________________________________________
A870 February 2017 © BMT ARGOSS Page 30
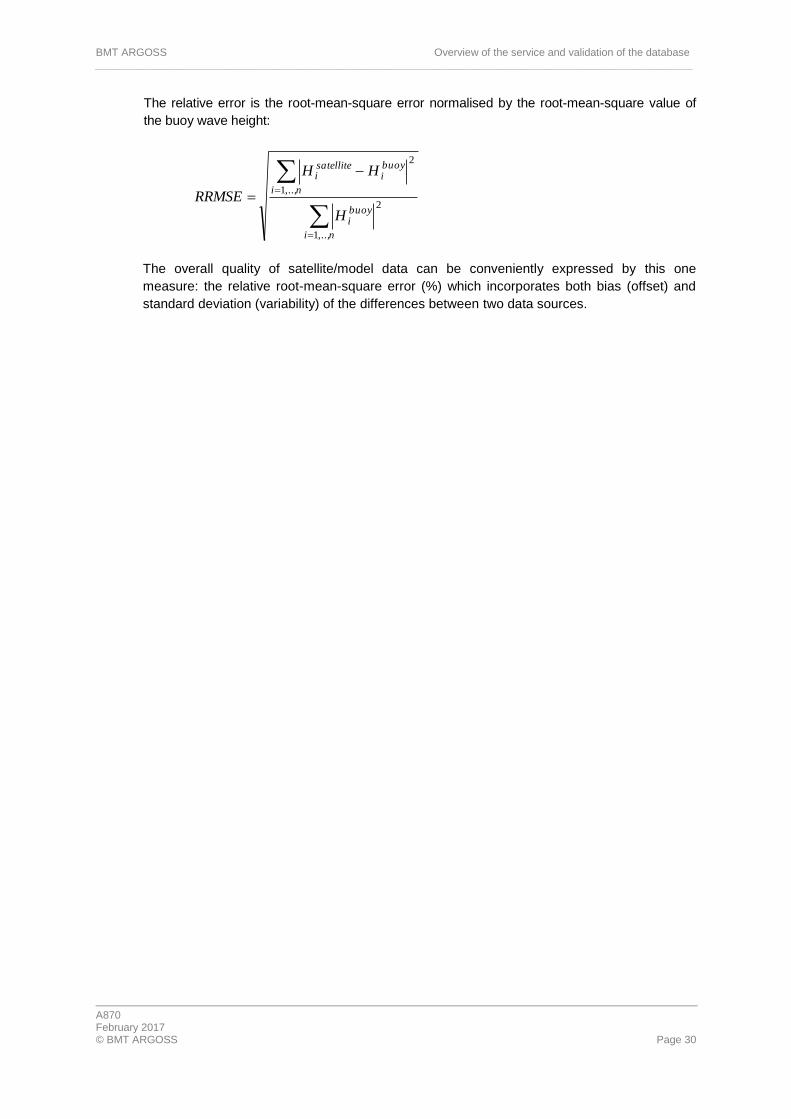
The relative error is the root-mean-square error normalised by the root-mean-square value of
the buoy wave height:
ni
buoyi
ni
buoyi
satellitei
H
HH
RRMSE
,..,1
2
,..,1
2
The overall quality of satellite/model data can be conveniently expressed by this one
measure: the relative root-mean-square error (%) which incorporates both bias (offset) and
standard deviation (variability) of the differences between two data sources.

BMT ARGOSS Overview of the service and validation of the database _____________________________________________________________________________________________________
_______________________________________________________________________________________________________
A870 February 2017 © BMT ARGOSS Page 31
Appendix C- Frame of reference
(a) Definitions and notation
Wave height H
Crest-to-trough wave height of an individual wave (between two consecutive
up-crossings of the still water level).
Significant wave height Hs
Averaged wave height H of the 1/3 highest waves. Except on very shallow
water, Hs is accurately approximated by Hm0, defined as 4 times the
standard deviation of the vertical surface displacement (4 times the square
root of spectral moment m0, see below).
Zero-crossing period T
Time elapsed between two consecutive up-crossings of the still water level.
Mean zero-crossing period Tz
The average of the zero-upcrossing period T for a particular sea state. Tz
is approximated by Tz ≈ Tm0,2 (see Moment-based wave period below).
Spectral moment mp
For any integer p, mp is the integral over frequency f of f p multiplied by the
wave spectrum, with f frequency in cycles per unit time. Remark: m0 is the
total variance of sea surface elevation.
Spectral density of sea surface waves S (wave spectrum)
The spectral density describes how the variance of the sea surface elevation
is distributed over frequency f. It is often referred to as wave spectrum.
Wave period based on spectral moments Tmp,q
Tmp,q= (mp/ mq)1/(q-p)
with mp and mq spectral moments, and p and q two
distinct integers.
Wave peak frequency Fp
This is the frequency where the wave spectrum reaches its maximum.
Wave peak period Tp
This is the wave period corresponding to the wave peak frequency.
Wave peak direction Pd
This is the wave direction corresponding to the wave peak frequency.
Wave length λ
The horizontal distance between two consecutive up-crossings of the still
water level in the direction of wave propagation.

BMT ARGOSS Overview of the service and validation of the database _____________________________________________________________________________________________________
_______________________________________________________________________________________________________
A870 February 2017 © BMT ARGOSS Page 32
Wave steepness parameter s
A dimensionless parameter, defined as the ratio of significant wave height
Hs to the deep-water wave length corresponding to the wave period Tm-1,0,
i.e., s= (2π/g) Hs/(Tm-1,0)2
Principal or mean wave direction Hsd
The direction derived from the first-order directional Fourier moments (sine
and cosine-weighted moments) of the directional wave spectrum. Wave
direction is defined as “coming from”. It can also be defined for (a) limited
range(s) of frequencies and represented as a function of frequency.
Wind-sea and swell (online service)
Wind-sea consists of the waves having crests moving no faster than 1.2
times the wind speed, so they are growing. Longer, and therefore faster
moving, waves are called swell.
Wind-sea and swell (offline consultancy)
Wind-sea is found as a component (distinct peak) of the wave spectrum with
wave steepness s >0.03. Note that this “engineering” definition does not
consider the wind; only wave steepness. Wind-sea parameters are found by
applying the definitions of these parameters only to the wind-sea component
of the spectrum. Swell is defined as the component (distinct peak, or peaks)
of the wave spectrum which is not steep enough to qualify as wind-sea
Wind speed u10 and wind direction u10d
Sustained wind speed at 10m above the (sea) surface and associated
direction. Wind direction is defined as “coming from”. “Sustained” means
averaged over 1 hour.
Gravitational acceleration g
On Earth, taken equal to 9.81 m/s2
(b) Units and conventions
Wind and wave directions are defined as “coming from” relative to true north positive
clockwise.
Units are expressed using the SI convention if not stated otherwise:
- length or distance (wave height, surface elevation, water depth) in
metres,
- time (wave periods) in seconds,
- speed in metres per second,
- direction in degrees clockwise from North.