Embed Size (px)
Citation preview
Overview of the Recruitment and Retention Landscape:
What have we learned and What are we missing?
Ken Getz
April 30, 2010
Meeting Agenda
Situation Summary
Primary Strategies and Their Impact
Education and Outreach
Missed Opportunity
Conclusions
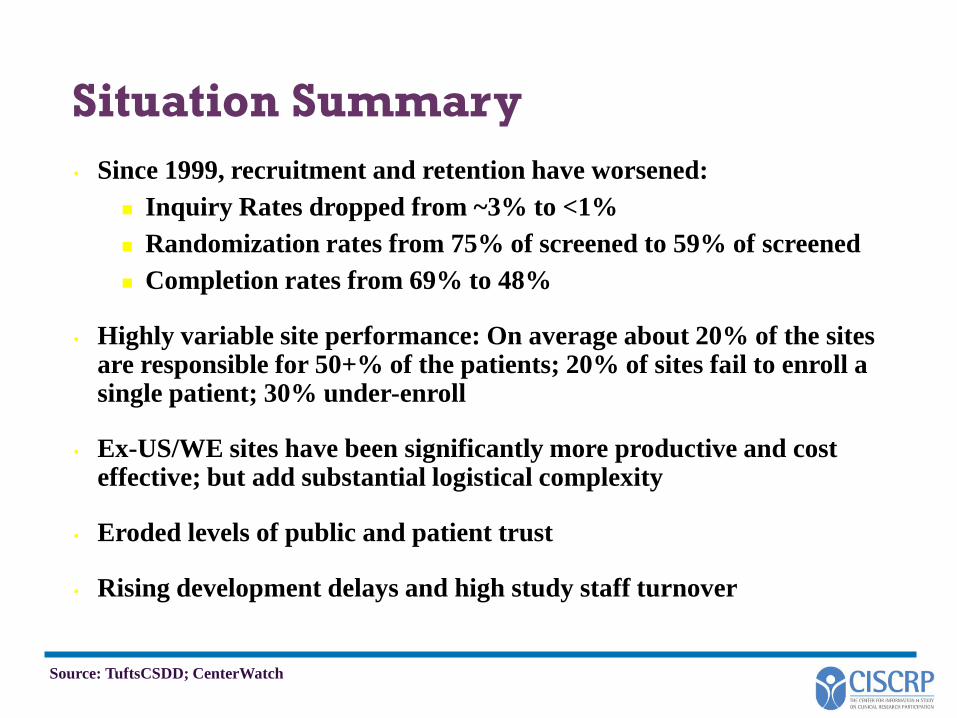
Situation Summary
• Since 1999, recruitment and retention have worsened:
Inquiry Rates dropped from ~3% to <1%
Randomization rates from 75% of screened to 59% of screened
Completion rates from 69% to 48%
• Highly variable site performance: On average about 20% of the sites are responsible for 50+% of the patients; 20% of sites fail to enroll a single patient; 30% under-enroll
• Ex-US/WE sites have been significantly more productive and cost effective; but add substantial logistical complexity
• Eroded levels of public and patient trust
• Rising development delays and high study staff turnover
Source: TuftsCSDD; CenterWatch
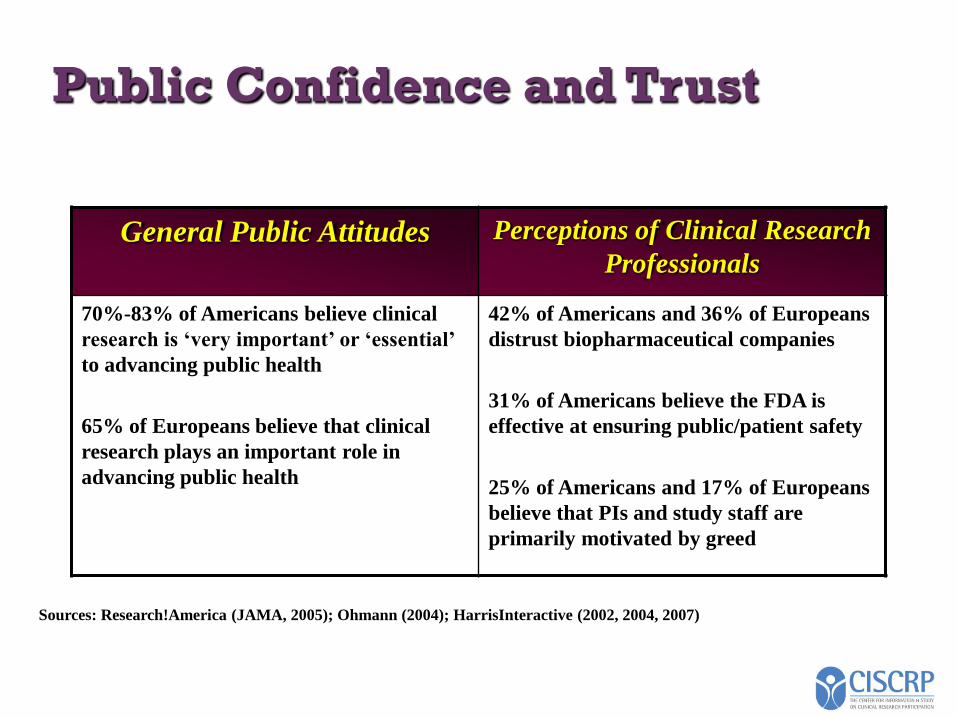
Public Confidence and Trust
General Public Attitudes Perceptions of Clinical Research
Professionals
70%-83% of Americans believe clinical
research is ‘very important’ or ‘essential’
to advancing public health
65% of Europeans believe that clinical
research plays an important role in
advancing public health
42% of Americans and 36% of Europeans
distrust biopharmaceutical companies
31% of Americans believe the FDA is
effective at ensuring public/patient safety
25% of Americans and 17% of Europeans
believe that PIs and study staff are
primarily motivated by greed
Sources: Research!America (JAMA, 2005); Ohmann (2004); HarrisInteractive (2002, 2004, 2007)
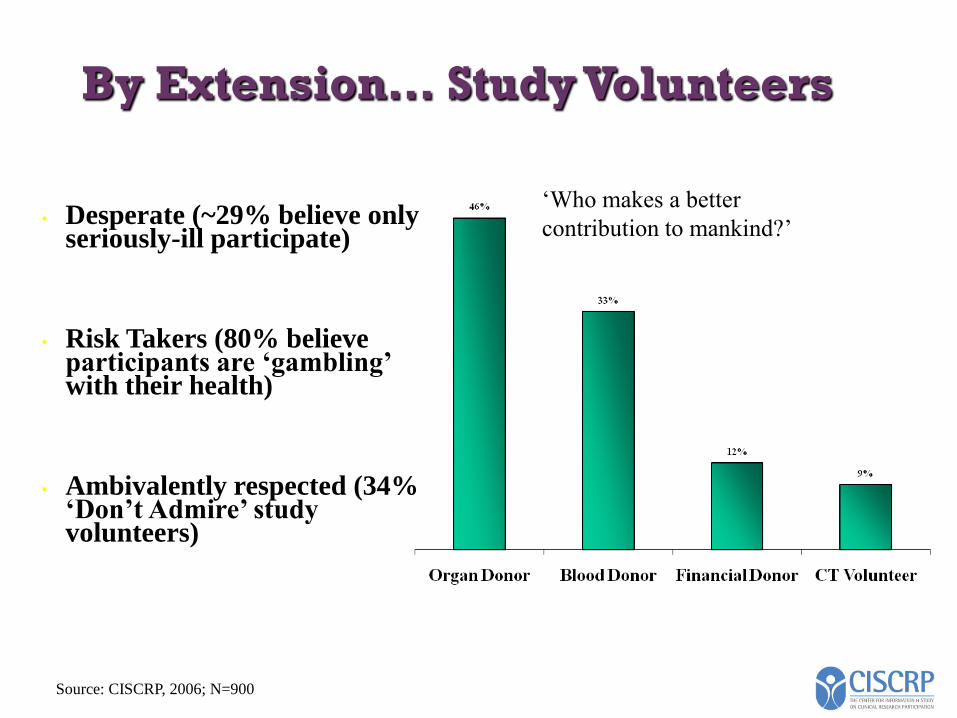
By Extension… Study Volunteers
‘Who makes a better
contribution to mankind?’
Source: CISCRP, 2006; N=900
• Desperate (~29% believe only seriously-ill participate)
• Risk Takers (80% believe participants are ‘gambling’ with their health)
• Ambivalently respected (34% ‘Don’t Admire’ study volunteers)
Primary Strategies
• Sources of Volunteers
• Assurances
• Technology solutions
• Distribution Channels
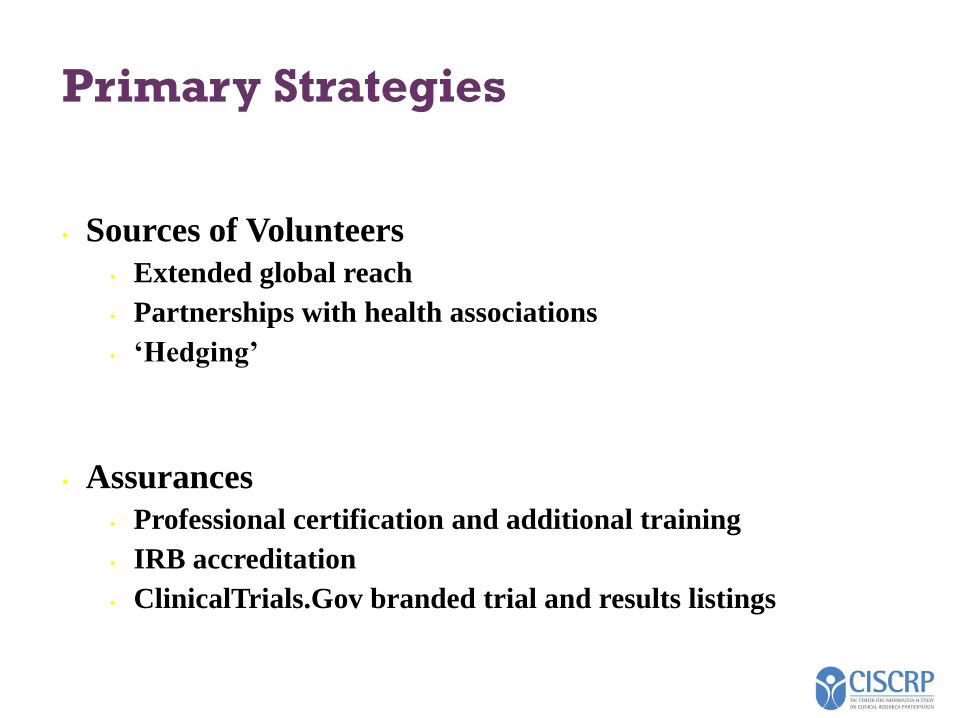
Primary Strategies
• Sources of Volunteers
• Extended global reach
• Partnerships with health associations
• ‘Hedging’
• Assurances
• Professional certification and additional training
• IRB accreditation
• ClinicalTrials.Gov branded trial and results listings
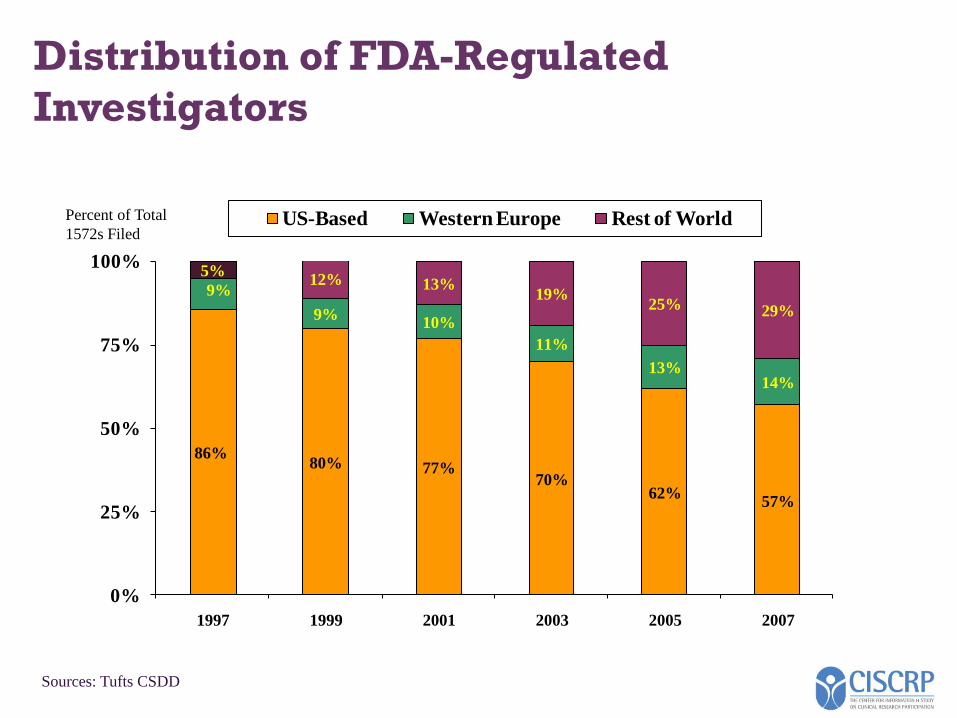
Distribution of FDA-Regulated
Investigators
86%80% 77%
70%62%
57%
9%
9%10%
11%
13%14%
5%12% 13%
19%25% 29%
0%
25%
50%
75%
100%
1997 1999 2001 2003 2005 2007
US-Based Western Europe Rest of WorldPercent of Total
1572s Filed
Sources: Tufts CSDD
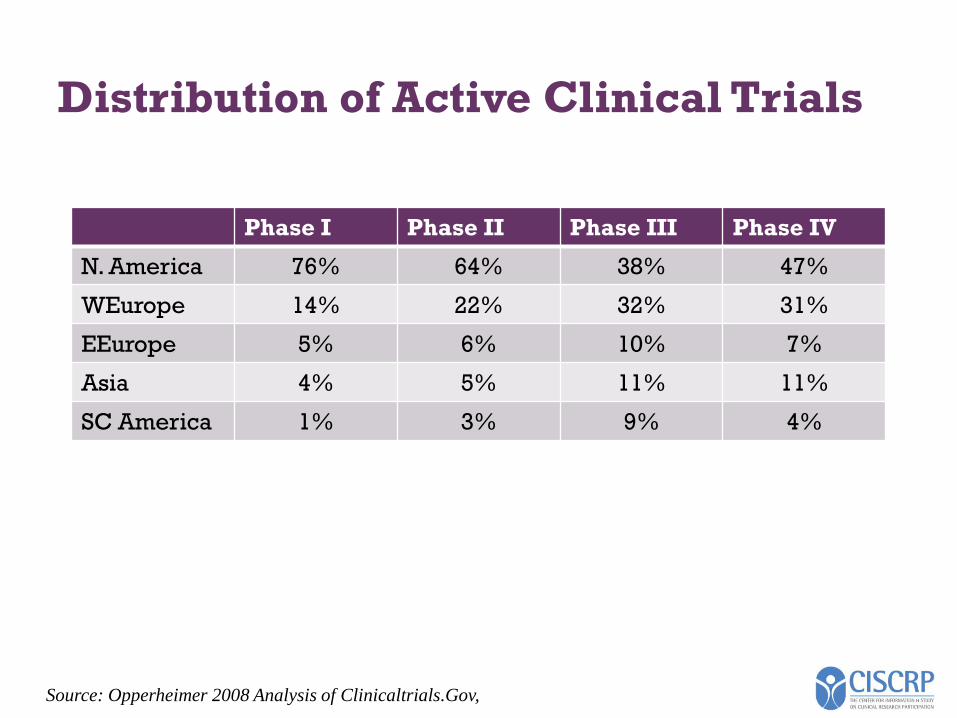
Distribution of Active Clinical Trials
Phase I Phase II Phase III Phase IV
N. America 76% 64% 38% 47%
WEurope 14% 22% 32% 31%
EEurope 5% 6% 10% 7%
Asia 4% 5% 11% 11%
SC America 1% 3% 9% 4%
Source: Opperheimer 2008 Analysis of Clinicaltrials.Gov,
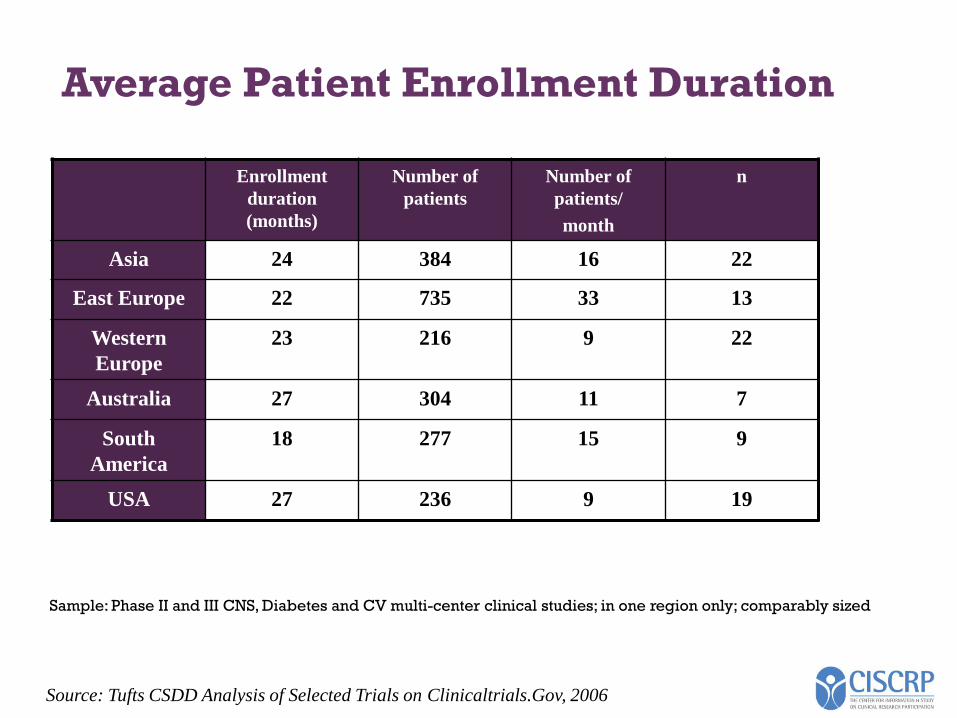
Average Patient Enrollment Duration
Sample: Phase II and III CNS, Diabetes and CV multi-center clinical studies; in one region only; comparably sized
Source: Tufts CSDD Analysis of Selected Trials on Clinicaltrials.Gov, 2006
Enrollment
duration
(months)
Number of
patients
Number of
patients/
month
n
Asia 24 384 16 22
East Europe 22 735 33 13
Western
Europe
23 216 9 22
Australia 27 304 11 7
South
America
18 277 15 9
USA 27 236 9 19
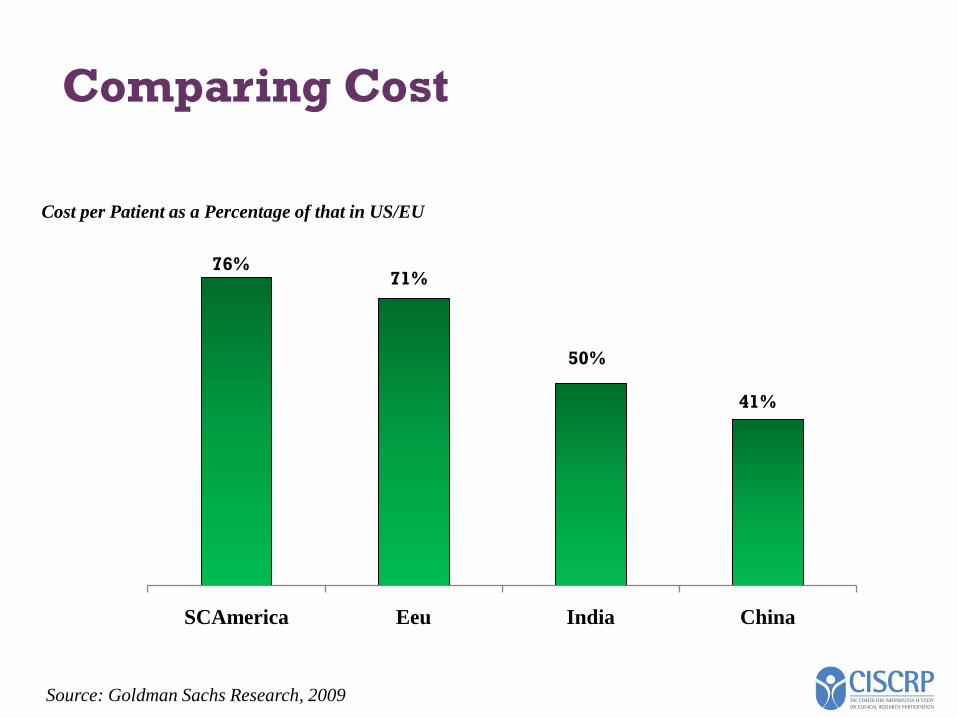
Comparing Cost
SCAmerica Eeu India China
41%
76%
50%
71%
Cost per Patient as a Percentage of that in US/EU
Source: Goldman Sachs Research, 2009
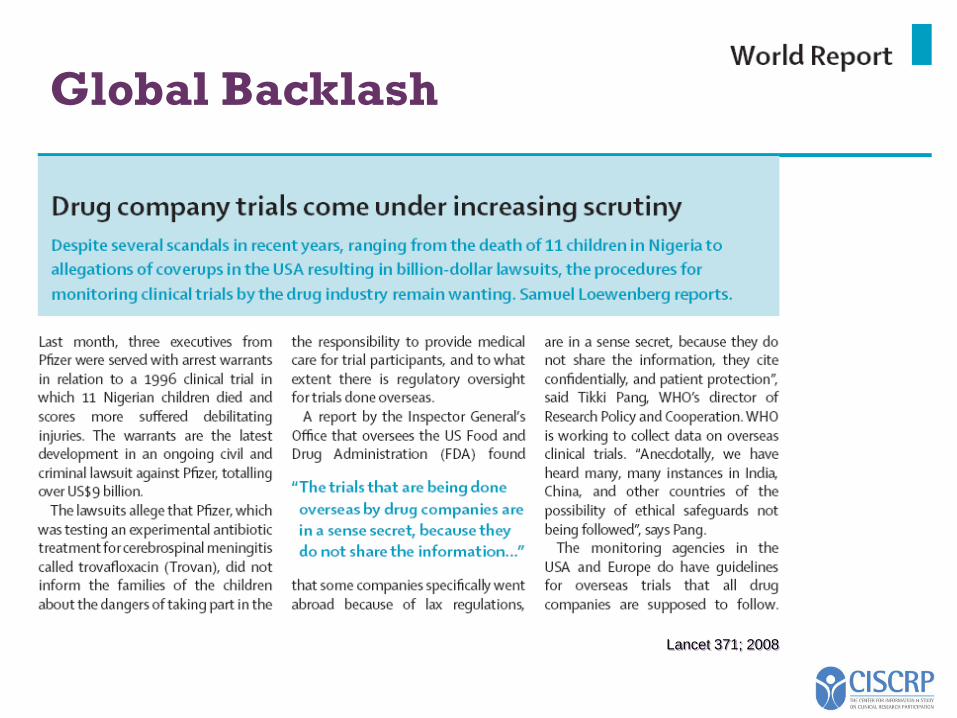
Lancet 371; 2008
Global Backlash
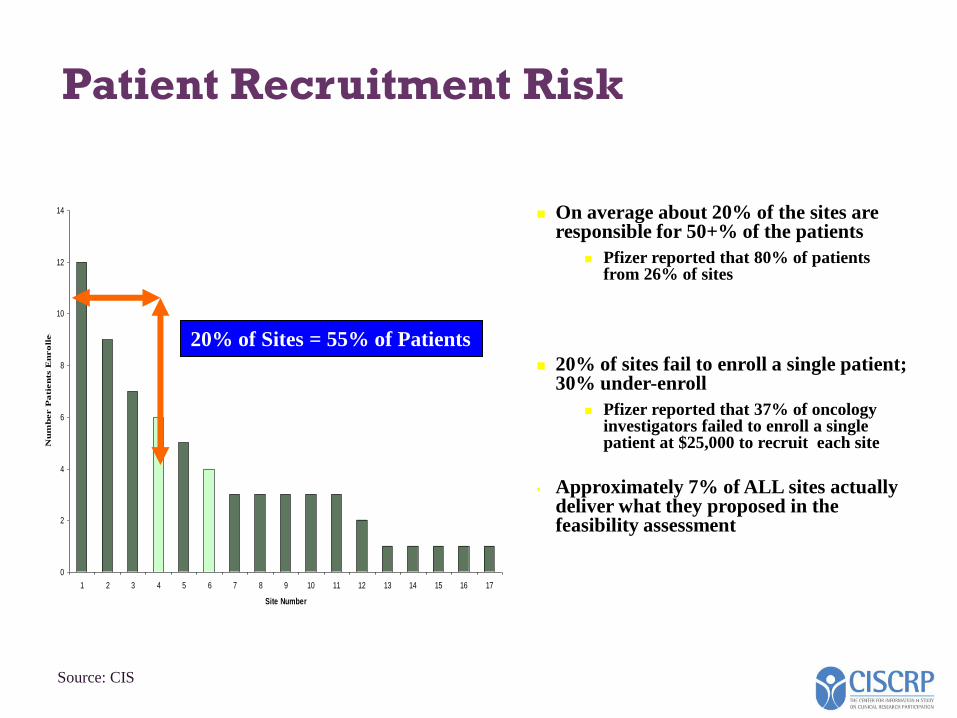
Patient Recruitment Risk
On average about 20% of the sites are responsible for 50+% of the patients
Pfizer reported that 80% of patients from 26% of sites
20% of sites fail to enroll a single patient; 30% under-enroll
Pfizer reported that 37% of oncology investigators failed to enroll a single patient at $25,000 to recruit each site
• Approximately 7% of ALL sites actually deliver what they proposed in the feasibility assessment
0
2
4
6
8
10
12
14
1 2 3 4 5 6 7 8 9 10 11 12 13 14 15 16 17
Site Number
Nu
mb
er P
ati
en
ts E
nro
lled
20% of Sites = 55% of Patients
Source: CIS
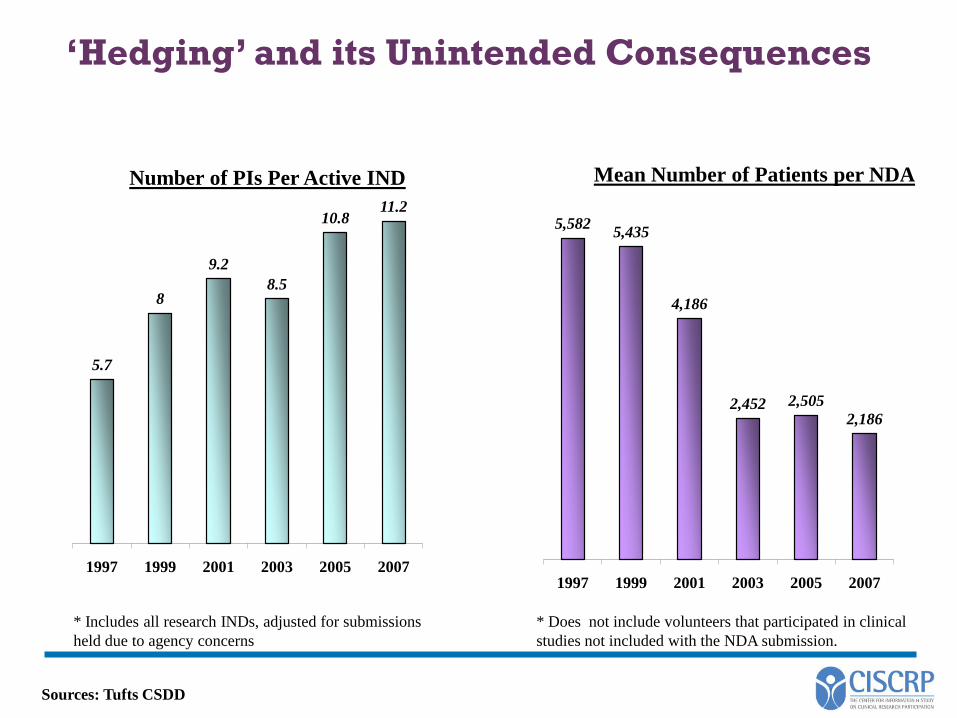
‘Hedging’ and its Unintended Consequences
5.7
8
9.2
8.5
10.811.2
1997 1999 2001 2003 2005 2007
Mean Number of Patients per NDA
* Includes all research INDs, adjusted for submissions
held due to agency concerns
Sources: Tufts CSDD
5,5825,435
4,186
2,452 2,505
2,186
1997 1999 2001 2003 2005 2007
Number of PIs Per Active IND
* Does not include volunteers that participated in clinical
studies not included with the NDA submission.
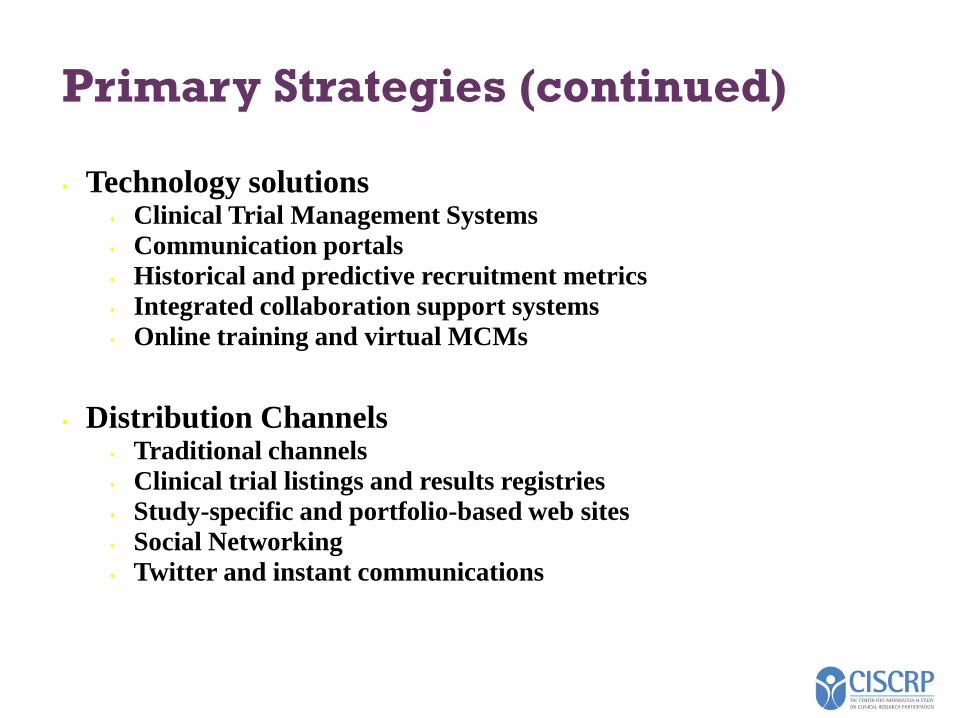
Primary Strategies (continued)
• Technology solutions• Clinical Trial Management Systems
• Communication portals
• Historical and predictive recruitment metrics
• Integrated collaboration support systems
• Online training and virtual MCMs
• Distribution Channels• Traditional channels
• Clinical trial listings and results registries
• Study-specific and portfolio-based web sites
• Social Networking
• Twitter and instant communications
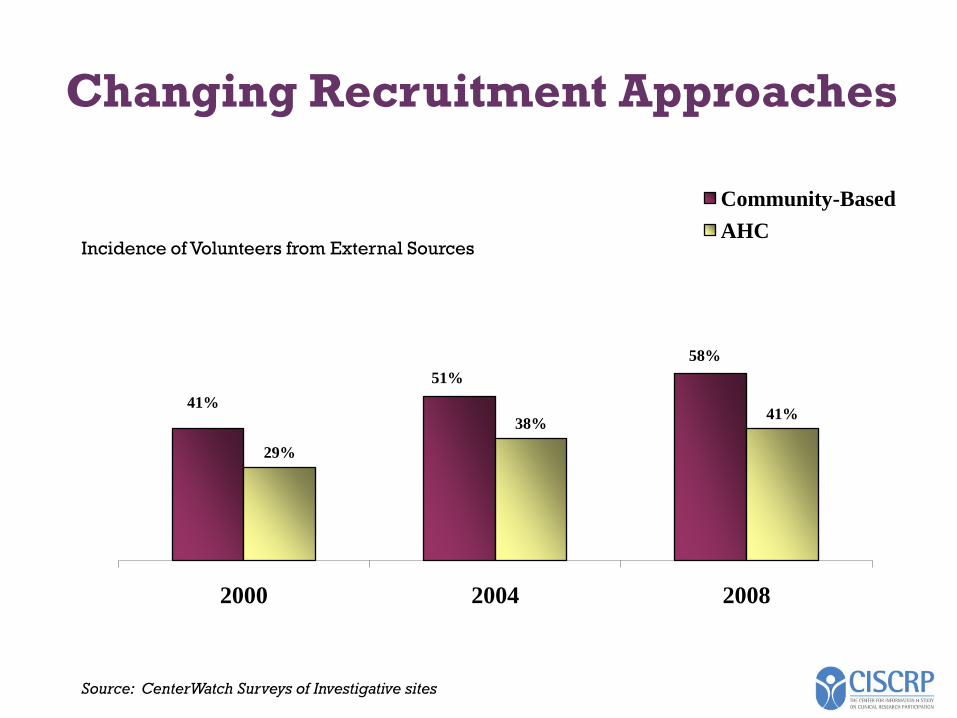
Changing Recruitment Approaches
41%
51%
58%
29%
38%41%
2000 2004 2008
Community-Based
AHCIncidence of Volunteers from External Sources
Source: CenterWatch Surveys of Investigative sites
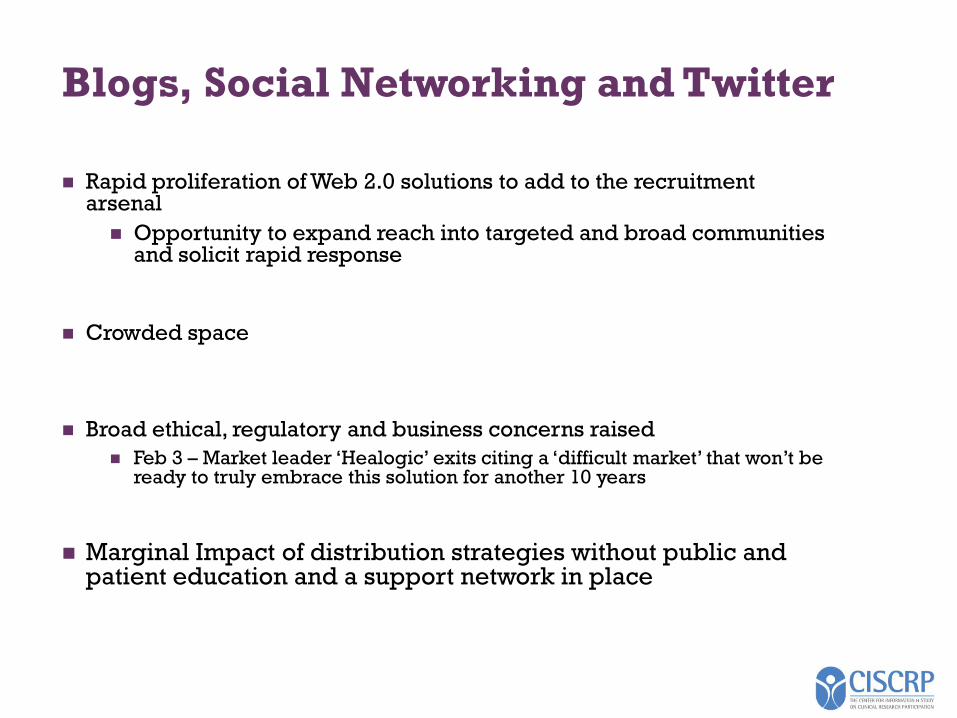
Blogs, Social Networking and Twitter
Rapid proliferation of Web 2.0 solutions to add to the recruitment arsenal
Opportunity to expand reach into targeted and broad communities and solicit rapid response
Crowded space
Broad ethical, regulatory and business concerns raised
Feb 3 – Market leader ‘Healogic’ exits citing a ‘difficult market’ that won’t be ready to truly embrace this solution for another 10 years
Marginal Impact of distribution strategies without public and patient education and a support network in place
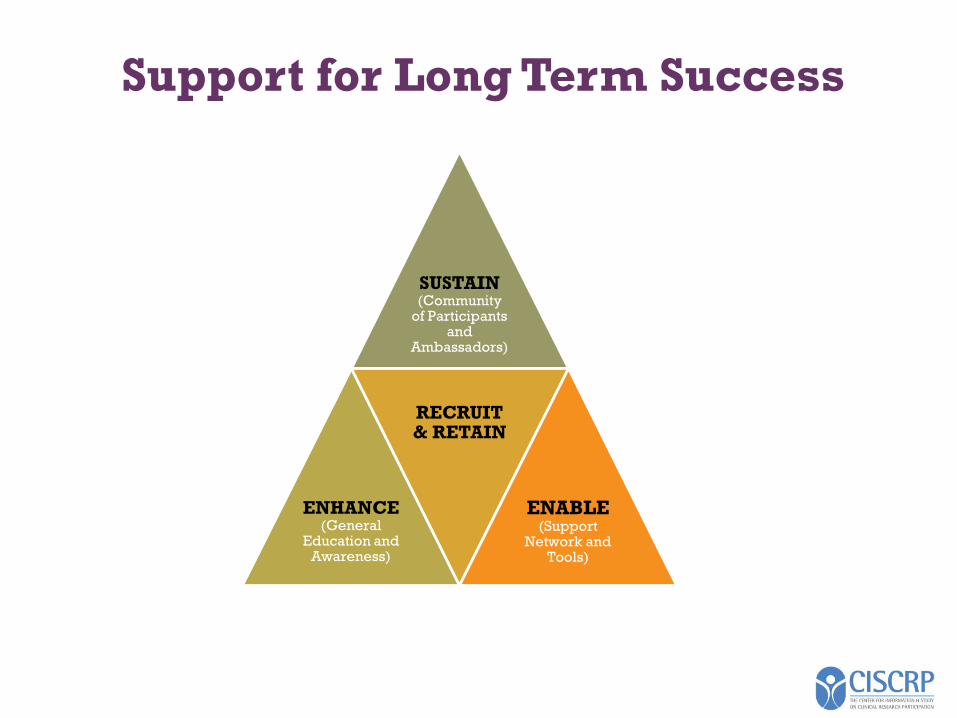
Support for Long Term Success
SUSTAIN(Community
of Participants and
Ambassadors)
ENHANCE(General
Education and Awareness)
RECRUIT & RETAIN
ENABLE(Support
Network and Tools)
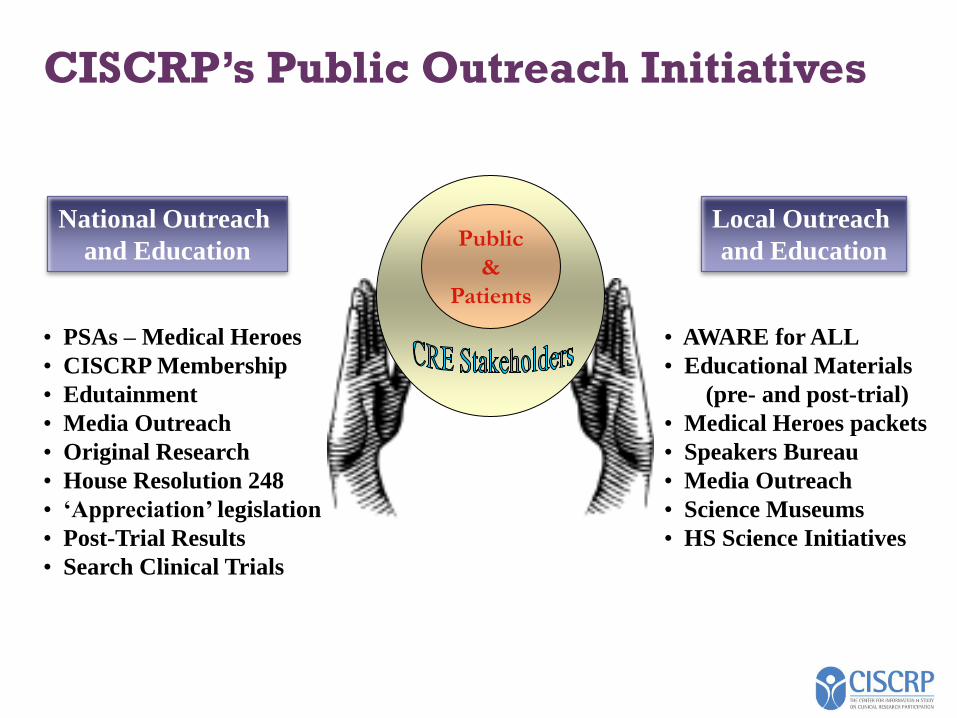
CISCRP’s Public Outreach Initiatives
Public
&
Patients
Local Outreach
and Education
National Outreach
and Education
• AWARE for ALL
• Educational Materials
(pre- and post-trial)
• Medical Heroes packets
• Speakers Bureau
• Media Outreach
• Science Museums
• HS Science Initiatives
• PSAs – Medical Heroes
• CISCRP Membership
• Edutainment
• Media Outreach
• Original Research
• House Resolution 248
• ‘Appreciation’ legislation
• Post-Trial Results
• Search Clinical Trials
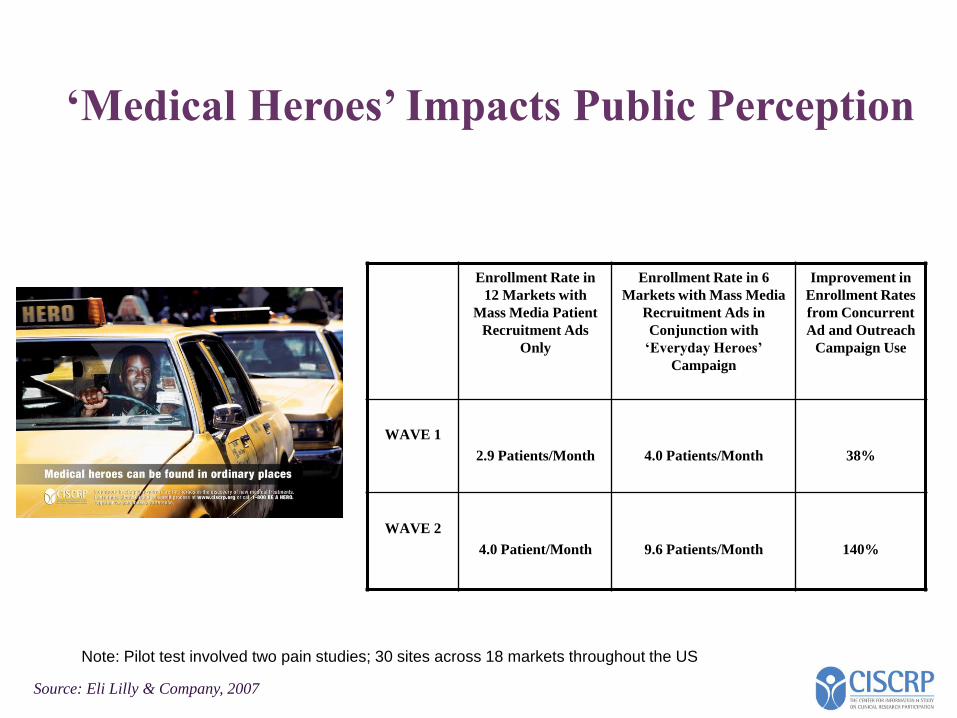
‘Medical Heroes’ Impacts Public Perception
Enrollment Rate in
12 Markets with
Mass Media Patient
Recruitment Ads
Only
Enrollment Rate in 6
Markets with Mass Media
Recruitment Ads in
Conjunction with
‘Everyday Heroes’
Campaign
Improvement in
Enrollment Rates
from Concurrent
Ad and Outreach
Campaign Use
WAVE 1
2.9 Patients/Month 4.0 Patients/Month 38%
WAVE 2
4.0 Patient/Month 9.6 Patients/Month 140%
Source: Eli Lilly & Company, 2007
Note: Pilot test involved two pain studies; 30 sites across 18 markets throughout the US
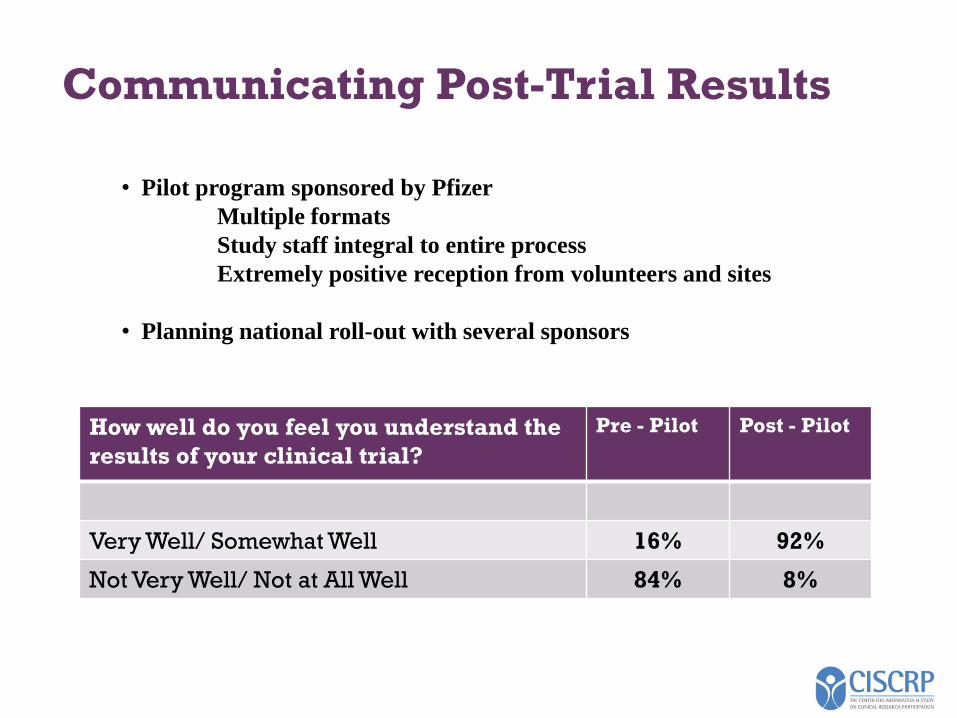
Communicating Post-Trial Results
How well do you feel you understand the
results of your clinical trial?
Pre - Pilot Post - Pilot
Very Well/ Somewhat Well 16% 92%
Not Very Well/ Not at All Well 84% 8%
• Pilot program sponsored by Pfizer
Multiple formats
Study staff integral to entire process
Extremely positive reception from volunteers and sites
• Planning national roll-out with several sponsors
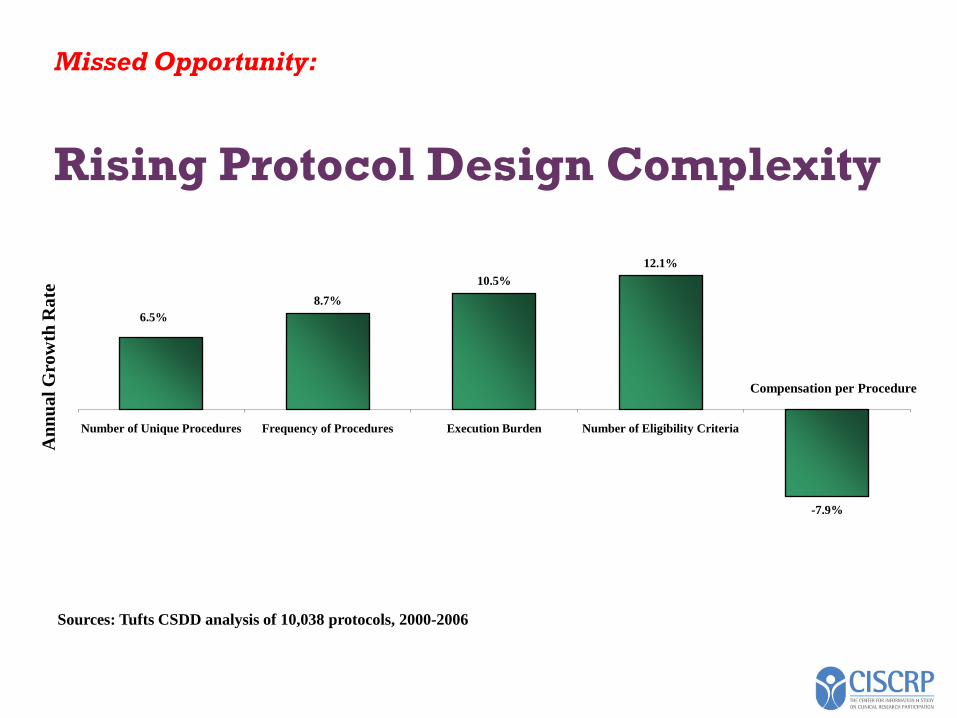
Missed Opportunity:
Rising Protocol Design Complexity
6.5%
8.7%
10.5%
12.1%
-7.9%
Number of Unique Procedures Frequency of Procedures Execution Burden Number of Eligibility Criteria
An
nu
al
Gro
wth
Ra
te
Compensation per Procedure
Sources: Tufts CSDD analysis of 10,038 protocols, 2000-2006
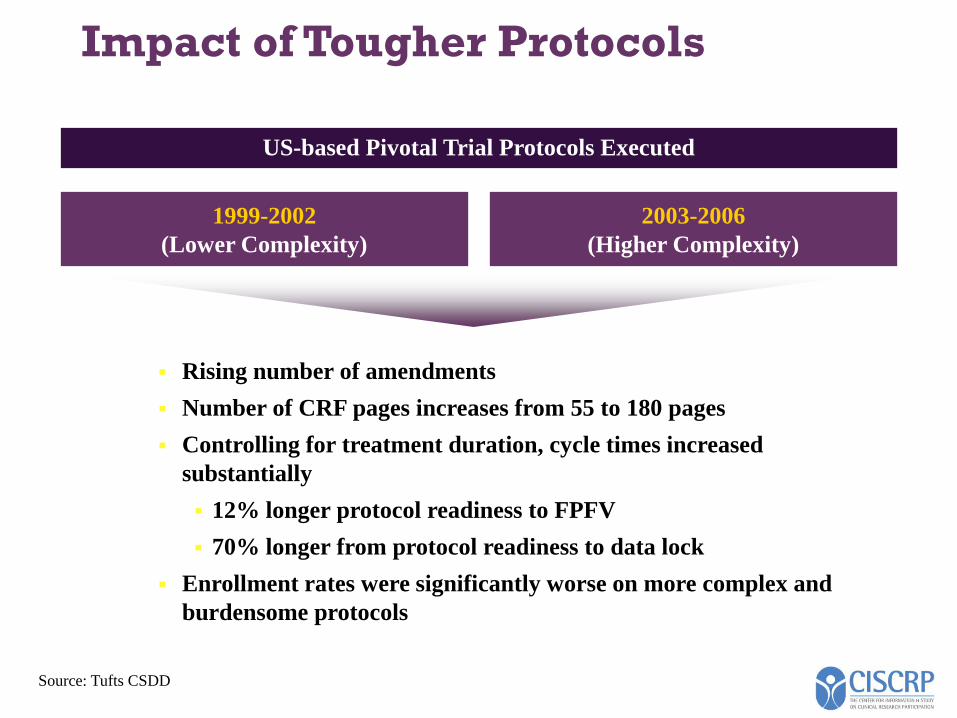
Impact of Tougher Protocols
Rising number of amendments
Number of CRF pages increases from 55 to 180 pages
Controlling for treatment duration, cycle times increased
substantially
12% longer protocol readiness to FPFV
70% longer from protocol readiness to data lock
Enrollment rates were significantly worse on more complex and
burdensome protocols
Source: Tufts CSDD
1999-2002
(Lower Complexity)
2003-2006
(Higher Complexity)
US-based Pivotal Trial Protocols Executed
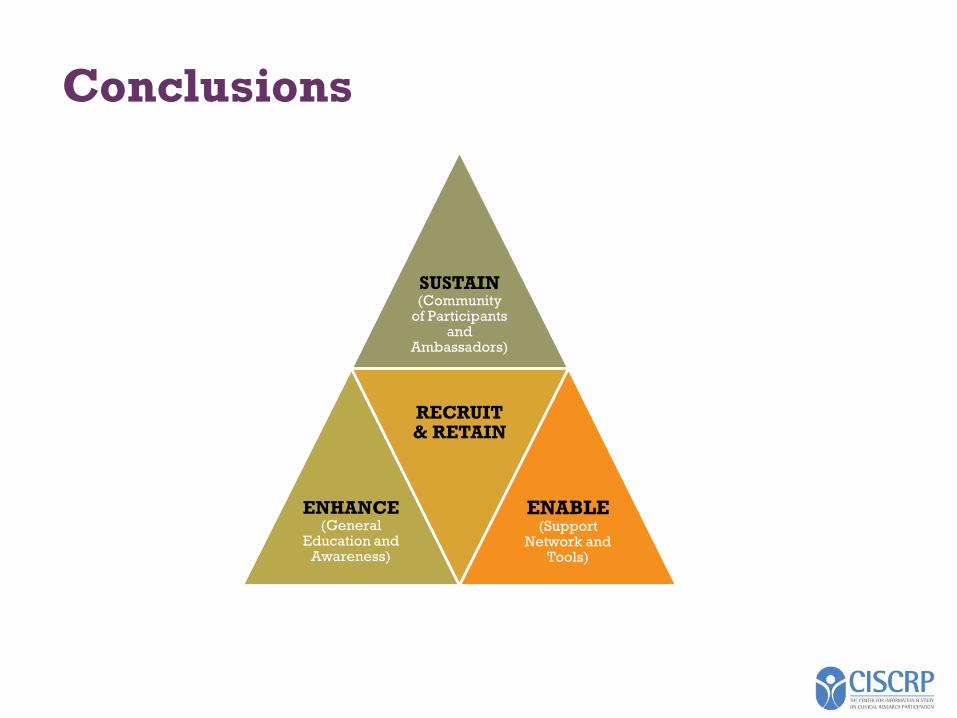
Conclusions
SUSTAIN(Community
of Participants and
Ambassadors)
ENHANCE(General
Education and Awareness)
RECRUIT & RETAIN
ENABLE(Support
Network and Tools)
Thank You
Ken Getz
Founder and Chairman, CISCRP
www.ciscrp.org
Senior Research Fellow, Tufts CSDD
617-636-3487