Embed Size (px)
Citation preview
Overview Of Proposed Legislation To ModifyThe “50-Cent Debt Test”

1
History of the “50-Cent Debt Test”
Voters typically approve an “Unlimited Tax” to repay Texas school district bonds authorized in a bond election.
However, the “50-Cent Debt Test” (the “Test”) was enacted in year 1991 (20-years ago) which is currently incorporated within Chapter 45 of the Texas Education Code. As implemented, the Test essentially limits a school district’s maximum Interest & Sinking Fund (“I&S”) tax rate to 50.0 cents, equating to a “debt limit”of 7% of a district’s taxable assessed valuation.
Prior to the “50-Cent Debt Test,” the “debt limit” for school districts was 10% of taxable assessed valuation.
Prior to a new bond sale, the Test requires a school district to demonstrate to the Attorney General its new and existing bonds may be repaid from a maximum I&S tax rate of 50.0 cents or less.
The Subchapter B portion of a district’s Tier I State funds, Existing Debt Allotment (“EDA”) and Instructional Facilities Allotment (“IFA”) State funds can be pledged to the repayment of bonds to comply with the Test.
Once pledged, Tier I State funds must be used for bond payments prior to a district levying an I&S tax rate above 50.0 cents.
During the 81st Legislative Session, Rep. Aycock (Killeen) filed H.B. 3697 to amend the “50-Cent Debt Test.”
H.B. 3697 garnered support from the Equity Center, Fast Growth School Coalition, Texas School Coalition, TASA, TASB, the Municipal Advisory Council of Texas, industry participants and numerous school districts.
H.B. 3697 was folded into Rep. Hochberg’s H.B. 3646 (i.e. the House of Representative’s School Finance Bill). Prior to the final reading, the proposed legislation was removed by Rep. Hancock.

2
The Results of Increasing Student Enrollment, Declining State Funding Assistance, Slowing Property Value Growth and Rising Construction Costs for School Facilities
Due to limited current debt capacity and the need to comply with the “50-Cent Debt Test”, school districts are being forced to extend the repayment term on bonds for up to 40-years. The extended repayment terms is estimated to increase the interest cost borne by taxpayers by over $20.0 billion over the next 5-years.
As bond repayments are deferred to comply with the Test, school districts become more leveraged as bonds are being added faster than they are being repaid: reducing future bond capacity, adding pressure to bond ratings, and increasing the total cost to taxpayers and the State of Texas. The recent economic and credit crisis is a direct result of “too much leverage” within the financial markets – There is a reason there are not 40-year home mortgages.
Many school districts have been required to annually pledge $ millions of Tier I State funds for bond payments to comply with the Test, further diminishing the dollars available to school districts for instruction.
Inherent conflict in school district bond market, investors purchased bonds based upon “Unlimited Tax”pledge – not “Unlimited Tax Pledge” once Tier I State funds to maintain school district operations have been depleted.
School districts have been forced to delay the construction of school facilities approved by voters. We estimate school districts have over $2.5 billion of bonds previously approved by voters that cannot be issued due to the “50-Cent Debt Test.”
Negatively impacts the economy of the State of Texas by directly reducing the dollar amount of school construction projects being completed, resulting in less: Employment, Consumer Spending, Demand for Materials, Home Construction, Sales Tax, etc. and lower property value growth.

3
What Has Caused the Need to Amend the “50-Cent Debt Test”?
Increasing Construction Costs for School Facilities;
Increasing Student Enrollments;
Additional Facility Mandates;
Taxable Valuation Growth Has Lagged the Cost of Construction; and
Declining State Funding for Bond Payments.

4
Change in Producer Prices for Inputs to Construction Industries ("PPI") Versus Consumer Price Index ("CPI") -
September 2002 Through December 2010
100
105
110
115
120
125
130
135
140
145
150
155
Sep-
02
Dec
-02
Mar
-03
Jun-
03
Sep-
03
Dec
-03
Mar
-04
Jun-
04
Sep-
04
Dec
-04
Mar
-05
Jun-
05
Sep-
05
Dec
-05
Mar
-06
Jun-
06
Sep-
06
Dec
-06
Mar
-07
Jun-
07
Sep-
07
Dec
-07
Mar
-08
Jun-
08
Sep-
08
Dec
-08
Mar
-09
Jun-
09
Sep-
09
Dec
-09
Mar
-10
Jun-
10
Sep-
10
Dec
-10
CPI PPI for Inputs to Construction Industries
__________Source: Bureau of Labor Statistics (CPI, PPI). Base date is September 2002.
Construction Costs Have Dramatically Increased
Since year 2004 prices of construction materials have risen by 115% more than consumer costs as shown below.
Time Period Construction -PPI Change
CPI Change
Sep. 2002 – Dec. 2010 44.3% 21.1%

5
Student Enrollment Continues to Increase
Since year 2001, student enrollment within Texas public schools has increased by 611,178 students or an average increase of 76,397 students per year. This equates to approximately 750 new elementary schools, 475 new middle schools or 240 new high schools.
4,11
0,10
6
4,19
8,32
2
4,26
3,68
0
4,33
1,17
4
4,45
0,00
0
4,51
3,83
5
4,58
1,00
8
4,64
6,66
8
4,72
1,28
4
3,000,000
3,250,000
3,500,000
3,750,000
4,000,000
4,250,000
4,500,000
4,750,000
Enr
ollm
ent
2001
/02
2002
/03
2003
/04
2004
/05
2005
/06
2006
/07
2007
/08
2008
/09
2009
/10
Annual Student Enrollment -Texas School Districts
Source: Texas Education Agency - PEIMS.
88,2
16
65,3
58
67,4
94
118,
826
63,8
35
67,1
73
65,6
60
74,6
16
76,3
97
0
25,000
50,000
75,000
100,000
125,000
En
rollm
ent
2002
/03
2003
/04
2004
/05
2005
/06
2006
/07
2007
/08
2008
/09
2009
/10
Aver
age
Annual Student Enrollment Increase
Despite the economy, student enrollment continues to grow.
HurricaneKatrina

6
$26.3 $29.6$32.6 $37.1 $39.9
$47.6$53.5
$58.0 $59.7
$0
$10
$20
$30
$40
$50
$60
$70
$80
$90
Pri
nci
pal
(In
Bill
ion
s)
2001/02 2002/03 2003/04 2004/05 2005/06 2006/07 2007/08 2008/09 2009/10
Dollar Amount of Voter-Approved Bonds Outstanding -Texas School Districts
__________Source: Texas Bond Review Board and Municipal Advisory Council of Texas.
Amount of Voter-Approved Bonds Outstanding Has Increased
The dollar amount of bonds outstanding within Texas school districts has increased from $26.3 billion to $59.7 billion, representing an increase of 127.3%. This increase is due to increasing construction costs, rapid student enrollment increases, unfunded State mandates and the longer repayment period of bonds required to comply with the Test.
Dollar amount of bonds outstanding has increased by 127.3%.
In comparison, the State’s debt (excluding local debt) has increased by 187% since FY 2000.

7
$960
.39
$1,0
15.1
9
$1,0
57.8
6
$1,1
23.6
3
$1,2
04.5
4
$1,3
55.2
2
$1,5
05.4
5
$1,6
68.9
3
$1,6
86.0
5
$1,6
60.0
5
$0
$200
$400
$600
$800
$1,000
$1,200
$1,400
$1,600
$1,800
Tax
Val
ue
(In
Bill
ion
s)
2001/02 2002/03 2003/04 2004/05 2005/06 2006/07 2007/08 2008/09 2009/10 2010/11*
Annual Taxable Assessed Valuation Growth -Texas School Districts
__________*2010/11 Tax Data is PreliminarySource: Texas Comptroller of Public Accounts - Property Tax Division.
Taxable Assessed Valuation Growth Has Slowed/Stopped
Since year 2001, the taxable assessed valuations of Texas school districts increased from $960.4 billion to $1.66 trillion, representing an increase of 72.9%. However, taxable values have actually declined by $8.9 billion or 0.53% over the last 2-years.
Taxable values decreased by 0.53% during
the last 2-years.

8
Annual State Funding Assistance ("IFA/"EDA") for Bonds - Texas School Districts
$763
.9
$580
.1
$793
.3
$747
.4
$759
.1
$729
.8
$671
.8$735
.5
$712
.8
$500.0
$550.0
$600.0
$650.0
$700.0
$750.0
$800.0
$850.0
2001/02 2002/03 2003/04 2004/05 2005/06 2006/07 2007/08 2008/09 2009/10
Fu
nd
ing
(In
Mill
ion
s)
0.0%
15.0%
30.0%
45.0%
Percen
tage of State Fu
nd
ing/
Total B
ond
P
aymen
ts
__________Source: Texas Education Agency - PEIMS and Texas Bond Review Board.
State Funding for Bonds Has Declined
State funding assistance received by Texas school districts for the payment of bonds has decreased by $213.2 million or 26.9%.
With bond payments increasing and State funding decreasing, the percentage of annual bond payments covered by State funding has declined from 35.4% to 12.1%.
9
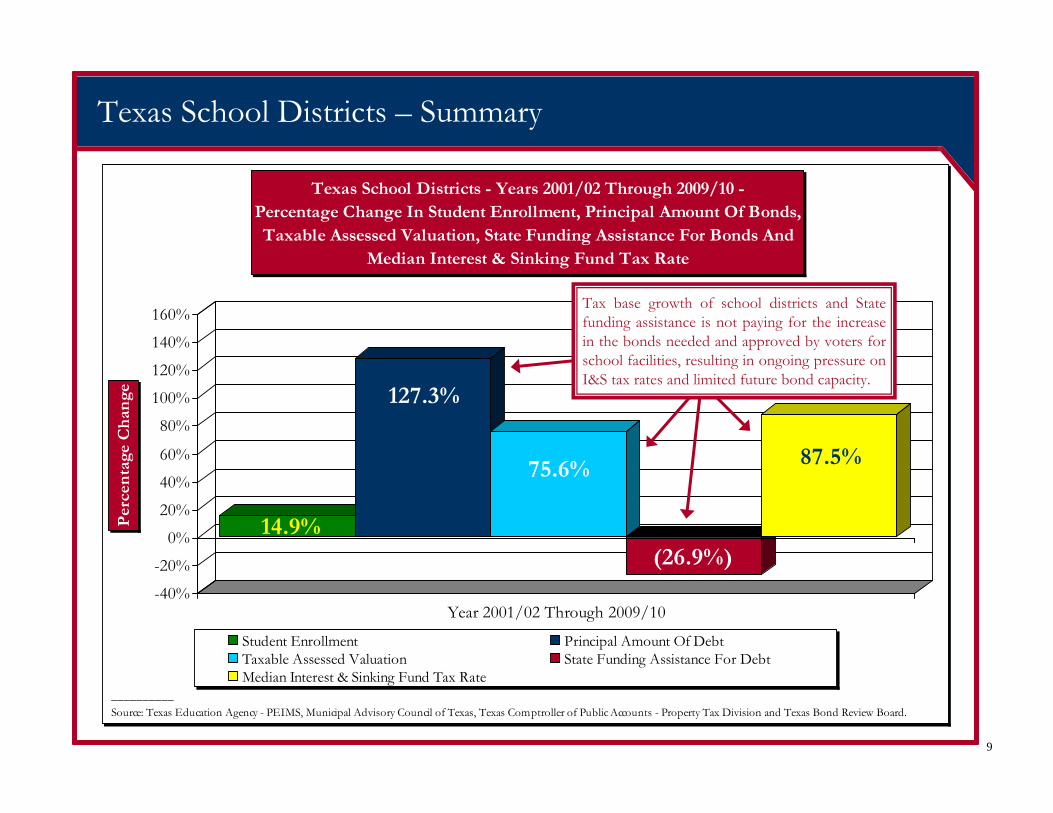
Texas School Districts – Summary
14.9%
127.3%
75.6%
(26.9%)
87.5%
-40%
-20%
0%
20%
40%
60%
80%
100%
120%
140%
160%
Per
cen
tage
Ch
ange
Year 2001/02 Through 2009/10
Texas School Districts - Years 2001/02 Through 2009/10 -Percentage Change In Student Enrollment, Principal Amount Of Bonds,Taxable Assessed Valuation, State Funding Assistance For Bonds And
Median Interest & Sinking Fund Tax Rate
Student Enrollment Principal Amount Of DebtTaxable Assessed Valuation State Funding Assistance For DebtMedian Interest & Sinking Fund Tax Rate
__________Source: Texas Education Agency - PEIMS, Municipal Advisory Council of Texas, Texas Comptroller of Public Accounts - Property Tax Division and Texas Bond Review Board.
Tax base growth of school districts and State funding assistance is not paying for the increase in the bonds needed and approved by voters for school facilities, resulting in ongoing pressure on I&S tax rates and limited future bond capacity.

10
Fast Growth School Districts - Summary
35.8%
150.3%
99.5%
(7.7%) 57.6%
-25%
0%
25%
50%
75%
100%
125%
150%
175%
Per
cen
tag
e C
han
ge
Year 2001/02 Through 2008/09
Fast Growth School Districts - Years 2001/02 Through 2008/09 -Percentage Change In Student Enrollment, Principal Amount Of Bonds,Taxable Assessed Valuation, State Funding Assistance For Bonds And
Median Interest & Sinking Fund Tax Rate
Student Enrollment Principal Amount Of DebtTaxable Assessed Valuation State Funding Assistance For DebtMedian Interest & Sinking Fund Tax Rate
__________Source: Texas Education Agency - PEIMS and Texas Bond Review Board.
Tax base growth of school districts and State funding assistance is not paying for the increase in the bonds needed and approved by voters for school
facilities, resulting in ongoing pressure on I&S tax rates and limited future
bond capacity.

11
Historical Trend of Interest & Sinking Fund Tax RatesYears 2001/02 - 2010/11
37
212
5
83
222
0
50
100
150
200
250
2001/02 2002/03 2003/04 2004/05 2005/06 2006/07 2007/08 2008/09 2009/10 2010/11
No.
of I
SDs
30.0 Cents or Higher
40.0 Cents or Higher
50.0 Cent Maximum Rate
__________Source: Texas Comptroller of Public Accounts - Property Tax Division.
Result – Increasing I&S Tax Rates and Diminishing Bond Capacity
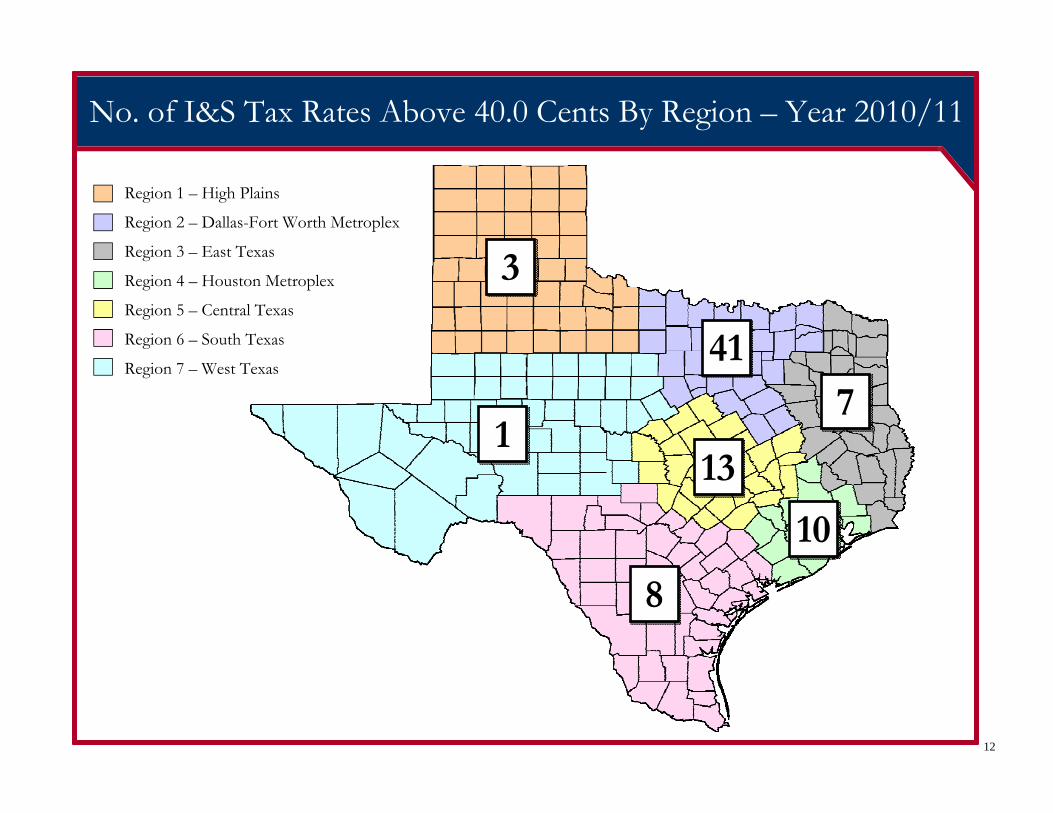
Over the last 5-years, the number of school districts with a I&S tax rate of 40.0 cents or higher has increased by 938%.
12
No. of I&S Tax Rates Above 40.0 Cents By Region – Year 2010/11
1313
77
1010
88
11
33
4141
Region 1 – High Plains
Region 2 – Dallas-Fort Worth Metroplex
Region 3 – East Texas
Region 4 – Houston Metroplex
Region 5 – Central Texas
Region 6 – South Texas
Region 7 – West Texas

13
Subcommittee on Public Education Funding – Representative Listing of Texas School Districts With An I&S Tax Rate of 40.0 Cents or More
Senator Florence Shapiro Allen Independent School District Irving Independent School District Lovejoy Independent School District McKinney Independent School District Melissa Independent School District Princeton Independent School District Prosper Independent School District Wylie Independent School District
Senator Robert Duncan Frenship Independent School District Lubbock-Cooper Independent School District Panhandle Independent School District Robert Lee Independent School District
Senator Dan Patrick Katy Independent School District Spring Independent School District Waller Independent School District
Senator Eddie Lucio, Jr. None
Senator Kel Seliger None
Senator Craig Estes Anna Independent School District Aubrey Independent School District Bland Independent School District Blue Ridge Independent School District Celina Independent School District Community Independent School District Denton Independent School District Gunter Independent School District Jacksboro Independent School District Krum Independent School District McKinney Independent School District Melissa Independent School District Millsap Independent School District Princeton Independent School District Prosper Independent School District Sherman Independent School District Van Alstyne Independent School District
Senator Royce West Cedar Hill Independent School District DeSoto Independent School District Grand Prairie Independent School District Irving Independent School District

14
I&S Tax Rates of 40.0 Cents or Higher – Year 2010/11
48.2% are “Non-Fast Growth” School Districts and 51.8% are “Fast Growth”
Royal ISD (59.00 Cents) Denton ISD (49.00 Cents) Canton ISD (43.10 Cents) Bishop Consolidated ISD (52.38 Cents) McKinney ISD (48.80 Cents) Huffman ISD (43.00 Cents) Joaquin ISD (51.80 Cents) Needville ISD (48.00 Cents) Rockwall ISD (43.00 Cents) Allen ISD (50.00 Cents) Floresville ISD (47.58 Cents) Taylor ISD (43.00 Cents) Anna ISD (50.00 Cents) Bloomington ISD (47.50 Cents) Commerce ISD (42.51 Cents) Aubrey ISD (50.00 Cents) Lovejoy ISD (47.50 Cents) Grand Prairie ISD (42.50 Cents) Blue Ridge ISD (50.00 Cents) Manor ISD (47.50 Cents) Irving ISD (42.50 Cents) Burleson ISD (50.00 Cents) Longview ISD (47.30 Cents) Judson ISD (42.30 Cents) Caddo Mills ISD (50.00 Cents) Wylie ISD (47.00 Cents) Hays Consolidated ISD (42.13 Cents) Celina ISD (50.00 Cents) Forney ISD (46.00 Cents) Pflugerville ISD (42.00 Cents) Dickinson ISD (50.00 Cents) Frenship ISD (46.00 Cents) Spring ISD (42.00 Cents) Eagle Mountain-Saginaw ISD (50.00 Cents) Hitchcock ISD (46.00 Cents) Franklin ISD (41.80 Cents) Elgin ISD (50.00 Cents) Jacksboro ISD (46.00 Cents) Angleton ISD (41.52 Cents) Ennis ISD (50.00 Cents) Hubbard ISD (45.99 Cents) Lindale ISD (41.50 Cents) Lake Dallas ISD (50.00 Cents) Lubbock-Cooper ISD (45.90 Cents) South San Antonio ISD (41.49 Cents) Lake Worth ISD (50.00 Cents) Mansfield ISD (45.60 Cents) Leander ISD (41.48 Cents) Little Elm ISD (50.00 Cents) Community ISD (45.50 Cents) Central Heights ISD (41.00 Cents) Melissa ISD (50.00 Cents) Crandall ISD (45.36 Cents) Giddings ISD (41.00 Cents) New Caney ISD (50.00 Cents) DeSoto ISD (45.00 Cents) Gunter ISD (41.00 Cents) Prosper ISD (50.00 Cents) Dripping Springs ISD (45.00 Cents) San Diego ISD (40.49 Cents) Spring Hill ISD (50.00 Cents) Princeton ISD (45.00 Cents) Iola ISD (40.34 Cents) White Settlement ISD (50.00 Cents) Bastrop ISD (44.10 Cents) Argyle ISD (40.00 Cents) Crowley ISD (49.50 Cents) Krum ISD (44.00 Cents) Cedar Hill ISD (40.00 Cents) Hutto ISD (49.50 Cents) Overton ISD (44.00 Cents) Katy ISD (40.00 Cents) Millsap ISD (49.50 Cents) Panhandle ISD (44.00 Cents) Sherman ISD (40.00 Cents) Keller ISD (49.06 Cents) Robert Lee ISD (44.00 Cents) Van Alstyne ISD (40.00 Cents) Bland ISD (49.00 Cents) Harlandale ISD (43.48 Cents) Waller ISD (40.00 Cents) Del Valle ISD (49.00 Cents) Banquete ISD (43.34 Cents)
Note: District’s highlighted in “blue” represent “Non-Fast Growth School Districts.” Source: Texas Comptroller of Public Accounts - Property Tax Division

15
$0.00
$0.05
$0.10
$0.15
$0.20
$0.25
$0.30
$0.35
$0.40
$0.45
$0.50
$0.55
$0.60
$0.65
$0.7020
10/1
120
11/1
220
12/1
320
13/1
420
14/1
520
15/1
620
16/1
720
17/1
820
18/1
920
19/2
020
20/2
120
21/2
220
22/2
320
23/2
420
24/2
520
25/2
620
26/2
720
27/2
820
28/2
920
29/3
020
30/3
120
31/3
220
32/3
320
33/3
420
34/3
520
35/3
620
36/3
720
37/3
820
38/3
920
39/4
020
40/4
120
41/4
220
42/4
320
43/4
420
44/4
520
45/4
620
46/4
720
47/4
820
48/4
920
49/5
020
50/5
1
I&S
Fu
nd
Tax
Rat
e
Projected I&S FundTax Rates - Existing Bonds
Additional BondCapacity Pursuant
to 50-Cent Debt Test
District may need to use $87,918,913 of “Tier I” State funds for bond payments during this
time period to maintain an I&S tax rate of 50.0
cents of less.$0.50
District’s current I&S tax rate is 50.0 cents.
Example No. 1 – Central Texas School District (ADA of 5,412) –Tier I State Funds Pledged for Bond Payments

16
$0
$500,000
$1,000,000
$1,500,000
$2,000,000
$2,500,000
$3,000,000
$3,500,000
$4,000,000
$4,500,000
$5,000,000
$5,500,000
$6,000,000
$6,500,000
An
nu
al D
ebt
Serv
ice
2010
/11
2011
/12
2012
/13
2013
/14
2014
/15
2015
/16
2016
/17
2017
/18
2018
/19
2019
/20
2020
/21
2021
/22
2022
/23
2023
/24
2024
/25
2025
/26
2026
/27
2027
/28
2028
/29
2029
/30
2030
/31
2031
/32
2032
/33
2033
/34
2034
/35
2035
/36
2036
/37
2037
/38
2038
/39
2039
/40
2040
/41
2041
/42
2042
/43
2043
/44
2044
/45
2045
/46
2046
/47
2047
/48
2048
/49
2049
/50
Series 2010A - Interest Equals $38,343,372.71 or 2.26X the Principal Amount of the Series 2010A BondsSeries 2010A - Principal Equals $16,896,582.85Existing Debt - Principal Equals $68,067,990.80
Note: Debt service payments reflect payments from September 1 through August 31.
Example No. 2 – North Texas School District (ADA of 2,121) –Deferring Bond Repayment Terms
School district was forced to defer bond payments over a 40-year period and not make a principal payment for 35-years to comply with the Test, increasing the cost to taxpayers by over 180%.

17
Example No. 3 – North Texas School District (ADA of 21,251) – Amendments Would Reduce the Total School “Tax Bill” of Taxpayers and Provides Future Bond Capacity.
$116.745 Million Bond Sale - 40-Year Amortization
$0.00
$0.10
$0.20
$0.30
$0.40
$0.50
$0.60
2010
/11
2011
/12
2012
/13
2013
/14
2014
/15
2015
/16
2016
/17
2017
/18
2018
/19
2019
/20
2020
/21
2021
/22
2022
/23
2023
/24
2024
/25
2025
/26
2026
/27
2027
/28
2028
/29
2029
/30
2030
/31
2031
/32
2032
/33
2033
/34
2034
/35
2035
/36
2036
/37
2037
/38
2038
/39
2039
/40
2040
/41
2041
/42
2042
/43
2043
/44
2044
/45
2045
/46
2046
/47
2047
/48
2048
/49
2049
/50
2050
/51
I&S
Tax
Rat
e
$116.745 Million Bond SaleExisting Debt Service
Maximum Projected I&S Tax Rate = 31.0 CentsProjected Interest Cost = $14,350,512
$116.745 Million Bond SalePrincipal = $116,745,000Interest = $440,705,000
Debt Service = $557,450,000
$116.745 Million Bond Sale - 30-Year Amortization
$0.00
$0.10
$0.20
$0.30
$0.40
$0.50
$0.60
2010
/11
2011
/12
2012
/13
2013
/14
2014
/15
2015
/16
2016
/17
2017
/18
2018
/19
2019
/20
2020
/21
2021
/22
2022
/23
2023
/24
2024
/25
2025
/26
2026
/27
2027
/28
2028
/29
2029
/30
2030
/31
2031
/32
2032
/33
2033
/34
2034
/35
2035
/36
2036
/37
2037
/38
2038
/39
2039
/40
2040
/41
2041
/42
2042
/43
2043
/44
2044
/45
2045
/46
2046
/47
2047
/48
2048
/49
2049
/50
2050
/51
I&S
Tax
Rat
e
Interest Cost Savings$116.745 Million Bond SaleExisting Debt Service
$116.745 Million Bond SalePrincipal = $116,745,000Interest = $148,585,000
Debt Service = $265,330,000
Represents Interest Cost Savings to
Taxpayers of$292,120,000
Maximum I&S Tax Rate of 56.0 Cents.
Maximum I&S Tax Rate of 50.0 Cents.

18
Summary of Proposed Amendments to the “50-Cent Debt Test”
Repeals Existing “50-Cent Debt Test” and Prior Pledges of Tier I State Funds for Bond Payments;
Implements a “Debt Limit” Equal to 10% of Taxable Assessed Valuation with Adjustments for:
Smaller districts with less than 4,000 students; Districts with student enrollment of at least 15% during the preceding 3-years; and District’s receiving IFA/EDA State assistance to maintain “equity among districts.”
Incorporates Debt Management Safeguards and Increases Accountability to Taxpayers
Require School Districts to Adopt a Debt Management Policy to:
Maintain financial stability; Provide debt management flexibility to meet future facility needs; Preserve public trust; Minimize cost of taxpayers; Preserve access to capital markets; Improve bond ratings; and Increase taxpayer oversight of bond programs.
Require Development of 5-Year Capital Improvement Plan and Require Annual Public Hearing to Review.
Limits the Amount of Bonds Allowed for “Athletic Facilities” to 10% of a District’s Bond Capacity.
19
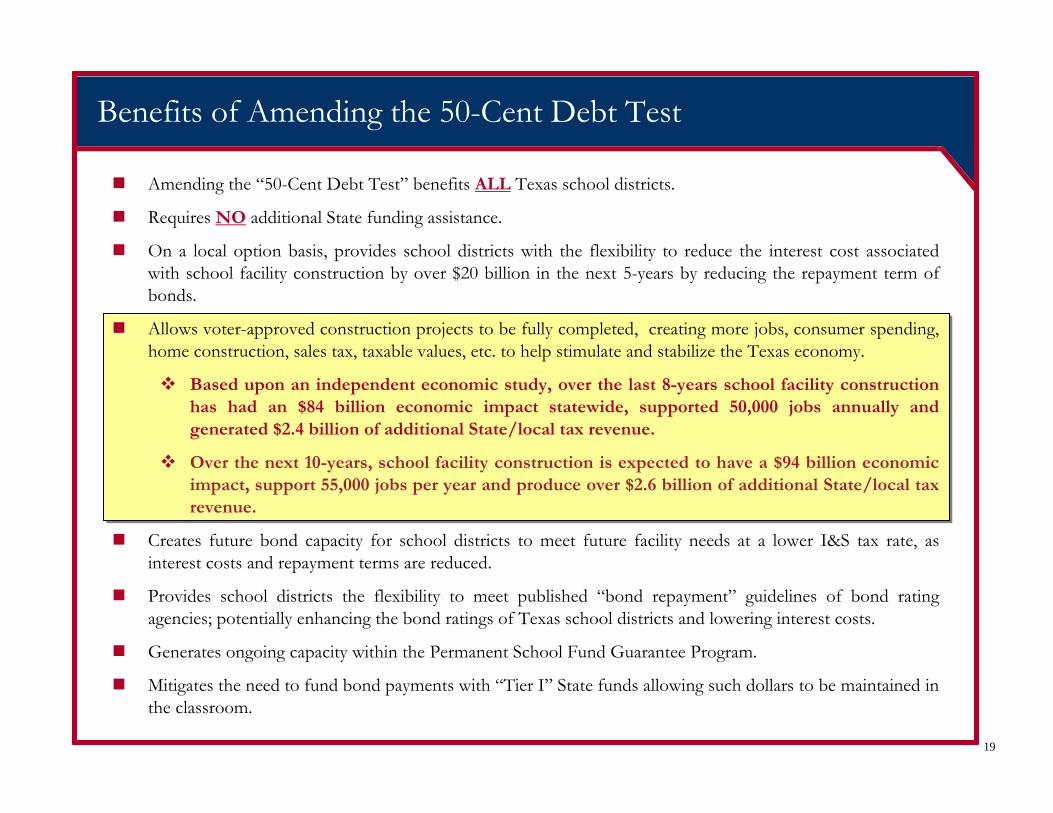
Benefits of Amending the 50-Cent Debt Test
Amending the “50-Cent Debt Test” benefits ALL Texas school districts.
Requires NO additional State funding assistance.
On a local option basis, provides school districts with the flexibility to reduce the interest cost associated with school facility construction by over $20 billion in the next 5-years by reducing the repayment term of bonds.
Allows voter-approved construction projects to be fully completed, creating more jobs, consumer spending, home construction, sales tax, taxable values, etc. to help stimulate and stabilize the Texas economy.
Based upon an independent economic study, over the last 8-years school facility construction has had an $84 billion economic impact statewide, supported 50,000 jobs annually and generated $2.4 billion of additional State/local tax revenue.
Over the next 10-years, school facility construction is expected to have a $94 billion economic impact, support 55,000 jobs per year and produce over $2.6 billion of additional State/local tax revenue.
Creates future bond capacity for school districts to meet future facility needs at a lower I&S tax rate, as interest costs and repayment terms are reduced.
Provides school districts the flexibility to meet published “bond repayment” guidelines of bond rating agencies; potentially enhancing the bond ratings of Texas school districts and lowering interest costs.
Generates ongoing capacity within the Permanent School Fund Guarantee Program.
Mitigates the need to fund bond payments with “Tier I” State funds allowing such dollars to be maintained in the classroom.
20
Dr. Cathy Bryce Investment Banker, Texas Public finance
333 West Campbell Road, Suite 350 │ Richardson, Texas 75080 E-Mail: [email protected] Mobile: 214.477.5972 │ Fax: 214.576.0890
Securities offered by BOSC, Inc., Registered Investment Advisor, a registered Broker/Dealer, Member FINRA/SIPC
BOSC, Inc. –Specialized Texas School District Finance Professionals
William J. GumbertManaging Director, Director of Texas Public Finance
333 West Campbell Road, Suite 350 │ Richardson, Texas 75080 E-Mail: [email protected] Direct: 214.576.0880 │ Mobile: 214.212.3153 │ Fax: 214.576.0890
Securities offered by BOSC, Inc., Registered Investment Advisor, a registered Broker/Dealer, Member FINRA/SIPC
Alison MabryAssociate, Texas Public Finance
333 West Campbell Road, Suite 350 │ Richardson, Texas 75080 E-Mail: [email protected] Direct: 214.576.0881 │ Mobile: 254.744.4555 │ Fax: 214.576.0890
Securities offered by BOSC, Inc., Registered Investment Advisor, a registered Broker/Dealer, Member FINRA/SIPC
Mike Jolly Investment Banker, Texas Public Finance
333 West Campbell Road, Suite 350 │ Richardson, Texas 75080 E-Mail: [email protected] Direct: 512.868.1980 │ Mobile: 512.751.0479 │ Fax: 214.576.0890
Securities offered by BOSC, Inc., Registered Investment Advisor, a registered Broker/Dealer, Member FINRA/SIPC
Joshua M. McLaughlinInvestment Banker, Texas Public Finance
333 West Campbell Road, Suite 350 │ Richardson, Texas 75080 E-Mail: [email protected] Direct: 214.576.0878 │ Mobile: 972.897.0503 │ Fax: 214.576.0890
Securities offered by BOSC, Inc., Registered Investment Advisor, a registered Broker/Dealer, Member FINRA/SIPC
Omar Garcia State Funding Consultant, Texas Public Finance
333 West Campbell Road, Suite 350 │ Richardson, Texas 75080 E-Mail: [email protected] Direct: 512.243.5917 │ Mobile: 512.565.7005 │ Fax: 214.576.0890
Securities offered by BOSC, Inc., Registered Investment Advisor, a registered Broker/Dealer, Member FINRA/SIPC
For additional information or questions, please contact the following: