Embed Size (px)
Citation preview

OUTSOURCINGINDUSTRY
REPORT2017

OUTSOURCING INDUSTRY REPORT 2017 GLOSSARY 2
GlossaryABSL The Association of Business Service Leaders in Romania
BIFS Banking, Insurance, Financial Services
BPO Business Process Outsourcing (commercial provider / outsourcing center)
F&A Finance and Accounting
FTE Full time employee
HR Human Resources
IT Information Technology
SSC Shared Service Centre (internal unit / captive center)
YE Year end

OUTSOURCING INDUSTRY REPORT 2017 CONTENT 3
ContentForeword 5
Introduction 8
Executive summary 10
Who are the participants in the survey? 13
Which services are provided by the participants? 26
What are the main characteristics of the workforce? 38
How is the business environment rated? 53
Conclusions 59

Foreword•••

OUTSOURCING INDUSTRY REPORT 2017 FOREWORD 5
Foreword
Cosmin PătlăgeanuPresident of the Managing BoardABSL Romania
Dear Members and Partners,
For the 5th year in a row, ABSL and KPMG have joined forces to put together the now traditional Report covering the state and shape of the Business Services sector. The evolution and transformation of the industry continued during the last year, many companies have expanded their scope of services, as we witnessed an increase in the adoption of robotics and advanced process automation.
The number of specialists employed in the industry is close to 120 thousand, with more than 200 enterprises and start-ups benefiting from their skills and knowledge. As English remains the most encountered language used in delivering services, French, German, Italian, Spanish and many others are now required and expected.
You will find in the Report a snapshot of the current state of affairs in our industry, and it is getting obvious that as the complexity grows, the new technologies disrupt the traditional models – delivery, operations and even talent acquisition. How will companies tackle the new challenges? How will the players in this market adopt and put to good use the automation tools? What are the opportunities the new paradigm brings? These questions are key into understanding the direction of the industry and the challenges it faces in the present times.
As the leading organization representing the industry, we at ABSL wish to make this industry the main engine of Romania’s economic growth and development, continuing our vision to be the bridge between companies in the sector, authorities and key stakeholders.
I would like to thank KPMG for being our trusted partner in elaborating this report and the member and non-member companies which responded to our survey.

OUTSOURCING INDUSTRY REPORT 2017 FOREWORD 6
Partner, Head of AdvisoryKPMG
With real GDP growth expected to be more than 5% in 2017, Romania will again rank among the European economic champions this year. Despite spectacular wage increases, inflation is still moderate, at less than 1% on average over the past 12 months, peaking at 1.7% y/y in September, while unemployment is nearing 5%, below its minimum reached in 2008.
If you look at these indicators alone, it appears that we are working in the right country, especially considering that the 2016 BPO index calculated by Cushman & Wakefield placed Romania in first place for mature outsourcing markets.
However, the other side of the coin is that many business leaders complain that recruiting workers is now the biggest hindrance to expanding their companies. Nevertheless, digital labor is becoming a reality and could help to overcome the labor shortage.
Today many organizations are making steady progress with a continued focus on IT, RPA and data analytics. One path to drive increased maturity for measurable and meaningful business development is to promote and enhance the use of intelligent automation. The key questions to consider are where to deploy digital labor and how to address change
and talent management issues.
In the long term, as the benefits of human based labor arbitrage will continue to decline, intelligent automation will have a major
impact on staffing models, operating models and the location of SSCs and BPOs.
I invite you to gain insights into the current state of the Romanian market, the opportunities and
challenges, as well as the future plans which many companies have. Is the sky our only limit? I would like to offer a big thank you to all of those companies which took the time to provide data that made the preparation of this study possible.
Foreword
Richard Perrin

Introduction01

OUTSOURCING INDUSTRY REPORT 2017 INTRODUCTION 8
Why this report and how did we do it?
WHY? Because •••
••• the outsourcing industry in Romania is growing every year.
••• the 2016 BPO index calculated by Cushman & Wakefield places Romania in 1st position in mature outsourcing markets.
••• Romania ranked 18th in the A.T. Kearney Global Services Location Index.
••• the headcount of the services companies operating in Romania is approximately 120,000 full time employees.
We would like to express our appreciation to those who allocated time and effort to completing the survey.
HOW DID WE DO IT?
• ABSL and KPMG have joined their forces to prepare and conduct a survey amongst Romanian outsourcing companies, to take the pulse of the local outsourcing market. The report represents an analysis of the industry in terms of existing capabilities, performance, processes and perceptions of the business environment.
• Data collection was carried out through a questionnaire prepared by ABSL with KPMG assistance, based on questionnaires from previous years, and submitted to participants by ABSL representatives. For reasons of confidentiality, completed questionnaires were provided by the respondents directly to KPMG, exceptions to this rule being made only based on the sole responsibility of the respondents. Processing of information received was carried out by KPMG only, for the same reasons of confidentiality. Data collection was carried out up to 26 September 2017 and no actions were undertaken to update this report for events or circumstances arising after that date.
• The data presented hereinafter express the status and the vision of the participants, without any statistical alteration. KPMG has only analyzed and processed the information received through questionnaires.

Executive summary02

OUTSOURCING INDUSTRY REPORT 2017 EXECUTIVE SUMMARY 10
Who are the participantsin the survey?
• Forty companies allocated time and effort to collect data that allowed us to conduct an analysis of the outsourcing market in Romania. The companies are both commercial providers and internal units, as well as companies operating under the hybrid model (serving both internal and external clients), employing in total approximately 30.4 thousand full time employees, which represents approximately 25% of the total estimated number of employees working in the business sector in Romania.
• The main locations where the companies have operations are Bucharest, Cluj-Napoca, Timisoara, as well as other cities such as Constanta, Brasov, Sibiu etc. However, most of the companies are primarily based in Bucharest.
• The turnover generated in the financial year 2016 by nineteen of the participants in the survey (who provided this information) is EUR 513 million.
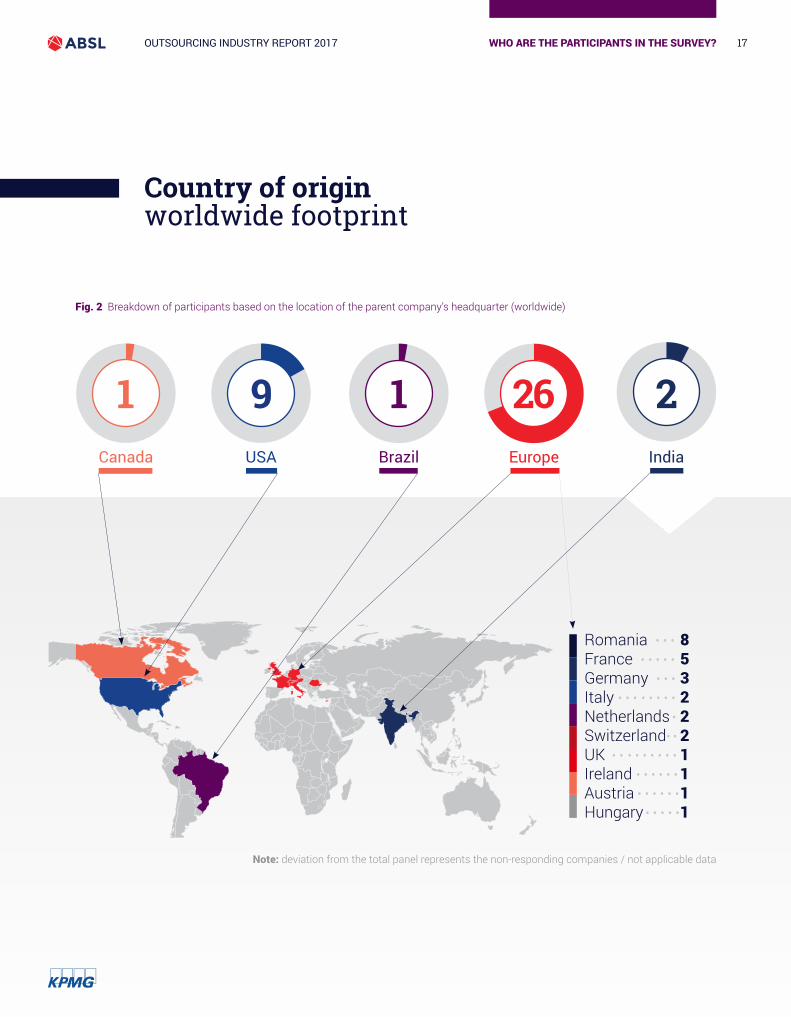
• Parent companies are mainly based in Europe (most commonly in Romania, France and Germany) and North America.
• The top four sectors serviced are Banking, Insurance, Financial Services (BIFS), Business and Professional Services, Technology & Telecom and Industrial & Consumer Goods.
• Most of the participants in the survey have expansion plans for the next one to two years, in some cases combined with stabilization and optimization of their current activities.
• 82.5% of the respondents are highly mature organizations, with processes measured, KPIs analyzed and focused on continuous improvement.
Which services are provided by the participants?
• The most frequently encountered services provided are IT, Finance & Accounting, Customer Operations, HR and Procurement.
• Clients are mainly located in Western Europe and CEE, including Romania. Three companies provide services only to Romanian clients, while four companies provide services worldwide.
• The scope of services was expanded in the last three years for 84% of the companies who provided this information.
• The advancement of services significantly increased in the last three years for 70% of the companies surveyed.
• Various forms of process automation are used by most of the companies surveyed. Approximately half of them use only basic process automation. However robotic, autonomic or advanced process automation can be encountered in many companies.
• The most encountered language is English, followed by other European languages, such as French, German, Italian, Spanish etc. The maximum number of languages spoken within one business services company is twenty two. More than ten languages are used during service delivery by eighteen companies.
Executive summary

OUTSOURCING INDUSTRY REPORT 2017 EXECUTIVE SUMMARY 11
What are the main characteristics of the workforce?
• Most of the personnel employed by the participants in the survey are located in Bucharest (72%). In addition, 8% are located in Cluj-Napoca, another 8% in Iasi and 2% in Timisoara.
• An analysis of the employment structure by services offered revealed that 30% of the employees provide IT services, 25% Finance & Accounting and 21% Customer Operations.
• The total pool of human resources is expected to record an increase of 10% by the end of 2017 and another 14% by the end of 2018. The key drivers for employment growth are the implementation of new business areas, the estimated increase in external demand and global restructuring plans.
• The average attrition rate is 20%.
• Female employees are in a clear majority (61%).
• Most of the companies reported that the average age of the workforce is between 26 and 35.
• More than half of the companies providing information about the average level of seniority of their employees reported it as being between 1 and 3 years.
• The majority of the employees have at least a Bachelor’s degree, with 30% of them also having a Master’s or a PhD degree.
• Training courses offered to employees by the companies addresses both technical skills, language competencies and soft skills.
• Language proficiency, especially German C1 level is the most needed skill as mentioned by the participants in the survey, followed by IT knowledge. In addition, other specific technical skills needed during service delivery are mentioned by the respondents, such as financial and business analysis, engineering, sales, payroll etc.
How is the business environment rated?
• The overall assessment of the location where the companies employ the majority of their staff is mostly positive, with the highest ratings being given for the availability of modern space and city accessibility. The lowest ratings are granted for the cooperation with local authorities.
• Competition on the market is rated as strong or very strong by all the participants. The average rating for competition was 8.6 (on a scale from 1 to 10, with 10 being the strongest).
• A limited number of companies have benefited from public support, the most commonly encountered forms of such support being government grants and local tax exemptions.
• 78% of respondents consider that public policy changes take place too often and are difficult to cope with.
• 92.5% of the participants in the survey consider Romania a good place for investing and would recommend Romania to potential investors.
Executive summary

Who are the participantsin the survey?03
“We are witnessing an unprecedented growth of the industry with a diversification of services and spread of delivery locations across the country. The talent, language capabilities and continuing appetite for investment have driven organizations to develop their portfolio towards more value added and innovative services. They drive long term sustainability and propel the business services industry towards additional growth in the country. I am positive that the journey will continue over the next few years and that we will be seeing existing players on the market extending their portfolio and footprint and make it attractive for new players to exploring opportunities to set up new business. The industry has already become the engine for economic growth in the country and will drive wealth over next period.”
Florin GramaFormer President of ABSL, Director of Support Engineering EMEA & Site Leader Service Delivery Center Romania, Customer Service & Support, Microsoft

OUTSOURCING INDUSTRY REPORT 2017 WHO ARE THE PARTICIPANTS IN THE SURVEY? 13
Overview of the companiesparticipating in the surveyFollowing last year’s surveys results, more and more companies are willing to participate in the survey with data that help us analyze the outsourcing market in Romania. This year, 40 companies participated. Amongst the companies surveyed, the largest share of jobs was reported by the commercial providers (50%), followed by internal units (35.5%), while hybrid models had only 14.5% of the share.
Given the number of full time employees working in business services, estimated at 120 thousand, this report was prepared on the basis of responses from companies hiring 25% of the total number of employees.
40The total number of companies that took partin the survey, out of which...
... employing in totalbased on the information
provided by 39 participants
30.4thousand FTEs
17 35.5%Internal unit/ captive center 10.8 thousand FTEs
17 50%Commercial provider/outsourcing centers 15.2 thousand FTEs
6 14.5%Hybrid model 4.4 thousand FTEs

OUTSOURCING INDUSTRY REPORT 2017 14WHO ARE THE PARTICIPANTS IN THE SURVEY?
Overview of the companiesparticipating in the survey
9 <= 200 FTEs 11 201 – 500 FTEs
split of companies basedon the number of full time employees
Note: deviation fromthe total panel representsthe non-respondingcompanies / not applicable data
5 501 – 1,000 FTEs 14 > 1,000
19 1 location 13 2 locations
split of companies based on the numberof locations where they have operations
6 3 locations 2 more than 3 locations
19 core members 13 associate members
split of companies based on the ABSLmembership category
1 strategic partner 7 non-members

OUTSOURCING INDUSTRY REPORT 2017 WHO ARE THE PARTICIPANTS IN THE SURVEY? 15
Participants basedon the year of establishmentThe first centralized services appeared in Romania many years ago, as is proved by the aging of operations mentioned by the participants in this survey. The oldest companies started their operations back in 1994 / 1995 (i.e. two companies) and another company started up in 1999.
Seven companies opened centers in Romania between 2000 and 2005, while most of the participants in the survey opened their centers between 2006 and 2010 (nineteen companies). Ten of the respondents started service delivery from Romania in the last seven years.
One company refrained from providing information about its year of establishment.
1994 - 2017

OUTSOURCING INDUSTRY REPORT 2017 16WHO ARE THE PARTICIPANTS IN THE SURVEY?
Main locations of the participants
Several companies provide services from less common locations, such as Targu Jiu, Miercurea Ciuc, Piatra Neamt, Mioveni, Suceava, Pitesti etc.
Fig. 1 Locations of the participants
Timisoara
Cluj-Napoca
SibiuBrasov
BucharestCraiova Constanta
Iasi
Galati
2 head offices4 secondary locations
1 head office1 secondary location
2 main location3 secondary locations
16 head offices18 main locations1 secondary location
4 secondary locations
3 secondary locations
2 secondary locations3 secondary locations
1 main location2 secondary locations
OUTSOURCING INDUSTRY REPORT 2017 WHO ARE THE PARTICIPANTS IN THE SURVEY? 17
Country of originworldwide footprint
Fig. 2 Breakdown of participants based on the location of the parent company’s headquarter (worldwide)
Note: deviation from the total panel represents the non-responding companies / not applicable data
1Canada USA EuropeBrazil India
9 1 26 2
Romania • • • 8France • • • • • 5Germany • • • 3Italy • • • • • • • • 2Netherlands • 2 Switzerland• • 2UK • • • • • • • • • 1Ireland • • • • • • 1Austria • • • • • • 1Hungary • • • • • 1

OUTSOURCING INDUSTRY REPORT 2017 WHO ARE THE PARTICIPANTS IN THE SURVEY? 18
Split of companiesbased on turnoverNineteen of the total of forty participants in the survey who provided information or usable information about turnover, generated a turnover of EUR 513 million in the financial year 2016.
A rough estimation of the annual turnover generated per employee ranges between EUR 11.5 thousand and EUR 136.3 thousand, with an average turnover of EUR 33.7 thousand per year. However, given the reduced number of companies providing information at this subject, the figures might not be sufficiently accurate.
Note: deviation from the total panel represents the non- responding companies / not applicable data
Fig. 3 Classification of companies based on the turnover generated
6companies
1company
6companies
5companies
1company
< 5 mil. EUR
5-10 mil. EUR
10-20 mil. EUR
20-50 mil. EUR
> 50 mil. EUR

OUTSOURCING INDUSTRY REPORT 2017 WHO ARE THE PARTICIPANTS IN THE SURVEY? 19
Participants by sectorof the parent company
The most common sectors encountered are Business and Professional Services (for eighteen companies) and Technology & Telecom (for twelve companies).
Other sectors not detailed in the chart include consulting services, logistics, various manufacturing industries and the automotive industry.
Total no. of companieswith parent operatingin only one sector
29Fig. 4 Participants by sector of parent company
Note: the total number of answers exceeds the number of respondents,as some of the companies’ parents come from more than one sector
18
16
14
12
10
8
6
4
2
0Business and Professional Services(incl. BPO)
Technology& Telecom
Banking, Insurance, Financial Services (BIFS)
Other Industrial& Consumer Goods
Consumer Services(incl. Media, Retail, Travel& Leisure)
Energy, Utilitiesand Basis Materials
Health Care
18
129 8
3 3 2 2 ←
Num
ber o
f com
pani
es

OUTSOURCING INDUSTRY REPORT 2017 WHO ARE THE PARTICIPANTS IN THE SURVEY? 20
Sectors serviced
The main sectors serviced by the participants in the survey follow to some extent the sectors in which companies’ parents operate. The top four sectors serviced are Banking, Insurance, Financial Services, Business and Professional Services, Technology & Telecom and Industrial & Consumer Goods.
The other sectors not detailed in the chart, are Pharmaceuticals, Agri Business, Gaming & Betting, Airport Management, Automotive, Audit etc.
Fig. 5 Participants by sectors serviced
0
25
20
15
10
5
Business andProfessionalServices
Technology& Telecom
Industrial& Consumer Goods
Energy, Utilities and Basis Materials
Consumer Services(incl. Media, Retail, Travel& Leisure)
Health Care Other Public SectorBanking, Insurance, Financial Services (BIFS)
2319 18 16
13 12 10 106
← N
umbe
r of c
ompa
nies
Note: the total number of answers exceeds the number of respondents,as some of the companies provide services to clients from several sectors

OUTSOURCING INDUSTRY REPORT 2017 21WHO ARE THE PARTICIPANTS IN THE SURVEY?
Plans relating to business activityfor the next one to two years Except only one company which has no plans to change its current activities, all the other companies have expansion plans, in some cases combined with stabilization and optimization of their current activities. None of the companies surveyed intends to reduce its activity in the near future.
Out of the twenty three companies with expansion plans, three intend to expand by providing same activities to new clients, while two will expand by providing new activities to the same clients. In addition, seven companies intend to provide new activities to new clients. All the remaining eleven companies will expand by providing current and new services to current or new clients.
The figures presented in the next pages detail the expansion plans of the participants in the survey, broken down according to their organizational model (Fig. 7) and according to their headcount (Fig. 8).
Fig. 6 Plans relating to business activity for the next one to two years
Has no plans to change its current activities
company1
Have plans onlyfor stabilizationand optimizationof current activities
companies3
Have expansion plans, combined with stabilization companies and optimizationof current activities
companies13
Have expansion plans
companies23

OUTSOURCING INDUSTRY REPORT 2017 22WHO ARE THE PARTICIPANTS IN THE SURVEY?
Plans relating to business activityfor the next one to two years 89% of the commercial providers and 85% of the hybrid service providers have expansion plans. Although in a smaller proportion, internal units also have plans for business development in the coming years (66% of them).
Stabilization and optimization of current activities were mentioned by 19% of the total participants in the survey, although in a higher percentage by the internal units.
Fig. 7 Plans for expansion based on organizational model
Total
Internal units
Commercial providers
Hybrid organizations
0% 5% 10% 15% 20% 25% 30% 35% 40%
Expansion of activities new activities, new clients
Expansion of activities same activities,new clients
Expansion of activities new activities,same clients
Stabilization and optimization ofcurrent activities
No plans to change current activities
30%
1%
24%
26%
19%
25%
3%
16%
25%
31%
32%
31%
26%
11%
39%
23%
23%
15%

OUTSOURCING INDUSTRY REPORT 2017 23WHO ARE THE PARTICIPANTS IN THE SURVEY?
Plans relating to business activityfor the next one to two years Irrespective of their number of employees, more than three quarters of the companies participating in the survey have expansion plans in the next one to two years. Provision of new activities to new or current clients was mentioned by 35% of the companies with between 201 and 500 employees and 37% of companies with between 501 and 1,000 employees.
As we have seen earlier, the stabilization and optimization of current activities is a focus for 19% of the companies, however in a higher percentage for the companies with a headcount of between 201 and 500 and between 501 and 1,000.
Fig. 8 Plans for expansion based on the employment range
0% 5% 10% 15% 20% 25% 30% 35% 40%
Expansion of activities new activities, new clients
30% 28% 35% 37% 29%
Expansion of activities same activities,new clients
24% 28% 23% 13% 24%
Expansion of activities new activities,same clients
26% 28% 18% 25% 26%
Stabilization and optimization ofcurrent activities
19% 16% 24% 25% 18%
No plans to change current activities
1%
3%
Total <= 200 FTEs 201 - 500 501 - 1,000 > 1,000

OUTSOURCING INDUSTRY REPORT 2017 WHO ARE THE PARTICIPANTS IN THE SURVEY? 24
Organizational maturity
82.5% of the total companies participating in the survey (i.e. thirty three companies) are highly mature organizations, with processes measured and KPI calculated and analyzed recurrently and with focus on continuous improvement.
Eight companies providing a wide range of services rated themselves in more than one stage of maturity, probably due to different levels of maturity for different processes / activities.As already presented, an expansion of activities is planned by almost all the companies, irrespective of their maturity level, size or organizational structure. However, the trend observed is that those with higher maturity levels are more focused on expanding their businesses.
Fig. 9 Breakdown of participants according to their organizational maturity level and their development plans
Expansion
Expansion and stabilization
No change planned
Stabilization
Note: the total number of answers exceeds the numberof respondents, as some of the companies rated
their processes in more than one category
0 5 10 15 20 25
Continuous improvement run based on result of process execution
13 6 1 3
Processes are measured and KPIs analyzed 9 7 1
All processes definedand followed 7 2
Ad-hoc execution, implementation plan in place 1
Some processes defined, transition in progress 4 2
← N
umbe
r of c
ompa
nies

Which services are providedby the participants?04
“This chapter of the Outsourcing Industry Report is trying to picture the landscape of capabilities of our industry. The large variety of services provided by the players is an indicator of the maturity of business services in Romania. There is no surprise that IT Services and F&A are the main services provided, these two being the pioneers of the outsourcing.
The vast majority of clients are located in Europe, Romania acting as a natural nearshore hub enabled by the languages and skills available in the market.
One of the most important trends is the fact that the industry is embracing automation in different forms and shapes as a mean to reach the next level of efficiency.”
Ciprian DanVice-President, Knowledge Sharing, ABSL Romania

OUTSOURCING INDUSTRY REPORT 2017 WHICH SERVICES ARE PROVIDED BY THE PARTICIPANTS? 26
Main services provided
The services provided by the business services companies participating in the survey are highly diverse, proving once again the high capabilities of the industry. The services provided vary from IT, Finance & Accounting and Customer Operations to some processes specific to several industries / sectors, such as health care, capital markets or public sector.
Overall, the companies surveyed are providing more than twenty types of services. In addition, some of the companies are providing, besides the traditional ones, some less common services such as facility management or real estate management.
Fig. 10 Key figures related to the services provided
is the maximum number of services provided by one company
14companies are providingonly one type of service
5
is the number of companies providing a minimumof ten types of services
4companies are providingbetween five and nine differenttypes of services
14

OUTSOURCING INDUSTRY REPORT 2017 27WHICH SERVICES ARE PROVIDED BY THE PARTICIPANTS?
Main services provided
The main services provided by the companies participating in the survey are IT, Finance & Accounting, Customer Operations, HR and Procurement, as is shown in the figure below.
Fig. 11 Respondents split by scope of services provided
0 5 10 15 20 25 30
← N
umbe
r of c
ompa
nies27IT Services
F & A
Customer Operations
HR
Procurement
Business Transformation
Project Management
Document Management
Supply Chain Management
Knowledge Management
Marketing
Insurance Specific Processes
Industrial & Consumer Goods Specific Processes
Consumer Services Specific Processes
Banking Specific Processes
Technology & Telecom Specific Processes
Energy, Utilities and Basic Materials Specific Processes
Business and Professional Services Specific Processes
Other
Research & Development
Health Care Specific Processes
Capital Market Specific Processes
Public Sector Specific Processes
2621
1615
1312
108
76
5
4
4
3
2
5
5
4
3
2
11

OUTSOURCING INDUSTRY REPORT 2017 28WHICH SERVICES ARE PROVIDED BY THE PARTICIPANTS?
Main services provided
A more detailed analysis of the main processes carried out and the related sub-processesis presented in the following figures.
Fig. 12 Sub-processes of IT services Fig. 13 Sub-processes of Finance& Accounting services
0 5 10 15 20 25
General Ledger& Reporting
AccountsReceivable
AccountsPayable
BusinessControlling
Travel& Expenses
Master DataManagement
Treasury
21
21
21
17
15
13
9 ←
Num
ber o
f com
pani
es
0 5 10 15 20 25
InfrastructureManagement / Support
User Support/ Service desk
Application Lifecycle Management
Information Security
Request Fullfilment/ process execution
Automatization / Optimization of Service Delivery
Other IT Services
Enabling Services
22
15
13
10
9
8
8
8
← N
umbe
r of c
ompa
nies

OUTSOURCING INDUSTRY REPORT 2017 29WHICH SERVICES ARE PROVIDED BY THE PARTICIPANTS?
Main services provided
Fig. 15 Sub-processesof Human Resources services
Fig. 14 Sub-processesof Customer Operations services
0 5 10 15
Fulfillment
Customer Helpdesk
Sales & AccountMgmt Support
15
12
9
← N
umbe
r of c
ompa
nies
Fig. 16 Sub-processesof Procurement services
0 5 10 15
OperationalProcurement
StrategicProcurement
15
9
← N
umbe
r of c
ompa
nies
0 2 4 6 108 1412
Recruitment
HRAdministration & Reporting
Payroll
Compensation& Benefits
Mobility
TalentManagement
14
12
11
8
5
5
← N
umbe
r of c
ompa
nies

OUTSOURCING INDUSTRY REPORT 2017 30WHICH SERVICES ARE PROVIDED BY THE PARTICIPANTS?
Geographical rangeof services providedThe services provided by the respondents to the survey are mainly concentrated on clients located in Western Europe and CEE, including Romania. However, a good proportion of the companies participating in the survey provide services to clients located in the Middle East & Africa and North America.
The number of geographical ranges exceeds the number of participants in the survey, as most of the companies cover several geographical areas during service delivery.
Fig. 17 Geographical range of services provided
14North
America
10South
America
37Western Europe
23CEE
(excluding Romania)
16Middle East
& Africa 10Asia Pacific

OUTSOURCING INDUSTRY REPORT 2017 WHICH SERVICES ARE PROVIDED BY THE PARTICIPANTS? 31
Geographical rangeof services provided
Out of the total eight companies with Romanian capital, global reach support was claimed only by one company. On the other hand, the global reach support was claimed by three of the companies with foreign capital (out of the total thirty two participants in the survey that provided information on this subject).
Fig. 18 Other information about the geographical range of services provided
Companies provide services only to clients operating outside Romania
8Companies provide servicesonly to clientslocated in Romania
3Companies provideservices worldwide
4

OUTSOURCING INDUSTRY REPORT 2017 32WHICH SERVICES ARE PROVIDED BY THE PARTICIPANTS?
Scope of services
Fig. 19 Scope of servicesbased on the organizational model
Fig. 20 Scope of servicesbased on the employment range
The outsourcing market in Romania is growing, both in terms of the number of companies providing shared or outsourcing services and in terms of already existing companies that conduct business in Romania expanding their scope of services. 84% of the total companies participating in the survey that provided information about their scope of services (i.e. thirty eight companies provided this information) mentioned an expansion of the scope of their services in the last three years. None of the companies reduced the scope of their services. The figures below details the evolution of the scope of services of the participants, broken down according to their employment range and their organizational model.
Total
Internal units
Commercial providers
Hybrid organizations
Total
<= 200 FTEs
201 - 500
501 - 1,000
> 1,000
0% 20% 40% 60% 80% 100%
Scope of services was expanded
Scope of services did not change
84%75%
25%
87%
13 %
16%
100%
0% 20% 40% 60% 80% 100%
Scope of services was expanded
Scope of services did not change
84%63%
37%
90%
16%
100%86%
10 %
14 %

OUTSOURCING INDUSTRY REPORT 2017 33WHICH SERVICES ARE PROVIDED BY THE PARTICIPANTS?
Advancement of the level of services
In the last three years, 70% of the companies surveyed (i.e. twenty-eight companies) reported a significant increase in their advancement of services, while 25% (i.e. ten companies) also reported an increase in the advancement of the services provided, although not a significant one. Only 5% of the companies surveyed provided services at the same level of advancement.
Four internal units and two commercial providers did not change the scope of their services. However half of them reported a significant increase in the advancement of their services, while one reported a slight increase.
All of the surveyed companies that in the last three years have expanded their range of services and significantly increased the advancement of service, also plan to expand their activity in the next one to two years, in some instances combined with the stabilization of current activities.
Fig. 21 Correlation between the evolution of the scope of services and of the advancement of services
Advancement of services significantly increased
Advancement of services insignificantly increased
Advancement of servicesdid not change
0% 20% 40% 60% 80% 100%
89 %
87 %13 %
11 %
100 %Scope of services was expanded
Scope of services did not change

OUTSOURCING INDUSTRY REPORT 2017 34WHICH SERVICES ARE PROVIDED BY THE PARTICIPANTS?
Automation of processes
Whether we are speaking about basic, robotic, autonomic or advanced process automation, an overwhelming majority of the companies participating in the survey (90%, i.e. thirty four companies out of the total thirty eight that provided information on this subject) are using it.
While four companies deliver services in a traditional manner, without using automation, twelve others are using various levels of automation.
Most of the companies that are using basic process automation rated themselves as highly mature organizations.
Fig. 22 Automation of processes
Basicprocess automation
(simple VBA scripts, spreadsheet based, simple data)
Roboticprocess automation
(RPA tools, simplerules, structured data)
Autonomicprocess automation
(automation of complex rules, unstructured data)
Advancedprocess automation
(pre-cognitive& cognitive solutions)
No automationused during service delivery
48 % 24% 8% 10 %
10 %

OUTSOURCING INDUSTRY REPORT 2017 35WHICH SERVICES ARE PROVIDED BY THE PARTICIPANTS?
Languages usedin delivering services
Fig. 23 Languages used during service delivery
0 5 10 15 20 3025 35 40
← N
umbe
r of c
ompa
nies
38English
French
German
Italian
Romanian
Spanish
Dutch
Russian
Polish
Hungarian
Portuguese
Czech
Greek
Swedish
Turkish
Arabic
Bulgarian
Norwegian
Serbian
Slovak
Finnish
Danish
Hebrew
3333
2928
2519
1815
1414
10
10
8
7
6
10
10
8
8
7
55
As shown in the figure above, strong capabilities can be found in major European languages. In addition, Chinese and Croatian are spoken in two companies, while Japanese, Slovenian and Ukrainian, are each encountered in one company.

OUTSOURCING INDUSTRY REPORT 2017 WHICH SERVICES ARE PROVIDED BY THE PARTICIPANTS? 36
Languages usedin delivering services
Fig. 24 Key figures related to language capabilities
Overall, a total of 33 languages are spoken by the pool of employees working in the companies participating in the survey. However even though strong language proficiency is reported, language competences are some of the most challenging skills to be found on the market, sometimes combined with technical ones. Detailed information about the top skills needed can be found later in this report.
The maximum numberof languages spokenin one company
22Companiesdeliver servicesin more than 5 languages
30Companiesdeliver servicesin more than 10 languages
18The averagenumber oflanguages spoken
9

What are themain characteristicsof the workforce?
05
“In our previous industry reports we kept predicting a sustainable and continuous growth in our dynamic market sector despite the frequent legislative changes and challenges, these figures have proved to be true. The competition for the business services employable workforce in Bucharest is still very aggressive, while noticing a slow paced but healthy expanse towards tier 3 cities in the country. The core of the workforce is still very young (26 – 35 years old with most of our respondents), however half of our current employees have stepped up in seniority ranks showing their steady dedication to the industry. All these factors are in our opinion indicators that the Romanian market has successfully adapted and matured from a workforce perspective and remains competitive at a global level for potential investors.”
Dragoș ȘtefanVice-President, Education, ABSL Romania

OUTSOURCING INDUSTRY REPORT 2017 38WHAT ARE THE MAIN CHARACTERISTICS OF THE WORKFORCE?
Employment structureby location
Fig. 25 Employment structure by location
1,053 full time employees provide services from other locations not presented on the map due to either insufficient information or the low number of FTEs per location.
Timisoara514
Cluj-Napoca2,368
Sibiu649 Brasov
803
Bucharest21,972Craiova
236Constanta70
Iasi2,327
Galati419
72 %
2 %
8 %8 %

OUTSOURCING INDUSTRY REPORT 2017 39WHAT ARE THE MAIN CHARACTERISTICS OF THE WORKFORCE?
Employment structureby location
Bucharest Amongst the surveyed companies, Bucharest is the location most encountered.
Thirty five of the total participants in the survey carry out their operations from Bucharest, employing in total a number of more than 21 thousand full time employees (72% of the total headcount employed by the companies participating in the study).
Cluj-Napocaand Iasi Cluj-Napoca and Iasi are the following locations in terms of headcount, with more than 2.3 thousand full time employees each (8% of the total), hired in six locations in Cluj-Napoca and five locations in Iasi.
Timisoara Although Timisoara has some major internal units and commercial providers that are established there, their presence in this year’s study was very limited. Only 0.5 thousand employees are hired by the four companies participating in the survey that have operations in Timisoara.
Other locations Approximately 2.1 thousand full time employees work from other locations presented on the map in Fig. 25.
In addition to the numbers presented on the map, there are another 1,053 employees in other locations. They are not explicitly presented on the map due to insufficient information or the low number of employees per location.

OUTSOURCING INDUSTRY REPORT 2017 40WHAT ARE THE MAIN CHARACTERISTICS OF THE WORKFORCE?
Employment structureby services offeredAn analysis of the employment structure of the companies participating in the survey in terms of services offered revealed that the largest share of the employees are delivering IT, Finance & Accounting and Customer Operations services (in total 76%).
10% of the employees are delivering Banking, Insurance and Financial services, while HR and Supply Chain management are each delivered by 3% of the employees.
The figure below details the employment structure based on the responses of thirty six companies, which employ a total of 25,342 full time employees.
Fig. 26 Employment structure by services offered
0% 10% 20% 30% 40% 50% 60% 70% 80% 90% 100%
IT Services
Finance & Accounting
Customer Operations
Banking, Insurance, Financial Services
Other services
HR Services
Supply Chain Management
30%
25%
21%
10%
8%
3%
3%

OUTSOURCING INDUSTRY REPORT 2017 41WHAT ARE THE MAIN CHARACTERISTICS OF THE WORKFORCE?
Employment structureby services offered
Fig. 28 Employment structure by typesof services provided by internal units
Fig. 29 Employment structure by types of services provided by hybrid models
Fig. 27 Employment structure by types of services provided by commercial providers
0% 10% 20% 30% 40% 50%
IT Services 41%
Customer Operations 41%
Finance & Accounting 7%
BIFS 6%
Other services 3%
HR Services 1%
Supply Chain 1%
0% 10% 20% 30% 40% 50%
Finance & Accounting 33%
IT Services 18%
BIFS 16%
Other services 11%
Supply Chain 8%
Customer Operations 7%
HR Services 7%
0% 10% 20% 30% 40% 50% 60% 70% 80% 90% 100%
IT Services
Customer Operations
Finance & Accounting
BIFS
Other services
HR Services
Supply Chain
34%
27%
23%
7%
6%
2%
1%
The employment structure varies depending on the type of company (internal unit, commercial provider or hybrid model). While in commercial providers and in the companies operating a hybrid model, the main proportion of the employees are providing IT and Customer Operations services (i.e. 61% for commercial providers and 82% for the hybrid companies), in the internal units the focus is on Finance & Accounting, IT and BIFS (i.e. 67%.)

OUTSOURCING INDUSTRY REPORT 2017 42WHAT ARE THE MAIN CHARACTERISTICS OF THE WORKFORCE?
Employment forecast
Fig. 30 Employment forecast
Companies participating in the survey were requested to provide information about the employment forecast for the end of 2017 and the end of 2018. The following growth percentages were calculated based on the answers received from thirty seven companies who provided information on this subject (employing in total 27.6 thousand full time employees).
An increase in headcount is expected by 92% of the companies (i.e. thirty four respondents), while only 5% of them expect a headcount decrease (i.e. two companies) and 3% expect no change in the current number of employees (i.e. one company).
The total pool of human resources is expected to increase by 10% by the end of the year 2017 and by another 14% in 2018 compared to the end of 2017, as shown in Fig. 30. The key drivers for employment forecast are detailed in the next pages of this report.
Note: deviation from the total panel represents the non-responding companies / not applicable data
2017actual at study date
27.6thousandfull time employees
YE 2017 forecast
30.4thousandfull time employees
YE 2018 forecast
34.8thousandfull time employees
10 % 14 %

OUTSOURCING INDUSTRY REPORT 2017 43WHAT ARE THE MAIN CHARACTERISTICS OF THE WORKFORCE?
Key drivers for employment growth
Fig. 31 Key drivers for employment considering the organizational model
The key drivers for employment growth are implementation of new business areas, estimated increase in external demand and global restructuring plans, although in different percentages and importance considering the organizational model of the companies. Less mentioned are acquisitions, which are considered by only 9% of the participants in the survey, in more or less equal proportions considering the organizational model.
0% 5% 10% 15% 20% 25% 30% 35% 40% 45% 50%
Increase in external demand34%
21%47%
38%
Global restructuring plans19%
32%9%
8%
New business areas37%
35%35%
46%
Acquisitions9%9%9%
8%
Other drivers1%3%
For the internal units, the development of new business areas and global restructuring plans are mentioned as the most important drivers for employment growth, mentioned by 35% and 32% respectively of the respondents operating this model. In addition, 21% of the internal units consider the increase in external demand as another important factor for employment growth.
For the commercial providers, the increase in external demand is the most important driver, mentioned by 47% of the companies, followed by development of new business areas, which was mentioned by 35% of them. Global restructuring plans covers a less important proportion, being mentioned each by 9% of the respondents.
Companies operating a hybrid model consider the development of new business areas and an increase in external demand as the most important growth drivers, being mentioned by 46% and 38% respectively of the participants
Total Internal unit Commercial provider Hybrid organizations

OUTSOURCING INDUSTRY REPORT 2017 44WHAT ARE THE MAIN CHARACTERISTICS OF THE WORKFORCE?
Key drivers for employment growth
Fig. 32 Key drivers for employment considering the employment range
The largest companies participating in the survey (with more than 1,000 full time employees) mentioned as a key driver for employment growth increase in external demand and the development of new business areas (37% of the respondents for each of the drivers).
0% 5% 10% 15% 20% 25% 30% 35% 40%
Increase in external demand34%34%
29%34%
37%Global restructuring plans
19%13%
29%33%
13%New business areas
37%33%
37%33%
37%Acquisitions
9%13%
5%
13%Other drivers
1%7%
The companies with between 501 and 1,000 full time employees estimated the growth due to an increase in external demand, global restructuring plans and the development of new business areas in more or less equal proportions.The companies with between 201 and 500 full time employees mentioned as the main driver the development of new business areas (37% of the respondents), followed by an increase in external demand and global restructuring plans, each mentioned by 29% of the respondents.The smaller companies, with a headcount lower than 200 full time employees, estimated the growth mainly due to an increase in external demand and development of new business areas, each driver being mentioned by approximately one third of these companies.
Total <= 200 201-500 501-1000 > 1,000

OUTSOURCING INDUSTRY REPORT 2017 45WHAT ARE THE MAIN CHARACTERISTICS OF THE WORKFORCE?
Attrition rate
The average attrition rate is 20%. The average is calculated based on the usable information provided by thirty two participants in the survey, which employ in total approximately 24 thousand full time employees.
45% of the respondents have reported an attrition rate up to 20%. These respondents employ in total approximately 40% of the full time employees analyzed.
Higher attrition rates have been observed amongst commercial providers and companies operating a hybrid model.
Out of the total respondents, only a few provided information about the evolution of the attrition rate during the last three years. Most of them reported a stable or slightly increased attrition rate over the analyzed period.
<= 10%
11% - 20%
21% - 30%
31% - 40%
> 41%
Attrition rate Internal units <= 200 201 – 500 501 - 1,000 > 1,000
22%
25%
41%
9%
3%
Services companies
overallCommercialproviders
Hybrid models
36%
21%
36%
7%
0%
9%
33%
33%
17%
8%
17%
17%
66%
0%
0%
29%
14%
57%
0%
0%
34%
22%
22%
11%
11%
20%
20%
20%
40%
0%
9%
36%
55%
0%
0%
Organizational model Employment range (FTEs)
20%
Table 1 Attrition rate

OUTSOURCING INDUSTRY REPORT 2017 46WHAT ARE THE MAIN CHARACTERISTICS OF THE WORKFORCE?
Workforce demographics
Fig. 33 Gender distribution
Fig. 34 Average age of the workforce
Female employees are in a clear majority in most of the companies. Approximately 61% of the total employees are female (calculated based on the information provided by thirty eight companies, employing in total 29 thousand full time employees). Eight companies reported having more male employees; these companies mainly provide IT services. For these companies, the percentage of male employees varies between 55% and 71%. In addition, two companies have an equal distribution between female and male employees.
90% of the companies (i.e. thirty six) indicated that the average age of their employees is between 26 and 35, 7.5% (i.e. three companies) indicated the average age is between 20 and 25, while only one company reported an average age above 35.
39%malerepresenting11.2 thousandfull time employees
femalerepresenting17.8 thousandfull time employees
61%
20 - 25The average age of workforce reported by
3 companies
26 - 35The average age of workforce reported by
36 companies
> 35The average age of workforce reported by
1 company

OUTSOURCING INDUSTRY REPORT 2017 47WHAT ARE THE MAIN CHARACTERISTICS OF THE WORKFORCE?
Average level of seniority
Fig. 35 Average level of seniority
Most of the companies providing information about the average level of seniority reported it as between 1 and 3 years. These companies (i.e. fifteen in total) have a total headcount of approximately 14.5 thousand full time employees.
Another seven respondents reported an average seniority level of between 3 and 5 years. These companies have a cumulated headcount of approximately 5.7 thousand full time employees.
An average level of seniority of more than 5 years was reported by six companies, employing in total 3.2 thousand full time employees.
The average level of seniority has been calculated based on the information received from twenty nine companies, which employ in total approximately 23.5 thousand full time employees.
1company
less than 1 year
15companies
1 to 3 years
6companies
more than 5 years
7companies
3 to 5 years

OUTSOURCING INDUSTRY REPORT 2017 48WHAT ARE THE MAIN CHARACTERISTICS OF THE WORKFORCE?
Level of educationand certifications held by employeesThe split is calculated based on the information provided by thirty companies, employing in total approximately 22 thousand full time employees.
The employees hold various certifications issued by both national and international bodies. Most certifications held are related to languages, project management, business analysis and financial expertize. The analysis was conducted on thirty six companies that provided information on this subject.
Fig. 36 Level of education
Fig. 37 Certifications held by employees
10%High-schooldegree
60%Bachelor’sdegree
30%Master’s / PhDdegree
26ProjectManagement
29Languagecertifications
24BusinessAnalysis
23Financial
20Computer &Internet Tech
3Supply Chain

OUTSOURCING INDUSTRY REPORT 2017 49WHAT ARE THE MAIN CHARACTERISTICS OF THE WORKFORCE?
Training coursesprovided to employees
Fig. 38 Training courses provided to employees
Training courses provided to employees by the respondents are varied and cover both the technical and the soft skills needed by the employees during service delivery.
Besides the induction training, which is provided by all the participants in the survey, great emphasis is placed on various soft skills training courses, which are offered by thirty nine companies. Time management, manager coaching and language courses are also provided by approximately three quarters of the participants.
Other training courses mentioned by the respondents aim to develop employees’ skills in connection with several IT applications used during service delivery (e.g. SAP, Navision, WizSalary).
Project management courses (PMP, Agile, Scrum etc.) are provided to employees by 50% of the participants, while business analysis (6 Sigma, CBAP etc.) by 45% of the companies. Financial related training courses (such as CIMA, CIA, ACCA, CFA etc.) are provided by 40% of the companies, while IT related ones (such as CISA, ITIL etc.) by 38%. Most of the companies provide their employees with more than one type of training course, while six do not provide any type of technical training to their employees.
40Induction Introduction
39Soft skills
33Professionalqualifications
31Time management
31Manager coaching
30Language competencies
3Other
Num
ber o
f com
pani
es →

OUTSOURCING INDUSTRY REPORT 2017 50WHAT ARE THE MAIN CHARACTERISTICS OF THE WORKFORCE?
Top skills required
Participants in the survey were asked to define the top five skills needed in their company (with the Top 1 being the most important), for which they have difficulties in finding the proper match. Finding the resources with the appropriate language proficiency, technical competence and ideally an appropriate mix between them is sometimes challenging for the service providers.
Language proficiency is the most needed skill, especially German language, C1 level. Other languages mentioned by the participants in the survey are French, Nordic languages, Italian, Polish and Hungarian. Language proficiency skills represent 61% of Top 1 responses, 42% of Top 2, 43% of Top 3 and another 24% of Top 4, while 11% have identified this as a Top 5 need.
IT related skills are second in terms of ranking, covering 21% of the Top 1 responses, 35% of Top 2, 35% of Top 3, 35% of Top 4 and 33% of Top 5. Amongst the IT skills needed, the most mentioned are Java, .Net and Cobol.
The percentages are calculated as the ratio of a certain category of answer within the total number of answers received per each Top layer.
In addition to the above mentioned needs, other skills required by the participants in the survey are related to: financial and business analysis, engineering, sales, payroll, fiscal legislation, project management skills etc.
Approximately 74% of respondents consider that in the past three years, the degree of correlation between the educational system and the business services industry’s needs has not changed or has even decreased.
Fig. 39 Education system versus business needs
23%increased level 33%decreased
level
41%no change 3%no opinion

OUTSOURCING INDUSTRY REPORT 2017 51WHAT ARE THE MAIN CHARACTERISTICS OF THE WORKFORCE?
Cooperation with universities
90% of the participants in the survey (i.e. thirty six companies) have at least one form of cooperation with universities in the city where they employ the majority of their staff. Out of these companies, 75% (i.e. twenty seven) have reported multiple forms of cooperation, the most encountered being recruitment of future employees, joint conferences and joint training courses.
In addition, other forms of cooperation detailed by the respondents were listed as sponsoring university events and granting scholarships and internships to students.
Fig. 40 Cooperation with universities
0% 5% 10% 15% 20% 25% 30% 35%
Recruiting future employees
34
Joint conferences
19
Joint training courses
17
Joint educational projects
15
Joint studies
6
Other
6
No cooperation
4
Joint research projects
2
← N
umbe
r of c
ompa
nies
Note: the total number of answers exceeds the number of respondents, as some of the companies’ reported several forms of cooperation

How is the business environment rated?06
“When speaking about Business Services, there is no more a secret that Romania is among the best CEE country to invest. Due to this fact, the market in Romania is becoming more and more aggressive and the competition very strong. In this context all the players in the industry, and the ones supporting the industry, are trying to keep up the pace and support the development from real estate side to infrastructure and staff availability. However, the local authorities still have a big gap to recover in supporting the boost of the business services industry or at least not to slow it with tremendous and frequent legislative changes.”
Cristian-Dumitru CilibiuVice-President, Knowledge Sharing, ABSL Romania

OUTSOURCING INDUSTRY REPORT 2017 53HOW IS THE BUSINESS ENVIRONMENT RATED?
Location assessment
The participants in the survey were asked to rate the location where they employ the majority of their staff considering several criteria. The ratings to be used ranged between 1 (very poor) and 10 (very good).
The overall assessment is mostly positive, with the highest ratings granted for the availability of modern office space and city accessibility. On the opposite side, the lowest rated criteria is cooperation with local authorities.However, because thirty five companies operate from Bucharest, out of which thirty four have the majority of their headcount in Bucharest, the location assessment results are mainly oriented towards Bucharest.
We have observed that for Cluj-Napoca and Iasi, the cooperation with local authorities was rated above the average by most of the respondents that employ the majority of or their entire staff in these cities. On the opposite side, the availability of modern office space and of talent pool are rated below the averages by the same companies.
Table 2 Assessment of the main location
10987654321Criteria
Availability of modern space
City accessibility (airport, trains)
Image of the city (in the opinion of investors)
Availability of talent pool / highly qualified staff
The quality of public transport in the city
Cooperation with local authorities
9.1
8.5
8.1
7.6
7
5.9
Very poor Very good

OUTSOURCING INDUSTRY REPORT 2017 54HOW IS THE BUSINESS ENVIRONMENT RATED?
Competition assessment
The participants in the survey were also asked to assess the competition in the location where they employ the majority of their staff (in terms of competitors, recruitment etc.). The ratings to be used ranged between 1 (very weak) and 10 (very strong).
Out of the total of thirty nine companies rating the competition, eighteen perceive it as strong (i.e. approximately 46% of respondents), while twenty one perceive it as very strong (i.e. approximately 54%).
The average rating of competition as it is perceived by the respondents is 8.6.
As with the location assessment, the results of the competition assessment are heavily focused on Bucharest.
A quick look at the ratings granted by the companies who employ the majority of their staff in Cluj-Napoca revealed that the competition is perceived as strong by two thirds of the respondents, while the remaining one third perceive it as very strong. On the other hand, all the companies from Iasi rated the competition as very strong.
Each year, the number of service providers on the Romanian market increases. Furthermore, most of the existing companies have plans for expansion in the future, as we have seen previously in the report. Therefore, and considering the current perception of the competition, companies are and will be pushed to deliver services in the most efficient way possible, if they aim to remain successful.
Fig. 41 Competition assessment
54%Very strongcompetition
46%Strongcompetition

OUTSOURCING INDUSTRY REPORT 2017 55HOW IS THE BUSINESS ENVIRONMENT RATED?
Public supportand the impact of public policy changes
Public policy changes have an impact on the Romanian outsourcing industry and the way business is conducted. Opinions about changes and their impact vary amongst the participants in the survey, with 78% of them considering that there are too many changes, which are difficult to cope with, while the remaining 22% rated the changes as manageable. The percentages were calculated based on responses received from thirty seven companies.
Fig. 42 Means of public support accessed
0 5 10 15 20 25
Did not use the public support
Government grants
Local tax exemptions
Other public grants
EU employment grants
Tax exemptions within the Special Economic Zone
EU training grants
21
5
5
3
2
1
1
Out of the total of forty participants in the survey, only thirty four provided information about the pubic support obtained, if any was obtained.
62% of the respondents (i.e. twenty one companies) did not benefit from any form of public support.
Ten companies benefited from one form of public support, the most encountered being government grants and local tax exemptions.
Two companies benefited from two different means of public support, while another company benefited of three forms of public support.
The most accessed forms of public support are government grants and local tax exemptions, which were each mentioned by five companies participating in the survey.
Other public grants mentioned were tax exemptions for programmers and access to POSDRU funds.
Note: the total number of answers exceeds the numberof respondents, as some of the companies’ used morethan one form of public support
← N
umbe
r of c
ompa
nies

OUTSOURCING INDUSTRY REPORT 2017 56HOW IS THE BUSINESS ENVIRONMENT RATED?
Investing in Romania
During the last few years, the outsourcing market has recorded significant growth and the expected trend for the next few years is similar.
92.5% of the companies participating in the survey (i.e. thirty seven companies) would recommend Romania to potential investors as a good place for investing and conducting operations. They base their statement on the market capabilities, good talent pool in terms of language proficiency and technical skills, good labor arbitrage, lower costs compared to Western Europe and appropriate working mindset and attitude of employees.
On the opposite side, 7.5% of the respondents (i.e. three companies) consider that Romania is not a good place for investment and would not recommend it to potential investors. Their position is based on the frequent fiscal and legislative changes, challenges faced during recruitment of appropriate employees and continuously political changes.
Considerations taken when assessing whether Romania is or is not a good place for investing were detailed by some of the respondents. In the next page we quoted, without any alteration, a selection of their statements.
Fig. 43 View of Romania as a place for investment
92.5%YES
7.5%NO

OUTSOURCING INDUSTRY REPORT 2017 57HOW IS THE BUSINESS ENVIRONMENT RATED?
Investing in Romania
• “Despite the competition on the market in the BPO/SSC field, Romania is still a powerful market and can supply new business. Potential for development is there, in terms of market capabilities, applying technology to existing processes and onboarding new products.”
• “The country has very good potential for investments: very good IT infrastructure, skilled labor force, good geographical location”
• “Continuously changing environment due to political influence”
• “Tax increase / instability of government, high demand that creates salary increase
that could lead to non competitive advantages for Romania”
• “It is difficult to find people”
• “Huge Talent pool with financial, technical and language expertise, educational institutions willing to tie up with corporates for internships, proximity to the EU base and well placed geographically and demographically.”
• “Romania ranks on 20th place in the top of the best Developers countries. Good competencies, coordinated with the salary expectations.”
• “Still good labor arbitrage, but the big cities are becoming a bit “crowded”; more and more relocations are happening.”
• “Good talent pool(availability anyway decreasing)”
• “Despite some fiscal and legislative uncertainty taking place from time to time, we consider Romania a great place for investing for various reasons. Its labor force is still cheap compared to other European countries, the macroeconomics trends look stable for the coming years and its young professionals are often multilingual skilled.”
WHY YES?
WHY NO?

Conclusions07

OUTSOURCING INDUSTRY REPORT 2017 59CONCLUSIONS
ConclusionsWhat are the Top Trends/Challenges and Top Capabilities required to successfully undertake initiatives in 2018?
The answer can be summed up in two words: People and Technology.
Top trends and challenges
• Talent shortage and the challenge of finding an ideal combination between language proficiency, project management and technology related skills.• Maturation of/greater access to innovative technologies.• Growing market.• Investment in people and technology.
Top Capabilities
• Smart and innovative management.• Change management.• Business intelligence/harnessing Big Data.• Process automation: basic and enhanced automation.
Just as mechanical robotics have automated blue collar jobs in manufacturing, process automation and cognitive intelligence are affecting white collar jobs, such as clerical back office functions and customer support at call centers. By all estimates, the digitalization of labor will be a game changer in global markets in the coming decades.
One of the good things about innovative technology is that adoption does not have to be a linear progression. Companies might leapfrog the competition by, for example, moving to cognitive intelligence solutions without going through the initial step of process automation. However the possible downside is that when processes and people cannot keep pace with change, this causes a level of disruption that might cancel out any productivity or efficiency gains. The largest obstacles to adoption remain a lack of strategic vision to address digital disruption, the limits and needs of legacy IT systems, and cultural resistance to change.
We should not forget that our main asset is our people, who need to be taken care of as we should remember that our staff will:
• Forget what we said.• Forget what we did.• But they will never forget how we made them feel!

60OUTSOURCING INDUSTRY REPORT 2017
Contact
Richard PerrinPartner, Head of Advisory
Tel: + 40 744 557 [email protected]
Andrada IliescuSenior Manager, Advisory Services
Tel: + 40 747 333 [email protected]
The contacts at KPMG in connection with this report are:
Cosmin PătlăgeanuPresident, ABSL in Romania
Tel: +40 722 166 [email protected]
Association of BusinessService Leaders in Romania
The contacts at ABSL in connection with this report are:

www.absl.ro