Embed Size (px)
Citation preview

Royal Dutch Shell
Outlook 2020

Royal Dutch Shell
Cautionary note
2
The companies in which Royal Dutch Shell plc directly and indirectly owns investments are separate legal entities. In this
presentation “Shell”, “Shell Group” and “Royal Dutch Shell” are sometimes used for convenience where references are made
to Royal Dutch Shell plc and its subsidiaries in general. Likewise, the words “we”, “us” and “our” are also used to refer to
Royal Dutch Shell plc and its subsidiaries in general or to those who work for them. These terms are also used where no useful
purpose is served by identifying the particular entity or entities. ‘‘Subsidiaries’’, “Shell subsidiaries” and “Shell companies” as
used in this presentation refer to entities over which Royal Dutch Shell plc either directly or indirectly has control. Entit ies and
unincorporated arrangements over which Shell has joint control are generally referred to as “joint ventures” and “joint
operations”, respectively. Entities over which Shell has significant influence but neither control nor joint control are referred to
as “associates”. The term “Shell interest” is used for convenience to indicate the direct and/or indirect ownership interest held
by Shell in an entity or unincorporated joint arrangement, after exclusion of all third-party interest.
This presentation contains forward-looking statements (within the meaning of the U.S. Private Securities Litigation Reform Act of
1995) concerning the financial condition, results of operations and businesses of Royal Dutch Shell. All statements other than
statements of historical fact are, or may be deemed to be, forward-looking statements. Forward-looking statements are
statements of future expectations that are based on management’s current expectations and assumptions and involve known
and unknown risks and uncertainties that could cause actual results, performance or events to differ materially from those
expressed or implied in these statements. Forward-looking statements include, among other things, statements concerning the
potential exposure of Royal Dutch Shell to market risks and statements expressing management’s expectations, beliefs,
estimates, forecasts, projections and assumptions. These forward-looking statements are identified by their use of terms and
phrases such as “aim”, “ambition”, ‘‘anticipate’’, ‘‘believe’’, ‘‘could’’, ‘‘estimate’’, ‘‘expect’’, ‘‘goals’’, ‘‘intend’’, ‘‘may’’,
‘‘objectives’’, ‘‘outlook’’, ‘‘plan’’, ‘‘probably’’, ‘‘project’’, ‘‘risks’’, “schedule”, ‘‘seek’’, ‘‘should’’, ‘‘target’’, ‘‘will’’ and similar
terms and phrases. There are a number of factors that could affect the future operations of Royal Dutch Shell and could cause
those results to differ materially from those expressed in the forward-looking statements included in this presentation, including
(without limitation): (a) price fluctuations in crude oil and natural gas; (b) changes in demand for Shell’s products; (c) currency
fluctuations; (d) drilling and production results; (e) reserves estimates; (f) loss of market share and industry competition; (g)
environmental and physical risks; (h) risks associated with the identification of suitable potential acquisition properties and
targets, and successful negotiation and completion of such transactions; (i) the risk of doing business in developing countries
and countries subject to international sanctions; (j) legislative, fiscal and regulatory developments including regulatory
measures addressing climate change; (k) economic and financial market conditions in various countries and regions; (l)
political risks, including the risks of expropriation and renegotiation of the terms of contracts with governmental entities, delays
or advancements in the approval of projects and delays in the reimbursement for shared costs; and (m) changes in trading
conditions. No assurance is provided that future dividend payments will match or exceed previous dividend payments. All
forward-looking statements contained in this presentation are expressly qualified in their entirety by the cautionary statements
contained or referred to in this section. Readers should not place undue reliance on forward-looking statements. Additional risk
factors that may affect future results are contained in Royal Dutch Shell’s Form 20-F for the year ended December 31, 2018
(available at www.shell.com/investor and www.sec.gov). These risk factors also expressly qualify all forward-looking
statements contained in this presentation and should be considered by the reader. Each forward-looking statement speaks
only as of the date of this presentation, February 20, 2020. Neither Royal Dutch Shell plc nor any of its subsidiaries undertake
any obligation to publicly update or revise any forward-looking statement as a result of new information, future events or other
information. In light of these risks, results could differ materially from those stated, implied or inferred from the forward-looking
statements contained in this presentation.
We may have used certain terms, such as resources, in this presentation that the United States Securities and Exchange
Commission (SEC) strictly prohibits us from including in our filings with the SEC. U.S. investors are urged to consider closely
the disclosure in our Form 20-F, File No 1-32575, available on the SEC website www.sec.gov.

Royal Dutch Shell February 2020 3
2019 was also a year of record final investment decisions (FIDs), with 71 million tonnes of new capacity being sanctioned, indicating belief in long-term LNG demand. Increasing uncontracted and flexible supply is set to offer more options for customers in the future.
The last decade has seen rapid growth in energy demand and corresponding greenhouse gas emissions which have created the need for more and cleaner energy options. A combination of new policy, favourable economics and partnership with renewables is driving the momentum for coal-to-gas switching.
2019 saw record LNG supply growth as the recent wave of new LNG liquefaction projects nears completion. Most of this growth was absorbed by Europe. Year-on-year growth in Asian imports slowed from highs of 2017 and 2018, but Asia still remains a growth region. Increased liquidity, new spot trading mechanisms and a wider variety of indices being used for long-term contracts point towards LNG becoming an increasingly flexible commodity.
Gas continues to provide more and cleaner energy solutions
2019 was a year of record LNG supply growth
Record supply investment due to confidence in long-term LNG demand growth
01 02 03 LNG-powered cruise shipNigeria LNGSeoul
Overview

Royal Dutch Shell February 2020 4
Gas continues to provide more and cleaner energy solutions
01Queensland Curtis Island

Royal Dutch Shell
0510152025303540
02468
1012141618
CO
2 em
issio
ns (B
T)
Ener
gy c
onsu
mpt
ion
(mkt
oe)
Rest of world energy Asia energy
Global emissions (MtCO2)(RHS)
CO
2
25%
35%
45%
55%
65%
75%
85%
Urb
anisa
tion
leve
l
OECD East Asia & PacificSouth Asia
0100200300400500600700
Air
qual
ity (P
M 2
.5)
Average WHO safe level (10)
2019 range
6.5
6.7
6.9
7.1
7.3
7.5
7.7
0102030405060708090
Glo
bal p
opul
atio
n (b
ln)
Ann
ual p
opul
atio
n in
crea
se (m
ln)
Rest of world population Asia population
Global population (RHS)
Growing population and rising living standards drive demand for energy with lower emissions
February 2020 5
Source: Shell’s interpretation of Wood Mackenzie H1, World Bank, The World Air Quality Index 2019 data
Unsafe air quality
Increased urbanisation
Growing population
Rising energy demand & emissions
Royal Dutch Shell
0% 10% 20% 30% 40% 50% 60%
Global
North America
Europe
China
India
Share in the energy mix
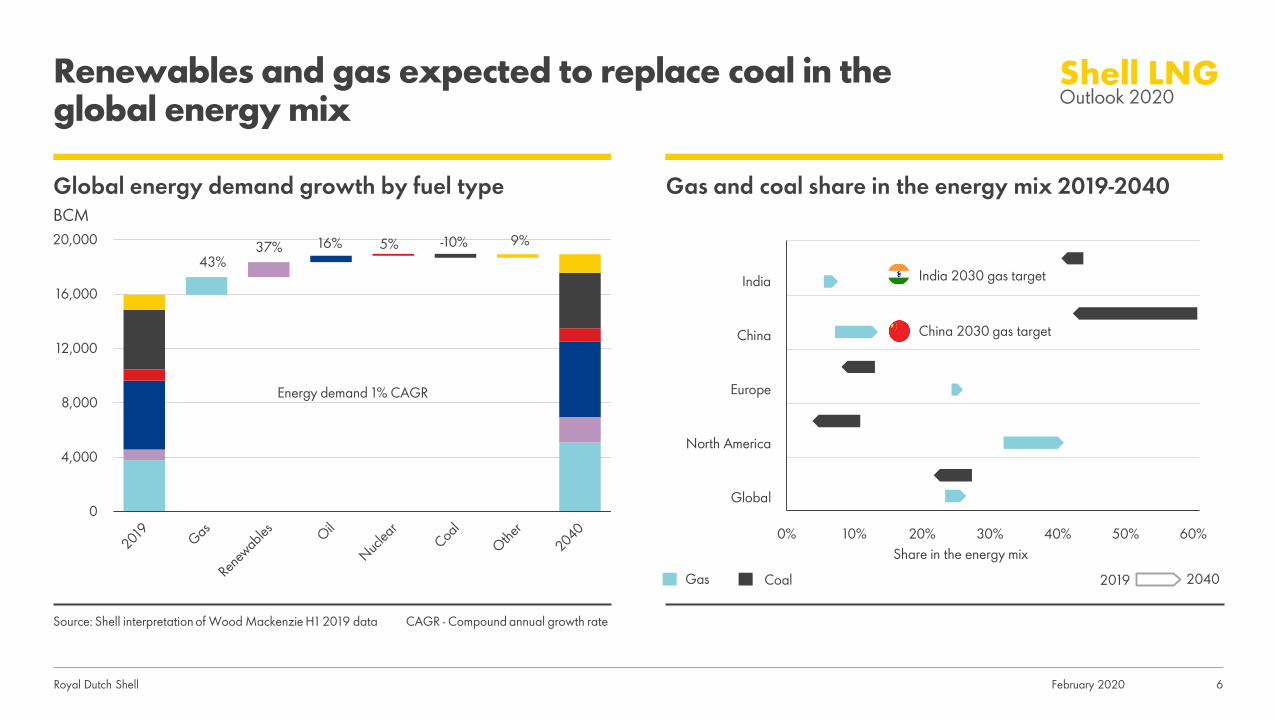
Renewables and gas expected to replace coal in the global energy mix
6
Source: Shell interpretation of Wood Mackenzie H1 2019 data CAGR - Compound annual growth rate
0
4,000
8,000
12,000
16,000
20,000
Energy demand 1% CAGR
43% 37% 16% 5% -10% 9%
Global energy demand growth by fuel typeBCM
Gas and coal share in the energy mix 2019-2040
February 2020
Gas Coal 2019 2040
India 2030 gas target
China 2030 gas target

Royal Dutch Shell
Coal-to-gas switching helping level global CO2 emissions
February 2020 7
-5
-4
-3
-2
-1
0
1
2
3
4
5
2010 2011 2012 2013 2014 2015 2016 2017 2018 2019
*Advanced economies Rest of world Global
Source: Shell interpretation of Wood Mackenzie, IEA World Energy Outlook, IEA Carbon Report 2019 data **Power sector coal-to-gas switching in Advanced economies only*Advanced economies include United States, European Union, Australia, Canada, Chile, Iceland, Israel, Japan, South Korea, Mexico, Norway, New Zealand, Switzerland & Turkey
CO2 change CO2 GT, 2010=0
Coal-to-gas switching CO2 savings CO2 MT, 2010=0
-700
-600
-500
-400
-300
-200
-100
0
2010 2011 2012 2013 2014 2015 2016 2017 2018 2019
United States China Europe
India Rest of world Global**
Equivalent to over 50% of
CO2 emissions from South America for a full year
-57%
CO2EMISSIONS

Royal Dutch Shell
Record coal phase-out and generation reduction in 2019Opportunity for more displacement of coal in the power sector
April 2019 8
Source: Shell interpretation of national government policy announcements, Carbon Brief, Global Energy Monitor, GlobalData plc and Wood Mackenzie 2019 data
Net change in global coal generationTWh
Global coal phase-out capacity announcements by dateGW
Power capacity by fuelGW
-400
-200
0
200
400
600
2001 2004 2007 2010 2013 2016 2019
0
20
40
60
80
2015 2016 2017 2018 2019
2020s 2030s 2040s
-
300
600
900
1,200
India China Europe NorthAmerica
Rest ofworld
Coal Gas Coal 2040 Gas 2040
Royal Dutch Shell
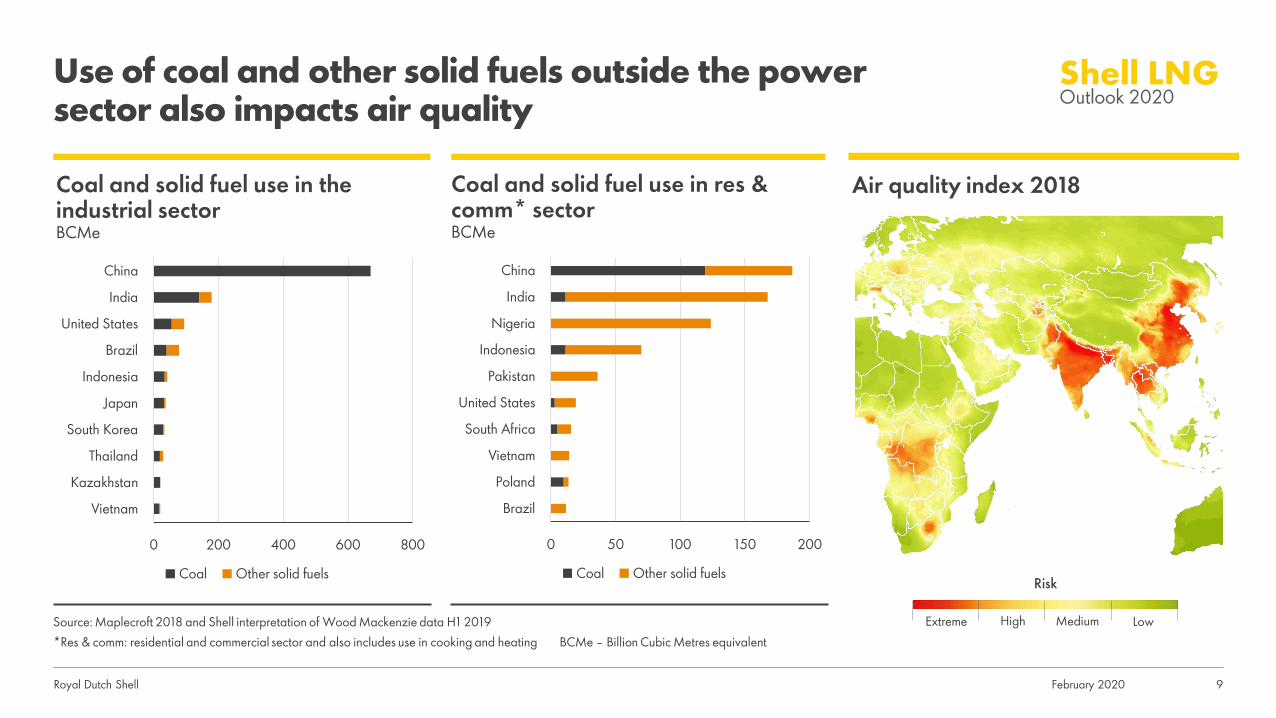
Use of coal and other solid fuels outside the power sector also impacts air quality
February 2020 9
0 200 400 600 800
Vietnam
Kazakhstan
Thailand
South Korea
Japan
Indonesia
Brazil
United States
India
China
Coal Other solid fuels
0 50 100 150 200
Brazil
Poland
Vietnam
South Africa
United States
Pakistan
Indonesia
Nigeria
India
China
Coal Other solid fuels
Source: Maplecroft 2018 and Shell interpretation of Wood Mackenzie data H1 2019*Res & comm: residential and commercial sector and also includes use in cooking and heating BCMe – Billion Cubic Metres equivalent
Coal and solid fuel use in res & comm* sectorBCMe
Coal and solid fuel use in the industrial sectorBCMe
Air quality index 2018
Extreme High Medium Low
Risk

Royal Dutch Shell
Coal-to-gas switching in the industrial sector can improve air quality
February 2020 10
Source: Shell’s interpretation of International Gas Union, Financial Times, Central Pollution Control Board (India) data 2018 and 2019 PM: particulate matter SO2: sulfur dioxide
Air quality levels in Morbi, Gujarat
μg/m3
Gas demand post-ban on coal units in Morbi industrial sector in 2019Mcm/d
Air quality in India
0
100
200
300
400
500
600
PM2.5 PM10 SO2
2017 2019
0
1
2
3
4
5
6
7
Morbi
Top 20 most polluted industrial clusters in 2018
0x 1x 2x 3x 4x 5x 6x 7x 8x 9x 10x 11x
Number of times above the WHO’s safe limit

Royal Dutch Shell
Growth of renewables favours gas in the power mix
February 2020 11
Source: Shell interpretation of Wood Mackenzie H1, national data and OpenNEM 2019 data
Average thermal load factorsThermal load factors
South Australia electricity supply December 2019MW
-1000
-500
0
500
1000
1500
2000
2500
3000
3500
4000
Batteries Renewables Gas Net interconnector
20%
30%
40%
50%
60%
70%
80%
90%
2000
2001
2002
2003
2004
2005
2006
2007
2008
2009
2010
2011
2012
2013
2014
2015
2016
2017
2018
2019
California UK Spain India
1%
11%
<1%
7%2%
28%
10%
<1%
Share of wind and solar in generation mix
Royal Dutch Shell
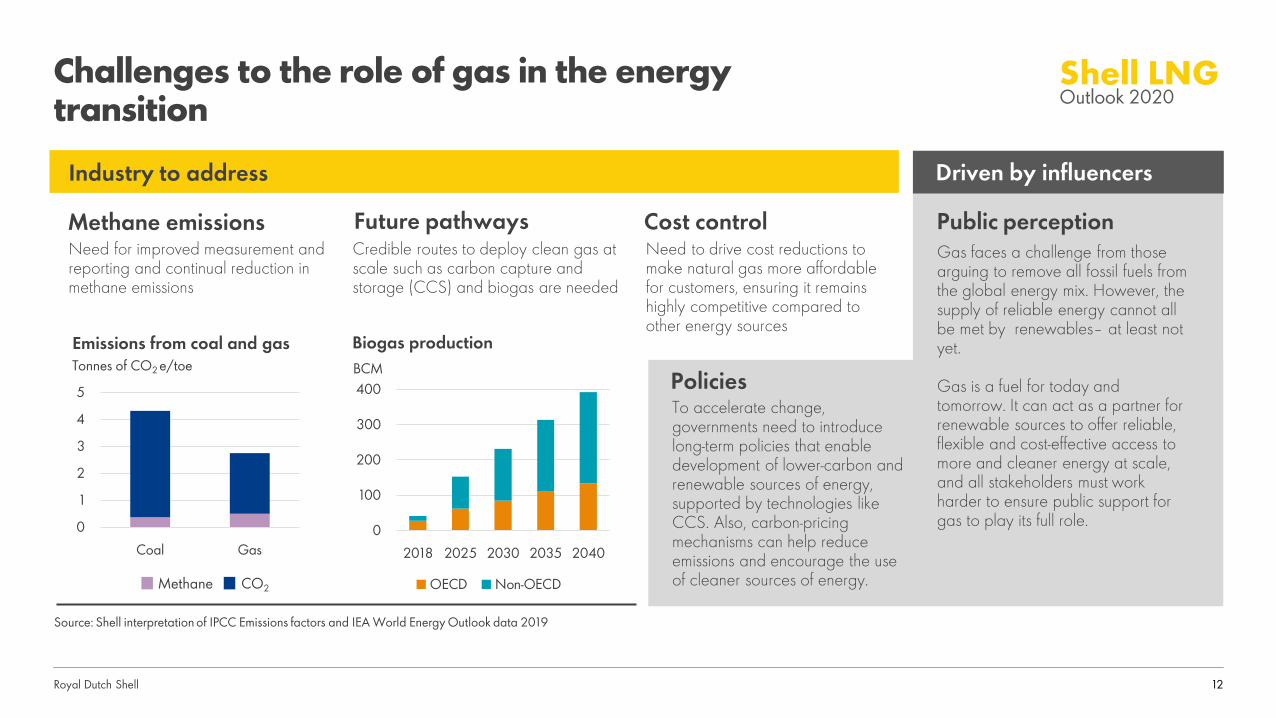
Challenges to the role of gas in the energy transition
February 2020
Need for improved measurement and reporting and continual reduction in methane emissions
Methane emissionsNeed to drive cost reductions to make natural gas more affordable for customers, ensuring it remains highly competitive compared to other energy sources
Cost controlCredible routes to deploy clean gas at scale such as carbon capture and storage (CCS) and biogas are needed
Future pathways
0
100
200
300
400
2018 2025 2030 2035 2040
Biogas production
OECD Non-OECD
Tonnes of CO2 e/toe
0
1
2
3
4
5
Coal Gas
Emissions from coal and gas
Source: Shell interpretation of IPCC Emissions factors and IEA World Energy Outlook data 2019
BCMPoliciesTo accelerate change, governments need to introduce long-term policies that enable development of lower-carbon and renewable sources of energy, supported by technologies like CCS. Also, carbon-pricing mechanisms can help reduce emissions and encourage the use of cleaner sources of energy.
Industry to address
12
CO2Methane
Public perceptionGas faces a challenge from those arguing to remove all fossil fuels from the global energy mix. However, the supply of reliable energy cannot all be met by renewables– at least not yet.
Gas is a fuel for today and tomorrow. It can act as a partner for renewable sources to offer reliable, flexible and cost-effective access to more and cleaner energy at scale, and all stakeholders must work harder to ensure public support for gas to play its full role.
Driven by influencers

Royal Dutch Shell
Gas to play a key role in reducing emissions from hard-to-electrify sectors
February 2020 13
Source: Shell interpretation of Wood Mackenzie H1 2019 data
Global gas demand growth by sectorBCM
Share of gas demand growth by sector 2019-2040Gas demand sectors
0
1,000
2,000
3,000
4,000
5,000
2019 Power Industry Res & comm Transport 2040
Gas demand 2% CAGR
40% 28%
23% 9%
-20% 0% 20% 40% 60% 80% 100% 120%
Transport
Res & comm
Industry
Power
Asia Europe FSU Americas Mid-East & Africa LNG bunker

Royal Dutch Shell
0
1,000
2,000
3,000
4,000
5,000
2019 Domesticproduction
Pipelineimports
LNGimports
2040
45% 15%
Gas demand 2% CAGR
40%
Asia set to be the key growth region for LNG
February 2020 14
Source: Shell interpretation of Wood Mackenzie H1 2019 data
Global gas supply by sourceBCM
LNG imports by regionBCM
LNG imports into AsiaBCM
0
200
400
600
800
1,000
2019 Asia Europe Americas Mid-East & Africa
2040
LNG demand 4% CAGR
74% 9% 8%
0
150
300
450
600
750
2019 China JKT SouthAsia
Rest ofAsia
2040
Asia LNG demand 4% CAGR
23% 1%
28%
48% 9%

Royal Dutch Shell February 2020 15
2019 was a year of record LNG supply growth
02 Gibraltar – small-scale LNG import terminal
Royal Dutch Shell
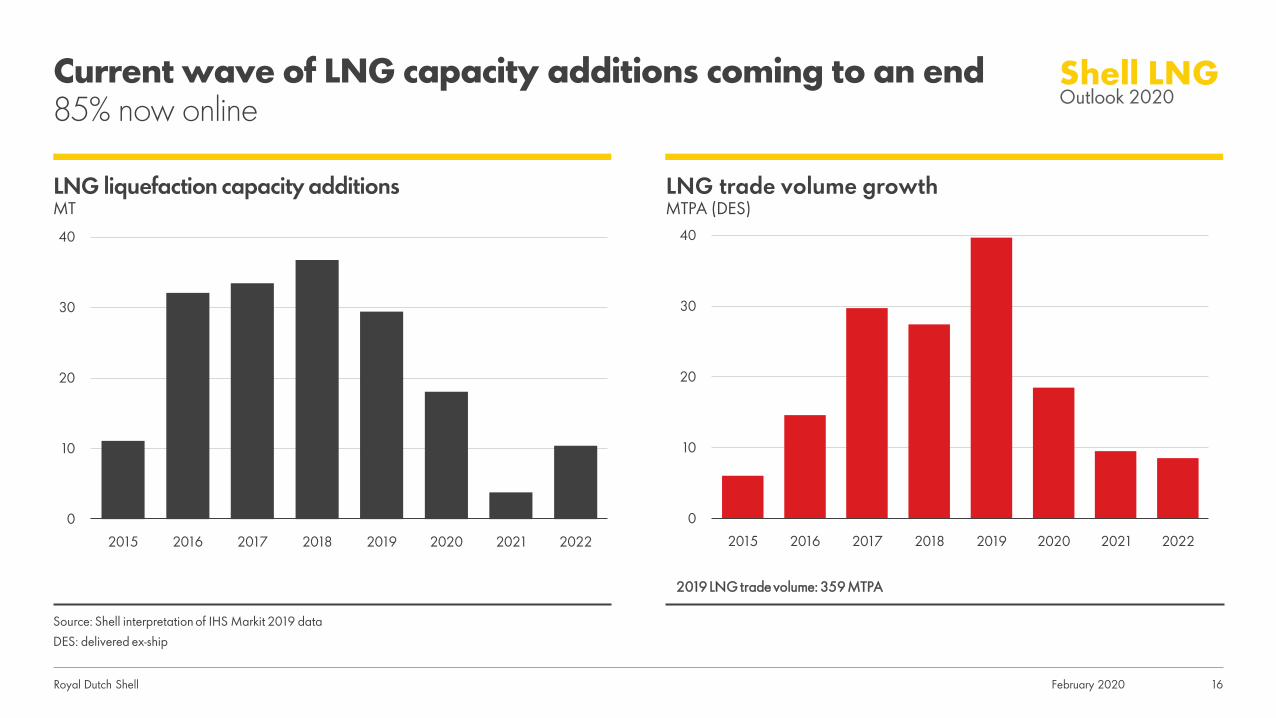
LNG trade volume growthMTPA (DES)
Current wave of LNG capacity additions coming to an end85% now online
February 2020 16
Source: Shell interpretation of IHS Markit 2019 dataDES: delivered ex-ship
LNG liquefaction capacity additionsMT
0
10
20
30
40
2015 2016 2017 2018 2019 2020 2021 2022
0
10
20
30
40
2015 2016 2017 2018 2019 2020 2021 2022
2019 LNG trade volume: 359 MTPA

Royal Dutch Shell
Record LNG supply growth absorbed mainly in Europe
February 2020 17
Source: Shell interpretation of IHS Markit, Wood Mackenzie, Poten & Partners Q4 2018 and 2019 data
LNG supply growth range by countryMTPA
LNG demand growth range by regionMTPA
Previous forecast range 2019
-10
0
10
20
30
40
Australia USA Russia Rest of world
-10
0
10
20
30
40
Asia Europe Americas Middle East & Africa
Actuals 2019

Royal Dutch Shell
LNG imports rise by 40 million tonnes in 2019China continues to be among top three global LNG growth markets
February 2020 18
Net imports: 2019 YoYMTPA (DES)
Source: Shell interpretation of IHS Markit, Wood Mackenzie and Poten & Partners 2018 and 2019 dataNote: Sweden, Canada, Colombia, Norway, Finland, Malta, Israel, Jamaica, Puerto Rico, Kuwait, Brazil, Panama, Poland and Dominican Republic are not included in the above chart as change is minimal
-8
-6
-4
-2
0
2
4
6
8
10
Previous forecast (consensus) Actuals

Royal Dutch Shell
0
25
50
75
100
2010 2011 2012 2013 2014 2015 2016 2017 2018 2019
Pipeline import LNG import
0
100
200
300
400
2010 2011 2012 2013 2014 2015 2016 2017 2018 2019
Gas demand Domestic production
LNG imports continue to meet China’s growing need for cleaner energy
February 2020 19
Source: Shell interpretation of NDRC 2019 data
China gas demand vs domestic productionBCMA
China LNG and pipeline gas importsBCMA
12%
7% 16%
34%
18%

Royal Dutch Shell
European LNG imports increased by 74% in 2019 with declining domestic production and pipeline imports …
February 2020 20
Domestic gas productionBCMA
Algerian and Russian pipeline salesBCMA
0
50
100
150
200
250
2015 2016 2017 2018 2019
UK NL Norway
0
50
100
150
200
250
2015 2016 2017 2018 2019
Algeria Russia
Source: Shell interpretation of Wood Mackenzie, S&P Global Platts and Gazprom Export LLC 2019 dataRussian sales volumes adjusted to reflect standard calorific value (40MJ/m3 at 15°C)
Gas balanceBCMA
400
450
500
550

Royal Dutch Shell
… and increased coal-to-gas switching in the power sector and storage due to mild winter
February 2020 21
Source: Shell interpretation of IHS Markit, Wood Mackenzie and Gas Infrastructure Europe (Aggregated Gas Storage Inventory) 2019 data
Coal-to-gas switching range$/MMBtu €/tonne CO2
Coal generation vs gas generationTWh
0
5
10
15
20
25
30
35
0
3
6
9
12
Jan-
16
Jul-1
6
Jan-
17
Jul-1
7
Jan-
18
Jul-1
8
Jan-
19
Jul-1
9
Range of coal-to-gas switching TTF gas
ARA coal European carbon price (RHS)
0
25
50
75
100
Jan-
15
Jun-
15
Nov
-15
Apr
-16
Sep-
16
Feb-
17
Jul-1
7
Dec
-17
May
-18
Oct
-18
Mar
-19
Aug
-19
Gas generation Coal generation
Year-end gas inventoryBCM
0
25
50
75
100
2015
2016
2017
2018
2019
NW Europe Southern Europe
CEE Storage capacity

Royal Dutch Shell
Growing industrial gas demand and declining domestic gas spurs LNG demand in South and South-east Asia
February 2020 22
230
240
250
260
270
2018 Domesticproduction
LNG 2019
-9%
109%
0%
25%
50%
75%
100%
0
10
20
30
40
LNG Imports Growth %
230
240
250
260
270
2018 Power Industry Res &comm
Transport 2019
22%
66% 8% 5%
Source: Shell interpretation of Wood Mackenzie and IHS Markit 2019 data
Gas demand growth by sectorBCMA
Gas supply growth by sectorBCMA
2019 LNG imports by countryBCMA Growth
>

Royal Dutch Shell
0
25
50
75
100
Japan South Korea
2018 2019
Higher nuclear availability and mild winters reduced imports into Japan and South Korea
February 2020 23
Source: Shell interpretation of IHS Markit, Japan Ministry of Economy, Trade and Industry, Korea Energy Economics Institute 2019 dataPower generation mix includes January through October data. *Winter months are from October through March.2020 includes YTD data
Power generation mix LNG importsMTPA
5%
7%
23%
26%
30%
29%
42%
41%
39%
38%
27%
25%
17%
18%
6%
7%
0% 20% 40% 60% 80% 100%
2018
2019
2018
2019
Japa
nSo
uth
Kore
a
Nuclear Coal Gas Oil Renewables Others
6
7
8
9
10
2015/2016
2016/2017
2017/2018
2018/2019
2019/2020
Winter* average temperatureDegree Celsius
Royal Dutch Shell
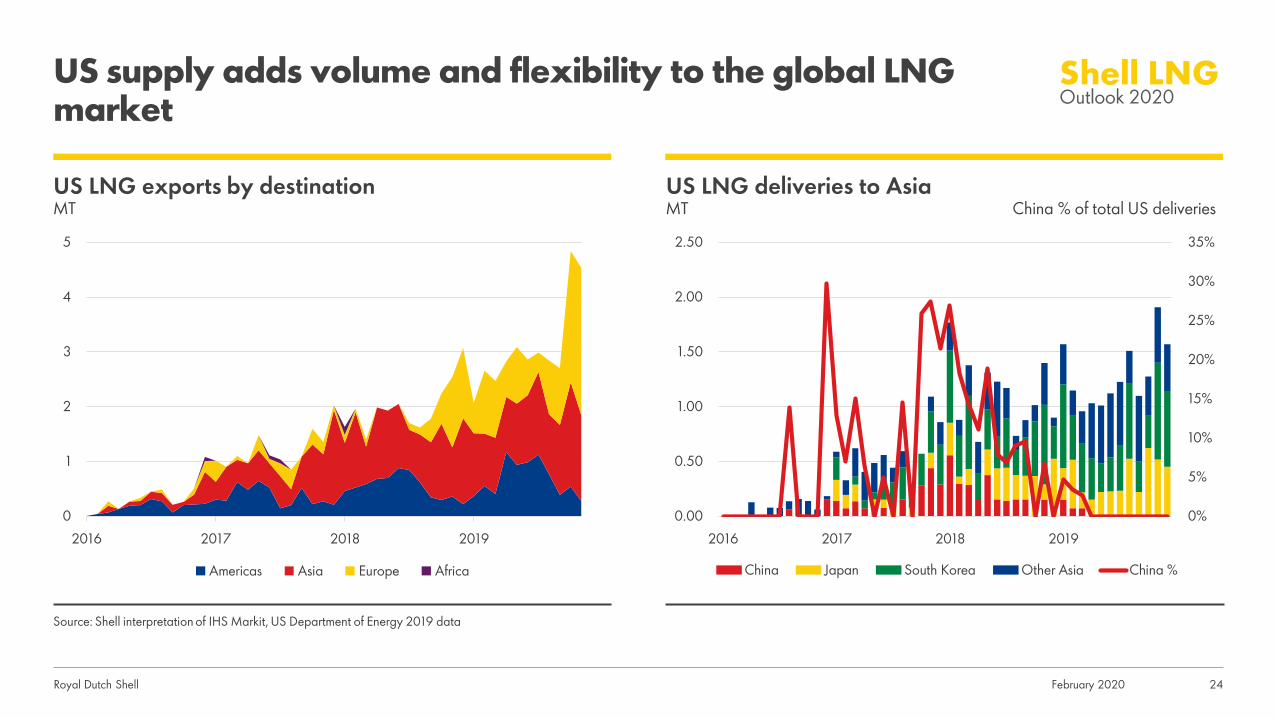
US supply adds volume and flexibility to the global LNG market
February 2020 24
Source: Shell interpretation of IHS Markit, US Department of Energy 2019 data
US LNG exports by destinationMT
US LNG deliveries to AsiaMT China % of total US deliveries
0
1
2
3
4
5
2016 2017 2018 2019
Americas Asia Europe Africa
0%
5%
10%
15%
20%
25%
30%
35%
0.00
0.50
1.00
1.50
2.00
2.50
2016 2017 2018 2019
China Japan South Korea Other Asia China %

Royal Dutch Shell
Global gas prices softened in 2019
February 2020 25
Source: Shell interpretation of ICE, CME, S&P Global Platts 2019 data
Global gas prices Asia spot price US LNG export margins*$/MMBtu
0
5
10
15
20
25
2010
2011
2012
2013
2014
2015
2016
2017
2018
2019
Dated Brent JKM TTF Henry Hub
$/MMBtu
0%
5%
10%
15%
20%
25%
Jan Feb Mar Apr May Jun Jul Aug Sep Oct Nov Dec
Range 2013-2018 2018 2019
JKM as % of Brent
-1
0
1
2
3
4
5
6
7
Jan Feb Mar Apr May Jun Jul Aug Sep Oct Nov Dec
TTF Netback JKM Netback
2018
2019
netbacknetback
*Excludes liquefaction fee; netback calculated as: JKM and TTF minus regasification and transportation cost minus 115% Henry Hub

Royal Dutch Shell
Increasingly liquid and transparent spot market
February 2020 26
Source: Shell interpretation of IHS Markit, S&P Global Platts and ICE 2019 data
Spot LNG deliveriesCargoes % of total market
JKM eWindow/Market on CloseCargoes
ICE JKM LNG futuresCargoes ‘000 Lots*
0%
10%
20%
30%
0
250
500
750
1000
1250
1500
2010
2011
2012
2013
2014
2015
2016
2017
2018
2019
JKT China South AsiaMiddle East Europe Americas% spot
0
100
200
300
400
500
600
0
300
600
900
1200
1500
1800
2011
2012
2013
2014
2015
2016
2017
2018
2019
0
50
100
150
200
250
300
2018 2019
Bid Offer Trade
*About 300 lots is equal to 1 cargo

Royal Dutch Shell
Evolving contracting structures
February 2020 27
Source: Shell interpretation of Wood Mackenzie and IHS Markit 2019 data
Average volume and length of new contractsYears MTPA
New LNG contract volumes (by seller type)MT
Share of new LNG contract volumes (by price indexation)Share of total volume
0
0.5
1
1.5
2
0
4
8
12
16
2010 2012 2014 2016 2018
Average length Average volume (RHS)
0
200
400
600
800
1000
2010 2012 2014 2016 2018
Portfolio Project
0%
20%
40%
60%
80%
100%
2010 2012 2014 2016 2018
Oil-linked EU Gas Hub HH Hybrid JKM JLC
Royal Dutch Shell
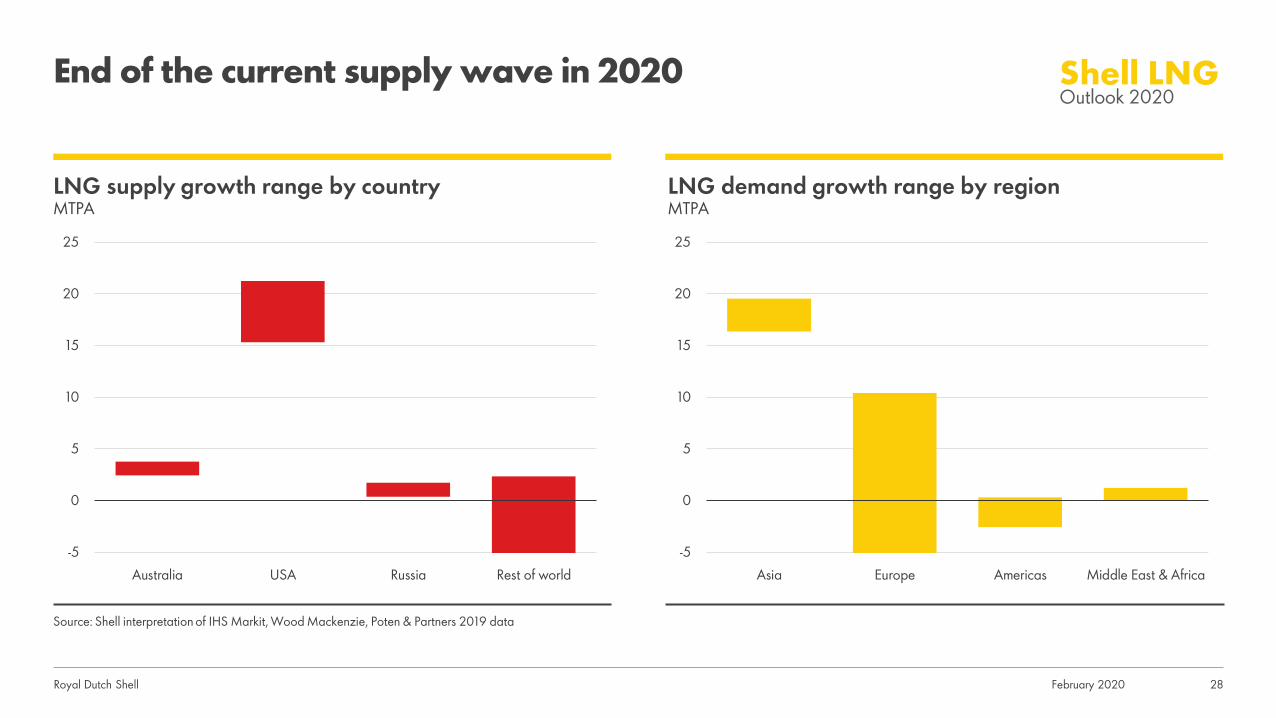
End of the current supply wave in 2020
February 2020 28
-5
0
5
10
15
20
25
Asia Europe Americas Middle East & Africa
Source: Shell interpretation of IHS Markit, Wood Mackenzie, Poten & Partners 2019 data
-5
0
5
10
15
20
25
Australia USA Russia Rest of world
LNG supply growth range by countryMTPA
LNG demand growth range by regionMTPA

Royal Dutch Shell
Global LNG market equilibrium expected to be restored
February 2020 29
LNG import growth by regionMT
Source: Shell interpretation of IHS Markit 2019 data
-5
0
5
10
15
Q1 Q2 Q3 Q4 Q1 Q2 Q3 Q4 Q1 Q2 Q3 Q4 Q1 Q2 Q3 Q4 Q1 Q2 Q3 Q4 Q1 Q2 Q3 Q4
2016 2017 2018 2019 2020 2021
Asia Europe Americas Middle East
Royal Dutch Shell February 2020 30
03Record supply investment due to confidence in long-term LNG demand growth
LNG London bunkers a containership in Rotterdam

Royal Dutch Shell
Expected supply shortage in mid-2020s resulted in record FIDs
February 2020 31
Source: Shell interpretation of IHS Markit 2019 data
Investment in liquefaction capacity by contract typeMT
LNG equity offtake by buyer typeMT
0
20
40
60
80
2010 2011 2012 2013 2014 2015 2016 2017 2018 2019
Project SPA Equity offtake
0
20
40
60
80
2010-2017 2018 2019
IOC NOC Other

Royal Dutch Shell
0
200
400
600
800
2000 2005 2010 2015 2020 2025 2030 2035 2040
Record FIDs delay expected supply-demand gapLNG demand estimated to double by 2040
February 2020 32
Source: Shell interpretation of IHS Markit, Wood Mackenzie, FGE and Poten & Partners Q4 2019 data
Emerging LNG supply-demand gapMTPA
Demand drivers for LNGMTPA
0
200
400
600
800
2000 2005 2010 2015 2020 2025 2030 2035 2040
Demand as LNG is the sole gas supply source
LNG demand supplements pipeline gas and/or domestic production
LNG demand due to declining domestic gas production
LNG demand from bunker fuel
LNG supply in operation
LNG supply under construction
Demand forecast central range
Potential Qatar expansion

Royal Dutch Shell
LNG bunkering demand accelerating
February 2020 33
Source: Shell interpretation of DNV GL, Woodmac, IHS Markit & IEA 2018 and 2019 data* Based on announcements with deliveries going out to 2027. Does not include 150 LNG-ready ships
385 LNG fuelled ships currently in operation/on order*
Confirmed LNG demand# of ships MTPA
LNG bunker demand projectionMTPA
0
10
20
30
40
50
2020 2025 2030 2035 2040Wood Mackenzie IHSMarkit
IEA (WEO 2019)On order
0 10 20 30 40
Car/Passenger ferriesContainer ships
Oil/Chemical tankersOffshore supply ships
Cruise shipsCrude oil tankers
Other vesselsRoPax
TugsGeneral cargo ships
Bulk carriersRo-Ro cargo ships
Car carriers
0.0
0.5
1.0
1.5
2.0
2.5
3.0
0
50
100
150
200
250
300
350
400
0 0 0 0 0 0 0 0 0 0 0 0 0
In operation On order ConsumptionIn operation

Royal Dutch Shell
China gas demand expected to double
April 2019 34
200
300
400
500
600
700
2019 Domesticproduction
Pipelineimports
LNGimports
2025 Domesticproduction
Pipelineimports
LNGimports
2040
52%
31%
200
300
400
500
600
700
2019 Power Industry Res &comm
Transport 2040
26%
19%
48% 7%
Source: Shell interpretation of Wood Mackenzie 2019 H1 data
China gas demand by sectorBCM
China supply by sourceBCM
17%
38%
33%
29%
Power of Siberia

Royal Dutch Shell
Growing gas demand expected in South and South-east Asia More LNG infrastructure investment needed
February 2020 35
Source: Shell interpretation of Wood Mackenzie and IHS Markit 2019 data
South Asia gas supply growth by sourceBCM
South-east Asia gas supply growth by sourceBCM
LNG demand and regasification capacityMT
0
50
100
150
200
250
2019 Domesticproduction
LNGimports
2040
India BangladeshPakistan Sri Lanka
0
50
100
150
200
250
2019 Domesticproduction
LNGimports
2040
Indonesia Malaysia Thailand
Vietnam Others
LNG demandRegas existingRegas under construction
0
50
2019 2040 Regas
India
0
50
2019 2040 Regas
Bangladesh
0
50
2019 2040 Regas
Indonesia
0
50
2019 2040 Regas
Thailand
0
50
2019 2040 Regas
Malaysia
0
50
2019 2040 Regas
Rest of SE Asia
0
50
2019 2040 Regas
Pakistan
0
50
2019 2040 Regas
Vietnam

Royal Dutch Shell February 2020 36
◼ European LNG imports increased by 74%◼ Higher nuclear availability and mild winters
reduced imports into Japan and South Korea◼ End of the current supply wave in 2020◼ Global LNG market equilibrium expected
to be restored
◼ Expected supply shortage in mid-2020s resulted in record FIDs
◼ Record FIDs delay expected supply demand gap
◼ LNG demand estimated to double by 2040
◼ 80% of energy demand growth expected to be met by renewables and gas
◼ Coal-to-gas switching helping level global CO2 emissions
◼ Record coal phase-out and generation reduction in 2019
Record supply investment due to confidence in long-term LNG demand growth
Gas continues to provide more and cleaner energy solutions
2019 was a year of record LNG supply growth
Summary
01 02 03