Embed Size (px)
Citation preview

Mining Spectrum Usage Data: A Large-Scale Spectrum Measurement
Study
Sixing Yin, Dawei Chen, Qian Zhang, Mingyan Liu, Shufang Li
Presented by Xiao MA
Outline for this presentation
! Introduction ! Methodology ! Statistic and correlation ! FPM
Introduction I -- background
! This paper includes a measurement experiment from 20MHz to 3 GHz band in Guangdong Province, China.
! 2 parameters(will be introduced in the next section) are measured and used for further observation.
! Measurements taken in 4 nearby spaces for a variety of services.
Introduction I Background
! Dynamic Spectrum Access is a scheme to utilize unlicensed band in a proper scheme so that it does not interfere with licensed usage.
! In DSA, sensing spectrum hole is an important step for the “Proper scheme”
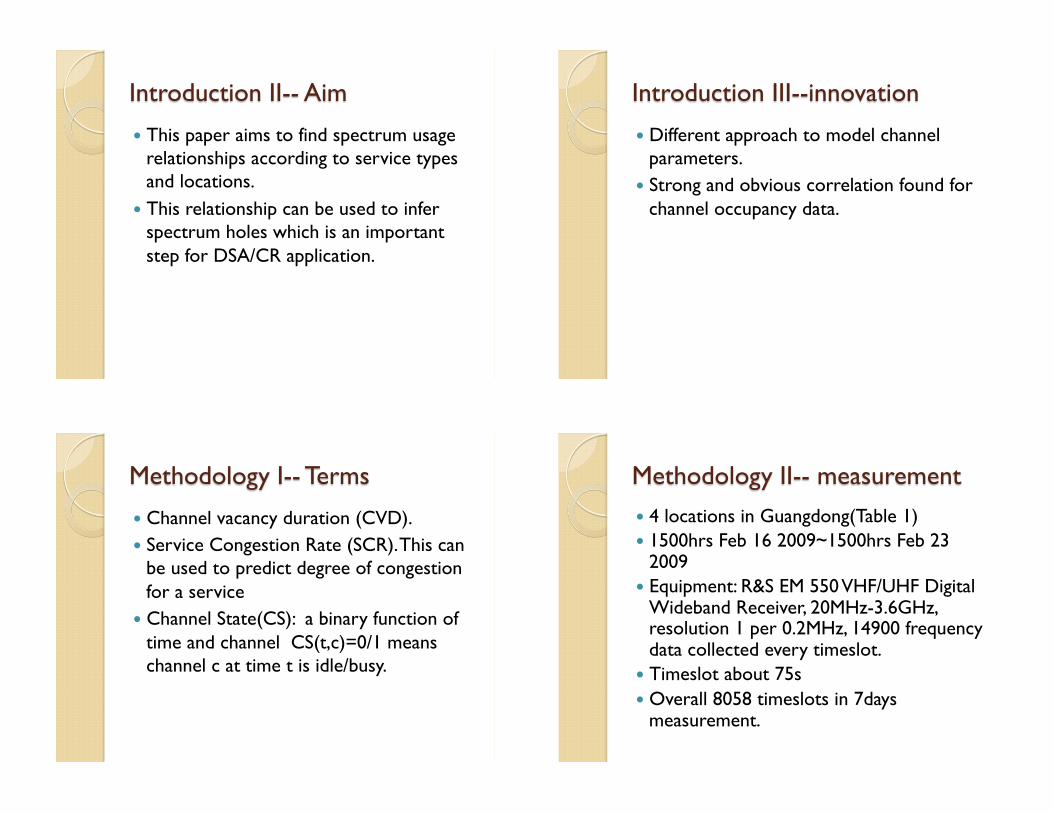
Introduction II-- Aim
! This paper aims to find spectrum usage relationships according to service types and locations.
! This relationship can be used to infer spectrum holes which is an important step for DSA/CR application.
Introduction III--innovation
! Different approach to model channel parameters.
! Strong and obvious correlation found for channel occupancy data.
Methodology I-- Terms
! Channel vacancy duration (CVD). ! Service Congestion Rate (SCR). This can
be used to predict degree of congestion for a service
! Channel State(CS): a binary function of time and channel CS(t,c)=0/1 means channel c at time t is idle/busy.
Methodology II-- measurement ! 4 locations in Guangdong(Table 1) ! 1500hrs Feb 16 2009~1500hrs Feb 23
2009 ! Equipment: R&S EM 550 VHF/UHF Digital
Wideband Receiver, 20MHz-3.6GHz, resolution 1 per 0.2MHz, 14900 frequency data collected every timeslot.
! Timeslot about 75s ! Overall 8058 timeslots in 7days
measurement.
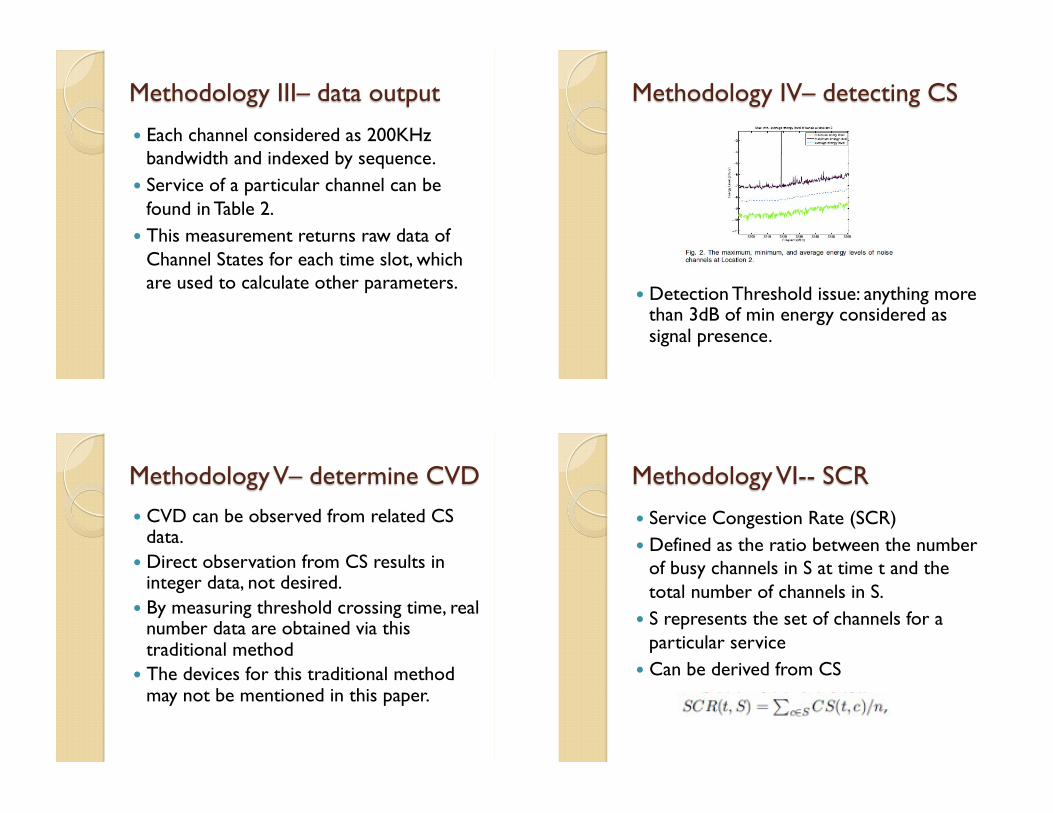
Methodology III– data output
! Each channel considered as 200KHz bandwidth and indexed by sequence.
! Service of a particular channel can be found in Table 2.
! This measurement returns raw data of Channel States for each time slot, which are used to calculate other parameters.
Methodology IV– detecting CS
! Detection Threshold issue: anything more than 3dB of min energy considered as signal presence.
Methodology V– determine CVD ! CVD can be observed from related CS
data. ! Direct observation from CS results in
integer data, not desired. ! By measuring threshold crossing time, real
number data are obtained via this traditional method
! The devices for this traditional method may not be mentioned in this paper.
Methodology VI-- SCR
! Service Congestion Rate (SCR) ! Defined as the ratio between the number
of busy channels in S at time t and the total number of channels in S.
! S represents the set of channels for a particular service
! Can be derived from CS

Methodology VII-- MSU
! Mobile service Utilization(MSU) defined as the time varying difference in total received energy.
! In this paper it is further assumed that each user introduce same energy in the channel, reducing the complexity for analysis.
Statistics I-- CVD
! CVD shows exponential-like PDF Note: the CVD, albeit can be obtained from CS as positive integers, are measured using the threshold trespassing record, in order to get more precise real number results.
Statistic I-- CVD
! The cumulative density distribution can be approximated and modeled as !="+#%↑−'( , an exponential like distribution
! The regression parameters is calculated by:
Pre-defined parameter
Statistics I CVD

Statistics I CVD
! !!!! The distribution does not satisfy the memory less property in Markov model. Recall: *(,)=.%↑−., while in this paper *(,)="+#%↑−',
! Statistics from CS series also indicates:
Statistics I CVD
! 75 second time slot issue ! Verified by increasing the sampling
interval to see how regression fits
Statistics II SCR
! SCR in the same location seems to have similar appearance.
Statistics II SCR
! Auto-correlation function and partial correlation function produces different statistics

Statistics II SCR
! It can be inferred that from partial correlation that SCR can be modeled as auto regressive process
Statistics II SCR
Statistics III MSU
! Defined to evaluate energy difference in time sequence in a channel.
! Assume each user introduces same amount of energy:
Statistics III MSU ! This model fits observation ! Observation does not change significantly
according to time and channel, and location

Statistics III MSU
! This model fits well when the sampling interval is less than 10 time slots(750s)
Correlation I– Spectrum CS
! Most CSs in GSM900 uplinks in Location 4 are highly correlated
Correlation II– Spectrum SCR
! Spectral correlation of SCR at Location 1
Correlation II—Spatial SCR
! L1 and L2 are similar, up to a constant shift. So do L3 and L4.
! All share general trend since subscribers at different locations share common behavioral.

Correlation II– Spatial SCR Correlation III– FPM and prediction
! Some same pattern in the CS series in all the channels occur frequently. These pattern can be used for prediction.
! This is a 2D prediction, that means to predict multiple channel CSs based on known multiple channel CSs.
! 2 issues: find pattern, and find associations among the patterns
FPM– Find pattern
! Need to find maximum possible patterns ! Trivial search is needed and hard ! An iterative-like decision process reduces
the complexity: e.g. (x,y) block can be judged as negative if one of its (x-1,y) sub block is negative
FPM algorithm terms
! Use hash tables /↓(×! to save positive recognized block patterns
! For each block pattern in /↓(×! , a variable is dedicated recording the repeating time for the pattern.
! Record in /↓(×! can be used to aid the finding of block patterns in /↓((+1)×! and /↓(×(!+1)

FPM algorithm overview 1. N=2 till infinite 2. For all x,y, x+y=N, establish new hash table
/↓(×! 3. Check each possible block 1↓(×! in
training data, eliminate impossible patterns. 4. Save all positive 1↓(×! s and their repetitions
respectively in hash table /↓(×! . 5. Delete the insufficient repeated blocks in
/↓(×! . 6. If nothing found in T, direct break out and end
this program, all previous saved T are the results learned in this process.
Prediction after FPM
! Example: We already observed that [0010] occurs 1000 times and [00101] occurs 990 times.
! So we can make a decision that if next time 0010 is observed, the next bit is 1 with probability of 0.99
! Unmatched blocks considered as missing in prediction(No prediction for these blocks)
Prediction after FPM
! Prediction accuracy and missing rate VS size of training
Prediction Compartments

Cross service Prediction Cross location prediction
Prediction summery
! Self service self location: more than 95%. Missing rate 4%~25%
! Cross service prediction 60%~80%, missing rate 30%~70%
! Self service cross locate predict has similar performance to self service self location
! 3h training time is sufficient
Problems--model
! Every estimation based on CS, CS based on sensing channel. Threshold dilemma, unable for CDMA detection
! Assumption: each user introduces same energy.

Problem--Algorithm
! Are the blocks include arbitrary combination of locations (rows)?
! Minimum repetition requirement may end up mess.
! Enhanced for multiple time slot prediction with some probabilistic reasoning.
Question Time