Embed Size (px)
Citation preview

Outline• Detecting occurrence and quantifying amount
of precipitation• Sources of errors• Reading Assignment: Section 4.1
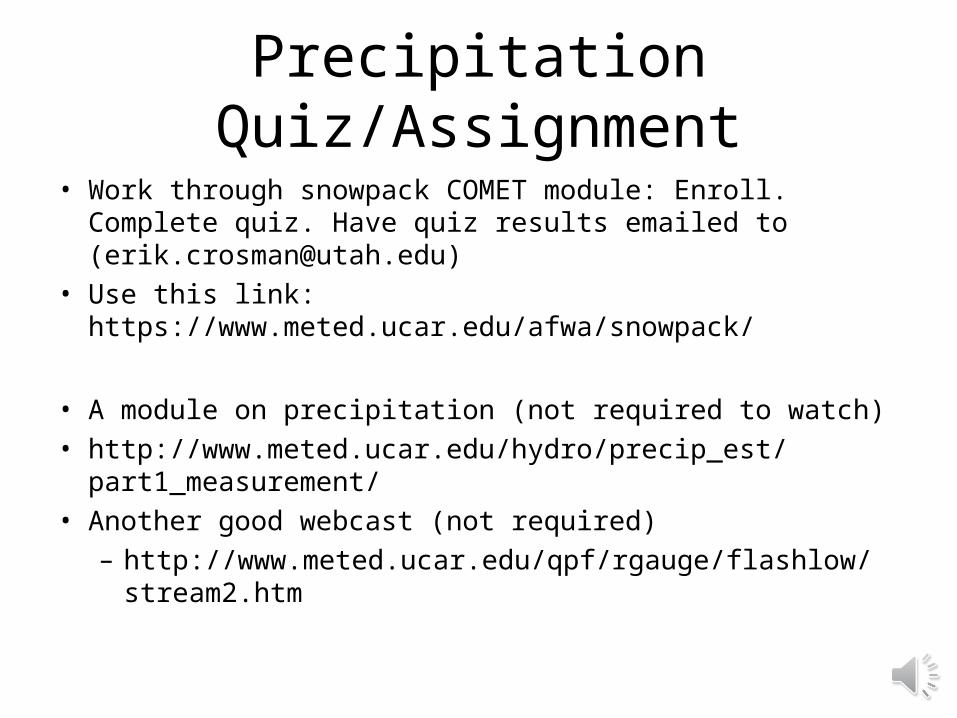
Precipitation Quiz/Assignment
• Work through snowpack COMET module: Enroll. Complete quiz. Have quiz results emailed to ([email protected])
• Use this link: https://www.meted.ucar.edu/afwa/snowpack/
• A module on precipitation (not required to watch)• http://www.meted.ucar.edu/hydro/precip_est/
part1_measurement/• Another good webcast (not required)
– http://www.meted.ucar.edu/qpf/rgauge/flashlow/stream2.htm

The Problem• Precipitation: Total depth to which a flat, horizontal surface of known area
would have been covered assuming no water loss by melting, runoff, or evaporation
• Measuring precipitation is one of the hardest environmental measurements to make due to:• It’s spatial and temporal variability • Impact of other environmental conditions, particularly wind
• Advantageous to have manual as well as automated observations

Snowfall in Tughill Plateau
http://www.inscc.utah.edu/~steenburgh/blog/video/sandycreek.movCourtesy J. Steenburgh

What is Goal?
• Detecting occurrence of precipitation• Liquid water equivalent of all hydrometeors:
rain, snow, graupel, hail• Measuring snow:
– Incremental depth and its snow water equivalent– Crystal type of new snow– Total Depth and its snow water equivalent– Crystal type of existing snowpack

Occurrence of Precipitation• Often tied with obstructions to visibility• Campbell:
http://www.campbellsci.com/pws100• Measuring precipitation type (rain vs. snow)
hydrometeor size, and rate (light vs. heavy); not measuring amount
• Using laser and detecting scattering and optical differences in horizontal and vertical planes

Precipitation Rate vs. Accumulation
• Precipitation: Total depth to which a flat, horizontal surface of known area would have been covered assuming no water loss by melting, runoff, or evaporation
• Precipitation rate: precipitation mass per unit time per unit area: R= Mw/w [kg/(m2 s) / kg/ m3]
• Precipitation rate in m/s; mm/hr; in/day, etc.• So, when someone says it rained an inch, it is always
necessary to know the time interval over which that happened as well

Snow Water Equivalent
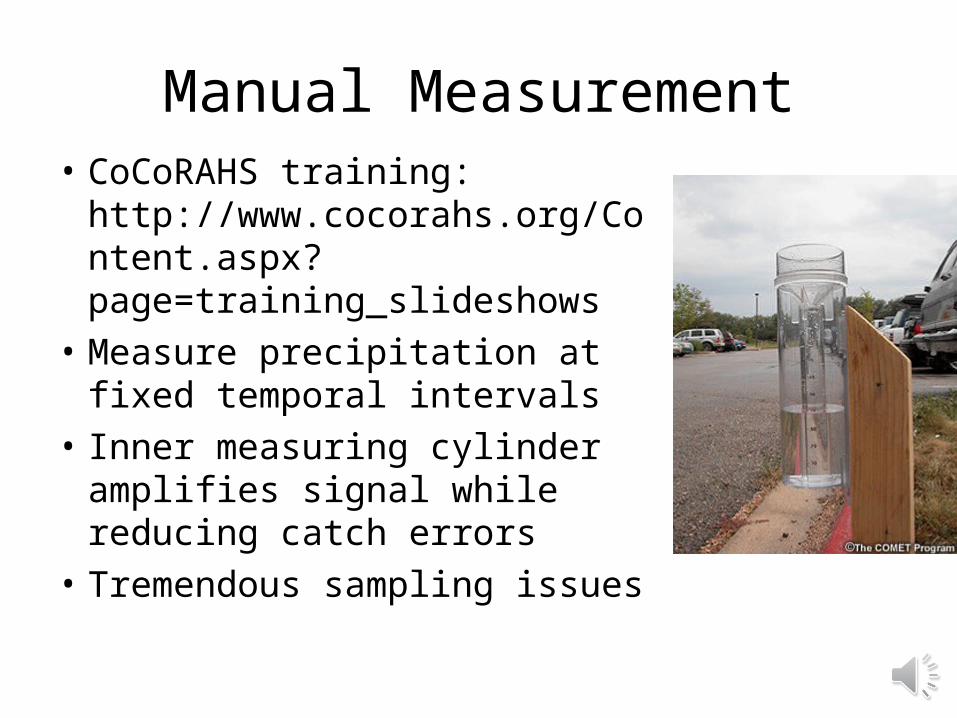
Manual Measurement• CoCoRAHS training:
http://www.cocorahs.org/Content.aspx?page=training_slideshows
• Measure precipitation at fixed temporal intervals
• Inner measuring cylinder amplifies signal while reducing catch errors
• Tremendous sampling issues

Automated Measurements
• Tendency to focus on issues related to mechanics of sensors at expense of worrying about how representative the observations may be for precipitation beyond observing site
Automated Sensors
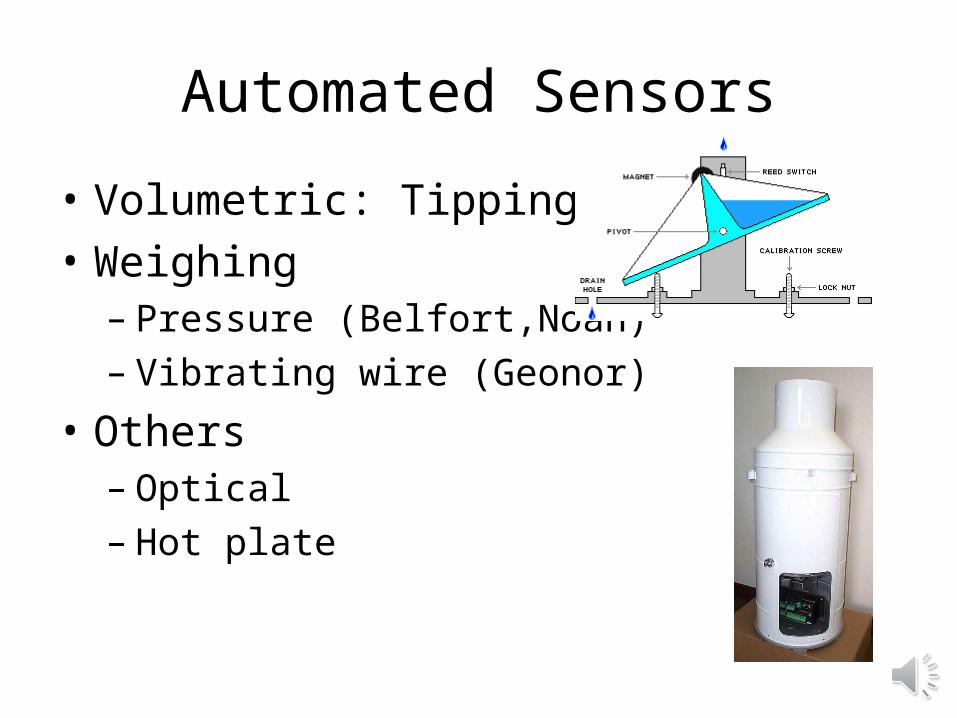
• Volumetric: Tipping bucket• Weighing
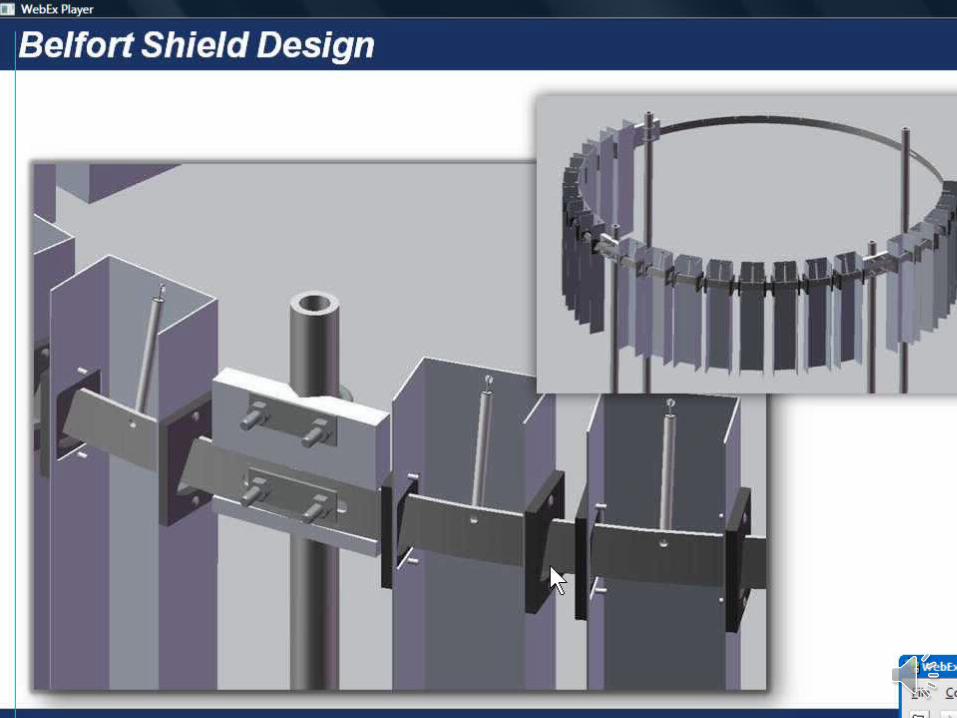
– Pressure (Belfort,Noah)– Vibrating wire (Geonor)
• Others– Optical– Hot plate

AutomatedSensors

SNOTEL: Weighing Gauge and Snow Pillow
• Low resolution: 0.1 inch water equivalent• Subject to temperature fluctuations
Weighing gauge

SNOTEL Snow Pillow
Vibrating Wire
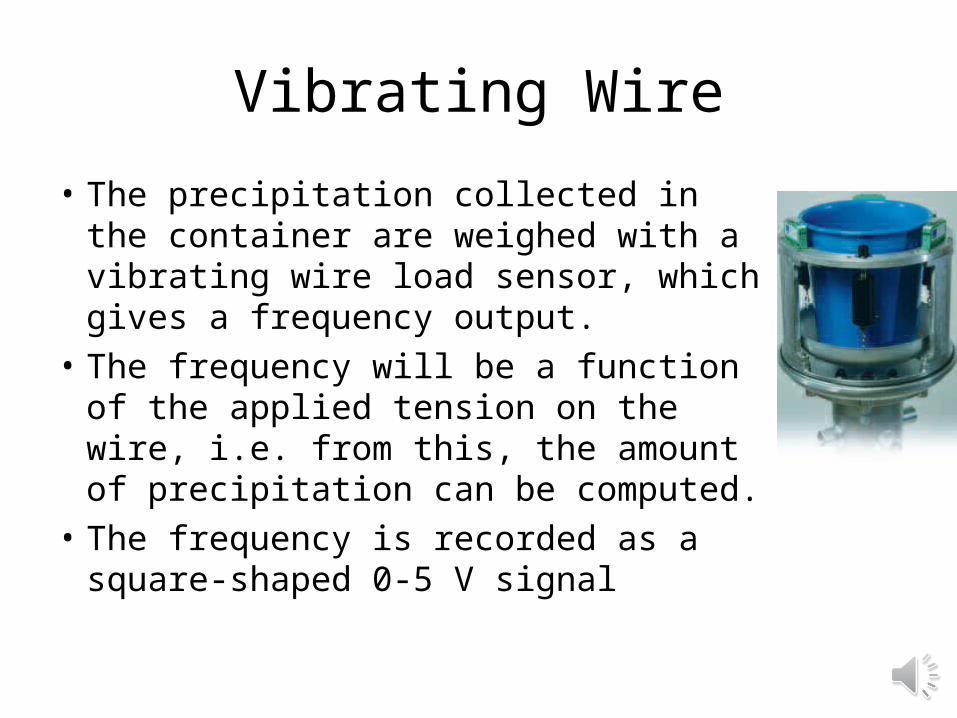
• The precipitation collected in the container are weighed with a vibrating wire load sensor, which gives a frequency output.
• The frequency will be a function of the applied tension on the wire, i.e. from this, the amount of precipitation can be computed.
• The frequency is recorded as a square-shaped 0-5 V signal
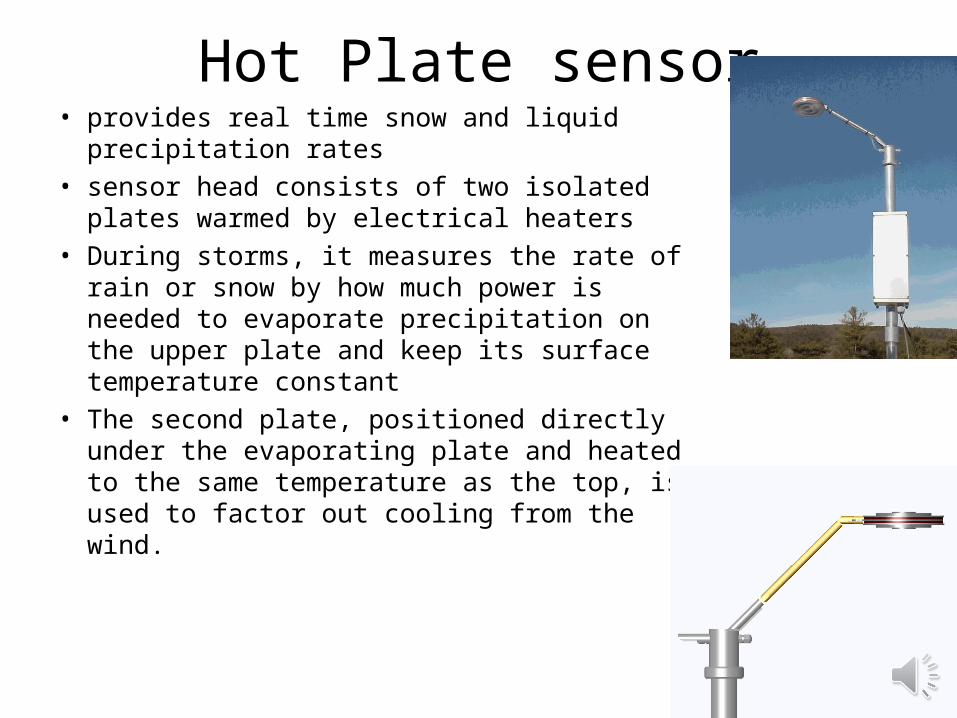
Hot Plate sensor• provides real time snow and liquid precipitation
rates • sensor head consists of two isolated plates
warmed by electrical heaters• During storms, it measures the rate of rain or
snow by how much power is needed to evaporate precipitation on the upper plate and keep its surface temperature constant
• The second plate, positioned directly under the evaporating plate and heated to the same temperature as the top, is used to factor out cooling from the wind.
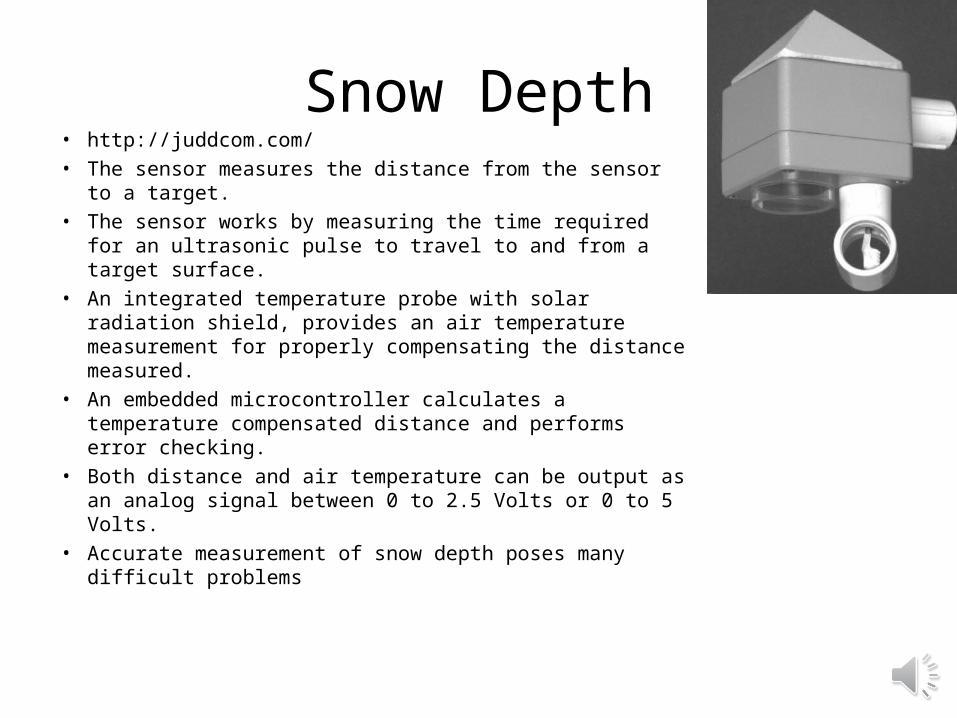
Snow Depth• http://juddcom.com/• The sensor measures the distance from the sensor to a
target. • The sensor works by measuring the time required for an
ultrasonic pulse to travel to and from a target surface. • An integrated temperature probe with solar radiation
shield, provides an air temperature measurement for properly compensating the distance measured.
• An embedded microcontroller calculates a temperature compensated distance and performs error checking.
• Both distance and air temperature can be output as an analog signal between 0 to 2.5 Volts or 0 to 5 Volts.
• Accurate measurement of snow depth poses many difficult problems

TugHill PlateauFrom J. Steenburgh
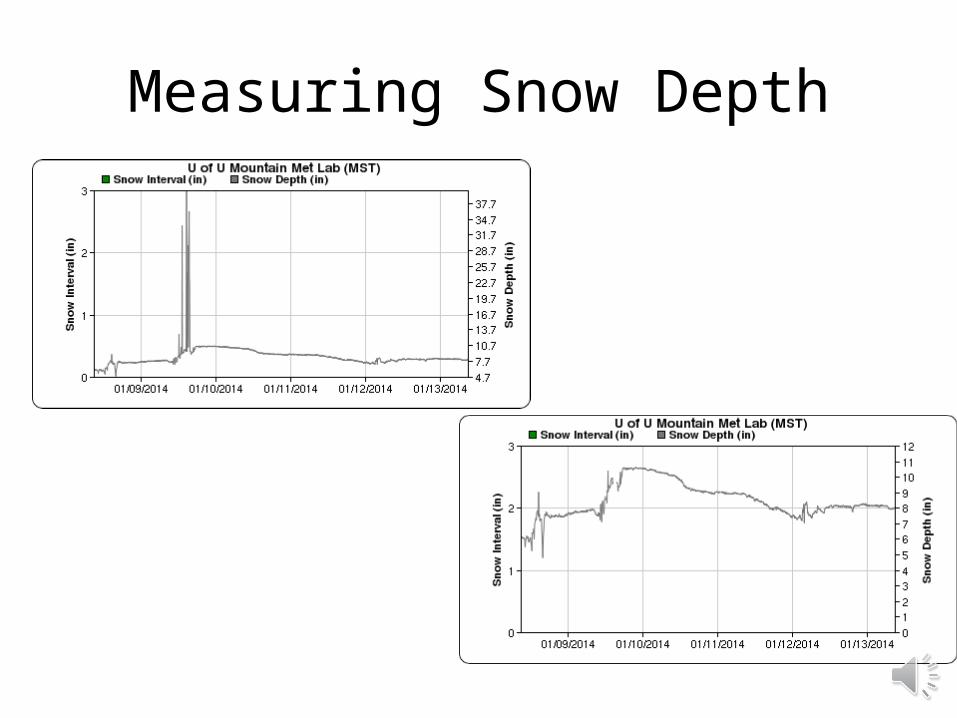
Measuring Snow Depth
Sources of Error• Representativeness
– Sampling errors can be + or –
• Wind• Evaporation- dry gauge delays detection of onset• Splash/capping/plugging/dew• Tipping bucket underestimation at high rain rate• Temperature sensitivity to weighing gauge• Automating precipitation detection

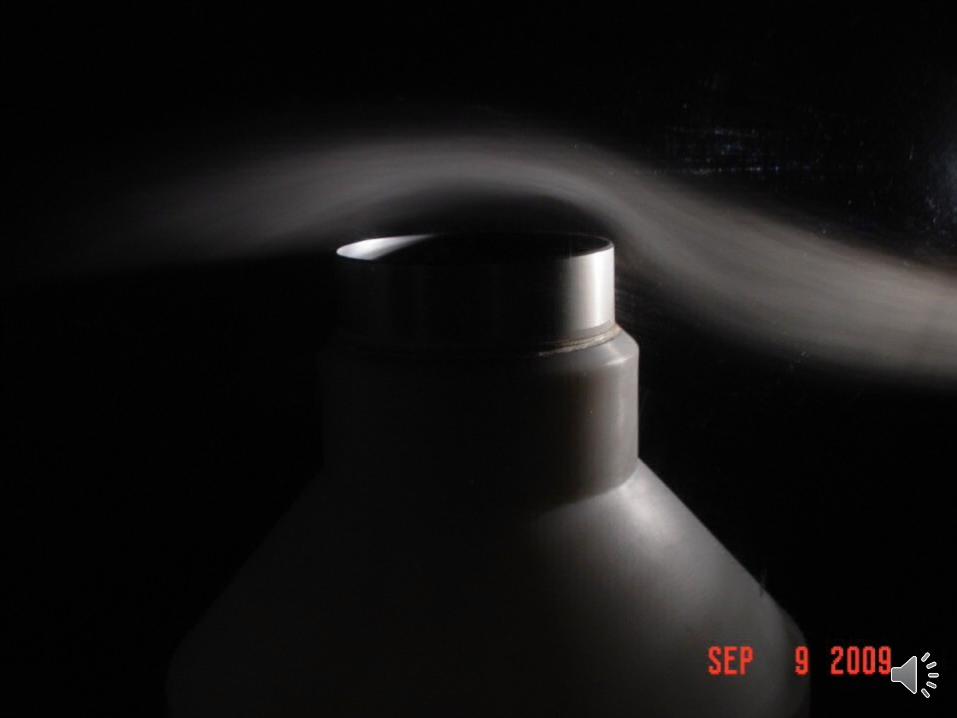
Sources of Error• Exposure
– Turbulent flows lead to undercatch– Worse for snow vs. rain– Problems increase as wind speed increases

B.E. Goodison, P.Y.T. Louie, and D. Yang (1998)

Rain
• Rule of thumb: 1% loss for every 1 mph increase in wind speed, or 2.2% for every 1 m/s increase
• Uncertainty associated with drop sizes & gauge location• Best measurements in windy conditions:
– Large drops– Gauge near the ground– Shielded gauges
• Poorest measurements – Small drops/drizzle drops– Elevated gauges

Wind Shield Type
• Double Fence Intercomparison Reference (DFIR)
• Single/Double Alter shields• Natural shielding by trees
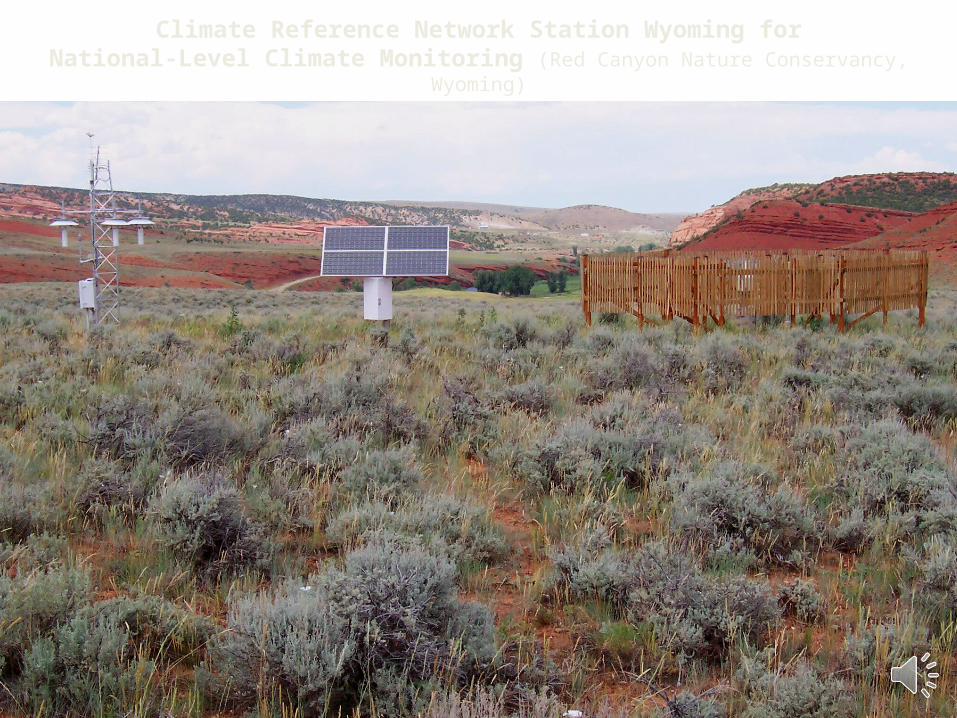
Climate Reference Network Station Wyoming forNational-Level Climate Monitoring (Red Canyon Nature Conservancy, Wyoming)
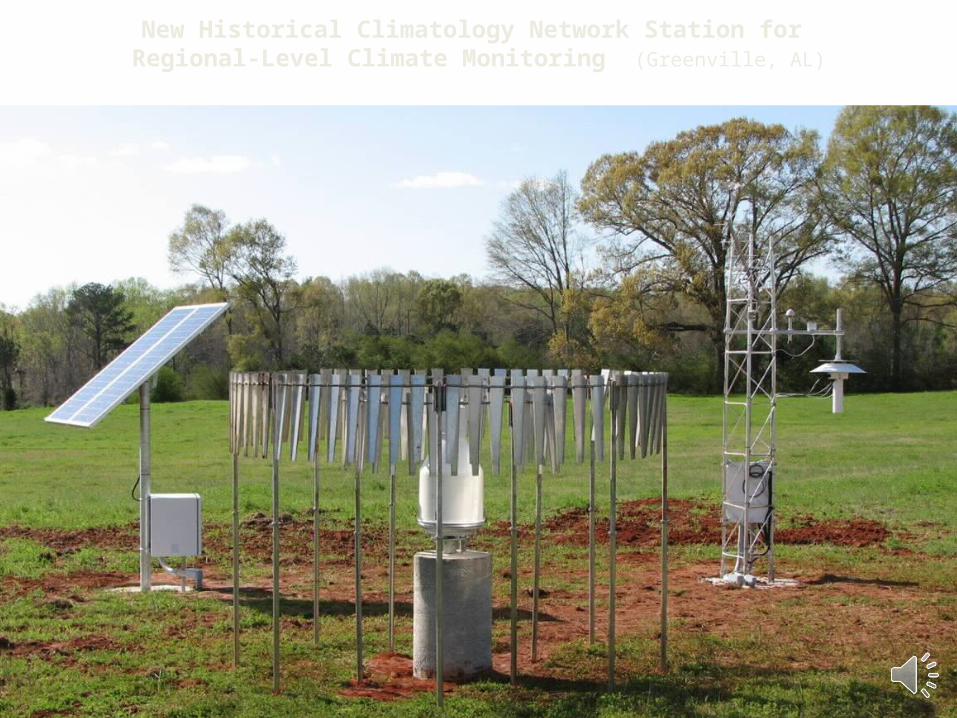
New Historical Climatology Network Station for Regional-Level Climate Monitoring (Greenville, AL)


Impact of Shields• Shielded gauges, on average, measure 20–70%
more snow than unshielded gauges (Yang et al. 1999)
• The use of wind shields on precipitation gauges has introduced a significant discontinuity into precipitation records, particularly in cold and windy regions
• This discontinuity is not constant and it varies with wind speed, temperature, and precipitation type.

B.E. Goodison, P.Y.T. Louie, and D. Yang (1998)

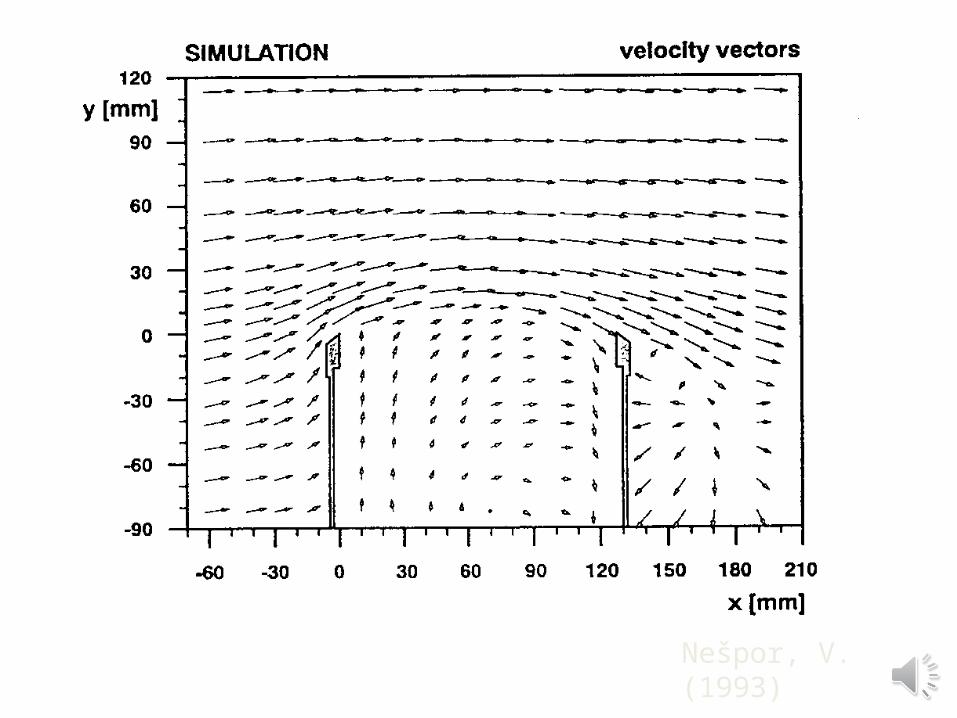
Nešpor, V. (1993)

317.9 318 318.1 318.2 318.3 318.4 318.5 318.60
5
10
15
20
Time (DOY 2009)
Pre
cip
itatio
n (
mm
)
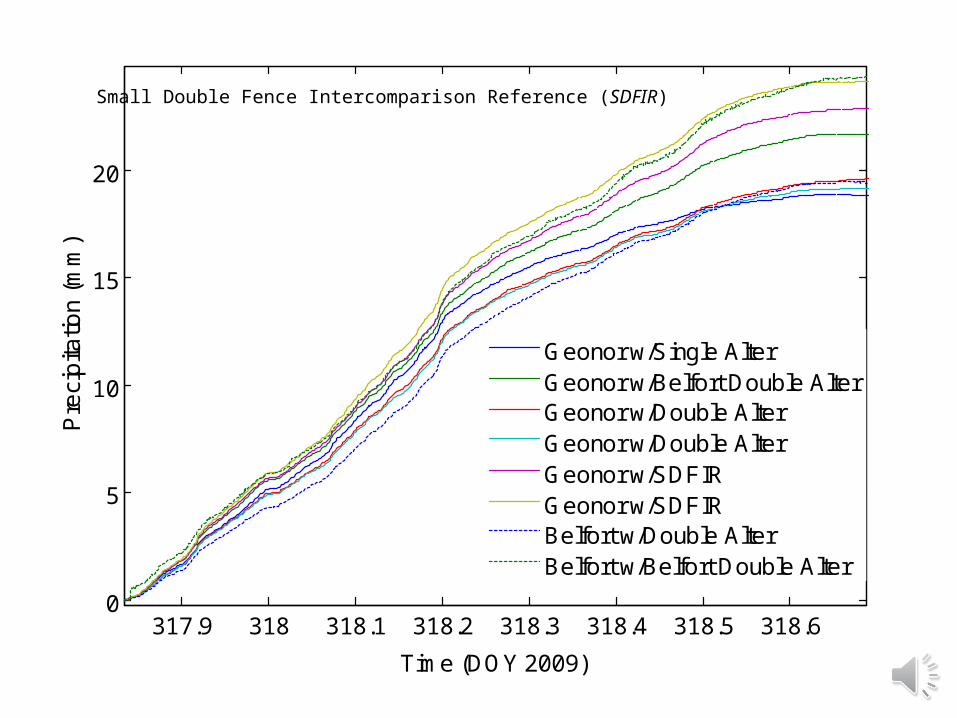
Geonor w/Single AlterGeonor w/Belfort Double AlterGeonor w/Double AlterGeonor w/Double AlterGeonor w/SDFIRGeonor w/SDFIRBelfort w/Double AlterBelfort w/Belfort Double Alter
Small Double Fence Intercomparison Reference (SDFIR)

85.6 85.8 86 86.2 86.4 86.60
5
10
15
20
25
30
35
40
Time (doy 2009)
Pre
cip
itatio
n (
mm
)
Double AlterSingle AlterDouble AlterDouble AlterSDFIRSDFIR

CoCoRaHS
• Community Collaborative Rain Hail and Snow Network
• http://www.cocorahs.org/

Summary• Gauge reports are fine for well-maintained, optimally
located gauges in light winds• Rain gauges do not necessarily provide good spatial
resolution• Significant underestimation error in strong winds• Gauge undercatch affected by variability in wind and
hydrometeor type• High wind: greater inaccuracy in gauge data than in
radar data (where good radar data)