Embed Size (px)
Citation preview
Outer Retinal Structure in Patients With Acute ZonalOccult Outer Retinopathy
MARIANNA MKRTCHYAN, BRANDON J. LUJAN, DAVID MERINO, CHARLES E. THIRKILL,
AUSTIN ROORDA, AND JACQUE L. DUNCANwq
rp
cA
● PURPOSE: To correlate visual function with high-resolution images of retinal structure using adaptiveoptics scanning laser ophthalmoscopy (AOSLO) in 4patients with acute zonal occult outer retinopathy(AZOOR).● DESIGN: Observational case series.● METHODS: Four women, aged 18 to 51, with acutefocal loss of visual field or visual acuity, photopsia, andminimal funduscopic changes were studied with best-corrected visual acuity (BCVA), Goldmann kinetic andautomated perimetry and fundus-guided microperimetry,full-field and multifocal electroretinography (ffERG andmfERG), spectral-domain optical coherence tomography(SD-OCT), and AOSLO imaging. Cone spacing wasmeasured in 4 eyes and compared with 27 age-similarnormal eyes. Additional functional testing in 1 patientsuggested that cones were absent but rods remained.Serum from all patients was analyzed for anti-retinalantibody activity.● RESULTS: In all patients vision loss was initially pro-gressive, then stable. Symptoms were unilateral in 2 andbilateral but asymmetric in 2 patients. In each patient,loss of retinal function correlated with structural changesin the outer retina. AOSLO showed focal cone loss inmost patients, although in 1 patient with central visionloss such change was absent. In another patient, struc-tural and functional analyses suggested that cones haddegenerated but rods remained. Anti-retinal antibodyactivity against a �45 kd antigen was detected in 1 of thepatients; the other 3 patients showed no evidence ofabnormal anti-retinal antibodies.● CONCLUSIONS: Focal abnormalities of retinal structurecorrelated with vision loss in patients with AZOOR.High-resolution imaging can localize and demonstrate theextent of outer retinal abnormality in AZOOR patients.(Am J Ophthalmol 2012;153:757–768. © 2012 byElsevier Inc. All rights reserved.)
Accepted for publication Sept 1, 2011.From the School of Optometry, University of California Berkeley,
Berkeley, California (M.M., B.J.L., A.R.); Department of Ophthalmol-ogy, University of California San Francisco, San Francisco, California(D.M., J.L.D.); and Ocular Immunology Laboratory, University of Cali-fornia Davis, Davis, California (C.E.T.).
Inquiries to Jacque L. Duncan, Department of Ophthalmology, Uni-versity of California, San Francisco, 10 Koret Way, #K129, San Francisco,
CA 94143-0730; e-mail: [email protected]© 2012 BY ELSEVIER INC. A0002-9394/$36.00doi:10.1016/j.ajo.2011.09.007
A CUTE ZONAL OCCULT OUTER RETINOPATHY
(AZOOR) is a syndrome characterized by acuteloss of 1 or more zones of visual function, usually
accompanied by photopsia, reduced outer retinal functionmeasured by electroretinography in 1 or both eyes, and, insome cases, death of retinal photoreceptor cells withoutbiomicroscopic or fluorescein angiographic abnormali-ties.1–3 AZOOR occurs more frequently in young myopic
omen, and recovery of visual function occurs infre-uently.1
The etiology of AZOOR is unknown, but infectious andautoimmune mechanisms have been proposed. Viral orother infectious agents may enter the eye at the opticnerve head or ora serrata and trigger an immune responseto viral antigens that are similar to antigens expressed byphotoreceptor cells, producing zones of acute photorecep-tor cell dysfunction or loss.1 However, no abnormal anti-etinal antibodies have previously been identified inatients with AZOOR.2 Alternatively, genetic factors may
predispose some individuals to autoimmune or inflamma-tory responses against retinal cells, and visual symptomsmay develop upon exposure to specific environmentaltriggers.4
Photoreceptor dysfunction is responsible for vision lossin AZOOR, and interocular asymmetry in electroretino-graphic responses is common. Photoreceptor outer seg-ment dysfunction and degeneration has been correlatedwith loss or attenuation of the photoreceptor inner seg-ment/outer segment (IS/OS) junction and inner nuclearand outer nuclear layers in regions with visual field defectsimaged using time-domain5 and spectral-domain opticaloherence tomography (SD-OCT) in patients withZOOR.6–8
Adaptive optics is a set of techniques to reduce blurcaused by imperfections in the eye’s optics and, whenused in an ophthalmoscope, allows for direct imaging ofthe cone photoreceptor mosaic in vivo.9,10 Severalreports have demonstrated the utility of using adaptiveoptics to characterize patients with retinal disease.11–18
In the present article, adaptive optics scanning laserophthalmoscopy (AOSLO) combined with SD-OCTdemonstrated changes in retinal structure that corre-lated with reduced visual function in 4 AZOOR patientsin whom retinal changes sufficient to explain the visualabnormalities were not visible using standard clinical
techniques.LL RIGHTS RESERVED. 757

TABLE. Summary of Clinical Studies in 4 AZOOR Patients
Best-Corrected
Visual Acuity ffERG mfERG Microperimetry HVF SD-OCT AOSLO
Antibody Against
�45 kd Antigen
Case 1 OD: 20/20
OS: 20/20
Normal amplitude
and timing OU,
no significant
interocular
asymmetry
Reduced response
densities and
delayed timing
in the region of
scotoma OU
Not performed Paracentral scotoma
OU with normal
foveal sensitivities
(37 dB OD, 38 dB
OS)
Disrupted IS/OS junction
OU in regions of
reduced cone
reflectivity
Reduced cone reflectivity
in the region of
scotoma OD
Not detected
Case 2 OD: 20/20
OS: 20/20-1
20% decrease in
photopic and
scotopic
amplitudes OS
compared to
OD
Reduced response
densities and
delayed timing
in the region of
scotoma OS
Cone-
mediated
scotoma
with rod-
mediated
sensitivity in
the region
of scotoma
OS
Paracentral scotoma
with normal foveal
sensitivity (40 dB)
OS
Reduced reflectance of
IS/OS junction within
scotoma region OS
Absence of cones in the
region of scotoma OS
with higher-density
cells suspected to be
rods
Not detected
Case 3 OD:
20/200�1
OS: 20/20
Reduced
photopic b-
wave
amplitude by
33% OD
relative to OS
and reduced
30 Hz flicker
implicit time
(30 ms OD vs
27.5 ms OS)
Reduced response
densities and
delayed timing
centrally OD
Severe loss of
foveal
sensitivity
by 3.5 log
units OD
Temporal scotoma
extending into
fixation OD
Relative thinning of outer
nuclear layer and
ganglion cell layer,
intact ELM-OS/RPE in
the region of scotoma
OD compared with
OS
Normal cone mosaic in
the region of reduced
foveal sensitivity OD
Not detected
Case 4 OD: 20/200
OS: 20/200
Normal amplitude
and timing OU,
20%-25%
lower response
to all stimuli
OD compared
to OS
Reduced response
densities and
delayed timing
centrally OU
Reduced
sensitivity in
the fovea
OU
Central scotoma OU
with reduced
foveal sensitivities
(18 dB OD, 26 dB
OS)
Loss of IS/OS junction in
the central macula
with thinning of outer
nuclear layer OU
Abnormal cone coverage
and spacing within
macula OD
Detected
AOSLO � adaptive optics scanning laser ophthalmoscopy; ELM � external limiting membrane; ffERG � full-field electroretinography; HVF � Humphrey visual field; IS/OS � inner
segment/outer segment; mfERG � multifocal electroretinography; RPE � retinal pigment epithelium; SD-OCT � spectral-domain optical coherence tomography.
AM
ERIC
AN
JOU
RN
AL
OF
OPH
THA
LMO
LOG
Y758
APR
IL2012

FIGURE 1. Acute zonal occult outer retinopathy, Patient 1, right eye. Similar findings were present in the left eye (not shown).(Top left) The fundus examination was normal. (Top right) Parafoveal visual field (VF) defects with normal foveal sensitivities.(Middle) The multifocal electroretinographic first-order response traces, displayed in field view, reveal a discrete region, 5 degreestemporal to fixation, of abnormally reduced response densities with delayed timing. (Bottom) Adaptive optics scanning laserophthalmoscopy (AOSLO) images superimposed on an infrared fundus image reveal abnormal cone reflectivity in regionscorresponding to the visual field defects and reduced multifocal electroretinography (mfERG) responses. The composite AOSLO
RETINAL STRUCTURE IN ACUTE ZONAL OCCULT OUTER RETINOPATHYVOL. 153, NO. 4 759

afbppslDtfimlr
oTldpapOMoPo
mlp65uwstlowbscamDnw
flasf(nNlblN1
bar i
METHODS
● COMMON TESTS FOR ALL PATIENTS: All subjects un-derwent a complete eye examination including best-cor-rected visual acuity measured according to the EarlyTreatment of Diabetic Retinopathy Study protocol, slit-lamp biomicroscopy, color fundus photography, and infra-red fundus photography with SD-OCT (Spectralis HRA �OCT Laser Scanning Camera System; Heidelberg Engi-neering, Vista, California, USA). Goldmann kinetic pe-rimetry was performed with II3�c, V3�c, and I4e targets, andutomated perimetry was completed with measurement ofoveal thresholds using a Goldmann III stimulus on a whiteackground (31.5 asb) and exposure duration of 200 ms;atients were tested using either the 30-2, 24-2, or 10-2rotocol depending on the extent and location of thecotoma (SITA Standard, Humphrey Visual Field Ana-yzer; HFA II 750-6116-12.6; Carl Zeiss Meditec, Inc,ublin, California, USA). Pupils were dilated with 1%
ropicamide and 2.5% phenylephrine before bilateral full-eld electroretinography (ffERG) was performed after 45inutes of dark adaptation using Burian-Allen contact
ens electrodes (Hansen Ophthalmic Development Labo-atory, Iowa City, Iowa, USA), as described previously.16
Eyes were tested simultaneously and measured individ-ually, according to standards specified by the Interna-tional Society for Clinical Electrophysiology and Vision(ISCEV).19 Multifocal ERG (mfERG) testing was per-formed in a light-adapted state (VERIS 5.1.10C, Elec-trodiagnostic Imaging, Inc, Redwood City, California,USA) with Burian-Allen contact lens electrodes, alsoaccording to ISCEV standards20 and as described previ-
usly.16 Fundus-guided microperimetry (MP-1; Nidekechnologies America Inc, Greensboro, North Caro-
ina, USA) used a Goldmann size III stimulus of 200 msuration with a 4-2 threshold strategy as describedreviously.16 Serum from all patients was analyzed fornti-retinal antibody activity using Western blots oforcine retina (PelFreez, Rogers, Arkansas, USA) at thecular Immunology Laboratory, UC Davis, California.agnetic resonance imaging (MRI) of the brain and
rbits with and without contrast was performed inatients 2 and 3 to exclude central nervous system orrbital disease.
image, which spans approximately 7.7 � 4.6 degrees, showsotherwise contiguous cones with normal spacing (white circlemontage, highlight retinal regions with contiguous cone coverainsets show distinct transitions between normally reflecting conThe left inset with black circles surrounding it demonstratesoptical coherence tomography (SD-OCT) scan (green line indisegment (IS/OS) junction corresponding with reduced reflectivilayers are labeled. The most affected region of the B-scan is indicto regions of reduced sensitivity on the visual field test. Scale
AMERICAN JOURNAL OF760
● ASSESSMENT OF ROD- AND CONE-MEDIATED SENSI-
TIVITY: In Patient 2, 2-color dark-adapted Goldmannperimetry and fundus-guided 2-color dark-adapted micro-perimetry were used to investigate localized rod and conefunction. Chromatic dark-adapted 2-color kinetic perime-try was performed to measure the rod contribution to thedark-adapted kinetic visual field.21 In order to ensure thatthe parameters were correct for measuring rods, fields weremeasured and sensitivity was compared for 2 differentwavelengths.21 Visual fields were measured for the Gold-
ann II3�c and V3�c target sizes, each with a long-wave-ength and a short-wavelength filter, as describedreviously.21 The long-wavelength filter had a cut-on at00 nm, while the short-wavelength filter had a cutoff at10 nm. Long-wavelength and short-wavelength filterssed were Wratten 25 and 47B, respectively. The stimuliere 2 log units lower in luminance (II3�c and V3�c) for the
hort-wavelength stimulus, based on the spectral emit-ance of the Goldmann perimeter bulb, the scotopicuminance efficiency function, and spectral transmittancef the chromatic filters.21 A fixation target was providedith a dim red light presented in the Ganzfeld dome. Theackground light in the bowl was occluded by moving theliding diaphragm up to its maximal height, in addition toovering it with several layers of blackout cloth to preventny light leakage. To monitor the patient’s fixation,onovision night goggles (Zenit NV, Famous Trails, Saniego, California, USA) were employed. Two healthyormal subjects were also tested to verify that the stimuliere matched scotopically.Two-color dark-adapted microperimetry was also per-
ormed to investigate retinal sensitivity with higher reso-ution using a custom test pattern with a 40-degree testingrray using a Goldmann size V stimulus of 200 ms durationpaced in 0.5-degree increments, extending 10 degreesrom the fovea in the nasal and temporal directions. BlueNT30-635, 500 nm short pass) and red (NT30-34, 600m long pass; Edmund Industrial Optics, Inc, Barrington,ew Jersey, USA) filters were introduced into the stimulus
ight path with the background set to red, such that theackground illumination was effectively 0 cd/m2 (Cross-and MD, et al. IOVS 2010;51:ARVO E-Abstract 3640).eutral-density (ND) filters attenuated the red stimulus by
.0 log unit (NT48-095, Edmund Industrial Optics, Inc)
s of reduced cone reflectivity around the foveal center, buthe insets, indicated by the black rectangles on the AOSLO
terspersed with areas of reduced retinal reflectivity. The lowernd reduced reflectance regions with less obvious cone mosaics.inal region with abnormal cone spacing. The spectral-domainscan location) shows irregularities in the inner segment/outercones. External limiting membrane (ELM) and IS/OS junctionby the white line. Areas of reduced cone reflectivity corresponds 1 degree.
areas). T
ge ines a
a retcatesty ofated
OPHTHALMOLOGY APRIL 2012

FIGURE 2. Acute zonal occult outer retinopathy, Patient 2, left eye. (Top left) Mild retinal pigment epithelium (RPE)hypopigmentation was present temporal to the fovea. (Top right) Paracentral 10-degree scotoma nasal to fixation with normal fovealsensitivity. (Middle) The multifocal electroretinographic first-order response traces, displayed in field view, reveal a discrete area ofreduced response density with delayed timing from 5 to 20 degrees nasal to fixation. The area of reduced function corresponds tothe paracentral scotoma present on VF testing and the retinal region with affected cone spacing. (Bottom) The AOSLO image,which spans approximately 8.9 � 2.4 degrees, is superimposed on an infrared fundus image (scale bar is 1 degree). Cone spacingand coverage are normal (white circles) in all areas except locations near the relative scotoma (demarcated by the long white arrow),
RETINAL STRUCTURE IN ACUTE ZONAL OCCULT OUTER RETINOPATHYVOL. 153, NO. 4 761

rcri
pn
atnhsc
ipws
sedb
asfipscaT
cha
and the blue stimulus by 2.0 log units (NT48-097). After30 minutes of dark adaptation, rod function was testedusing the blue and 2.0 ND filters, then using the red and1.0 ND filters. Stray light was shielded by placing a blackcurtain between the patient and the monitor. The pa-tient’s fixation was monitored and the chin position wasadjusted to maintain good fundus tracking. The sensitivityvalues for each location using blue dark-adapted (BlueDA) and red dark-adapted (Red DA) stimuli were com-pared with the expectation that, if the eye was normal, itwould show at least 18 dB greater sensitivity to short-wavelength compared to long-wavelength stimuli in thedark-adapted state.22 Given our testing parameters, sensi-tivity at retinal locations with at least 8 dB greatersensitivity to Blue DA than to Red DA stimuli indicatesrod-mediated function, while sensitivities with differencesof less than 8 dB indicate cone-mediated function.23
● HIGH-RESOLUTION IMAGING: AOSLO was used togenerate high-resolution en-face images of the centralretina of the affected eye of each patient, or the better eyein bilateral cases, as described previously.16 Cone spacingwas measured24 at locations in which unambiguous coneswere visualized, and compared to normative data from 27age-similar individuals.16 Cone spacing greater than 2standard deviations above the normal mean at that loca-tion was considered abnormal.13,14,16
RESULTS
THE TABLE PROVIDES A SUMMARY OF CLINICAL RESULTS
for all 4 patients.
● CASE 1: An 18-year-old healthy emmetropic womanpresented 5 weeks after the acute onset of scotomas andphotopsias in both eyes. Past medical history includedmigraines and seasonal allergies, with no history of auto-immune disease. There were no fundus abnormalities ineither eye (Figure 1; right eye shown). Multifocal ERGrevealed localized macular outer retinal dysfunction.
AOSLO images within the foveal center showed normalcone spacing and density.16 Beyond 1.5 degrees, coneeflectivity was reduced, but cone spacing was normal andontiguous except in a region adjacent to a patch of weaklyeflecting retina (Figure 1). The patient experienced nomprovement or progression of visual loss, and repeated
within which no cones are visible. The large inset (black rectanginto abnormal or sparse cone spacing (black circles). The smallregion of hexagonal cells (white arrows) in addition to a localizeretinal region where RPE cells were observed is different fromindicated by the green line on the background image) shows redThe inset above the SD-OCT B-scan highlights the reflectance
AMERICAN JOURNAL OF762
erimetry, mfERG, AOSLO, and SD-OCT studies showedo significant changes over 14 months.
● CASE 2: A 42-year-old myopic woman presented withcute onset of a blind spot in her left eye associated withransient flashing lights that occurred only in total dark-ess. The patient had a history of complex partial seizures,ypertension, panic disorder, psychogenic amnesia, andhort-term memory loss. MRI of the head with and withoutontrast was normal.
AOSLO imaged the transition from normal cone spac-ng and coverage16 to a region beginning 4 degrees tem-oral to the fovea corresponding to a discrete scotomahere cones were less contiguous and showed increased
pacing13,14,16 (Figure 2). Beyond 4 degrees, regularlyarranged cells were observed, but with higher density thanhas been reported for cones,13,14,16 and these were sus-pected to be rods.25 The region of the relative scotoma alsohowed some structure consistent with retinal pigmentpithelial (RPE) cells, which have been shown to beirectly visible in instances where photoreceptor cells haveeen lost14 (Figure 2).
Two-color dark-adapted modified Goldmann kineticperimetry21 and fundus-guided microperimetry were per-formed to assess whether the remaining visual function wasrod-mediated in the region of relative scotoma. Thesuperimposed isopters from the 2 stimuli indicated that thetest was rod-mediated (Figure 3). Two-color dark-adaptedmodified microperimetry, as described previously, alsoindicated rod-mediated function (Figure 3).22,23
AOSLO images were taken at 4 time points over aperiod of 48 months. Although the image quality of theimaging sessions differed, the cone mosaic appeared stable,and there was no evidence of progressive cone loss.SD-OCT images taken 10 months apart also indicated nochange in the decreased reflectance of the IS/OS junctionwithin the region of lesion.
● CASE 3: A 27-year-old myopic woman presented withcute vision loss and photopsias in the right eye, initiallytarting in the mid-periphery and moving to involvexation. The peripheral visual field abnormalities im-roved over the next 3 months but she retained a centralcotoma with discrete borders. Past medical history in-luded autoimmune hepatitis diagnosed at age 16 andutoimmune thyroiditis. MRI of the head was normal.here were no fundus abnormalities in either eye.
ighlights the retinal region of normal cone spacing transitioningets (white squares) show a transition from cones to a localizedinal region with tightly packed cells, suspected to be rods. Theegion noted with presumed rods. The SD-OCT scan (locationreflectance of the IS/OS junction within the relative scotoma.
nge.
le) her insd retthe ruced
OPHTHALMOLOGY APRIL 2012

s
FIGURE 3. Acute zonal occult outer retinopathy. (Top) Kinetic perimetry for Patient 2, left eye. (Left) Two-color dark-adaptedGoldmann kinetic field isopters. The isopter for the V3�c long-wavelength stimulus target (red solid line) and the isopter for the V3�chort- wavelength stimulus target (blue solid line) are superimposed. The isopter for the II3�c long-wavelength stimulus target and
RETINAL STRUCTURE IN ACUTE ZONAL OCCULT OUTER RETINOPATHYVOL. 153, NO. 4 763

as
curna
idu
apmct
aS
uotRR
w(blstdA
Dai
Gi medi
Although the highest-density cones in the foveal centerwere not resolved, which is typical for eyes with normalcone packing,16 the remainder of the foveal image showed
normal cone mosaic, despite severely reduced fovealensitivity (Figure 4).
AOSLO images taken 24 months later revealed nohange in the appearance of the cones; SD-OCT was alsonchanged with stable relative thinning of the inneretinal layers including the outer nuclear layer (ONL) butormal reflectance of the IS/OS, OS, and RPE layers in theffected eye.
● CASE 4: A 51-year-old myopic female patient presentedwith 4 months of reduced central vision in each eye, worsein bright light and associated with photosensitivity, anddifficulty adapting from dark into light conditions.
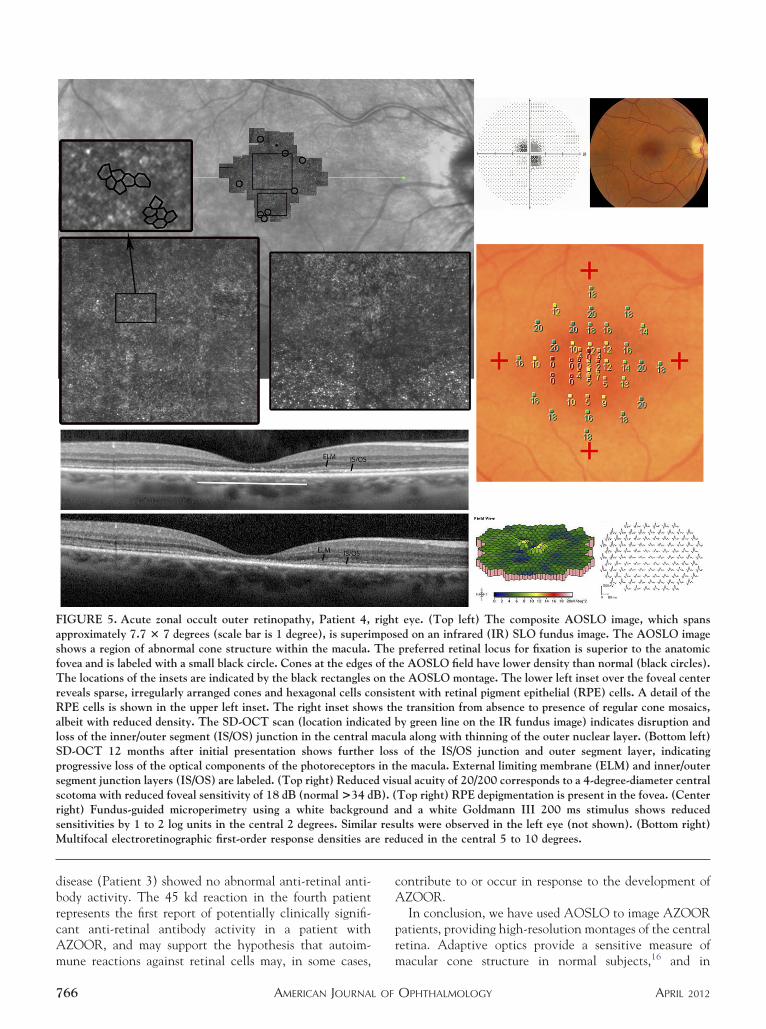
AOSLO images of the right eye showed abnormal conestructure within the central 4 degrees from the fovea13,14,16
(Figure 5, right eye shown). SD-OCT images obtained 12months later showed loss of the external limiting mem-brane at the fovea. Anti-retinal antibody activity involv-ing a �45 kd antigen was identified in a Western blot ofporcine retina.26-29
DISCUSSION
THE MECHANISM OF VISION LOSS IN AZOOR PATIENTS
remains uncertain, although photoreceptor, inner retinal,and RPE dysfunction has been documented.1–3 To ourknowledge, no histologic studies exist describing the effectof AZOOR on cone structure, but several recent reportshave shown attenuation of the IS/OS junction and outerretinal loss in cross-section using both time-domain andspectral-domain OCT.5-8,30 We observed similar findingsn 3 of our 4 patients and extended our studies to includeirect en-face visualization of cone photoreceptor cellssing AOSLO.The AOSLO image in the first patient showed focal
reas of reduced cone reflectivity indicated by darkatches, interspersed with regions of contiguous and nor-al cone spacing (Figure 1). The reduced cone reflectivity
ould indicate morphologic alterations that interfere withhe wave-guiding properties of the cones.31
the isopter for the II3�c short-wavelength stimulus target (notscotoma is absent and both red and blue stimuli were seen as a“blurry or dimmer” in the region of the scotoma. (Right) Lighttarget stimulus shows full peripheral fields with the II3�c a
ark-adapted 2-color fundus-guided microperimetry for Patienfundus image. (Top) Dark-adapted blue (Blue DA) sensi
lluminance of 0 cd/m2, 200 ms Goldmann V blue stimulus, 2.0sensitivities showed a dense scotoma beginning about 3 degrees
oldmann V red stimulus, 1.0 ND filter). The difference betwen the region of scotoma was at least 8 dB, demonstrating rod-
AMERICAN JOURNAL OF764
Despite the loss of visible cones in the AOSLO image inPatient 2, the IS/OS junction was continuous, althoughreflectance of this layer was reduced (Figure 2), represent-ing a significant change in actual reflectance in the regionof the relative scotoma since OCT images are displayed ona logarithmic scale. Whereas loss of cone reflectance isgenerally observed as disruption of the IS/OS layer (Figure1), the presence of a visible IS/OS junction in thescotomatous area where unambiguous cones were notvisible suggests cones may have been absent or very sparsein the areas of the scotoma, but that rods remained. We didnot see a shift in the outer termination of the photorecep-tor outer segments across the transition to the rod-onlyregion as we might have expected based on some recenthigh-resolution SD-OCT studies.32 We suspect this isttributable to the poorer resolution of our commercialD-OCT system.In patients with dense scotomas and areas in which
nambiguous cones were not visualized, mosaics of polyg-nal RPE cells were imaged (Figures 2 and 5). Althoughhese images provide no information on the health of thePE cells, they suggest that in some AZOOR patients,PE cells persist in the absence of overlying cones.In Patient 3 cone reflectivity, contiguity, and spacing
ere no different from normal, despite central visual lossFigure 4). Photoreceptors may be initially dysfunctionalut preserved in early stages of AZOOR, and lost only inater stages,5 but serial AOSLO images over 24 monthshowed no evidence of progressive photoreceptor loss inhis patient. Inner retinal dysfunction as measured byelayed 30-Hz flicker implicit time has been reported inZOOR patients3 and was present in Patient 3. The
present manuscript provides images of an intact conemosaic and outer retinal layers in a region with centralvision loss and evidence of inner retinal dysfunctionmeasured by delayed 30-Hz flicker timing, as well asthinning of the inner retinal layers, providing support forthe observation that vision loss in patients diagnosed withAZOOR can be caused by inner retinal dysfunction in thepresence of normal cone structure.
In Patient 4, repeated SD-OCT imaging revealed re-duced outer retinal thickness over 1 year (Figure 5),consistent with reports that AZOOR may progress in 4%of patients.1 The patient with a history of autoimmune
wn) were also superimposed. In these rod-mediated tests, thematic, although the patient reported the blue targets to appearpted Goldmann kinetic field isopters obtained by using a white3�c targets; the I4e stimulus shows the scotoma. (Bottom)
left eye. The data from microperimetry are superimposed ontoes were normal throughout the regions tested (backgroundtral density [ND] filter). (Bottom) Dark-adapted red (Red DA)poral to fixation (background illuminance of 0 cd/m2, 200 mslue DA and Red DA sensitivity values for each retinal locationated sensitivity in the scotomatous region.
shochro-adand Vt 2,tivitineutem
en B
OPHTHALMOLOGY APRIL 2012

FIGURE 4. Acute zonal occult outer retinopathy, Patient 3, right eye. (Top left) The composite AOSLO image superimposed on aninfrared fundus image reveals normal cone spacing and coverage (white circles) throughout the macula in the affected right eye despitethe central scotoma. Two retinal locations indicated slightly abnormal cone spacing (black circles) but an otherwise contiguous conemosaic. The composite image spans approximately 6.6 � 8.25 degrees (scale bar is 1 degree). The smaller AOSLO montage towardthe disc indicates the location of the preferred retinal locus for fixation. (Center left) The magnified AOSLO montage is indicated by theblack inset. The black dot in the inset is the location of the anatomic fovea. The SD-OCT scan (green line indicates scan location) showsan uninterrupted IS/OS junction layer corresponding to the central region of scotoma. (Bottom left) SD-OCT scans of the affected righteye (top) and the normal left eye (bottom). The left eye has been flipped horizontally for comparison purposes. ELM and IS/OS junctionlayers are labeled. The symptomatic eye shows attenuation of the outer nuclear and inner retinal layers compared to the contralateral eye.The laminar appearance of the optical components of the photoreceptors shows normal reflectance of the IS/OS junction across themacula, with subtle abnormalities of the OS/RPE junction. (Top right) Humphrey visual field (HVF) 30-2 at presentation (left) and 10-23 months later (right) reveals the initial temporal visual field defect decreasing in size, resulting in a central scotoma 6 degrees in diameterover 3 months, which persisted 2 years after symptoms onset; foveal sensitivity was reduced by at least 3.5 log units. (Center right) Thedata from microperimetry is superimposed onto the fundus image. Microperimetry using a white background and a white Goldmann III200 ms stimulus reveals at least 2 log units sensitivity loss in the central 4 degrees in diameter. (Bottom right) The mfERG first-orderresponses displayed in field view also reveal unilateral reduced response densities centrally corresponding with the HVF defect.
RETINAL STRUCTURE IN ACUTE ZONAL OCCULT OUTER RETINOPATHYVOL. 153, NO. 4 765
sfTrRalSpssrsM
disease (Patient 3) showed no abnormal anti-retinal anti-body activity. The 45 kd reaction in the fourth patientrepresents the first report of potentially clinically signifi-cant anti-retinal antibody activity in a patient withAZOOR, and may support the hypothesis that autoim-
FIGURE 5. Acute zonal occult outer retinopathy, Patient 4,approximately 7.7 � 7 degrees (scale bar is 1 degree), is superihows a region of abnormal cone structure within the macula.ovea and is labeled with a small black circle. Cones at the edgeshe locations of the insets are indicated by the black rectangles
eveals sparse, irregularly arranged cones and hexagonal cells coPE cells is shown in the upper left inset. The right inset show
lbeit with reduced density. The SD-OCT scan (location indicaoss of the inner/outer segment (IS/OS) junction in the centralD-OCT 12 months after initial presentation shows furtherrogressive loss of the optical components of the photoreceptorsegment junction layers (IS/OS) are labeled. (Top right) Reducecotoma with reduced foveal sensitivity of 18 dB (normal >34 dight) Fundus-guided microperimetry using a white backgrouensitivities by 1 to 2 log units in the central 2 degrees. Similaultifocal electroretinographic first-order response densities ar
mune reactions against retinal cells may, in some cases,
AMERICAN JOURNAL OF766
contribute to or occur in response to the development ofAZOOR.
In conclusion, we have used AOSLO to image AZOORpatients, providing high-resolution montages of the centralretina. Adaptive optics provide a sensitive measure of
eye. (Top left) The composite AOSLO image, which spansed on an infrared (IR) SLO fundus image. The AOSLO imagepreferred retinal locus for fixation is superior to the anatomice AOSLO field have lower density than normal (black circles).e AOSLO montage. The lower left inset over the foveal center
tent with retinal pigment epithelial (RPE) cells. A detail of thee transition from absence to presence of regular cone mosaics,y green line on the IR fundus image) indicates disruption andla along with thinning of the outer nuclear layer. (Bottom left)of the IS/OS junction and outer segment layer, indicating
he macula. External limiting membrane (ELM) and inner/outerual acuity of 20/200 corresponds to a 4-degree-diameter centralTop right) RPE depigmentation is present in the fovea. (Centernd a white Goldmann III 200 ms stimulus shows reduced
ults were observed in the left eye (not shown). (Bottom right)uced in the central 5 to 10 degrees.
rightmposTheof thon thnsiss thted b
maculossin t
d visB). (nd a
r rese red
macular cone structure in normal subjects,16 and in
OPHTHALMOLOGY APRIL 2012

AZOOR patients AOSLO was used to demonstrate pho-toreceptor structure in regions of vision loss that weremanifested as a normal mosaic of cones, regions of cone
loss, and alteration in cone structure. This study is the first2006;47(5):2080 –2092.
1
1
1
1
1
1
1
2
2
2
2
2
RETINAL STRUCTURE IN ACUTE ZONAVOL. 153, NO. 4
to measure in vivo cone spacing and to image rods inAZOOR patients. We report retinal heterogeneity insubjects diagnosed with AZOOR based on direct visual-
ization of photoreceptors in living retina.ALL AUTHORS HAVE COMPLETED AND SUBMITTED THE ICMJE FORM FOR DISCLOSURE OF POTENTIAL CONFLICTS OFInterest. Publication of this article was supported by Foundation Fighting Blindness, Columbia, Maryland; Research to Prevent Blindness, New York,New York; Hope for Vision, Washington, D.C.; That Man May See, Inc., San Francisco, California; and National Institute of Health, (Bethesda,Maryland) grants EY014375, EY002162, 1 P30 EY12576-6, NIH K12 EY017269, NIH T35 EY007139-16.. Austin Roorda holds a patent (US Patent# 7118216) for adaptive optics scanning laser ophthalmoscopy technology. Brandon Lujan is a consultant for Carl Zeiss Meditec, AG and Genentech,Inc. Involved in design and conduct of the study (A.R., B.L., J.L.D.); collection, management, analysis, and interpretation of the data (M.M., B.J.L.,D.M., C.E.T., A.R., J.L.D.); and preparation, review, and approval of the manuscript (M.M., B.L.J., C.E.T., A.R., J.L.D.). Research procedures adheredto the tenets of the Declaration of Helsinki. The study protocol was approved prospectively by the institutional review boards of the University ofCalifornia, San Francisco; the University of California, Berkeley; and the University of California, Davis. All subjects gave written informed consentbefore participation in the studies, and the work was HIPAA-compliant. The trial was registered on www.clinicaltrials.gov as NCT00254605. Theauthors thank David Birch, Retina Foundation of the Southwest, Dallas, Texas for guidance on dark- and light-adapted 2-color microperimetry protocoldevelopment. The authors also thank Carl Jacobsen, UC Berkeley School of Optometry, Berkeley, California for sharing his clinical findings on Patient 3.
REFERENCES
1. Gass JD, Agarwal A, Scott IU. Acute zonal occult outerretinopathy: a long-term follow-up study. Am J Ophthalmol2002;134(3):329–339.
2. Jacobson SG, Morales DS, Sun XK, et al. Pattern of retinaldysfunction in acute zonal occult outer retinopathy. Oph-thalmology 1995;102(8):1187–1198.
3. Francis PJ, Marinescu A, Fitzke FW, Bird AC, Holder GE.Acute zonal occult outer retinopathy: towards a set ofdiagnostic criteria. Br J Ophthalmol 2005;89(1):70–73.
4. Jampol LM, Becker KG. White spot syndromes of the retina:a hypothesis based on the common genetic hypothesis ofautoimmune/inflammatory disease. Am J Ophthalmol 2003;135(3):376–379.
5. Zibrandtsen N, Munch IC, Klemp K, Jorgensen TM, SanderB, Larsen M. Photoreceptor atrophy in acute zonal occultouter retinopathy. Acta Ophthalmol 2008;86(8):913–916.
6. Li D, Kishi S. Loss of photoreceptor outer segment in acutezonal occult outer retinopathy. Arch Ophthalmol 2007;125(9):1194–1200.
7. Spaide RF, Koizumi H, Freund KB. Photoreceptor outersegment abnormalities as a cause of blind spot enlargementin acute zonal occult outer retinopathy-complex diseases.Am J Ophthalmol 2008;146(1):111–120.
8. Fujiwara T, Imamura Y, Giovinazzo VJ, Spaide RF. Fundusautofluorescence and optical coherence tomographic findingsin acute zonal occult outer retinopathy. Retina 2010;30(8):1206–1216.
9. Liang J, Williams DR, Miller DT. Supernormal vision andhigh-resolution retinal imaging through adaptive optics. JOpt Soc Am A Opt Image Sci Vis 1997;14(11):2884–2892.
10. Roorda A, Romero-Borja F, Donnelly W III, Queener H,Hebert T, Campbell M. Adaptive optics scanning laserophthalmoscopy. Opt Express 2002;10(9):405–412.
11. Carroll J, Neitz M, Hofer H, Neitz J, Williams DR. Func-tional photoreceptor loss revealed with adaptive optics: analternate cause of color blindness. Proc Natl Acad Sci U S A2004;101(22):8461–8466.
12. Choi SS, Doble N, Hardy JL, et al. In vivo imaging of thephotoreceptor mosaic in retinal dystrophies and correla-tions with visual function. Invest Ophthalmol Vis Sci
3. Duncan JL, Zhang Y, Gandhi J, et al. High-resolutionimaging with adaptive optics in patients with inheritedretinal degeneration. Invest Ophthalmol Vis Sci 2007;48(7):3283–3291.
4. Roorda A, Zhang Y, Duncan JL. High-resolution in vivoimaging of the RPE mosaic in eyes with retinal disease.Invest Ophthalmol Vis Sci 2007;48(5):2297–2303.
5. Wolfing JI, Chung M, Carroll J, Roorda A, Williams DR.High-resolution retinal imaging of cone-rod dystrophy. Oph-thalmology 2006;113(6):1014–1019.
6. Yoon MK, Roorda A, Zhang Y, et al. Adaptive opticsscanning laser ophthalmoscopy images in a family with themitochondrial DNA T8993C mutation. Invest OphthalmolVis Sci 2009;50(4):1838–1847.
7. Talcott KE, Ratnam K, Sundquist SM, et al. Longitudinalstudy of cone photoreceptors during retinal degeneration andin response to ciliary neurotrophic factor treatment. InvestOphthalmol Vis Sci 2011;52(5):2219–2226.
8. Duncan JL, Talcott KE, Ratnam K, et al. Cone structure inretinal degeneration caused by mutations in the peripherin/RDS gene. Invest Ophthalmol Vis Sci 2011;52(3):1557–1566.
9. Marmor MF, Holder GE, Seeliger MW, Yamamoto S; Inter-national Society for Clinical Electrophysiology of Vision.Standard for clinical electroretinography (2004 update). DocOphthalmol 2004;108(2):107–114.
0. Marmor MF, Hood DC, Keating D, et al. Guidelines for basicmultifocal electroretinography (mfERG). Doc Ophthalmol2003;106:(2)105–115.
1. Rotenstreich Y, Fishman GA, Lindeman M, AlexanderKR. The application of chromatic dark-adapted kineticperimetry to retinal diseases. Ophthalmology 2004;111(6):1222–1227.
2. Jacobson SG, Voigt WJ, Parel JM, et al. Automated light-and dark-adapted perimetry for evaluating retinitis pigmen-tosa. Ophthalmology 1986;93(12):1604–1611.
3. Crossland MD, Luong VA, Rubin GS, Fitzke FW. Retinalspecific measurement of dark-adapted visual function: vali-dation of a modified microperimeter. BMC Ophthalmol2011;11:5.
4. Rodieck RW. The density recovery profile: a method for theanalysis of points in the plane applicable to retinal studies.
Vis Neurosci 1991;6(2):95–111.L OCCULT OUTER RETINOPATHY 767

2
3
3
3
25. Curcio CA, Sloan KR, Kalina RE, Hendrickson AE. Humanphotoreceptor topography. J Comp Neurol 1990;292(4):497–523.
26. de Smet MD, Bitar G, Mainigi S, Nussenblatt RB. HumanS-antigen determinant recognition in uveitis. Invest Oph-thalmol Vis Sci 2001;42(13):3233–3238.
27. Yoon YH, Cho EH, Sohn J, Thirkill CE. An unusual type ofcancer-associated retinopathy in a patient with ovariancancer. Korean J Ophthalmol 1999;13(1):43–48.
28. Forooghian F, Macdonald IM, Heckenlively JR, et al. Theneed for standardization of antiretinal antibody detectionand measurement. Am J Ophthalmol 2008;146(4):489 –
495.AMERICAN JOURNAL OF768
9. Adamus G, Wilson DJ. The need for standardization ofantiretinal antibody detection and measurement. Am JOphthalmol 2009;147(3):557
0. Fine HF, Spaide RF, Ryan EH Jr, Matsumoto Y, YannuzziLA. Acute zonal occult outer retinopathy in patients withmultiple evanescent white dot syndrome. Arch Ophthalmol2009;127(1):66–70.
1. Roorda A, Williams DR. Optical fiber properties of individ-ual human cones. J Vis 2002;2(5):404–412.
2. Srinivasan VJ, Monson BK, Wojtkowski M, et al. Charac-terization of outer retinal morphology with high-speed,ultrahigh-resolution optical coherence tomography. Invest
Ophthalmol Vis Sci 2008;49(4):1571–1579.OPHTHALMOLOGY APRIL 2012

Biosketch
Marianna Mkrtchyan, OD, practices at Kagan Institute in Los Angeles, California. She received a BS with departmentalhonors in molecular, cell, and developmental biology from University of California, Los Angeles in 2004, and an OD fromUniversity of California, Berkeley with clinic and research honors in 2011. Before entering graduate school, she workedat UCLA studying stem cells in Drosophila and co-authored article publications in Nature and in Developmental GenesEvolution. Her interests are in clinical research.
RETINAL STRUCTURE IN ACUTE ZONAL OCCULT OUTER RETINOPATHYVOL. 153, NO. 4 768.e1