Embed Size (px)
Citation preview

Copyright 2003, Offshore Technology Conference This paper was prepared for presentation at the 2003 Offshore Technology Conference held in Houston, Texas, U.S.A., 5–8 May 2003. This paper was selected for presentation by an OTC Program Committee following review of information contained in an abstract submitted by the author(s). Contents of the paper, as presented, have not been reviewed by the Offshore Technology Conference and are subject to correction by the author(s). The material, as presented, does not necessarily reflect any position of the Offshore Technology Conference or its officers. Electronic reproduction, distribution, or storage of any part of this paper for commercial purposes without the written consent of the Offshore Technology Conference is prohibited. Permission to reproduce in print is restricted to an abstract of not more than 300 words; illustrations may not be copied. The abstract must contain conspicuous acknowledgment of where and by whom the paper was presented.
Abstract The petrophysical properties characteristic of the sands prone to shallow water flow (SWF) make them identifiable due to their abnormally high Vp/Vs ratios compared to the adjacent rocks. The Vp/Vs inversion procedure identifies anomalies that could be related to SWF sands and it is based on seismic inversion of multicomponent seismic data. The new approach for estimating the Vp/Vs ratio from multicomponent seismic data was evaluated on synthetic logs where the estimated Vp/Vs ratios matched very well the real values. For real ocean bottom cable data (OBC) from GOM, the Vp/Vs inversion procedure was used to estimate Vp/Vs sections that showed clear anomalies that could be related to sand bodies responsible for SWF. These sections are useful for identifying high Vp/Vs ratio zones and could be used to plan a drilling program to prevent SWF during perforation. Preliminary analyses indicate that the methodology has the potential of being a direct hydrocarbon indicator (DHI) as well.
Introduction In the last few years prospecting for hydrocarbon in deepwater has increased enormously. With these new plays, new problems have emerged. Several articles have been written to describe the new “geohazards” in deep-water projects.
The most dangerous geohazard during drilling operations is known as Shallow Water Flow (SWF). It has been defined as water flowing to the ocean floor on the outside of structural casing (Alberty, 2001). This flowing water can erode the structural support of the well and lead to casing buckling and subsequent casing failure. This flow path can also compromise wellbore integrity, which can result in the loss of well control. SWF typically occurs when overpressured sandy zones are penetrated and shallow casing is not bonded to the formation. When overpressured sands occur, the appropriate drilling technology should be used to prevent losses and future remediation requiring additional expenditures. However, the prediction of such sands is required to plan appropriately the option that will control and/or prevent shallow water flows.
Interpretation of two-dimensional and three-dimensional high-resolution seismic data is becoming the most used technology for identification of geohazards. However, this method is not a direct indicator of SWF sands. It has been hypothesized (Huffman and Castagna, 2000) that unconsolidated sands that flow during drilling operations have abnormally high Vp/Vs ratios. The use of multicomponent seismic data, previously recorded for petroleum exploration purposes, is used in this project to recognize shallow Vp/Vs ratio anomalies. A methodology that can be used as a direct indicator of overpressured sands, and presents the derived high-resolution Vp/Vs sections for a test line located in deep water in the Gulf of Mexico is described. It has been developed to identify potential Shallow Water Flows sands, however, it could be implemented in hydrocarbon prospecting. This new methodology, based on the appropriate processing and interpretation of pre-stack and post-stack multicomponent seismic data has the potential to be a direct hydrocarbon indicator (DHI) tool more powerful than AVO analysis. We will hereafter refer to the
OTC Paper Number 15248
The Vp/Vs Inversion Procedure: A Methodology for Shallow Water Flow (SWF) Prediction from Seismic Analysis of Multicomponent Data. Carlos Moreno* / The University of Oklahoma, John Castagna / The University of Oklahoma, Alan Huffman / Fusion Petroleum Technologies, and Allen Bertagne / PGS Reservoir Consultants, Inc.

2 [C. Moreno, J. Castagna, A. Huffman and A. Bertagne] [Paper 15248]
methodology described as the “Vp/Vs Inversion Procedure”, as it is designed to estimate the Vp/Vs ratio at the seismic scale. It is hoped that such inversion will help to determine possible abnormal zones associated with the Shallow Water Flow phenomena. Petrophysical Basis of Unconsolidated Sands According to Alberty (2001) the “geohazard” known as Shallow Water Flow (SWF) has been defined as water flowing to the ocean floor on the outside of structural casing. This flowing water can erode the structural support of the well and lead to casing buckling and subsequent casing failure. This flow path can also compromise wellbore integrity, which can result in loss of well control. It is the geohazard most difficult to control in deepwater operations in the Gulf of Mexico. SWF typically occurs when the overpressured sandy zones are penetrated and a poor cement job is done (casing is not bonded to the formation). Unconsolidated water bearing sands, with abnormal high pressure, are responsible for the SWF problem. Huffman and Castagna (2001) stated that SWF has been observed in water depths from 1500 to 7000 ft between the seabed and 4000 feet below the mudline. The unique conditions where these sands are found make them virtually unconsolidated with very high porosities and very low effective stresses. The range of confining pressure and effective pressure for these sands can be estimated to be between 700-6500 psi and 0-1000 psi respectively.
According to Huffman and Castagna (2000), in addition to the change in compaction state for deepwater sediments, the severity of SWF may be exacerbated by the presence of structural hyperpressuring, also known as the centroid effect (Traugott and Heppard, 1994). The concept of structural hyperpressuring suggests that a sand body that has been positioned on a structure or slope will develop a pressure gradient that is hydrostatic, even though the gradient in the surrounding sediments are non-hydrostatic. This effect produces a condition where the up- dip limb of a sand body with large areal extent may have pore pressures that are much higher than the surrounding shales, and can even approach the fracture gradient. Depositional Environment for SWF Sands Huffman and Castagna (2000), summarize the deposition and burial process of SWF sands as follows: 1. Sands and shales are deposited on the seabed in a form that resembles a slurry more than a rock; 2. As the materials are buried, they begin to deviate from the Wood’s equation and become load-bearing materials with a granular frame that develops rigidity. The porosity
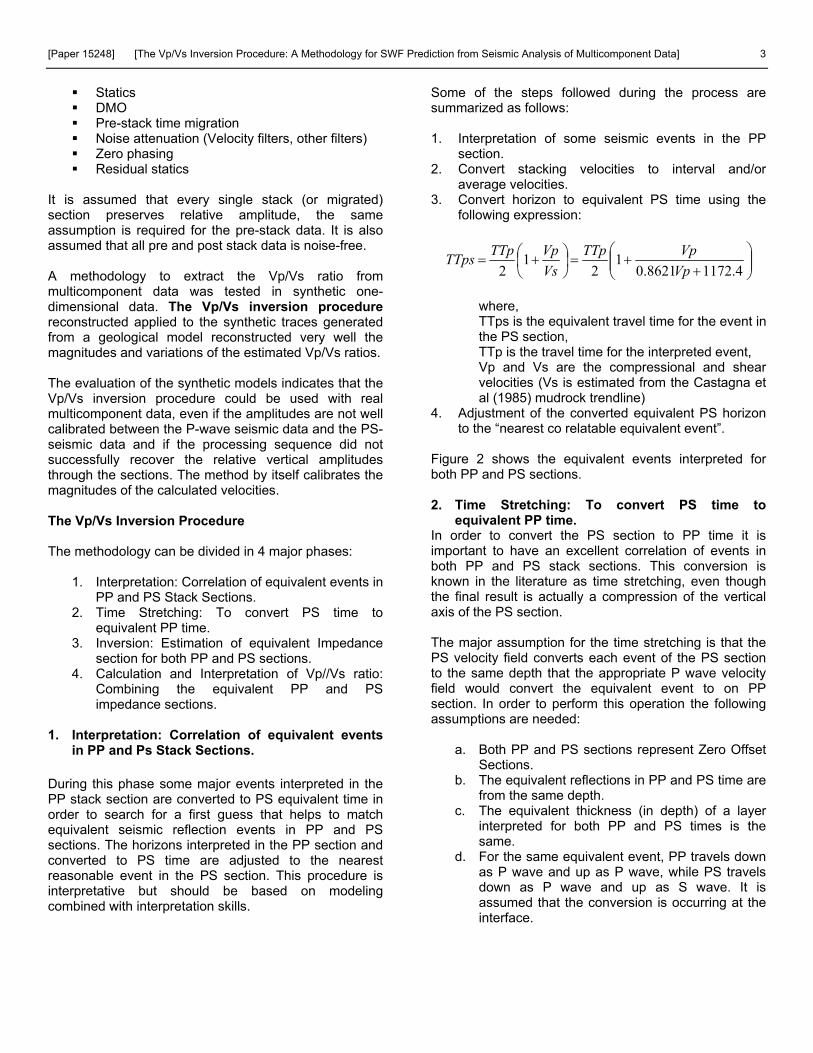
point where sediments begin to behave like load-bearing framework solids is termed the “critical porosity” (Marion and Nur, 1989; Marion et al., 1992; Dvorkin and Nur, 1996; Nur et al., 1998; Wempe and Mavko, 2001). This change in behavior is an important transition because it also signals the point where the effective stress becomes non-zero in value. 3. As effective stress increases, compaction causes the porosity to decrease and the material becomes more rock-like in its behavior. However, the slower rate of increase in the effective stress in deep water conditions also causes the rate of compaction to decrease, causing these materials to have a relatively higher porosity than materials at the same depth below sea level located at shallow water. Depositional Environment for SWF Sands Huffman and Castagna (2000) demonstrated that at the depositional conditions for SWF sands modest changes in compressional velocity occur with pore pressure changes. However, small changes in pore pressure will cause large changes in shear wave velocity as the material moves very close to the critical porosity. Under this condition the rigidity, or shear strength, of the material rapidly approaches zero. The combination of these two predictions suggests that the Vp/Vs ratio of these sands may change dramatically under small load changes. Figure 1 compares this effect for clean sands and shaly sands. Notice that the lower the effective pressure is, the greater the difference between the Vp/Vs ratio for clean sands and the Vp/Vs ratio for shaly sand. Also observe that the shaly sand shown in the graph contains only 8% shale. Extracting Rock Properties from Seismic Amplitudes Mapping the physical structure and properties of the subsurface of the earth using measurements made on the surface of the earth is possible throughout geophysical inversion. It is obvious that with real seismic data not only the frequency content and the noise affect the inversion results. There is an important effect of the processing sequence used. A suitable processing sequence that preserves relative amplitudes in the section is required for both pre-stack and post-stack inversion. A conventional sequence designed to preserve relative amplitudes included but not limited to some of the following steps:
Amplitude compensation (offset and decay) Predictive deconvolution
[Paper 15248] [The Vp/Vs Inversion Procedure: A Methodology for SWF Prediction from Seismic Analysis of Multicomponent Data] 3
Statics DMO Pre-stack time migration Noise attenuation (Velocity filters, other filters) Zero phasing Residual statics
It is assumed that every single stack (or migrated) section preserves relative amplitude, the same assumption is required for the pre-stack data. It is also assumed that all pre and post stack data is noise-free. A methodology to extract the Vp/Vs ratio from multicomponent data was tested in synthetic one-dimensional data. The Vp/Vs inversion procedure reconstructed applied to the synthetic traces generated from a geological model reconstructed very well the magnitudes and variations of the estimated Vp/Vs ratios. The evaluation of the synthetic models indicates that the Vp/Vs inversion procedure could be used with real multicomponent data, even if the amplitudes are not well calibrated between the P-wave seismic data and the PS- seismic data and if the processing sequence did not successfully recover the relative vertical amplitudes through the sections. The method by itself calibrates the magnitudes of the calculated velocities. The Vp/Vs Inversion Procedure The methodology can be divided in 4 major phases:
1. Interpretation: Correlation of equivalent events in PP and PS Stack Sections.
2. Time Stretching: To convert PS time to equivalent PP time.
3. Inversion: Estimation of equivalent Impedance section for both PP and PS sections.
4. Calculation and Interpretation of Vp//Vs ratio: Combining the equivalent PP and PS impedance sections.
1. Interpretation: Correlation of equivalent events
in PP and Ps Stack Sections.
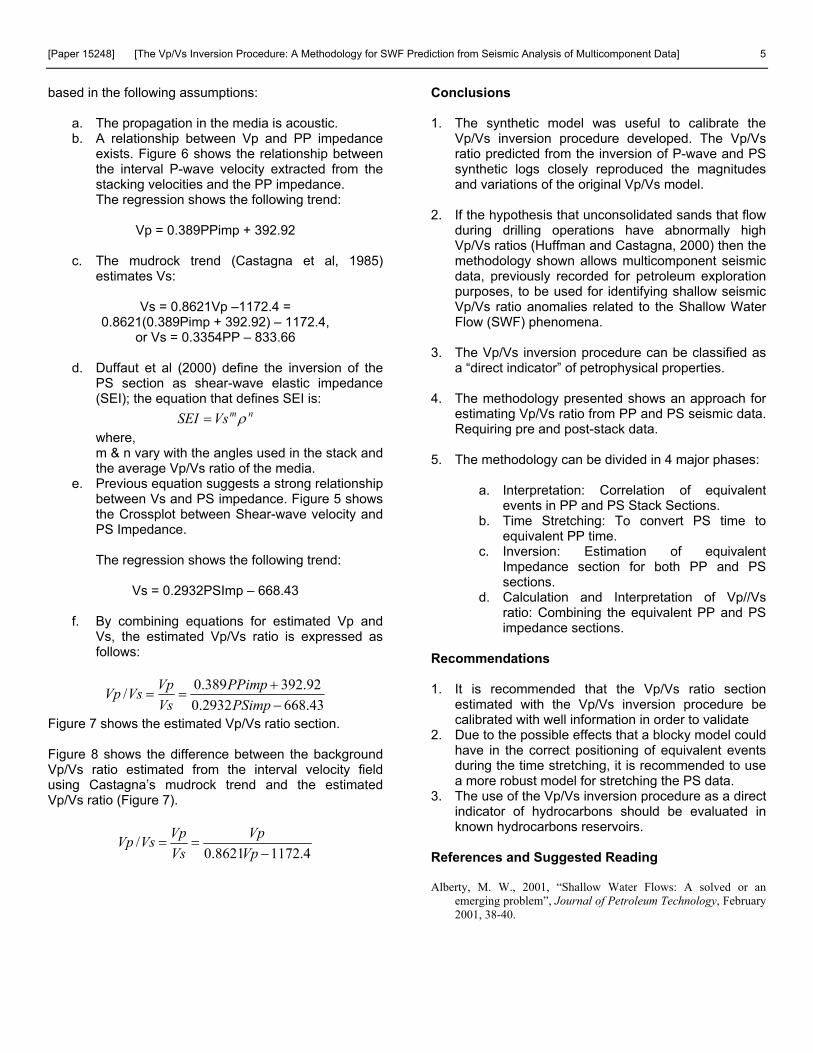
During this phase some major events interpreted in the PP stack section are converted to PS equivalent time in order to search for a first guess that helps to match equivalent seismic reflection events in PP and PS sections. The horizons interpreted in the PP section and converted to PS time are adjusted to the nearest reasonable event in the PS section. This procedure is interpretative but should be based on modeling combined with interpretation skills.
Some of the steps followed during the process are summarized as follows: 1. Interpretation of some seismic events in the PP
section. 2. Convert stacking velocities to interval and/or
average velocities. 3. Convert horizon to equivalent PS time using the
following expression:
+
+=
+=
4.11728621.01
21
2 VpVpTTp
VsVpTTpTTps
where, TTps is the equivalent travel time for the event in the PS section, TTp is the travel time for the interpreted event, Vp and Vs are the compressional and shear velocities (Vs is estimated from the Castagna et al (1985) mudrock trendline)
4. Adjustment of the converted equivalent PS horizon to the “nearest co relatable equivalent event”.
Figure 2 shows the equivalent events interpreted for both PP and PS sections. 2. Time Stretching: To convert PS time to
equivalent PP time. In order to convert the PS section to PP time it is important to have an excellent correlation of events in both PP and PS stack sections. This conversion is known in the literature as time stretching, even though the final result is actually a compression of the vertical axis of the PS section. The major assumption for the time stretching is that the PS velocity field converts each event of the PS section to the same depth that the appropriate P wave velocity field would convert the equivalent event to on PP section. In order to perform this operation the following assumptions are needed:
a. Both PP and PS sections represent Zero Offset Sections.
b. The equivalent reflections in PP and PS time are from the same depth.
c. The equivalent thickness (in depth) of a layer interpreted for both PP and PS times is the same.
d. For the same equivalent event, PP travels down as P wave and up as P wave, while PS travels down as P wave and up as S wave. It is assumed that the conversion is occurring at the interface.

4 [C. Moreno, J. Castagna, A. Huffman and A. Bertagne] [Paper 15248]
e. There are no peg legs, etc. Some of the steps followed during the process are summarized as follows:
a. Calculation of the interval Vp/Vs ratio. The interval Vp/Vs ratio is estimated using the following expression:
12/ −∆∆
=TTppTTpsVsVp
where, ∆TTps and ∆TTpp are the interval travel time
between the two horizons for PS and PP where we are interested on estimating the Vp/Vs ratio (Vp/Vs). Figure 3 shows the interval Vp/Vs ratio estimated.
b. Calculation of the PS velocity field.
)/1/(2 sVVpVpVps += where, Vp/Vs is estimated and Vp is the P wave velocity
field to be used for the time to depth conversion of the PP section. Time to depth conversion of PS section, using the Vps velocity field estimated.
c. Depth to time conversion of PS section in depth,
using the Vp velocity field. The process of stretching the PS section to PP time does not produce any effect in the amplitudes; however, it changes considerably the frequency content of the section. At this point it is recommended to balance the frequency content and the phase of both PP and PS sections. The filter designed tries to preserve the maximum frequency common for both sections. 3. Inversion: Estimation of equivalent Impedance
section for both PP and PS sections. Due to the lack of well log information, pre-stack inversion was useful to create “pseudo impedance logs” for both PP and PS datasets. These “pseudo impedance logs” were used to guide the post stack inversion. The following sequence was used to prepare the selected gathers for the pre-stack inversion: For PP data:
a. Preprocessing: geometry, gain, trace editing, deconvolution, statics, NMO, etc*.
b. Selection of every 100 CDP’s (Same locations for PP and PS data).
c. Bandpass filter: 8-10-80-100. d. Top mute, in order to mute first arrivals. e. Radon Filter f. Maximum offset limited to 200 m.
For PS data:
a. Preprocessing: geometry, gain, trace editing, deconvolution, statics, CCP binning (to convert data to equivalent CDP position), NMO, etc*.
b. Selection of every 100 CDP’s (Same locations for PP and PS data).
c. Time Stretching d. Bandpass filter: 8-10-80-100. e. Top mute, in order to mute first arrivals. f. Radon filter g. Common Offset Stack: maximum offset limited
to 400 m, with output of 2 traces. 3.1. Pre-stack inversion
For each CDP location used for inversion, a velocity and a density log were created using the following criteria:
a. Extract interval velocity function in depth for the location: sample rate = 4 m.
b. Addion of a random number between (-100,100) to each sample of the velocity function.
c. Usage of Gardner equation to estimate density. Notice that at each CDP location the logs to be input in the pre-stack inversion, for both PP and PS data, will be identical. However, it is expected that the variations of the reflectivity series between PP and PS datasets will cause different output logs from the inversion. Figure 4 shows the input and output logs for the inversion of a CDP 3.2. Post-stack inversion: The logs used for the inversion of the PP and PS stacks were the estimated “pseudo impedance logs. Figure 5 shows the respective PP and PS inverted sections. 4. Calculation and Interpretation of Vp//Vs ratio:
Combining the equivalent PP and PS impedance sections.
The strategy used to calculate Vp/Vs ratio from the PP and PS impedance sections estimated in section 3.2 is
[Paper 15248] [The Vp/Vs Inversion Procedure: A Methodology for SWF Prediction from Seismic Analysis of Multicomponent Data] 5
based in the following assumptions:
a. The propagation in the media is acoustic. b. A relationship between Vp and PP impedance
exists. Figure 6 shows the relationship between the interval P-wave velocity extracted from the stacking velocities and the PP impedance. The regression shows the following trend:
Vp = 0.389PPimp + 392.92
c. The mudrock trend (Castagna et al, 1985)
estimates Vs:
Vs = 0.8621Vp –1172.4 = 0.8621(0.389Pimp + 392.92) – 1172.4,
or Vs = 0.3354PP – 833.66
d. Duffaut et al (2000) define the inversion of the PS section as shear-wave elastic impedance (SEI); the equation that defines SEI is:
nmVsSEI ρ= where, m & n vary with the angles used in the stack and the average Vp/Vs ratio of the media.
e. Previous equation suggests a strong relationship between Vs and PS impedance. Figure 5 shows the Crossplot between Shear-wave velocity and PS Impedance.
The regression shows the following trend:
Vs = 0.2932PSImp – 668.43
f. By combining equations for estimated Vp and Vs, the estimated Vp/Vs ratio is expressed as follows:
43.6682932.092.392389.0/
−+
==PSimp
PPimpVsVpVsVp
Figure 7 shows the estimated Vp/Vs ratio section. Figure 8 shows the difference between the background Vp/Vs ratio estimated from the interval velocity field using Castagna’s mudrock trend and the estimated Vp/Vs ratio (Figure 7).
4.11728621.0/
−==
VpVp
VsVpVsVp
Conclusions 1. The synthetic model was useful to calibrate the
Vp/Vs inversion procedure developed. The Vp/Vs ratio predicted from the inversion of P-wave and PS synthetic logs closely reproduced the magnitudes and variations of the original Vp/Vs model.
2. If the hypothesis that unconsolidated sands that flow
during drilling operations have abnormally high Vp/Vs ratios (Huffman and Castagna, 2000) then the methodology shown allows multicomponent seismic data, previously recorded for petroleum exploration purposes, to be used for identifying shallow seismic Vp/Vs ratio anomalies related to the Shallow Water Flow (SWF) phenomena.
3. The Vp/Vs inversion procedure can be classified as
a “direct indicator” of petrophysical properties. 4. The methodology presented shows an approach for
estimating Vp/Vs ratio from PP and PS seismic data. Requiring pre and post-stack data.
5. The methodology can be divided in 4 major phases:
a. Interpretation: Correlation of equivalent events in PP and PS Stack Sections.
b. Time Stretching: To convert PS time to equivalent PP time.
c. Inversion: Estimation of equivalent Impedance section for both PP and PS sections.
d. Calculation and Interpretation of Vp//Vs ratio: Combining the equivalent PP and PS impedance sections.
Recommendations 1. It is recommended that the Vp/Vs ratio section
estimated with the Vp/Vs inversion procedure be calibrated with well information in order to validate
2. Due to the possible effects that a blocky model could have in the correct positioning of equivalent events during the time stretching, it is recommended to use a more robust model for stretching the PS data.
3. The use of the Vp/Vs inversion procedure as a direct indicator of hydrocarbons should be evaluated in known hydrocarbons reservoirs.
References and Suggested Reading Alberty, M. W., 2001, “Shallow Water Flows: A solved or an
emerging problem”, Journal of Petroleum Technology, February 2001, 38-40.

6 [C. Moreno, J. Castagna, A. Huffman and A. Bertagne] [Paper 15248]
Buxton Latimer, R., and van Riel, P., 2000, “An interpreter’s guide to understanding and working with seismic-derived acoustic impedance data”: The Leading Edge, March 2000, 242-256.
Caldwell, J., 1999, “Marine multicomponent seismology”: The Leading Edge, November 1999, 1274-1282.
Campbell, K., 1999, “Deepwater geohazards: How significant are they?”: The Leading Edge, April 1999, 514-519.
Castagna, J.P. and Backus, M. M., 1993, Offset-Dependent Reflectivity- Theory and Practice of AVO Analysis, Investigation in Geophysics Series, Volume 8, SEG, 348 pages.
Castagna, J. P., Batzle, M. L., and Kan, T. K., 1993, “Rock Physics - The link between rock properties and AVO response”: in Castagna, J.P. and Backus, M. M., Offset-Dependent Reflectivity- Theory and Practice of AVO Analysis, SEG Publication.
Castagna, J. P., Batzle, M. L., and Eastwood, R. L., 1985, “Relationship between compressional-wave and shear-wave velocities in clastic silicate rocks”: Geophysics, 50, 571-581.
Connolly, P., 1999, “Elastic impedance”: The Leading Edge, April 1999, 438-452.
Connolly, P., 1998, “Calibration and Inversion of Non-Zero Offset Seismic”: SEG 1998, Expanded Abstracts.
Duffaut, K., Alsos, T., Landro, M., Rogno, H., and Al-Najjar, N. F., 2000, “Shear-wave elastic impedance”: The Leading Edge, November 2000, 1222-1229.
Dvorkin, J., and Nur, A., 1996, “Elasticity of high-porosity sandstones: Theory for two North Sea data sets”: Geophysics, 61, 1363-1370.
Ferguson, R. J., and Stewart, R. R., 1996, “Reservoir indication using Vp/Vs values derived from broad-band 3-C seismic data”: SEG 1996, Expanded Abstracts.
Fromyr, E., and Randazzo, S., 2000, “Four-Component Data for Imaging, Lithology Prediction, and Fluid Discrimination”: Journal of Petroleum Technology, July 2000, 24-25.
Gardner, G. H. F., Gardner, L. W., and Gregory, A. R., 1974, “Formation velocity and density: The diagnostic basis for stratigraphic traps”: Geophysics, 39, 770-780.
Huffman, A. R., and Castagna, J. P., 2000, “Shallow-Water-Flow Prediction From Seismic Analysis of Multicomponent Seismic Data”: Journal of Petroleum Technology, July 2000, 34-36.
Huffman, A. R., and Castagna, J. P., 2001, “The Petrophysical Basis for Shallow Water Flow Prediction Using Multicomponent Seismic Data”: The Leading Edge, September 2001, 1030-1035.
Lindsay, R., and Towner, B., 2001, “Pore pressure influence on rock property and reflectivity modeling”: The Leading Edge, February 2001, 184-187.
Marion, D., and Nur, A., 1989, “Percolation of electrical and elastic properties of granular materials at the transition from a suspension to a loose packing”: Physica, 157, 575-579.
Marion, D., Nur, A., Yin, H., and Han, D., 1992, “Compressional velocity and porosity in sand-clay mixtures”: Geophysics, 57, 554-562.
McCormack, M. D., Dunbar, J. A., and Sharp, W. W., 1984, “A case study of stratigraphic interpretation using shear and compressional seismic data”: Geophysics, 49, 509-520.
McCormack, M. D., Justice, M. G., and Sharp, W. W., 1985, “A stratigraphic interpretation of shear and compressional wave seismic data for the Pensylvanian Morrow formation of southeastern New Mexico”: AAPG Memoir 39, Seismic stratigraphy II, An integrated approach, 224-239.
Nur, A., Mavko, G., Dvorkin, J., and Galmudi, D., 1998, “Critical Porosity: A key to relating physical properties to porosity in rocks”: The Leading Edge, v. 17, n. 3: 357-362.
Pendrel, J., Stewart, R. R., and van Riel, P., 1999, “Interpreting sand channels from 3C-3D seismic inversions”: CSEG Recorder, March 199, 24-35.
Rogno, H., Kristensen, A., and Amundsen, L., 1999, “The Statfjord 3-D, 4-C OBC Survey”: The Leading Edge, November 1999, 1301-1305.
Russel, B. H., 1988, Introduction to seismic inversion methods: SEG Continuing Education Course Note Series, Volume 2, SEG.
Stump, B.B., Flemings, P.B., Feinbeiner, T., and M. D. Zoback, 1998, “Pressure differences between overpressured sands and bounding shales of the Eugene Island 330 Field (Offshore Louisiana, USA) with implications for fluid flow induced by sediment loading”: in Mitchell, A. and Grauls, D., editors, Overpressures in Petroleum Exploration, Memoire 22, Elf EP Editions, pp. 83-92.
Tatham, R. H., and Krug, E. H., 1985., Vp/Vs interpretation, in A. A. Fitch, Ed. Developments in geophysical exploration methods –6: Elsevier Science Publ. Co. Inc., 139-188.
Tatham, R. H., and McCormack, M. D., 1991, Multicomponent Seismology in Petroleum Exploration: Investigation in Geophysics Series, Volume 6, SEG, 248 pages.
Traugott, M. O., and Heppard, P.D., 1994, “Prediction of pore pressures before and after drilling- Taking the risk out of drilling overpressured prospects: Abnormal Pressures in Hydrocarbon Environments”; Petroleum Geologists Hedberg Conference, Golden CO, June 8-10, AAPG Bulletin.
Wang, S., Bancroft, J. C., and Lawton, D. C., 1996, “Converted-wave (P-SV) Prestack Migration and Migration Velocity Analysis”: SEG 1996, Expanded Abstracts.
Wempe, W., and Mavko, G., 2001, “Three distinct porosity domains defined physically, hydraulically, electrically, and elastically”: The Leading Edge, February 2001, 198-199.
Xiadong, Z., 1991, “Approximation to P-P, P-S, Sv-Sv and Sv-P reflections and transmissions”: SEG 1991, Expanded Abtracts.
Yilmaz, O., 2001, Seismic data analysis: processing, inversion, and interpretation of seismic data: Investigation in Geophysics Series, Volume 10, SEG, 2027 pages.
Acknowlegment PGS Reservoir provided the data for this project. Santi Randazzo (PGS) processed the seismic data. Seismic Inversion was performed at the School of Geology and Geophysics of The University of Oklahoma. Ray Brown, Mike Burnette, Mohamed Eissa, Bill Lamb, Jim Watson, and others from The University of Oklahoma provided technical input and important information to this project.
[Paper 15248] [The Vp/Vs Inversion Procedure: A Methodology for SWF Prediction from Seismic Analysis of Multicomponent Data] 7
Figure 1: Relation between Vp/Vs ratio and effective pressure. Clean sands (brown line) tend to have higher Vp/Vs ratio than shaly sands (black line). Modified from Huffman and Castagna (2001).
Figure 2: Correlation of major events. (Left) P-wave section, (Rigth) PS section.

8 [C. Moreno, J. Castagna, A. Huffman and A. Bertagne] [Paper 15248]
Figure 3: Interval Vp/Vs ratio estimated from the interpretation.
Figure 4: Left: Random impedance serie created. Rigth: After GLI inversion log, synthetic seismogram matches very well with real data at that CDP location.

[Paper 15248] [The Vp/Vs Inversion Procedure: A Methodology for SWF Prediction from Seismic Analysis of Multicomponent Data] 9
Figure 5: Impedance section for P wave Seismic Data (Top) and Converted Wave Seismic Data (Bottom).

10 [C. Moreno, J. Castagna, A. Huffman and A. Bertagne] [Paper 15248]
Figure 6: Crossplot between Impedance and Velocity. Top: P wave impedance and P wave velocity, and bottom Converted wave impedance and shear wave velocity. Best fit regressions shows the relations used to estimate Vp/Vs ratio.

[Paper 15248] [The Vp/Vs Inversion Procedure: A Methodology for SWF Prediction from Seismic Analysis of Multicomponent Data] 11
Figure 7: Estimated Vp/Vs ratio section. Abnormally high Vp/Vs ratios or blue and purple anomalies between 600 ms and 700 ms possibly indicating sand bodies responsibles of SWF.
Figure 8: Deviation in the estimated Vp/Vs ratio using seismic inversion procedures from background Vp/Vs using mud rock trend. Purple and red zones with abnormally high Vp/Vs relative to background, possibly indicating sand bodies responsibles of SWF.