Embed Size (px)
Citation preview

The
Journ
al o
f G
ener
al P
hys
iolo
gy
231
J. Gen. Physiol.
© The Rockefeller University Press
•
0022-1295/2004/03/231/17 $8.00Volume 123 March 2004 231–247http://www.jgp.org/cgi/doi/10.1085/jgp.200308946
Osmotic Properties of the Sealed Tubular Systemof Toad and Rat Skeletal Muscle
Bradley S. Launikonis
and
D. George Stephenson
Department of Zoology, La Trobe University, Bundoora, Victoria 3086, Australia
abstract
A method was developed that allows conversion of changes in maximum Ca
2
�
-dependent fluores-cence of a fixed amount of fluo-3 into volume changes of the fluo-3–containing solution. This method was thenapplied to investigate by confocal microscopy the osmotic properties of the sealed tubular (t-) system of toad andrat mechanically skinned fibers in which a certain amount of fluo-3 was trapped. When the osmolality of the myo-plasmic environment was altered by simple dilution or addition of sucrose within the range 190–638 mosmol kg
�
1
,the sealed t-system of toad fibers behaved almost like an ideal osmometer, changing its volume inverse proportion-ally to osmolality. However, increasing the osmolality above 638 to 2,550 mosmol kg
�
1
caused hardly any change int-system volume. In myoplasmic solutions made hypotonic to 128 mosmol kg
�
1
, a loss of Ca
2
�
from the sealed t-sys-tem of toad fibers occurred, presumably through either stretch-activated cationic channels or store-operated Ca
2
�
channels. In contrast to the behavior of the t-system in toad fibers, the volume of the sealed t-system of rat fiberschanged little (by
�
20%) when the osmolality of the myoplasmic environment changed between 210 and 2,800mosmol kg
�
1
. Results were also validated with calcein. Clear differences between rat and toad fibers were alsofound with respect to the t-system permeability for glycerol. Thus, glycerol equilibrated across the rat t-systemwithin seconds to minutes, but was not equilibrated across the t-system of toad fibers even after 20 min. These re-sults have broad implications for understanding osmotic properties of the t-system and reversible vacuolation inmuscle fibers. Furthermore, we observed for the first time in mammalian fibers an orderly lateral shift of the t-sys-tem networks whereby t-tubule networks to the left of the Z-line crossover to become t-tubule networks to the rightof the Z-line in the adjacent sarcomere (and vice versa). This orderly rearrangement can provide a pathway forlongitudinal continuity of the t-system along the fiber axis.
key words:
t-system • skeletal muscle • osmotic gradient • skinned fibers • glycerol
I N T R O D U C T I O N
In skeletal muscle it is well known that the transversetubular (t-) system supports the spread of excitationthrough individual muscle fibers (Melzer et al., 1995).Moreover, the t-system supports other major cellularfunctions such as membrane repair, water transport,and volume regulation (Krolenko and Lucy, 2001).
Importantly, this membrane system that opens to theoutside, is not a static entity, but a dynamic structure asvividly demonstrated with confocal microscopy tech-niques by processes such as reversible vacuolation (Kro-lenko et al., 1995; Lännergren et al., 1999, 2000) or vol-ume changes in response to changes in the membranepotential, cholesterol content, and osmotic pressure(Launikonis and Stephenson, 2002a).
When characterizing the properties of the t-systemwith respect to osmotic changes, there are advantagesto studying a closed t-system. This can be achieved bymechanically removing the surface membrane (sarco-
lemma) of a single muscle fiber, allowing the openingsof the t-system to the outside to seal off, forming a sepa-rate, closed, extracellular compartment (Stephensonand Lamb, 1993; Lamb et al., 1995; Launikonis andStephenson, 1999, 2001, 2002b; Launikonis et al.,2003). The ability of the t-system to continue to func-tion normally when sealed is shown by the preservationof t-system SR membrane protein coupling (Lamb andStephenson, 1990; Posterino et al., 2000; Launikonis etal., 2003; Ørtenblad and Stephenson, 2003). As thesealed t-system prevents the free movement of solutioninto and out of this network, it allows the opportunityto examine directly its osmotic properties in the ab-sence of the peripheral surface membrane (sarco-lemma). This is notable because there may be im-portant differences between the sarcolemma and thet-system, considering that they have different origins(Flucher et al., 1991). Such work separating the t-sys-tem from the surface membrane has been possible withdetubulated fibers, but in these preparations the prop-erties of the sarcolemma rather than those of the t-sys-tem were the central focus of investigation (Fujino et
Address correspondence to Bradley S. Launikonis at his present ad-dress: Department of Molecular Biophysics and Physiology, RushUniversity Medical Centre, 1750 W. Harrison St., Chicago, IL 60612.Fax: (312) 942-8711; email: [email protected]
Abbreviations used in this paper:
EDL, extensor digitorum longus; SOC,
store-operated Ca
2
�
-channel.
on October 21, 2015
jgp.rupress.orgD
ownloaded from
Published February 23, 2004

232
Osmotic Properties of the Sealed t-system
al., 1961; Eisenberg and Eisenberg, 1968; Gage andEisenberg, 1969). Here we are able to study the proper-ties of the t-system in the absence of the sarcolemmawith full experimental control over the myoplasmic en-vironment. We have already reported that the sealedt-system does not respond with reversible vacuolationwhen challenged with the rapid removal of glycerol(Launikonis and Stephenson, 2002b) as the intact t-sys-tem does (Krolenko et al., 1995) and in this study weexamine in detail the osmotic properties of the t-systemby changing the osmolality of the myoplasmic environ-ment with glycerol and sucrose.
M A T E R I A L S A N D M E T H O D S
Preparation of Muscle Fibers
The Animal Ethics and Experimentation Committee at La TrobeUniversity approved the use and killing method of all animals inthis study. Cane toads (Bufo marinus) or frogs (Rana pipiens)were stunned with a heavy blow to the head and killed by doublepithing. The iliofibularis muscles were dissected and well blottedon filter paper (Whatman No. 1) and then placed on a layer ofSylgard 184 (Dow Chemicals) in a Petri dish and immersed in alayer of paraffin oil. Male rats (Long Evans, hooded; 3-mo-old)were killed under deep anesthesia with halothane (2% vol/vol).The extensor digitorum longus (EDL) muscles were dissectedand similarly blotted and placed on a layer of Sylgard in a petridish under a layer of paraffin oil.
Fluorescent dyes (see below) were trapped in the sealed t-sys-tem as described previously (Launikonis and Stephenson, 1999,2001, 2002b). Briefly, single intact fibers (toad or frog) or iso-lated small bundles of fibers (rat) were administered a physiolog-ical solution containing fluorescent dye (see below) with a micro-cap (Drummond) while still under oil. The excess solution wasthen removed from around the fibers, which were then mechani-cally skinned thus trapping the fluorescent dye in the t-system asit sealed off during the “skinning” procedure (Launikonis andStephenson, 2001). Skinned fibers were then transferred to cus-tom-built experimental wells, which used a thin coverslip as abase. Preparations were secured to the bottom of experimentalwells with pins glued parallel to the coverslip surface to reducethe distance between the preparation and the objective lensabove which they were placed. Unless otherwise specified, thewell contained a standard myoplasmic K
�
solution (see below).
Solutions
The “dye” solutions were physiological solutions containing oneof three fluorescent dyes: fluo-3 (pentaammonium salt), Oregongreen and calcein; all from Molecular Probes. The fluo-3 solu-tions contained (mM): NaCl, 112; KCl, 3.3; MgCl
2
, 1; CaCl
2
, 2.5;fluo-3, 1; and HEPES, 20 (pH 7.4 with NaOH) for toad fibers andNaCl, 145; KCl, 3; CaCl
2
, 4; MgCl
2
, 2; fluo-3, 1; and HEPES, 10(pH 7.4 with NaOH) for rat fibers. Note that the ionized [Ca
2
�
]in the fluo-3 solutions for toad and rat were close to 1.5 and3 mM, respectively, which would ensure effective saturation(
�
99%) of fluo-3 provided that [Ca
2
�
] in the t-system does notdecrease below
�
100
�
M under the conditions of the experi-ments undertaken in this study. The Oregon green solutionswere the same as the fluo-3 solutions except that fluo-3 was re-placed by Oregon green. Calcein solutions were similar to thefluo-3 solutions containing (mM): NaCl, 115; KCl, 4.2; CaCl
2
, 2.1;MgCl
2
, 0.9; HEPES, 8.5; glucose, 8.5; calcein 8.5 (pH 7.2 with
NaOH) for amphibian fibers and NaCl, 135; KCl, 5; CaCl
2
, 2.5;MgCl
2
, 1; HEPES, 10; glucose 10; calcein 10 (pH 7.2 with NaOH)for rat fibers. The osmolalities of the “dye” solutions used withthe amphibian and rat muscle fibers were close to 255 and 290mosmol kg
�
1
, respectively.The standard myoplasmic solution in which the amphibian fi-
bers were incubated after mechanical skinning contained (mM):K
�
, 117; Na
�
, 36; HDTA, 49.5; free Mg
2
�
, 1; MgATP, 7 (total ATP,8); phosphocreatine, 10; NaN
3
, 1; HEPES, 60 with final pH 7.10and CaEGTA/EGTA, 0.5 with pCa (
�
log
10
[Ca
2
�
]) 6.7. In one ex-periment, a Na
�
myoplasmic solution was used, which was similarto the standard K
�
solution except that Na
�
replaced all the K
�
.For rat standard myoplasmic K
�
solution, [K
�
], [HEPES], and[CaEGTA/EGTA] were raised to 125, 90, and 1 mM, respectively,and total [Mg] was slightly adjusted to maintain 1 mM free Mg
2
�
.The amphibian and rat standard myoplasmic solutions had os-molalities of 255 and 280 momsmol kg
�
1
, respectively. Unlessotherwise indicated, the osmolality of myoplasmic solutions waschanged by simple dilution or by the addition of sucrose (Blinks,1965). In the myoplasmic solutions set at 2,550 and 2,800 mos-mol kg
�
1
with sucrose, the pCa was adjusted from 6.7 to
�
9 toprevent a contracture caused by Ca
2
�
release at this osmolality(Lamb et al., 1993). In some experiments, glycerol was added tothe myoplasmic solutions. The osmolality of all solutions was de-termined with a Vapor Pressure Osmometer (Wescor). All exper-iments were conducted at room temperature (23
�
1
�
C).
Confocal Imaging
Coverslips with dye (fluo-3 and Oregon green)-loaded prepara-tions were placed on the stage of an inverted Leitz laser (Ar ion;excitation wavelength 488 nm) scanning confocal microscopeand images were obtained with 40
(NA 1.3) or 63
(NA 1.4)oil immersion lenses as previously described in detail (Launiko-nis and Stephenson, 2001). Preparations were scanned in
X-Y
mode, averaging eight scans line
�
1
; all images were stored on anoptical disk for later analysis.
All experiments using calcein were performed in the labora-tory of Eduardo Ríos (Rush University Medical Center, Chicago).Fibers were prepared in the same manner as those loaded withfluo-3 and were imaged with the 40
(NA 1.2) water immersionlens of the MRC 1000 (Biorad Laboratories) confocal micro-scope (for microscope details see Ríos et al., 1999).
Image Analysis
Fluorescence images were analyzed with in-built confocal micro-scope software. Fluorescence intensity of the fiber, F
fiber
, was ob-tained by subtracting the background fluorescence intensity,F
min
, from the raw fluorescence intensity of the fiber. F
min
was de-rived from the fluorescence intensity of the nonfiber areas in theimage plane (see Fig. 2). At least 1,500 and 500 pixels were aver-aged to obtain F
fiber
and F
min
, respectively. The initial F
fiber
read-ing in each preparation (always in standard K
�
solution) was setto 100 arbitrary units (au) and all subsequent fluorescence mea-surements were expressed relative to this initial reading. Imagesfrom preparations loaded with fluo-3 are presented in greyscaleor the “glow” palettes while images from preparations loadedwith calcein are presented in the “blue/green/red/yellow” or“green-white linear” palettes.
Calibration of Volume Changes in the Sealedt-system Using Fluo-3
Fluo-3 is a high Ca
2
�
-affinity dye (K
app
�
10
6
M
�
1
under prevail-ing physiological ionic conditions above pH 6.8; Lattanzio, 1990;Thomas et al., 2000). Consequently, it is fully saturated with Ca
2
�
on October 21, 2015
jgp.rupress.orgD
ownloaded from
Published February 23, 2004

233
Launikonis and Stephenson
in the presence of mM Ca
2
�
in the environment under all condi-tions to be encountered in this study and also importantly, themaximum fluorescence intensity is not sensitive to pH changesabove 6.0 (Minta et al., 1989; Lattanzio, 1990; Harkins et al.,1993). Since fluo-3 carries three negative charges when com-plexed with Ca
2
�
, one would expect that the maximum fluores-cence intensity is sensitive to changes in ionic strength in the en-vironment. Indeed, as shown in Fig. 1, the maximum fluores-cence intensity of fluo-3 decreases as water is removed from atypical physiological Na-containing solution and increases whenthis solution is diluted. Therefore, a decrease in volume of thesealed t-system due to water loss will result in an increased ionicstrength and lower F
fiber
fluorescence intensity within the t-systemlumen and vice versa. Also importantly, the maximum Ca
2
�
-induced fluorescence intensity of fluo-3 does not appear to be af-fected by relatively large changes in viscosity and osmolality asso-ciated with molecules that are not electrically charged. Thus,there was no change in the fluo-3 fluorescence maximum (au)when 400 mM glycerol was added to the Na-based toad physio-logical solution containing 1 mM fluo-3 (100.0
�
6.1,
n
3; vs.105.1
�
9.9,
n
3; for control and glycerol containing solution,respectively;
t
test, P
�
0.5). These properties of fluo-3 make it anideal probe to calibrate volume changes in sealed and very nar-row extracellular spaces containing mM Ca
2
�
such as the sealedtubular system, based on ionic concentration–related changesin the maximum fluo-3 fluorescence intensity. Thus, volumechanges can be directly derived from changes in the maximumfluo-3 fluorescence intensity using a calibration curve with differ-ent volumes of water added to a constant mix of solutes mimick-ing the composition of the extracellular environment, providedthat the total amount of osmolites trapped in the sealed t-systemchanges little when the imbalance in osmolality across the t-sys-tem membrane is addressed by the flux of water across the t-sys-tem. Such a curve displaying the maximum fluo-3 fluorescenceintensity as function of volumes of water added to the above mixof solutes was obtained by imaging droplets of fluo-3 containingsolutions made from a 10-fold concentrated toad physiologicalsolution, which contained (mM): NaCl, 1120; KCl, 30; MgCl
2
, 10;CaCl
2
, 25; fluo-3, 10; and HEPES, 200 (pH 7.4 with NaOH). Forthis calibration, droplets of solutions at various dilutions wereput on coverslips and imaged with the 40
objective. This objec-tive samples with a pixel size of 0.245
0.245
0.5
�
m. The op-tical section was positioned in the region of the droplet that pro-duced the fluorescence maximum for the given conditions.Three separate spots within the droplet (fluorescing at the maxi-mum level) were recorded and averaged. Since the [fluo-3] var-ied between these solutions, the relative fluorescence intensityper pixel measured at each dilution of the concentrated physio-logical solution was scaled according to [fluo-3]. A control exper-iment where the [fluo-3] was varied in droplets of solution of thesame ionic composition showed a correlation coefficient
�
0.999between fluorescence intensity per pixel and [fluo-3] in solution.The relationship between maximum Ca
2
�
-induced fluo-3 fluores-cence and the water added (“volumes”) is shown in Fig. 1, whereone unit of volume represents the volume of water needed to ob-tain the standard toad physiological solution (i.e., the composi-tion of the sealed t-system in isotonic solution) and the corre-sponding fluorescence intensity has an arbitrary value of 100.
It was therefore essential that the absolute number of ions re-mained relatively constant in the sealed t-system over the courseof each experiment. To test this, two types of experiments wereperformed. In the first type of experiment F
fiber
fluorescence in-tensity was measured after skinned toad fiber preparations werefirst left to equilibrate in the standard myoplasmic solution, then5 min after the fiber transfer to an isosmotic solution where thestandard myoplasmic solution was diluted 25% with an isosmotic
sucrose solution and finally after the preparation was returned tothe initial standard myoplasmic solution for 5 min. The ratio be-tween F
fiber
in the isosmotic but 25% diluted standard myoplas-mic solution and the average value of the bracketed F
fiber
valuesin the standard myoplasmic solution was 0.98
�
0.02 (
n
3),which was not different from 1.0. This result shows that theremust be very small changes in the total amount of osmolites andionic concentration in the t-system over the period of observa-tion, even when the ionic composition of the myoplasmic envi-ronment was considerably changed, and that the marked in-crease in t-sys
vol
after exposure of the skinned fiber preparationto a standard myoplasmic solution diluted 25% with distilled wa-ter (Fig. 7, A and C) could not have been the result of markedchanges in the total amount of osmolites in the t-system. In thesecond type of experiment, mechanically skinned frog and rat fi-bers with calcein- or fluo-3–loaded t-system were placed in myo-plasmic solutions that were made 10-fold hyperosmotic with su-crose and the results obtained with the two different dyes werecompared. Note that as shown above, fluo-3 fluorescence is sensi-tive to changes in ionic strength, while calcein fluorescence is in-sensitive to changes in ionic strength but sensitive to volumechanges since it is a self-quenching dye (Jayaraman et al., 2001).As shown in
results
, there was complete agreement betweenthe fluo-3 and the respective calcein sets of data for both amphib-ian and rat fibers exposed for 5 min to a myoplasmic environ-ment made highly hypertonic with sucrose. This directly showsthat electrically charged osmolites could not have left the t-sys-tem in significant amounts over a 5-min period in the highly hy-perosmotic solution to disturb the tight relationship betweent-system volume and ionic concentration.
Effect of Glycerol on Fluo-3 Fluorescence fromthe Sealed t-system
We examined the effect of glycerol addition and rapid removalon the fluo-3 fluorescence signal emitted from the sealed t-sys-tem using a protocol based on that used to induce reversible vac-uolation in intact fibers with glycerol (Krolenko et al., 1995). Inthese experiments, an initial fluorescence measurement was
F
igure
1. Calibration curve showing the change in the maxi-mum Ca
2
�
-induced fluo-3 fluorescence intensity per pixel whenthe volume of water is altered for a constant amount of solutes cor-responding to the toad physiological solution when the water vol-ume added was 1.0 (see
materials and methods
). The methodof calibration is described in the text. The continuous line is afunction of type: y
�
(1
�
exp(
�
kx)), where
�
156 au; k
0.9735 volumes
�
1
, and r
0.999.
on October 21, 2015
jgp.rupress.orgD
ownloaded from
Published February 23, 2004
234
Osmotic Properties of the Sealed t-system
made by imaging the dye-loaded preparation in the presence ofstandard myoplasmic K
�
solution. Immediately after the initialreading, the standard solution was exchanged for standard solu-tion containing 0, 200, or 400 mM glycerol or 0, 100, or 200 mMsucrose (Fig. 8). The preparation was then imaged after 1, 5, and20 min after the solution exchange. Immediately after the imag-ing at 20 min, the standard solution containing glycerol or su-crose was exchanged for standard solution only. The preparationwas imaged at 1, 5, and 20 min after this exchange of solutions.These time points correspond to 21, 25, and 40 min after the ini-tial imaging of the preparation at the start of each experiment,respectively, and are presented as such in Fig. 11. In control ex-periments, only standard myoplasmic K
�
solution was used. Thesolution in the experimental well was changed at the same timepoints as in the glycerol/sucrose experiments. The exchange ofsolutions generally resulted in a small drop in fluorescence in-tensity emitted from the preparation, presumably by washingaway any dye that had leaked from the sealed t-system.
Analysis of Results
In the text, mean values
�
standard error are given;
n
is the num-ber of fibers. Student’s
t
-test was used to determine statistical sig-nificance (P) where appropriate. GraphPad software (Prism) wasused to fit data to various functions.
R E S U L T S
t-system Volume and Structure in Skinned Fibers
Fig. 2 shows confocal images of a skinned fiber fromtoad with fluo-3 trapped in the sealed t-system. Fig. 2 Ashows an image of a skinned fiber in standard myoplas-mic K
�
solution (255 mosmol kg
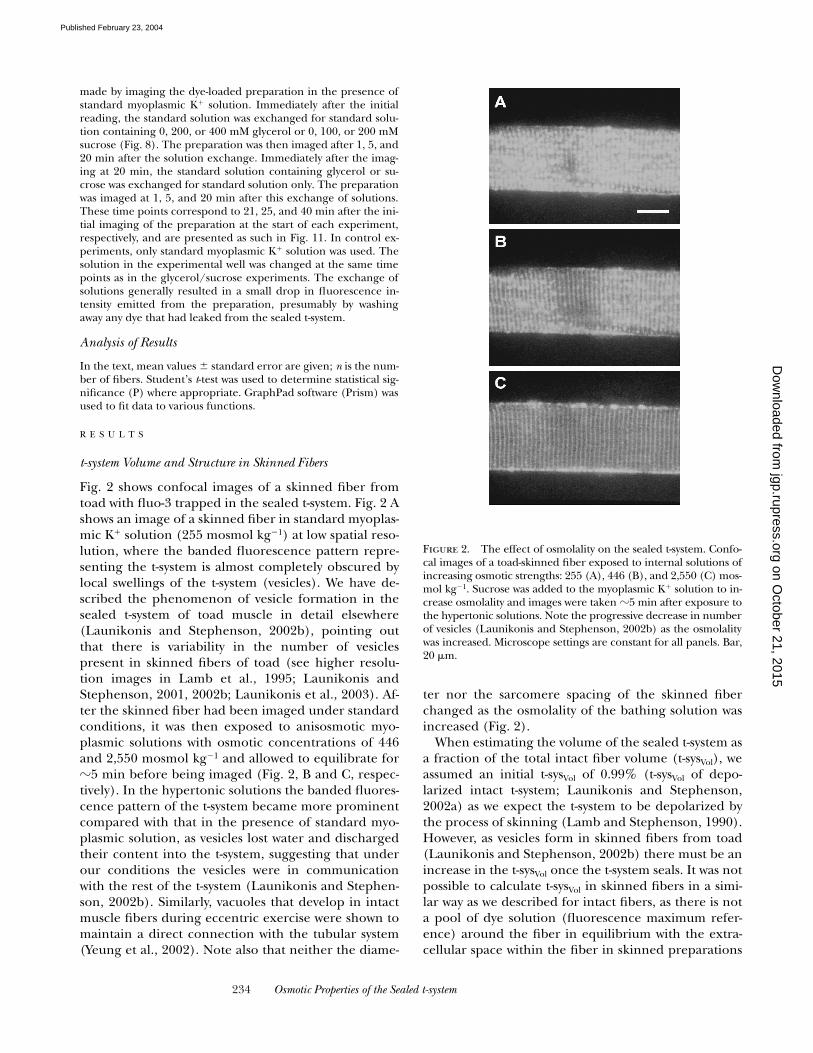
�1) at low spatial reso-lution, where the banded fluorescence pattern repre-senting the t-system is almost completely obscured bylocal swellings of the t-system (vesicles). We have de-scribed the phenomenon of vesicle formation in thesealed t-system of toad muscle in detail elsewhere(Launikonis and Stephenson, 2002b), pointing outthat there is variability in the number of vesiclespresent in skinned fibers of toad (see higher resolu-tion images in Lamb et al., 1995; Launikonis andStephenson, 2001, 2002b; Launikonis et al., 2003). Af-ter the skinned fiber had been imaged under standardconditions, it was then exposed to anisosmotic myo-plasmic solutions with osmotic concentrations of 446and 2,550 mosmol kg�1 and allowed to equilibrate for�5 min before being imaged (Fig. 2, B and C, respec-tively). In the hypertonic solutions the banded fluores-cence pattern of the t-system became more prominentcompared with that in the presence of standard myo-plasmic solution, as vesicles lost water and dischargedtheir content into the t-system, suggesting that underour conditions the vesicles were in communicationwith the rest of the t-system (Launikonis and Stephen-son, 2002b). Similarly, vacuoles that develop in intactmuscle fibers during eccentric exercise were shown tomaintain a direct connection with the tubular system(Yeung et al., 2002). Note also that neither the diame-
ter nor the sarcomere spacing of the skinned fiberchanged as the osmolality of the bathing solution wasincreased (Fig. 2).
When estimating the volume of the sealed t-system asa fraction of the total intact fiber volume (t-sysVol), weassumed an initial t-sysVol of 0.99% (t-sysVol of depo-larized intact t-system; Launikonis and Stephenson,2002a) as we expect the t-system to be depolarized bythe process of skinning (Lamb and Stephenson, 1990).However, as vesicles form in skinned fibers from toad(Launikonis and Stephenson, 2002b) there must be anincrease in the t-sysVol once the t-system seals. It was notpossible to calculate t-sysVol in skinned fibers in a simi-lar way as we described for intact fibers, as there is nota pool of dye solution (fluorescence maximum refer-ence) around the fiber in equilibrium with the extra-cellular space within the fiber in skinned preparations
Figure 2. The effect of osmolality on the sealed t-system. Confo-cal images of a toad-skinned fiber exposed to internal solutions ofincreasing osmotic strengths: 255 (A), 446 (B), and 2,550 (C) mos-mol kg�1. Sucrose was added to the myoplasmic K� solution to in-crease osmolality and images were taken �5 min after exposure tothe hypertonic solutions. Note the progressive decrease in numberof vesicles (Launikonis and Stephenson, 2002b) as the osmolalitywas increased. Microscope settings are constant for all panels. Bar,20 �m.
on October 21, 2015
jgp.rupress.orgD
ownloaded from
Published February 23, 2004

235 Launikonis and Stephenson
as there is in intact ones (Launikonis and Stephenson,2002a). To estimate the fraction of which regularlyshaped t-tubules and vesicles contribute to the overallt-sysVol in its sealed state we compared the average ofthe fluorescence intensity along four lines perpendicu-lar to the regularly shaped t-tubules (i.e., no vesicles)to the average fluorescence intensity along four ran-dom lines (through vesicles and regular t-tubules; aver-aging over 1,000 pixels) in images of the sealed t-sys-tem at high spatial resolution. We have previously pre-sented such images of the sealed t-system (Figs. 6, Aand E, Fig. 1 D, and Fig. 1 A in Launikonis andStephenson, 2001, 2002b, and Launikonis et al., 2003,respectively). In the presence of standard myoplasmicK� solution the ratio of the fluorescence intensity be-tween the random lines and those specifically throughregular t-tubules was 1.79 � 0.17 (n 9) and this ra-tio was not significantly different when measured inskinned fibers when the t-system was depolarized in thepresence of a myoplasmic Na� solution where all K� inthe standard myoplasmic solution was replaced withNa� (1.76 � 0.32, n 3; t test, P � 0.5). Therefore,with the assumption that the regularly shaped t-tubulesoccupy 0.99% fiber volume before skinning, we usedthe factor 1.79 to correct for the increase in t-sysVol dueto the formation of vesicles in the sealed t-system in thestandard myoplasmic solution (see Fig. 4). With theseassumptions, the isotonic t-sysVol in skinned fibers oftoad is 1.77% of intact fiber volume in physiological so-lution of normal tonicity.
In Fig. 3 is an image of the sealed t-system of a ratskinned fiber loaded with 10 mM calcein bathed instandard myoplasmic solution. In this image the closerriws of t-tubules border the Z-lines and at a certainpoint in the fiber, the t-tubule on the left of the Z-lines
moves to the right of the Z-lines in the adjacent sarco-meres (and vice versa). Furthermore, there appear tobe elements that connect the t-tubules that border theZ-lines at the point of sarcomere misregistration, aslarge vesicles form at these junctions. Such t-system ele-ments may not have the same rigid skeleton as the reg-ular t-system, thus making them more prone to swell-ing. This orderly lateral shift of the t-system networkswhereby t-tubule networks to the left of the Z-linescrossover to become t-tubule networks to the right of theZ-lines in the adjacent sarcomere (and vice versa) to-gether with tubular elements that connect the t-tubulenetworks that border the Z-lines can provide the mainpathway for longitudinal propagation of action poten-tials via t-system elements along the fiber axis, as shownpreviously by Posterino et al. (2000).
Other confocal images of skinned rat fiber with fluo-3trapped in the sealed t-system are shown in Fig. 4. Inthis particular case, the double rows of the t-tubulesthat border the Z-lines could not be resolved. The fiberwas first imaged in standard myoplasmic solution (280mosmol kg�1; Fig. 3 A) and then 5 min after the myo-plasmic solution was changed to one with an osmoticstrength of 480 mosmol kg�1 (Fig. 4 B). Note there islittle difference between the two images. Skinned EDLfibers of rat, in the most part, do not vesiculate uponskinning (although we do present some images hereshowing t-tubule swelling in isotonic solution), and wehave presented this evidence elsewhere (Launikonisand Stephenson, 2002b). As the t-sysVol of intact rat fi-bers is very similar to that of toad fibers, we assignedthe value of 0.99% to the sealed t-system of rat skinnedfibers, which corresponds to the depolarized t-sysVol inintact toad fibers, as we expect the t-system to be depo-larized upon skinning.
Figure 3. Confocal image of thesealed t-system of rat loaded with cal-cein showing the shift of t-tubules fromone sarcomere to an adjacent sarco-mere. The closer rows of t-tubules bor-der the Z-lines. Thus t-tubules to the leftof the Z-lines crossover at a point of sar-comere misregistration to becomet-tubules to the right of the Z-lines (atthe midline of this image) and viceversa. Bar, 5 �m.
on October 21, 2015
jgp.rupress.orgD
ownloaded from
Published February 23, 2004
236 Osmotic Properties of the Sealed t-system
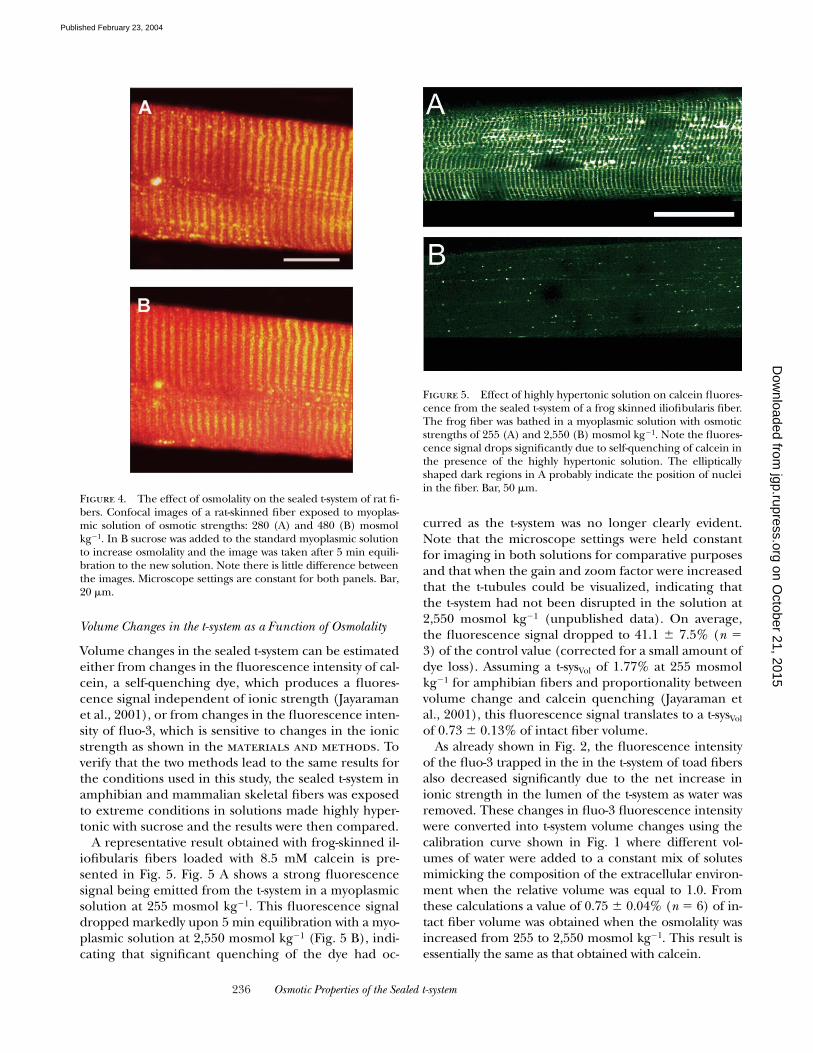
Volume Changes in the t-system as a Function of Osmolality
Volume changes in the sealed t-system can be estimatedeither from changes in the fluorescence intensity of cal-cein, a self-quenching dye, which produces a fluores-cence signal independent of ionic strength (Jayaramanet al., 2001), or from changes in the fluorescence inten-sity of fluo-3, which is sensitive to changes in the ionicstrength as shown in the materials and methods. Toverify that the two methods lead to the same results forthe conditions used in this study, the sealed t-system inamphibian and mammalian skeletal fibers was exposedto extreme conditions in solutions made highly hyper-tonic with sucrose and the results were then compared.
A representative result obtained with frog-skinned il-iofibularis fibers loaded with 8.5 mM calcein is pre-sented in Fig. 5. Fig. 5 A shows a strong fluorescencesignal being emitted from the t-system in a myoplasmicsolution at 255 mosmol kg�1. This fluorescence signaldropped markedly upon 5 min equilibration with a myo-plasmic solution at 2,550 mosmol kg�1 (Fig. 5 B), indi-cating that significant quenching of the dye had oc-
curred as the t-system was no longer clearly evident.Note that the microscope settings were held constantfor imaging in both solutions for comparative purposesand that when the gain and zoom factor were increasedthat the t-tubules could be visualized, indicating thatthe t-system had not been disrupted in the solution at2,550 mosmol kg�1 (unpublished data). On average,the fluorescence signal dropped to 41.1 � 7.5% (n 3) of the control value (corrected for a small amount ofdye loss). Assuming a t-sysVol of 1.77% at 255 mosmolkg�1 for amphibian fibers and proportionality betweenvolume change and calcein quenching (Jayaraman etal., 2001), this fluorescence signal translates to a t-sysVol
of 0.73 � 0.13% of intact fiber volume.As already shown in Fig. 2, the fluorescence intensity
of the fluo-3 trapped in the in the t-system of toad fibersalso decreased significantly due to the net increase inionic strength in the lumen of the t-system as water wasremoved. These changes in fluo-3 fluorescence intensitywere converted into t-system volume changes using thecalibration curve shown in Fig. 1 where different vol-umes of water were added to a constant mix of solutesmimicking the composition of the extracellular environ-ment when the relative volume was equal to 1.0. Fromthese calculations a value of 0.75 � 0.04% (n 6) of in-tact fiber volume was obtained when the osmolality wasincreased from 255 to 2,550 mosmol kg�1. This result isessentially the same as that obtained with calcein.
Figure 4. The effect of osmolality on the sealed t-system of rat fi-bers. Confocal images of a rat-skinned fiber exposed to myoplas-mic solution of osmotic strengths: 280 (A) and 480 (B) mosmolkg�1. In B sucrose was added to the standard myoplasmic solutionto increase osmolality and the image was taken after 5 min equili-bration to the new solution. Note there is little difference betweenthe images. Microscope settings are constant for both panels. Bar,20 �m.
Figure 5. Effect of highly hypertonic solution on calcein fluores-cence from the sealed t-system of a frog skinned iliofibularis fiber.The frog fiber was bathed in a myoplasmic solution with osmoticstrengths of 255 (A) and 2,550 (B) mosmol kg�1. Note the fluores-cence signal drops significantly due to self-quenching of calcein inthe presence of the highly hypertonic solution. The ellipticallyshaped dark regions in A probably indicate the position of nucleiin the fiber. Bar, 50 �m.
on October 21, 2015
jgp.rupress.orgD
ownloaded from
Published February 23, 2004

237 Launikonis and Stephenson
In rat fibers loaded with 10 mM calcein, there was lit-tle difference in the fluorescence signals when the os-molality was increased from 280 to 2,800 mosmol kg�1
(Fig. 6). In 2,800 mosmol kg�1 solution, the fluores-cence signal dropped to only 93.2 � 4.7% (n 4) ofthe control value after the small correction for dye loss.This translates to a reduction in t-sysVol to 0.92 � 0.05%,which is not different from the result obtained withfluo-3 (0.94 � 0.15% intact fiber volume; n 4).
Since the figures for both amphibian and rat t-systemvolume estimations in highly hypertonic myoplasmicsolutions were essentially the same with either calceinor with fluo-3 (0.73 � 0.13% vs. 0.75 � 0.04% intact fi-ber volume for amphibian fibers and 0.92 � 0.05% vs.0.94 � 0.15% intact fiber volume for rat fibers), onecan conclude that the two methods provide the sameresults. This validates the assumptions made for the useof fluo-3 to estimate volume changes in the t-system,namely that little change in the total amount of electri-cally charged osmolites occurs in the t-system over a5-min period even when subjected to very large osmotic
forces. Note, however, that the signal to noise ratio isgreater with 1 mM fluo-3 than with 8.5–10 mM calceinbecause there is a severalfold greater change in fluo-3fluorescence intensity (Fig. 1) than in calcein fluores-cence intensity (for calcein concentrations �10 mMthat do not greatly alter the ionic and osmotic composi-tion of the t-system under standard conditions; Jayara-man et al., 2001) with a change in volume over thesame volume range. Therefore, most volume changemeasurements in this study were made with fluo-3 (1mM) –loaded t-system.
As previously described (Launikonis and Stephen-son, 2002b), fluo-3 intensity from the sealed t-system intoad and rat fibers decreases gradually over time incontrol experiments with rate constants of 0.0066 and0.022 min�1, respectively (see e.g., Fig. 11 for toad fi-bers), due mainly to fluo-3 transport across the t-sys-tem (Launikonis and Stephenson, 2002b). This corre-sponds to a fluo-3 loss of 3.3 and 10%, respectively, af-ter 5 min. Fig. 7, A and B, shows the summarized datafor the change in the fluo-3 fluorescence intensity intoad and rat fibers after 5-min exposure to anisotonicsolutions and after the application of the small correc-tion due to fluo-3 transport across the t-system.
The t-system–related fluorescence intensity in toad fi-bers markedly decreased when the osmotic concentra-tion in the myoplasmic environment was increasedabove 255 mosmol kg�1 and increased when the osmo-lality of the myoplasmic environment was decreased by25% from 255 mosmol kg�1, consistent with water lossfrom the t-system and water entry into the t-system re-spectively (Fig. 7 A).
In contrast, there was only a very small decrease influorescence intensity when rat fibers were exposed tosolutions of increased osmolality (Fig. 7 B), althoughwhen exposed to solutions of lowered osmolality (210mosmol kg�1; 25% hypotonic) there was an increase inthe fluorescence signal, similar to that occurring intoad fibers (data not shown; see Fig. 10 B).
The relative fluorescence intensities of fluo-3–loadedtoad and rat fibers exposed for 5 min to anisotonic solu-tions are shown in Fig. 7, A and B, and these values wereconverted into t-sysVol values based on the calibrationcurve in Fig. 1 as described in materials and methodsafter correction for the small dye loss over 5 min (seeabove). The results for t-sysVol are shown in Fig. 7, C andD, assuming that the t-sysVol was 1.77 and 0.99% in thestandard myoplasmic solution for toad and rat fibers,respectively (see above). From Fig. 7 C one can observethat the t-sysVol of toad skinned fibers varied from2.32 � 0.02% (n 3) to 0.75 � 0.04% (n 6) of intactfiber volume over the range of osmolalities from 191 to2550 mosmol kg�1, respectively. Fig. 7 C also shows thatthe sealed t-system could not be compressed below�0.75% of the total intact fiber volume as the osmotic
Figure 6. Effect of highly hypertonic solution on calcein fluores-cence from the sealed t-system of a rat skinned fiber. The rat fiberwas bathed in a myoplasmic solution with osmotic strengths of 280(A) and 2800 (B) mosmol kg�1. There is little difference in thefluorescence signals in both images. Note the longitudinal connec-tions between the t-tubules. Bar, 10 �m.
on October 21, 2015
jgp.rupress.orgD
ownloaded from
Published February 23, 2004

238 Osmotic Properties of the Sealed t-system
concentration in the myoplasmic environment was in-creased for 5 min to 1,000 mosmol kg�1 and above. Ex-periments, where the skinned fibers were kept for up to20 min in highly hyperosmotic solutions with sucroseconfirmed that the t-system could not be compressedbelow 0.75 � 0.05% of total intact fiber volume.
After 5 min exposure to anisosmotic solutions, thet-sysVol of rat fibers varied only little from 1.12 � 0.04%(n 4) to 0.94 � 0.15% (n 4) of intact fiber volumeover the range of osmolalities from 210 to 2,800 mos-mol kg�1 (Fig. 7 D). Increasing the time of exposure tohighly hyperosmotic solutions for up to 20 min did notlead to further reductions in the estimated t-system vol-ume, suggesting that the sealed t-system of rat EDLmuscle fibers is relatively incompressible.
It was not possible to determine the response of therat sealed t-system to 50% hypotonic solution (140 mos-mol kg�1), as this solution caused a Ca2�-independentcontracture (Stephenson, 1993), which resulted in fiberdamage. Such a contracture did not occur in toad fibersexposed to 50% hypotonic solution. However, there wasa drop in the fluo-3 fluorescence signal in this solutionfrom toad fibers and this issue is addressed below.
50% Hypotonic Solutions Activate Ca2�-permeant Channels in Toad t-system
Fig. 1 predicts that an increase in t-system fluo-3 fluo-rescence should be observed if there is a net movement
of water into the t-system (increase in t-sysVol). This wasindeed the case when toad and rat fibers were placed inmyoplasmic solutions that were 25% hypotonic com-pared with the normal solutions (Fig. 7, A and B). How-ever, when the osmolality of the bathing solution wasdropped by 50% in toad fibers from 255 to 127.5 mos-mol kg�1, there was actually a decrease rather than anincrease in fluo-3 fluorescence intensity. This decreasecontinued over a period of 5 min (Fig. 8). Clearly, theloss of fluo-3 fluorescence intensity in the sealed t-sys-tem of toad fibers when placed in a 50% hypotonic so-lution cannot be due to an increase in ionic strength.The only other factors that can explain this happeningare marked loss of dye and/or loss of Ca2� from thesealed t-system. To distinguish which of these two fac-tors is mainly responsible for the drop in fluorescence,a control experiment was performed with Oregongreen, a fluorescent dye that is not sensitive to Ca2�
and is much less sensitive to ionic strength than fluo-3(over the range of 1.0–2.0 “volumes” in Fig. 1 the fluo-rescence intensity of Oregon green increased by �15%compared with an increase in maximum fluo-3 fluores-cence intensity by �35%). Since there was no signifi-cant difference in the level of Oregon green fluores-cence intensity after 5-min exposure of the toad fiberpreparation with Oregon green in the sealed t-systemto an isotonic or to a 50% hypotonic solution (74.6 �6.2% of control, n 2 vs. 83.1 � 6.1% of control, n
Figure 7. Volume changesin the sealed t-system at dif-ferent osmolalities. (A andB) Relative maximum Ca2�-induced fluo-3 fluorescencesignal emitted from the sealedt-system of toad- and rat-skinned fibers in internal so-lutions of different osmolali-ties, respectively. (C and D)Fractional volume of the toadand rat t-system expressed asa percentage of total intact fi-ber volume in normal physio-logical solution (t-sysVol) atdifferent osmolalities, respec-tively. The results in C and Dwere determined from the ef-fect of changes in water con-tent on the fluo-3 fluores-cence signal (Fig. 1), whichwe have assumed to equateto t-system volume changes(t-sysVol) (see text). The resultis from 9 (A and C) and 15 (Band D) fibers. The continu-ous lines are functions oftype: y �exp(�kx) � c; where, � 148.5 au (A), 171.8 au (B), 4.95% intact fiber volume (C), and 78.9% intact fiber volume (D); k 4.28 osmol�1 kg (A), 12 osmol�1 kg (B), 6.07 osmol�1 kg (C), and 28 osmol�1 kg (D); c 51.3 au (A), 94.9 au (B), 0.753% intact fiber vol-ume (C), and 0.96% intact fiber volume (D); and r 0.969 (A), 0.541 (B), 0.999 (C), and 0.999 (D).
on October 21, 2015
jgp.rupress.orgD
ownloaded from
Published February 23, 2004

239 Launikonis and Stephenson
3, respectively, t test, P 0.42), one can conclude thatthe marked drop in fluo-3 fluorescence intensity whenthe skinned fiber preparation was exposed to 50% hy-potonic solution cannot be due to significant loss ofdye. This implies that [Ca2�] in the sealed t-systemmust have dropped to �1 �M to account for the de-crease in fluo-3 fluorescence intensity by �25% (as-suming a Kapp value for fluo-3 of 3.106 M�1). This wouldhappen if Ca2�-permeant channels in the sealed t-sys-tem open and allow Ca2� to flow out of the t-systeminto the myoplasmic environment down its electro-chemical gradient.
Response of the Sealed and Intact Toad Fiber t-system to Osmotic Stress
In Fig. 9 are compared the changes in t-sysVol of both in-tact and skinned toad fibers when the tonicity of thebathing solutions was altered. When t-sysVol is expressedas a percentage of isotonic fiber volume (Fig. 9 A), thegreater ability of the sealed than of the intact t-systemto change its volume over the range of tonicities isclearly shown. It is important to bear in mind that theisotonic t-sysVol is different in intact and skinned fibers(1.38 vs. 1.77%, respectively) because of the vesicle for-mation in the skinned toad fiber (see earlier). The in-tact and sealed t-systems in toad fibers are also differentwith respect to the t-sysVol they can be compressed towhen the osmolality is increased to very high levels(�0.9 and 0.75% isotonic intact fiber volume, respec-tively). Note that our estimation of the smallest possiblet-sysVol in intact fibers was originally 0.9% when we in-terpreted the relationship between t-sysVol (relative toisotonic fiber volume) and the inverse of osmolality aslinear (Fig. 4 B in Launikonis and Stephenson, 2002a),
whereas the minimum t-sysVol appears to be closer to1% and therefore this relationship should be regardedas sigmoidal (Fig. 9 A).
To determine the ability of the sealed and intact t-sys-tem to change volume in relation to the change inbathing solution tonicity, t-sysVol is expressed in relativeunits against 1/tonicity (Fig. 9 B). This figure showsthat the sealed t-system is able to change its volumeclose to the isosmotic line at 1/tonicity values �0.4.This behavior is very similar to the change in volume ofthe intact fiber over this range of tonicities (Blinks,1965). In contrast, the t-system in intact fibers does notchange its volume in proportion to the change in theosmotic concentration in the external environment be-cause it remains in communication with the externalenvironment.
Figure 8. 50% hypotonic myoplasmic solution opens Ca2�-per-meant channels in the t-system. After equilibration in standard so-lution, exposure to a 50% hypotonic solution caused a drop influo-3 fluorescence from the sealed t-system. This loss of fluores-cence can be attributed to the loss of Ca2� (see text). The loss offluorescence signal could be fitted by a function of type: Aexp(�kx) � c, where, A 35.9 au, k 0.53 min�1, c 64.5 au,and r 0.999. Result is from three fibers.
Figure 9. The ability of the intact (�) and sealed (�) t-system oftoad fibers to change its volume in response to osmotic stress. t-sys-Vol expressed in absolute (A) and relative (B) terms as a function ofthe inverse of tonicity, where 1 unit of tonicity is 255 mosmol kg�1.The continuous lines represent the best fitted curves to the datapoints for t-sysVol as a function of tonicity in both cases. The intactt-system data is from Launikonis and Stephenson (2002a). Thebroken line in B represents the theoretical relationship betweenosmolality and volume in a system that acts as a perfect osmometer(i.e., t-sysVol � 1/tonicity). Note also that the isotonic t-sysVol is 1.38and 1.77% in intact and skinned fibers (A), respectively, but bothhave been assigned the value of 1 in B for comparative purposes.
on October 21, 2015
jgp.rupress.orgD
ownloaded from
Published February 23, 2004
240 Osmotic Properties of the Sealed t-system
Effect of Glycerol on the Sealed t-system of Rat
Since the results in Fig. 7 show that the rat t-system isrelatively incompressible in hypertonic solution but cantake up water when the myoplasmic solution was made25% hypotonic, to examine its permeability to glycerolwe exposed the rat sealed t-system to a 25% hypoos-motic solution with 70 mM added glycerol (210 mM
normal solutes � 70 mM glycerol 280 mosmol kg�1
(isoosmotic)). If glycerol were freely permeable, glyc-erol would act like water in the solution, causing an in-flux of glycerol followed by water into the sealed t-sys-tem and consequently an increase in fluo-3 fluores-
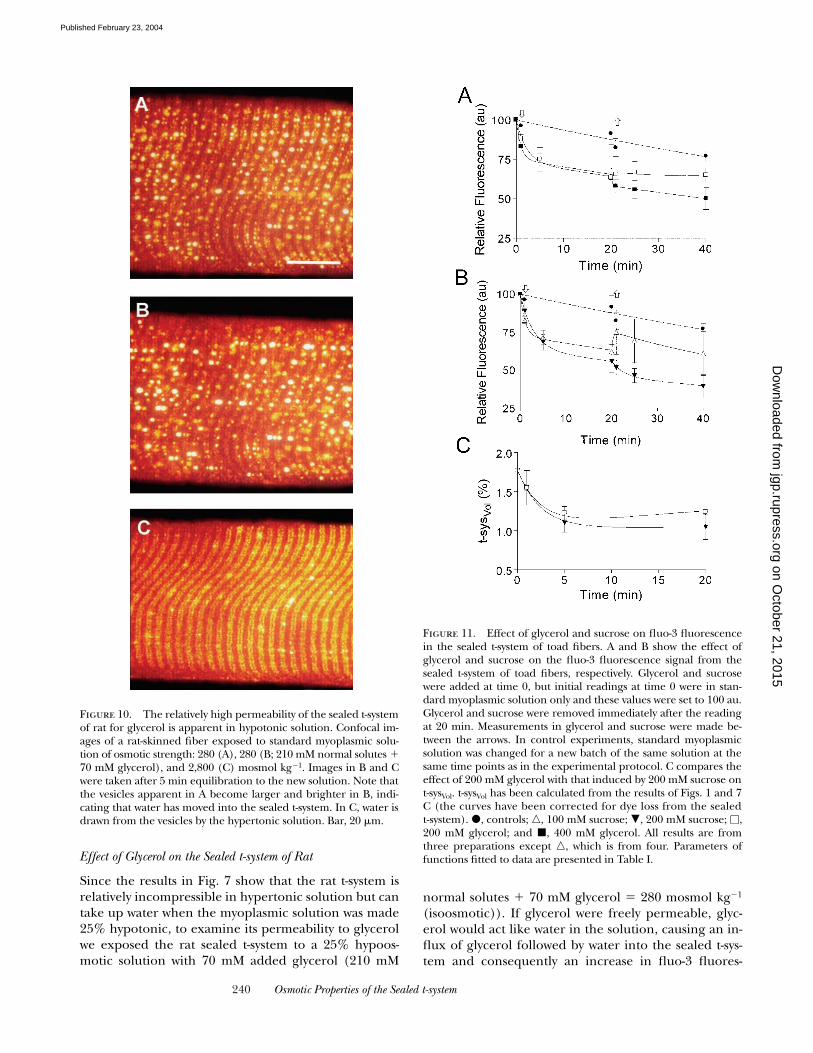
Figure 10. The relatively high permeability of the sealed t-systemof rat for glycerol is apparent in hypotonic solution. Confocal im-ages of a rat-skinned fiber exposed to standard myoplasmic solu-tion of osmotic strength: 280 (A), 280 (B; 210 mM normal solutes �70 mM glycerol), and 2,800 (C) mosmol kg�1. Images in B and Cwere taken after 5 min equilibration to the new solution. Note thatthe vesicles apparent in A become larger and brighter in B, indi-cating that water has moved into the sealed t-system. In C, water isdrawn from the vesicles by the hypertonic solution. Bar, 20 �m.
Figure 11. Effect of glycerol and sucrose on fluo-3 fluorescencein the sealed t-system of toad fibers. A and B show the effect ofglycerol and sucrose on the fluo-3 fluorescence signal from thesealed t-system of toad fibers, respectively. Glycerol and sucrosewere added at time 0, but initial readings at time 0 were in stan-dard myoplasmic solution only and these values were set to 100 au.Glycerol and sucrose were removed immediately after the readingat 20 min. Measurements in glycerol and sucrose were made be-tween the arrows. In control experiments, standard myoplasmicsolution was changed for a new batch of the same solution at thesame time points as in the experimental protocol. C compares theeffect of 200 mM glycerol with that induced by 200 mM sucrose ont-sysVol. t-sysVol has been calculated from the results of Figs. 1 and 7C (the curves have been corrected for dye loss from the sealedt-system). �, controls; �, 100 mM sucrose; �, 200 mM sucrose; �,200 mM glycerol; and �, 400 mM glycerol. All results are fromthree preparations except �, which is from four. Parameters offunctions fitted to data are presented in Table I.
on October 21, 2015
jgp.rupress.orgD
ownloaded from
Published February 23, 2004
241 Launikonis and Stephenson
cence. However, if glycerol was not permeable or onlyvery slowly permeable, then the myoplasmic solutionwould remain isotonic with the t-system lumen andthere would be no net flux of water and no change influo-3 fluorescence. An example of this experiment isshown in Fig. 10. After 5-min exposure, the 25% hy-poosmotic solution plus 70 mM glycerol caused an in-crease in t-system fluorescence compared with the stan-dard solution. On average, t-system fluorescence in-creased to 114.6 � 6.6% (n 5; one-sided paired t test,P � 0.05) of the initial reading in standard solution.This shows that glycerol equilibrates within 5 min be-cause the result is similar to the fluorescence increasein 25% hypotonic solution without glycerol (Fig. 4 D)and suggests that most of the glycerol equilibratedacross the rat t-system within this time frame.
Effect of Glycerol on the Sealed t-system of Toad Fibers
In contrast to the rat fibers where glycerol appears tobe relatively permeant across the t-system, experimentswith toad fibers show that glycerol is rather imper-meant across the t-system of amphibian muscle. The ex-periments on toad fibers are summarized in Fig. 11. Weused a protocol similar to that employed by Krolenkoet al. (1995) to elicit t-system vacuoles in intact fibers.This protocol was designed not only to determine therelative permeability of the t-system to glycerol, but alsoto examine the mechanisms behind vacuolation of theintact t-system.
In the presence of 200 and 400 mM added glycerolthere was a large reduction in the intensity of the fluo-3fluorescence signal emitted from the sealed t-system
compared with controls. This reduction in the fluores-cence signal persisted for 20 min indicating that glyc-erol is much less permeable than water, thus causing anefflux of water from the sealed t-system and a subse-quent increase in ionic strength in the sealed tubulesresulting in the fluo-3 fluorescence decrease. In prepa-rations exposed to 200 mM glycerol, its removal fromthe myoplasmic medium sees a gradual recovery of thefluorescence signal toward the control values but nosuch recovery was observed in preparations previouslyexposed to 400 mM glycerol (Fig. 11 A; see discus-sion).
To help determine the permeability of glycerol acrossthe sealed t-system membrane of toad we used sucrosein an experiment with the same protocol as that in Fig.11 A. The summary of results is shown in Fig. 11 B. Asexpected, the fluorescence signal from the t-system wasreduced by the presence of 100 or 200 mM sucrose.Upon removal of sucrose (immediately after the mea-surement at 20 min) there was an increase in the aver-age fluorescence signal from the preparations previ-ously exposed to 100 mM but not 200 mM sucrose (seediscussion).
A further complexity in the kinetics in the fluores-cence signal change in Fig. 11, A and B, is the responseto the addition of sucrose or glycerol is the crossing-over of the curves before reaching equilibrium after�5 min. The shrinkage of the t-tubules (before equilib-rium) would be dependent on the rate of glycerol/su-crose diffusion into the preparation, on the rate wateris drawn out the t-tubules, and on the rate the t-tubularskeleton can change conformation to adjust to the newosmotic environment. In Fig. 11 A, at 1 min after addi-
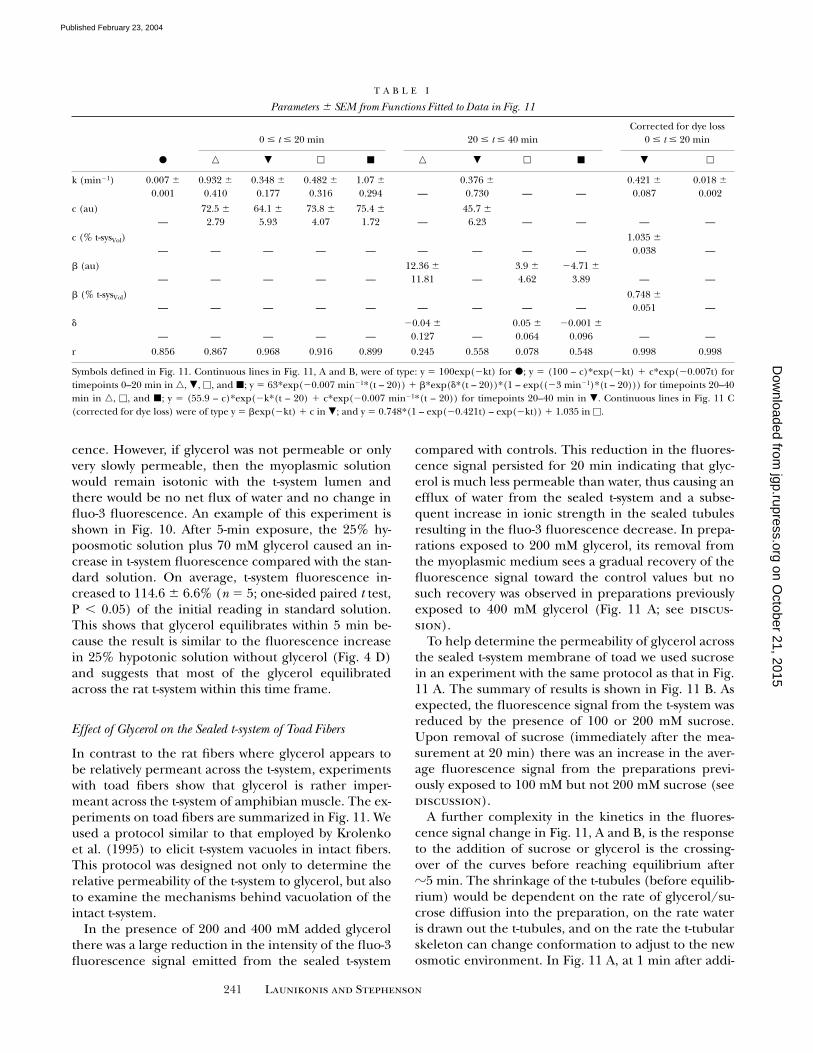
T A B L E I
Parameters � SEM from Functions Fitted to Data in Fig. 11
0 t 20 min 20 t 40 minCorrected for dye loss
0 t 20 min
� � � � � � � � � � �
k (min�1) 0.007 �0.001
0.932 �0.410
0.348 �0.177
0.482 �0.316
1.07 �0.294 —
0.376 �0.730 — —
0.421 �0.087
0.018 �0.002
c (au)—
72.5 �2.79
64.1 �5.93
73.8 �4.07
75.4 �1.72 —
45.7 �6.23 — — — —
c (% t-sysVol)— — — — — — — — —
1.035 �0.038 —
� (au)— — — — —
12.36 �11.81 —
3.9 �4.62
�4.71 �3.89 — —
� (% t-sysVol)— — — — — — — — —
0.748 �0.051 —
�
— — — — —�0.04 �
0.127 —0.05 �0.064
�0.001 �0.096 — —
r 0.856 0.867 0.968 0.916 0.899 0.245 0.558 0.078 0.548 0.998 0.998
Symbols defined in Fig. 11. Continuous lines in Fig. 11, A and B, were of type: y 100exp(�kt) for �; y (100 – c)*exp(�kt) � c*exp(�0.007t) fortimepoints 0–20 min in �, �, �, and �; y 63*exp(�0.007 min�1*(t – 20)) � �*exp(�*(t – 20))*(1 – exp((�3 min�1)*(t – 20))) for timepoints 20–40min in �, �, and �; y (55.9 – c)*exp(�k*(t – 20) � c*exp(�0.007 min�1*(t – 20)) for timepoints 20–40 min in �. Continuous lines in Fig. 11 C(corrected for dye loss) were of type y �exp(�kt) � c in �; and y 0.748*(1 – exp(�0.421t) – exp(�kt)) � 1.035 in �.
on October 21, 2015
jgp.rupress.orgD
ownloaded from
Published February 23, 2004

242 Osmotic Properties of the Sealed t-system
tion of the hyperosmotic solution, shrinkage is faster in400 mM glycerol than in 200 mM glycerol as it wouldnormally be expected. In Fig. 11 B, however, the shrink-age appears to be smaller at 1 min after the addition ofthe 200 mM sucrose solution than after the addition ofthe 100 mM sucrose solution. Such a situation wouldoccur if the interface between the 200 mosmol kg�1 su-crose solution and the standard solution in the prepa-ration would be more stable than the interface betweenthe 100 mosmol kg�1 sucrose solution and the standardsolution as can happen with discontinuous sucrose gra-dients.
In Fig. 11 C are shown the effects of 200 mM glyceroland sucrose on estimated t-sysVol, which have been de-rived from the fluorescence signals in Fig. 11, A and B(corrected for fluo-3 loss from the t-system), and thecalibrations in Figs. 1 and 7. The effect of 200 mM su-crose on t-sysVol shows a steady decrease, which plateausafter �5 min and remains constant. This result indi-cates that sucrose is indeed membrane impermeant, asa steady level is reached and maintained. The rate con-stant for the decrease of t-sysVol (ke) under these condi-tions is an effective (combined) rate constant for (a)sucrose diffusion into the skinned fiber preparation(but not into the t-system) from the surrounding me-dium, (b) water efflux from the sealed t-system, and (c)mechanical changes in the t-system structures thateventually determine the t-system volume. The datapoints for sucrose in Fig. 11 C could be well fitted by anexponential equation of type:
(1)
where t-sysplateau represents t-sysVol at equilibration 1.035% of intact fiber volume, �t-syssucrose representsthe difference between the initial and final t-sysVol 0.748% of intact fiber volume, and ke represents the ef-fective rate constant 0.421 min�1.
The effect of 200 mM glycerol on t-system volumechanges (Fig. 11 C) appears to be in a first approxima-tion similar to that of 200 mM sucrose, implying thatglycerol was rather impermeant to the t-system. None-theless, one can use the data points in Fig. 11 C to esti-mate the t-system permeability for glycerol consideringthat in contrast to sucrose, glycerol will gradually crossthe tubular membranes and enter the t-system and thiswill reverse the osmotic gradient until eventually, thet-system volume returns to its initial value. Thus, in thepresence of 200 mM glycerol there will be first a de-crease in t-system volume associated with the loss of wa-ter due to the osmotic gradient generated by the pres-ence of glycerol in the bathing environment but, asglycerol diffuses into the t-system, there will be a returnof the t-system volume to its initial value as the osmoticgradient changes direction and water moves back into
t-sysVol ∆t-syssucrose 1 ke– t( )exp–[ ] t-sysplateau,+=
its lumen. The change in t-system volume in this casecan be modeled by an expression containing two expo-nentials, one associated with a decrease in volume dueto water loss caused by the presence of glycerol in thebathing environment and the other associated with anincrease in volume due to glycerol entry and water in-flux into the t-system:
(2)
where, �t-sys represents the volume by which the t-sysVol
decreases in the presence of 200 mM of an impermeantosmolite like sucrose; ke represents the effective rateconstant for the decrease in t-sysVol as a result of the ad-dition of 200 mM osmolite to the solution; kg is the rateconstant for the volume changes associated with glyc-erol entry into the sealed t-system; and t-sysplateau repre-sents the final t-sysVol after addition of 200 mM of an im-permeant substance. Assuming that the values for ke,�t-sys and t-sysplateau were those estimated from fittingEq. 1 to the data points for 200 mM sucrose in Fig. 11 C(see also Fig. 7 C), the value of kg (0.018 � 0.001min�1) was then estimated by fitting Eq. 2 to the datapoints for glycerol in Fig. 11 C. Since ke is associatedwith osmolite diffusion into the preparation (but notinto the sealed t-system) and with t-system volumechanges subsequent to water fluxes across the t-system,and since ke is �20 fold greater than kg, it follows thatthe rate of glycerol entry across the t-system must bethe dominant factor in determining the value of kg.
The rate of glycerol entry into the t-system of toad fi-bers can also be calculated in a different way from re-sults in Fig. 11 C, where it is shown that after toad fiberswere equilibrated with 200 mM glycerol for 20 min, thet-sysVol was compressed from 1.77 to 1.22% equivalentintact fiber volume. From these data one can calculatethe [glycerol] in the t-system after 20 min, assumingthat at this moment in time the content of the t-systemwas in quasiosmotic equilibrium with the environment.Thus, from the t-system volume ratio of 1.77/1.22 onecan calculate that the solutes normally found in thet-system would contribute 1.77/1.22 255 370 mos-mol kg�1 to the osmotic concentration in the t-systemlumen, because the osmotic concentration associatedwith these solutes inside the sealed t-system should beinversely proportional to the t-sysVol (Figs. 7 and 9).Therefore, the concentration of normal solutes insidethe t-system was 370 mosmol kg�1. Considering nowthat the osmolality of the t-system lumen should beclose to that of the bathing solution (455 mosmolkg�1), it follows that [glycerol] in the t-system was closeto 455 – 370 85 mosmol kg�1. Since the amount ofglycerol in the t-system after 20 min represents 29.3%(85.4 mM at t-sysVol 1.22%) of all of the glycerol in thet-system at equilibrium (200 mM at t-sysVol 1.77%) one
t-sysVol ∆t-sys* 1 ke– t( )exp kg– t( )exp+–[ ] t-sysplateau,+=
on October 21, 2015
jgp.rupress.orgD
ownloaded from
Published February 23, 2004

243 Launikonis and Stephenson
can estimate that the apparent rate constant (kg) forthe diffusion of glycerol into the t-system was 0.017min�1 (0.293 1 � exp(�kg*20 min)), which is essen-tially the same value as that obtained from fitting thedata points in Fig. 11 C. Since the volume of the intactfiber is 98.23/1.77 greater than that of the sealed t-sys-tem, the estimated rate constant for glycerol entry intoan intact fiber across the t-system is 1.77/98.23*0.017 3 10�4 min�1, which is very small indeed.
D I S C U S S I O N
During the course of these experiments we observedt-tubules of rat fibers “crossing-over” from one sarco-mere to an adjacent sarcomere (Fig. 3). This involvesthe t-tubule to the left of the Z-line becoming thet-tubule to the right of the Z-line in the adjacent sarco-mere and vice versa. We are not aware of this trait ofthe mammalian skeletal muscle t-system being de-scribed previously. The only similar proposal has beenmade by Peachey and Eisenberg (1978), where they de-scribe a helical arrangement of the t-system in frog skel-etal muscle fibers.
This interesting observation of t-tubule “crossing-over”, as well as the presence of more longitudinal ele-ments in the mammalian than amphibian t-system(Launikonis and Stephenson, 2002b), means the mam-malian t-system is connected much more intimatelyand frequently along the fiber axis than the amphibiant-system. This observation is consistent with the betterlongitudinal propagation of action potentials in mam-malian than in amphibian fibers (Posterino et al., 2000;Launikonis and Ríos, 2004).
Volume Changes in the Sealed t-system
This study shows that maximum fluo-3 Ca2�–inducedfluorescence is sensitive to changes in the ionicstrength of its environment and that it is very wellsuited in conjunction with confocal microscopy to mea-sure changes in the ionic strength and associated vol-ume changes in membrane-bound structures of muchsmaller dimensions than the optical resolution of theconfocal microscope. The results unequivocally showthat the estimated volume of the sealed t-system of toadmuscle fibers changed in proportion to the reciprocalof tonicity of the myoplasmic environment (Fig. 8) fora broad range of osmolalities (190–638 mosmol kg�1)when the skinned fiber preparation was exposed to ananisosmotic solution for 5 min. This result in itself vali-dates the method of t-system volume measurement be-cause one could not obtain such behavior where thesealed t-system volume changed isosmotically with thetonicity of the extracellular solution unless the assump-tion that the total amount of solutes in the t-systemchanged little over the period of time when the mea-
surements were made. Further support for the validityof the method is provided by (a) experiments in whichsucrose was used under isosmotic conditions to reducethe myoplasmic ionic strength and ion concentration(see materials and methods) when even after 20 minin the presence of a myoplasmic solution made hyper-osmotic with sucrose, the t-system volume shrunk to avalue that was very close to the predicted value if therewas no change in the total amount of osmolites withinthe sealed t-system over this time period (Fig. 10); and(b) in parallel experiments with the ionic strength in-dependent dye, calcein, which yielded the same calcu-lated t-sysVols in highly hypertonic solutions as fluo-3(Figs. 5 and 6).
The osmotic behavior of the t-system of toad fiberswhen the myoplasmic osmolality was changed between190 and 638 mosmol kg�1 is very similar to that dis-played by intact frog fibers when the osmolality of theexternal environment was changed over the samerange (Blinks, 1965). This behavior is explained by wa-ter movements across the membranes of a closed com-partment, since in such a system water is drawn in to orout of the compartment depending on the osmotic gra-dient across the membranes. As the amount of water inthe closed compartment is incompressible, the net vol-ume of water within that compartment effectively de-termines the volume of the compartment. This is in dis-tinct contrast to the behavior of an open compartmentsuch as the t-system in an intact fiber (Fig. 9; Launiko-nis and Stephenson, 2002a), where extracellular fluidis able to flow relatively freely in and out of the t-systemand the change in t-sysVol in hypotonic and hypertonicsolutions is basically dependent on the change in totalfiber volume (Blinks, 1965) and on the forces exertedon the tubular membranes (Fig. 9; Launikonis andStephenson, 2002a).
There was a lower limit to which the sealed t-systemvolume could change in both toad and rat fibers in re-sponse to increased myoplasmic osmolality. Thus, thesealed t-system could not be compressed within 5 minby more than �45–55% in toad fibers (Fig. 7 C) and bymore than 5% in rat fibers (Fig. 7 D) under conditionsof high osmolality (�1,000 mosmol kg�1). These lowerlimits remained essentially unchanged even after wait-ing for 20 min in myoplasmic solutions that were 10times hyperosmotic compared with standard myoplas-mic solutions. Note that under such conditions all vesi-cles associated with the t-system are compressed andthe pattern of the t-system becomes very regular (Figs.2, 6, and 10). A possible explanation for the limit towhich the t-system can be compressed at high osmolali-ties is that the tubules possess a structural skeleton thatacts as a shell preventing them from collapsing and be-coming compressed below a certain volume. Indeed,there is evidence that the t-system contains glyco-
on October 21, 2015
jgp.rupress.orgD
ownloaded from
Published February 23, 2004
244 Osmotic Properties of the Sealed t-system
proteins (Dörrscheidt-Käfer, 1979) and proteoglycans(Davis and Carlson, 1995) that can form the basis ofthe tubular skeleton that must also be responsible formaintaining the t-system at fixed locations at the levelof the sarcomere. Also the greater rigidity of the t-sys-tem in the rat than in toad muscle is most likely dueto the smaller diameter and presence of tethers int-tubules of rat muscle (Dulhunty, 1984), which wouldallow it to withstand greater pressures without deforma-tion for the same mechanical tubular skeleton charac-teristics. The tubular skeleton would be lined on themyoplasmic side by the tubular membrane, which, ifpermeant to water but not to solutes, would need towithstand large hydrostatic pressure differences to haltosmosis in face of the large osmotic gradient. This isentirely possible if the tubular skeleton would act as asurface (S-) layer supporting the lipid bilayer of the tu-bular membrane, because it is known that under suchcircumstances the mechanical stability of the supportedlipid bilayer can be increased (Schuster and Sleytr,2002). Assuming that the supported lipid bilayer canwithstand a maximal induced tension of �4.3 mN/mwhen the pressure gradient is exerted from the lipid bi-layer-faced side of the structure (Schuster and Sleytr,2002), one can calculate that the lipid bilayer would beable to withstand a hydrostatic pressure difference of 1MN m�2 (�10 atmospheres) if the diameter of thepores in the supporting surface layer was �17.2 nm(pressure difference * area of the pore � surface ten-sion * circumference of the pore). The size of such“pores” in the tubular skeleton is likely much smallerthan 17 nm considering that the diameter of thet-tubules themselves is in the order of 10–50 nm (Dul-hunty, 1984). It is also possible that the permeability ofthe tubular membrane for water decreases markedly asthe stress on the lipid bilayer increases (Soveral et al.,1997), so that the system is far from reaching osmoticequilibrium after 20 min exposure to very high osmola-lity solutions.
Another possible explanation for restricting the vol-ume to which the t-system can shrink under hypertonicconditions would be that the t-tubules come to osmoticequilibrium because of nonideal osmotic behavior ofproteins lining its walls. However, if this were the case itis difficult to see how the ionic environment in tubulesof either rat or toad fibers to which fluo-3 should besensitive appears not to have changed as the osmoticconcentration around the tubules was increased severalfold above 1,000 mosmol kg�1 (Fig. 7).
In absolute terms the sealed t-system of toad fibers instandard solution appears to have a volume that isgreater than that displayed by intact fibers due to theformation of vesicles that remain in communicationwith the t-system (see text related to Fig. 2). We havecalculated that the vesicles that appear upon skinning
in toad fibers increase the t-sysVol by nearly 30% (from1.38 to 1.77% intact fiber volume). There is variabilityin the number of vesicles appearing in confocal imagesin various regions of the fiber, but generally all skinnedfibers from toad formed vesicles in their t-tubular net-work. However, the increase in t-sysVol upon skinning isonly a relatively small fraction of the potential increasein the t-system volume because it has been reportedthat the t-system in amphibian skeletal muscle fiberscan increase up to 10–15% of intact fiber volume whenfully vacuolated (Krolenko and Lucy, 2001).
Activation of Ca2� Channels in the Toad t-system by Hyposmotic Changes
The conclusion derived in results that exposure ofthe sealed toad t-system to 50% hyposmotic solutionscauses Ca2� loss from the t-system is further supportedby results summarized in Fig. 11. In these experiments,preparations exposed for 20 min to standard myoplas-mic solutions containing, in addition, 100 mM sucroseor 200 mM glycerol, could sustain a significant increasein the fluo-3 fluorescence signal from the sealed t-sys-tem upon their return to the standard myoplasmic so-lution, but this was not the case for preparations ex-posed for 20 min to myoplasmic solutions with 200 mMsucrose or 400 mM glycerol. The removal of 100 mMsucrose or 200 mM glycerol causes an increase in t-sysVol
of �25% (1.32–1.77% and 1.22–1.54%, respectively, ascalculated from Figs. 7 and 11). This is consistent withthe result in Fig. 7, where decreasing the osmolality ofthe myoplasmic solution by 25% caused an increase int-sysVol by 30% (1.77–2.30%; Fig. 7), with no net loss oft-system ions and thus an increase in the fluorescencesignals. In contrast, when 200 mM sucrose or 400 mMglycerol were removed from the myoplasmic environ-ment after 20 min equilibration, there was a markeddecrease in fluo-3 fluorescence. This again indicatesthat a 40–50% decrease in osmolality causes the open-ing of ion channels in the t-system that allow Ca2� to es-cape from the t-system.
We must note here that changing the myoplasmic os-molality not only changes t-sysVol but will also affect SRvolumes. Thus, one mechanism that would cause loss oft-system ions in myoplasmic solutions made �40% hy-potonic would involve store-operated Ca2�-channels(SOCs) that become activated as a result of decrease in[Ca2�] in the SR. We have recently shown that SOCsare functional in the sealed t-system of toad fibers(Launikonis et al., 2003) and observed marked SR Ca2�
loss upon transfer of the preparation from a solution ofnormal osmolality to a 50% hypotonic solution (un-published data).
The other mechanism of t-system Ca2� loss would in-volve the opening of stretch-activated ionic channels(Wong and Chase, 1986; Wong et al., 1990; Filipovic
on October 21, 2015
jgp.rupress.orgD
ownloaded from
Published February 23, 2004

245 Launikonis and Stephenson
and Sackin, 1991; Sackin, 1995) that would become ac-tivated when a significant volume of water enters thet-system, stretching its membranes. Such stretch-acti-vated ionic channels that are permeant for Ca2� play animportant role in cell volume regulation (Wong et al.,1990) and are known to exist in skeletal muscle fibers(Franco-Oberon and Lansman, 1994). Since the vol-ume of the t-system is known to increase by many timesmore than 50% in vacuolated muscle fibers, this in-crease in t-system volume would be expected to activatethe stretch-activated ion channels in the t-system (Kro-lenko and Lucy, 2001) and cause the muscle fiber tocontract. However, no contraction is observed undersuch conditions (Krolenko and Lucy, 2001), suggestingthat it is the SOC channels rather than the stretch-acti-vated channels that are responsible for Ca2� loss fromthe t-system under more severe hypotonic conditions.
Permeability of the Sealed t-system to Glycerol
This study has conclusively shown that there is a signifi-cant difference between the permeability of the t-sys-tem of rat and toad skeletal muscle fibers to glycerol.Analysis of fluorescence signals emitted from the sealedt-system of rat fibers suggests that glycerol permeatesand equilibrates across the t-system membrane on a ti-mescale of seconds to minutes (Fig. 10). In contrast,the same concentration of glycerol could not equili-brate across the t-system membrane of toad fiberswithin 20 min (Fig. 11). This implies that there must beat least one order of magnitude difference in the ratesof permeation of glycerol across the t-system of toadand rat fibers. Since the lower volume/surface area ra-tio in rat than toad sealed t-system (Dulhunty, 1984;Launikonis and Stephenson, 2002a) can account foronly a factor of �2 for differences between the rates ofglycerol permeation across the t-system, it follows thatthe permeability of the t-system membrane for glycerolis larger in rat than in toad fibers.
From Fig. 1 in Krolenko and Lucy (2001), one can es-timate a rate constant for glycerol entry into intact frogfibers (kg) of 0.08 min�1. Taking into considerationthat the volume to surface area of the sarcolemma(without the t-system) is �25 �m for a fiber of 100 �min radius, this translates into an apparent permeabilitycoefficient of the sarcolemma for glycerol of �66 nms�1, which is similar to the permeability coefficient forglycerol of lipid bilayers (Orbac and Finkelstein, 1980;Paula et al., 1996). In contrast, the permeability coeffi-cient of the t-system for glycerol in toad fibers is esti-mated at only 0.014 nm s�1, considering the rate con-stant of glycerol entry in the t-system measured in thisstudy (0.018 min�1) and a volume to surface ratio of�50 nm (Dulhunty, 1984; Launikonis and Stephenson,2002a). Thus, our results indicate that the t-system ofanuran fibers is rather impermeant to glycerol com-
pared with the sarcolemma and show that the t-systemdiffers from the sarcolemma not only with respect topermeability coefficients to ions (e.g., Cl�, K�; Gageand Eisenberg, 1969; Dulhunty, 1979; Coonan andLamb, 1998), but also with respect to permeability coef-ficients of uncharged molecules like glycerol. Thelarger difference with respect to glycerol permeabilityof the t-system and sarcolemma in amphibian musclethan in mammalian muscle is most likely due to the dif-ferent distribution of aquaglycerolporins (Borgnia etal., 1999), which are members of the aquaporin familyof channels that are able to pass water and glycerol.The aquaporins play a major role in osmoregulationand therefore they regulate water movement across thesurface membranes.
Regarding the mammalian fibers, results in this pa-per show that the t-system of rat fibers are much morepermeant to glycerol than the t-system of toad fibers.Since glycerol equilibration in the sealed t-system of ratfibers occurs on a time scale of seconds to minutes, therate constant for glycerol equilibration must be �0.6min�1. This value of 0.6 min�1 would translate into arate constant for glycerol permeation at the level of theintact fiber of 0.006 min�1, considering that the volumeof the t-system is only 1% of the total fiber volume. Arate of 0.006 min�1 would still be one order of magni-tude smaller than the expected rate of glycerol equili-bration in intact fibers. Also considering that someaquaporins are localized at the level of the sarcolemmaand not in the t-system (Frigeri et al., 1998), it is possi-ble that, like in the amphibian t-system, the permeabil-ity to glycerol of the t-system membrane in mammalianfibers may also be considerably smaller than that of thesarcolemma.
The notable differences with respect to vacuole for-mation between mammalian and amphibian muscles(Davey et al., 1980; Krolenko et al., 1995; Lännergrenet al., 1999, 2000) can be related to differences in per-meability of the t-system to various uncharged mole-cules and ions between the two classes of animals asshown in this study.
In summary, this study shows that the t-system mem-branes have exceptional properties with regard to glyc-erol transport. How such low t-system membrane per-meability for glycerol can be achieved remains to be de-termined, but a possibility would be that the tubularlining of the toad t-system forms a coat that covers thelipid bilayer and is impermeant to glycerol.
Concluding Remarks
We have shown that the mechanically skinned musclefibers are a viable means of studying transport pro-cesses across the t-system in situ with full experimentalcontrol over the intracellular environment. The resultsshow that there are large differences with respect to
on October 21, 2015
jgp.rupress.orgD
ownloaded from
Published February 23, 2004
246 Osmotic Properties of the Sealed t-system
t-system behavior to changes in myoplasmic osmoticconcentration and glycerol movement across the t-systemin rat and toad muscle fibers that can explain previousobservations regarding reversible vacuolation that isthought to be important to a number of processes inmuscle fibers and other cells (see Krolenko and Lucy,2001).
We are grateful to Eduardo Ríos (Rush University Medical Cen-ter, Chicago) for allowing us to perform several experiments inhis laboratory.
We also thank the ARC and NHMRC of Australia for financialsupport.
Olaf S. Andersen served as editor.
Submitted: 16 September 2003Accepted: 12 January 2004
R E F E R E N C E S
Blinks, J.R. 1965. Influence of osmotic strength on cross-sectionand volume of isolated single muscle fibres. J. Physiol. 177:42–57.
Borgnia, M., S. Nielsen, A. Engel, and P. Agre. 1999. Cellular andmolecular biology of the aquaporin water channels. Annu. Rev.Biochem. 68:425–458.
Coonan, J.R., and G.D. Lamb. 1998. Effect of transverse-tubularchloride conductance on excitability in skinned skeletal musclefibres of rat and toad. J. Physiol. 509:551–564.
Davey, D.F., A.F. Dulhunty, and D. Fatkin. 1980. Glycerol treatmentin mammalian skeletal muscle. J. Membr. Biol. 53:223–233.
Davis, A.K., and S.S. Carlson. 1995. Proteoglycans are present inthe transverse tubule system of skeletal muscle. Matrix Biol. 14:607–621.
Dörrscheidt-Käfer, M. 1979. Excitation-contraction coupling in frogsartorius and the role of surface charge due to the carboxylgroup of sialic acid. Pflugers Arch. 380:171–179.
Dulhunty, A.F. 1979. Distribution of potassium and chloride perme-ability over the surface and T-tubule membrane of mammalianskeletal muscle. J. Membr. Biol. 45:293–310.
Dulhunty, A.F. 1984. Heterogeneity of t-tubule geometry in verte-brate skeletal muscle fibres. J. Muscle Res. Cell Motil. 5:333–347.
Eisenberg, B.R., and R.S. Eisenberg. 1968. Selective disruption ofthe sarcotubular system in frog sartorius fibres. A quantitativestudy with exogenous peroxidase as a marker. J. Cell Biol. 39:451–467.
Filipovic, D., and S. Sackin. 1991. A calcium-permeable stretch-acti-vated cation channel in renal proximal tubule. Am. J. Physiol. 260:F119–F129.
Flucher, B.E., M. Terasaki, H. Chin, T.J. Beeler, and M.P. Daniels.1991. Biogenesis of transverse tubules in skeletal muscle in vitro.Dev. Biol. 145:77–90.
Franco-Oberon, A., Jr., and J.B. Lansman. 1994. Mechanosensitiveion channels in skeletal muscle from normal and dystrophicmice. J. Physiol. 481:299–309.
Frigeri, A., G.P. Nicchia, J.M. Verbavatz, G. Vaenti, and M. Svelto.1998. Expression of aquaporin-4 in fast-twitch mammalian skele-tal muscle. J. Clin. Invest. 102:695–703.
Fujino, M., T. Yamaguchi, and K. Suzuki. 1961. Glycerol effect” andthe mechanism linking excitation of the plasma membrane withcontraction. Nature. 192:1159–1161.
Gage, P.W., and R.S. Eisenberg. 1969. Ionic conductances of thesurface and transverse tubular membranes of frog sartorius fi-bers. J. Gen. Physiol. 53:279–297.
Harkins, A.B., N. Kurebayashi, and S.M. Baylor. 1993. Resting myo-
plasmic free calcium in frog skeletal muscle fibers estimated withfluo-3. Biophys. J. 65:865–881.
Jayaraman, S., Y. Song, and A.S. Verkman. 2001. Airway surface liq-uid osmolality measured using fluorophore-encapsulated lipo-somes. J. Gen. Physiol. 117:423–430.
Krolenko, S.A., W.B. Amos, and J.A. Lucy. 1995. Reversible vacuola-tion of the transverse tubules of frog skeletal muscle: a confocalfluorescence microscopy study. J. Muscle Res. Cell Motil. 16:401–411.
Krolenko, S.A., and J.A. Lucy. 2001. Reversible vacuolation ofT-tubules in skeletal muscle: mechanisms and implications forcell biology. Int. Rev. Cytol. 202:243–298.
Lamb, G.D., P.R. Junankar, and D.G. Stephenson. 1995. Raised in-tracellular [Ca2�] abolishes excitation-contraction coupling inskeletal muscle fibres of rat and toad. J. Physiol. 489:349–362.
Lamb, G.D., and D.G. Stephenson. 1990. Calcium release inskinned fibres of the toad by transverse tubule depolarization orby direct stimulation. J. Physiol. 423:495–517.
Lamb, G.D., D.G. Stephenson, and G.J. Stienen. 1993. Effects of os-molality and ionic strength on the mechanism of Ca2� release inskinned skeletal muscle fibres of the toad. J. Physiol. 464:629–648.
Lännergren, J., J.D. Bruton, and H. Westerblad. 1999. Vacuole for-mation in fatigued single muscle fibres from frog and mouse. J.Muscle Res. Cell Motil. 20:19–32.
Lännergren, J., J.D. Bruton, and H. Westerblad. 2000. Vacuole for-mation in fatigued skeletal muscle fibres from frog and mouse:effects of extracellular lactate. J. Physiol. 526:597–611.
Lattanzio, F.A., Jr. 1990. The effects of pH and temperature on flu-orescent calcium indicators as determined with Chelex-100 andEDTA buffer systems. Biochem. Biophys. Res. Commun. 171:102–108.
Launikonis, B.S., M. Barnes, and D.G. Stephenson. 2003. Identifi-cation of the coupling between skeletal muscle store-operatedCa2� entry and the inositol trisphosphate receptor. Proc. Natl.Acad. Sci. USA. 100:2941–2944.
Launikonis, B.S., and E. Ríos. 2004. Ca2� release events in mechan-ically skinned skeletal muscle fibres induced by spontaneous ac-tion potentials. Biophys. J. 86:578a.
Launikonis, B.S., and D.G. Stephenson. 1999. Effects of �-escin andsaponin on the transverse-tubular system and sarcoplasmic retic-ulum membranes of rat and toad skeletal muscle. Pflugers Arch.437:955–965.
Launikonis, B.S., and D.G. Stephenson. 2001. Effects of membranecholesterol manipulation on excitation-contraction coupling inskeletal muscle of the toad. J. Physiol. 534:71–85.
Launikonis, B.S., and D.G. Stephenson. 2002a. Tubular system vol-ume changes in twitch fibres from toad and rat skeletal muscleassessed by confocal microscopy. J. Physiol. 538:607–618.
Launikonis, B.S., and D.G. Stephenson. 2002b. Properties of thevertebrate skeletal muscle tubular system as a sealed compart-ment. Cell Biol. Int. 26:921–929.
Melzer, W., A. Herrmann-Frank, and H.C. Lüttgau. 1995. The roleof Ca2� ions in excitation-contraction coupling of skeletal musclefibres. Biochim. Biophys. Acta. 1241:59–116.
Minta, A., J.P. Kao, and R.Y. Tsien. 1989. Fluorescent indicators forcytosolic calcium based on rhodamine and fluorescein chro-mophores. J. Biol. Chem. 264:8171–8178.
Orbac, E., and A. Finkelstein. 1980. The nonelectrolyte permeabil-ity of planar lipid bilayer membranes. J. Gen. Physiol. 75:427–436.
Paula, S., A.G. Volkov, A.N. Van Hoek, T.H. Haines, and D.W.Deamer. 1996. Permeation of protons, potassium ions, and smallpolar molecules through phospholipid bilayers as a function ofmembrane thickness. Biophys. J. 70:339–348.
Peachey, L.D., and B.R. Eisenberg. 1978. Helicoids in the T systemand striations of frog skeletal muscle fibres seen by high voltage
on October 21, 2015
jgp.rupress.orgD
ownloaded from
Published February 23, 2004

247 Launikonis and Stephenson
electron microscopy. Biophys. J. 22:145–154.Posterino, G.S., G.D. Lamb, and D.G. Stephenson. 2000. Twitch
and tetanic force responses and longitudinal propagation of ac-tion potentials in skinned skeletal muscle fibres of the rat. J. Phys-iol. 527:131–137.
Ørtenblad, N., and D.G. Stephenson. 2003. A novel signalling path-way originating in mitochondria modulates rat skeletal musclemembrane excitability. J. Physiol. 548:139–145.
Sackin, H. 1995. Mechanosensitive channels. Annu. Rev. Physiol. 57:333–353.
Schuster, B., and U.B. Sleytr. 2002. The effect of hydrostatic pres-sure on S-layer-supported lipid membranes. Biochim. Biophys.Acta. 1563:29–34.
Soveral, G., R.T.I. Macey, and T.F. Moura. 1997. Membrane stresscauses inhibition of water channels in brush border membranevesicles from kidney proximal tubule. Biol. Cell. 89:275–282.
Stephenson, D.G. 1993. The length sensor in the sarcomere is func-tional in the virtual absence of Ca2� (pCa � 10). XXXII Congressof IUPS. 25:69.4.
Stephenson, D.G., and G.D. Lamb. 1993. Visualisation of the trans-
verse tubular system in isolated intact and in mechanicallyskinned muscle fibres of the cane toad by confocal laser scanningmicroscopy. J. Physiol. 459:15P.
Ríos, E., M.D. Stern, A. Gonzalez, G. Pizarro, and N. Shirokova.1999. Calcium release flux underlying Ca2� sparks of frog skele-tal muscle. J. Gen. Physiol. 114:31–48.
Thomas, D., S.C. Tovey, T.J. Collins, M.D. Bootman, M.J. Berridge,and P. Lipp. 2000. A comparison of fluorescent Ca2� indicatorproperties and their use in measuring elementary and globalCa2� signals. Cell Calcium. 28:213–223.
Wong, S.M.E., and H.S. Chase, Jr. 1986. Role of intracellular cal-cium in cellular volume regulation. Am. J. Physiol. 250:C841–C852.
Wong, S.M.E., M.C. DeBell, and H.S. Chase, Jr. 1990. Cell swellingincreases intracellular free [Ca] in cultured toad bladder cells.Am. J. Physiol. 258:F292–F296.
Yeung, E.W., C.D. Balnave, H.J. Ballard, J.P. Bourreau, and D.G.Allen. 2002. Development of T-tubular vacuoles in eccentricallydamaged mouse muscle fibres. J. Physiol. 540:581–592.
on October 21, 2015
jgp.rupress.orgD
ownloaded from
Published February 23, 2004