Embed Size (px)
Citation preview
Osaka University
An An ExperimentalExperimental Comparison Comparisonof Checklist-Based Readingof Checklist-Based Reading
and Perspective-Based Readingand Perspective-Based Readingfor UML Design Document Inspectionfor UML Design Document Inspection
Giedre Sabaliauskaite*Fumikazu Matsukawa**
Shinji Kusumoto**Katsuro Inoue**
*Graduate School of Engineering Science, Osaka University**Graduate School of Information Science and Technology, Osaka University
2
Osaka University
ContentsContentsBackgroundResearch GoalsExperiment description
Reading techniques Experimental design Data analysis Results
Conclusions and Further Work

3
Osaka University
Software InspectionSoftware InspectionSoftware inspection is an effective and efficient method to
detect defects in early stages of software development life-cycle
Software inspection usually consists of several activities [1]
[1] O. Laitenberger, J.M. DeBaud, “An encompassing life cycle centric survey of software inspection”, The Journal of Systems and Software, vol. 50, no. 1, 2000, pp. 5-31.
Planning
Defect detection
Defect collection
Defect correction
Key activity – defects are detected
Reading techniques are used to guide inspectors

4
Osaka University
Reading techniquesReading techniquesAd hoc and Checklist-based Reading are the most popular [1]Ad hoc: no guidance for inspectorsChecklist-based Reading (CBR): ChecklistScenario-based Reading is a more recent approach: ScenarioPerspective-based Reading (PBR) [2] is one of Scenario-based
approaches Software product is inspected from different perspectives (designer,
tester, etc.) Provides inspectors with different Scenario for each perspective
We analyzed CBR and PBR inspection techniques during experiment
[1] O. Laitenberger, J.M. DeBaud, “An encompassing life cycle centric survey of software inspection”, The Journal of Systems and Software, vol. 50, no. 1, 2000, pp. 5-31.[2] V.R. Basili, S. Green, O. Laitenberger, F. Lanubile, F. Shull, S. Sorumgard, M.V. Zelkowitz, “The Empirical Investigation of Perspective-Based Reading”, Empirical
Software Engineering: An International Journal, vol.1 , no. 2, 1996, pp. 133-164.

5
Osaka University
Related researchRelated researchSeveral works are done in the area of Unified Modelling
Language (UML) diagram inspectionOne of the works is described in [1]
Experimental comparison of CBR and PBR 18 subjects (practitioners) and 2 software systems UML diagrams inspected – Class, State, Sequence, Collaboration Results - PBR 3-person teams exhibited higher effectiveness and
lower cost per defect than CBR teams
[1] O. Laitenberger, C. Atkinson, M. Schlich, K. El Emam. An experimental comparison of reading techniques for defect detection in UML design documents. The Journal of Systems and Software, 53: 183-204, 2000.
Authors of different studies came to the conclusion that UML inspections need to be further investigated
6
Osaka University
Research GoalsResearch Goals
Conduct UML diagram inspection experiment in Osaka university Language used during experiment - Japanese
Compare Reading techniques CBR and PBR with respect to Defect detection effectiveness Cost per defect Time spent on inspection
Compare both individual inspector results and team resultsAcquire experience for future inspection
7
Osaka University
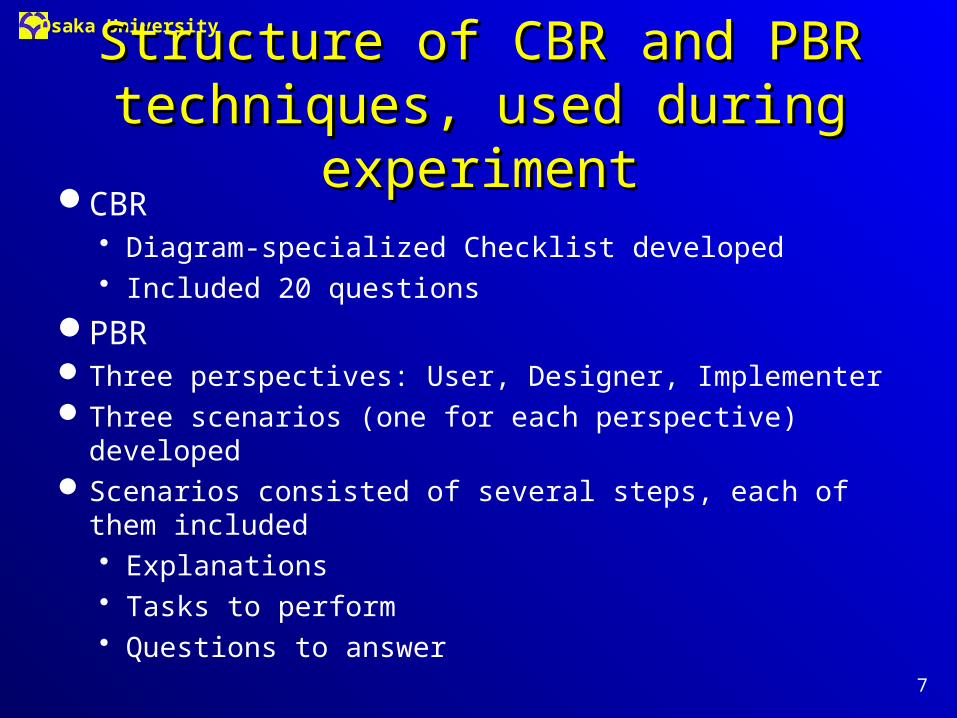
Structure of CBR and PBR techniques, Structure of CBR and PBR techniques, used during experimentused during experiment
CBR Diagram-specialized Checklist developed Included 20 questions
PBRThree perspectives: User, Designer, ImplementerThree scenarios (one for each perspective) developedScenarios consisted of several steps, each of them included
Explanations Tasks to perform Questions to answer
8
Osaka University
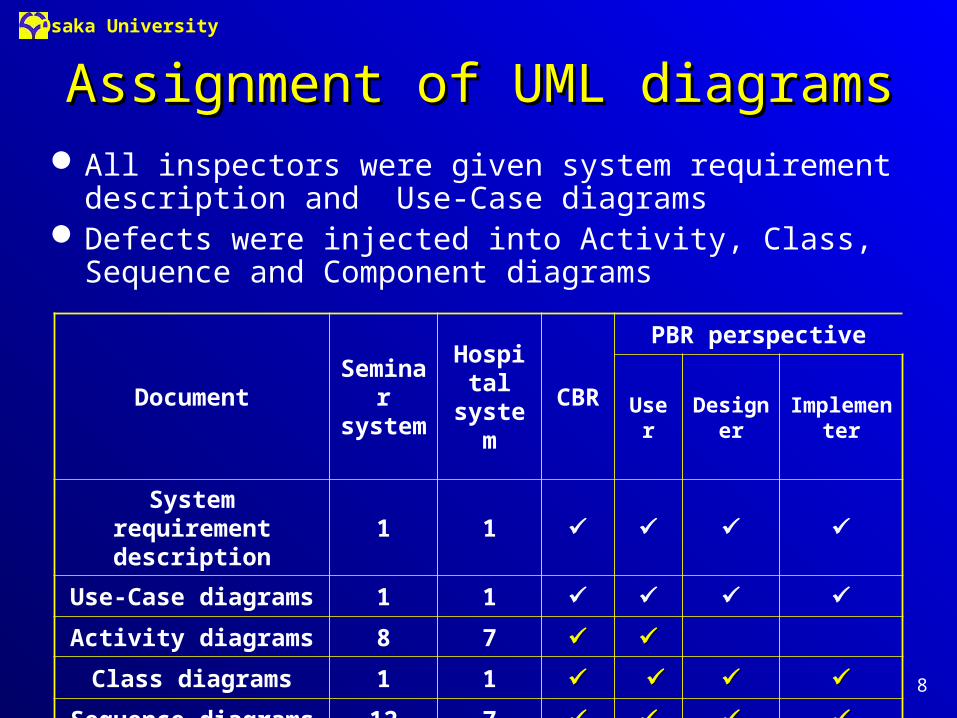
Assignment of UML diagramsAssignment of UML diagramsAll inspectors were given system requirement description and Use-
Case diagramsDefects were injected into Activity, Class, Sequence and Component
diagrams
DocumentSeminar system
Hospital system
CBR PBR perspective
User Designer Implementer
System requirement description
1 1
Use-Case diagrams 1 1
Activity diagrams 8 7
Class diagrams 1 1
Sequence diagrams 12 7
Component diagrams 1 1
9
Osaka University
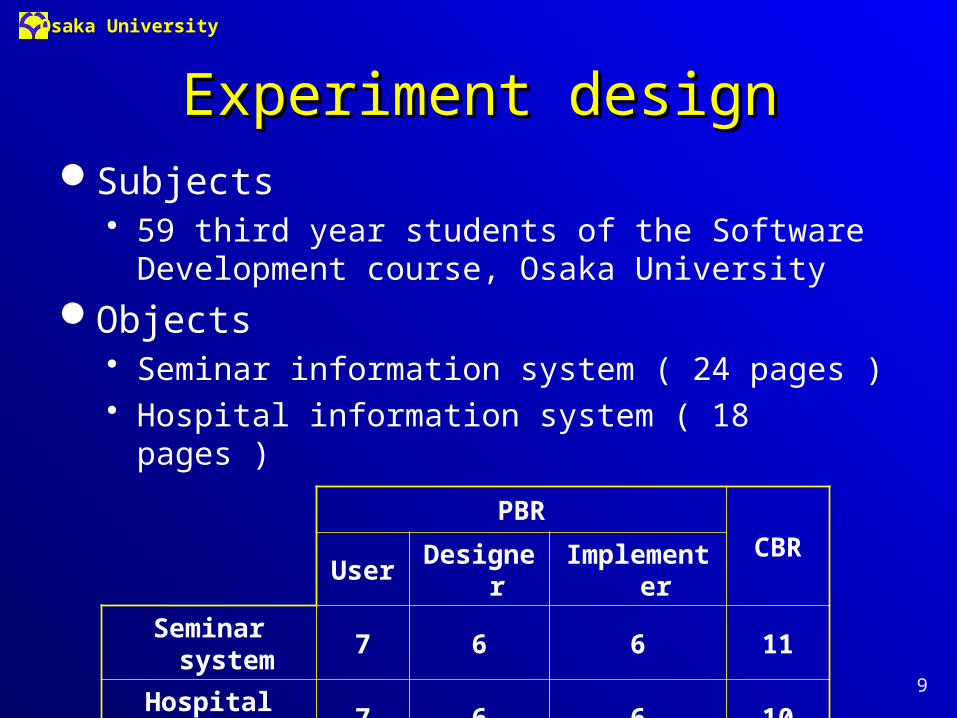
Experiment designExperiment designSubjects
59 third year students of the Software Development course, Osaka University
Objects Seminar information system ( 24 pages ) Hospital information system ( 18 pages )
PBR
CBRUser Designer Implementer
Seminar system 7 6 6 11
Hospital system 7 6 6 10

10
Osaka University
DefectsDefectsThree types of defects inserted into UML diagrams
Syntactic – missing or unnecessary information Semantic – misrepresentation of a concept, or unclear
representation Consistency – inconsistency between UML diagrams
In total, 15 defects inserted into the each software system 4 into Activity diagrams 3 into Class diagrams 5 into Sequence diagrams 3 into Component diagrams
11
Osaka University
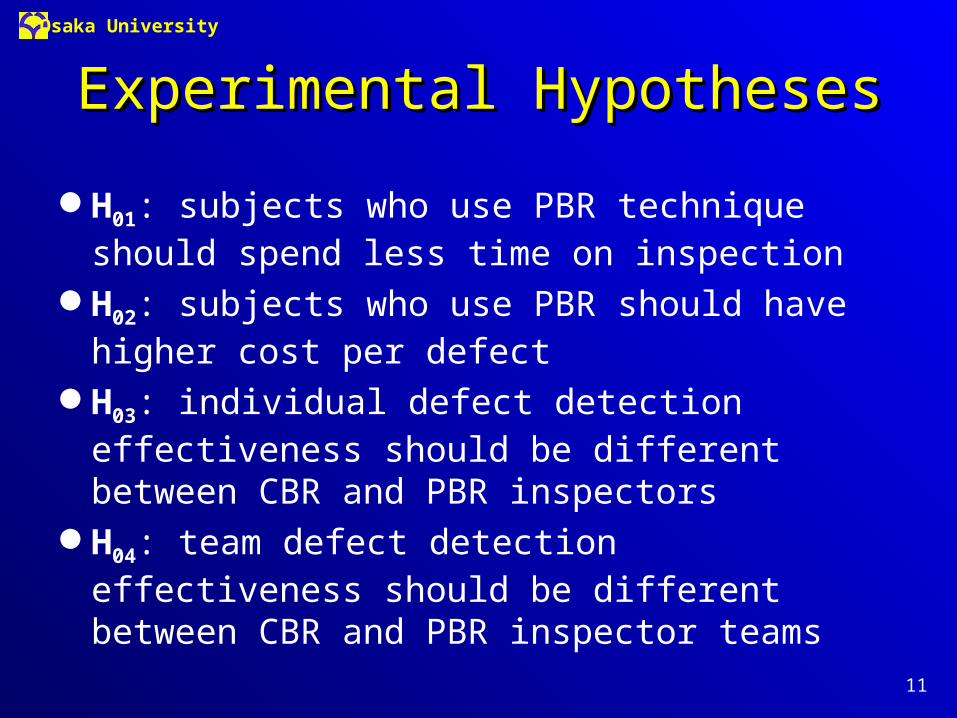
Experimental HypothesesExperimental Hypotheses
H01: subjects who use PBR technique should spend less time on inspection
H02: subjects who use PBR should have higher cost per defect
H03: individual defect detection effectiveness should be different between CBR and PBR inspectors
H04: team defect detection effectiveness should be different between CBR and PBR inspector teams

12
Osaka University
Data analysisData analysis
Two types of analysis Individual data analysis
Defect detection effectiveness Time spent on inspection Cost per defect
Team data analysis Subjects assigned into 3-person virtual teams Effectiveness of CBR and PBR teams compared

13
Osaka University
Percentage of inspectors, who have detected Percentage of inspectors, who have detected defects relevant to different perspectivesdefects relevant to different perspectives
50%
60%
70%
80%
Allperspectives
User Designer Implementer
CBRPBR
Both CBR and PBR exhibited similar results

14
Osaka University
Defect detection effectiveness (according Defect detection effectiveness (according to defect types)to defect types)
50%
60%
70%
80%
90%
Syntactic Semantic Consistency
CBR
PBR
Syntactic defects: CBR more effective
Semantic and Consistency defects: PBR more effective
15
Osaka University
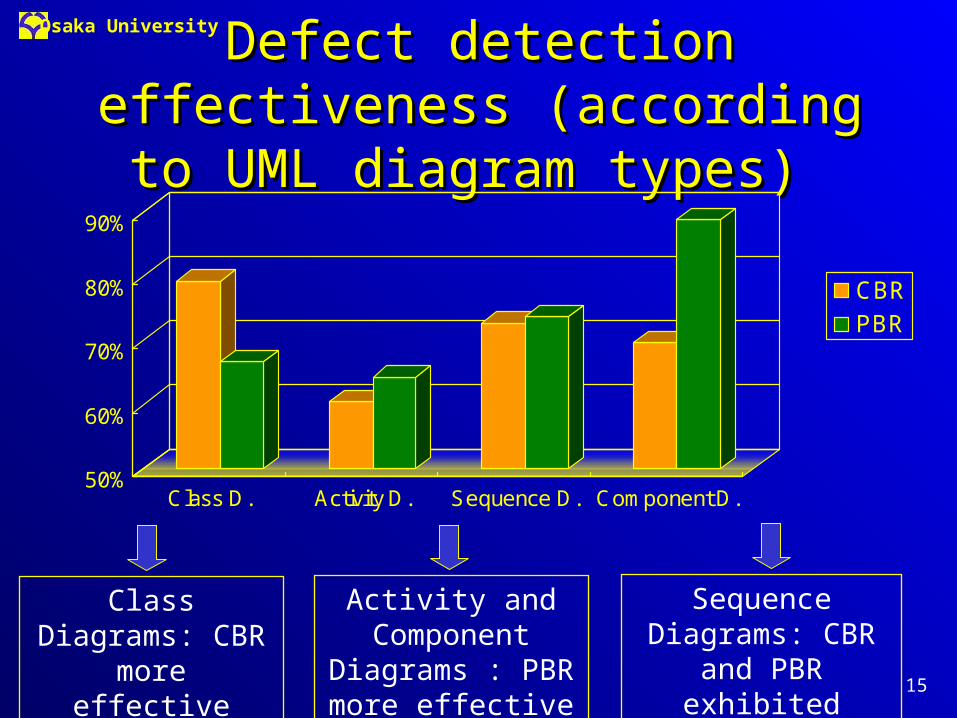
Defect detection effectiveness (according Defect detection effectiveness (according to UML diagram types)to UML diagram types)
50%
60%
70%
80%
90%
Class D. Activity D. Sequence D. Component D.
CBRPBR
Class Diagrams: CBR more effective
Activity and Component Diagrams : PBR more
effective
Sequence Diagrams: CBR and PBR exhibited
similar effectiveness

16
Osaka University
Time spent on inspection, Cost per defect Time spent on inspection, Cost per defect and Defect detection effectivenessand Defect detection effectiveness
Independent samples t-testMann-Whitney test
• Significant difference in Inspection Time and Cost • No significant difference in Effectiveness
Variables Reading technique Mean SD
Time spent on inspectionCBR 62.9 11.7PBR 51.351.3 15.1
Cost per defectCBR 6.26.2 1.6PBR 10.2 3.5
EffectivenessCBR 70.2 11.5
PBR 69.1 15.3
PBR: 18% (11 min) less time spent on inspection
CBR: 39% (4 min / defect) lower cost per defect
CBR Effectiveness ≈PBR Effectiveness
17
Osaka University
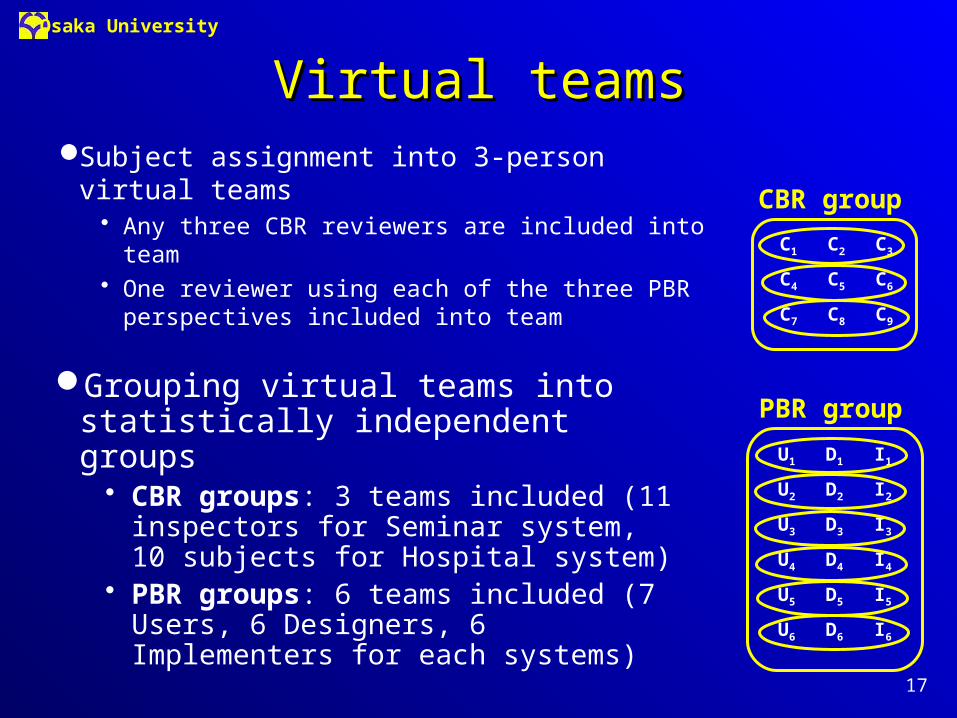
Virtual teamsVirtual teamsSubject assignment into 3-person virtual teams
Any three CBR reviewers are included into team One reviewer using each of the three PBR
perspectives included into teamC9C8C7
C6C5C4
C3C2C1
CBR group
I5D5U5
I4D4U4
I3D3U3
I6D6U6
I2D2U2
I1D1U1
PBR groupGrouping virtual teams into statistically
independent groups CBR groups: 3 teams included (11 inspectors
for Seminar system, 10 subjects for Hospital system)
PBR groups: 6 teams included (7 Users, 6 Designers, 6 Implementers for each systems)

18
Osaka University
Comparisons between CBR and PBR teamsComparisons between CBR and PBR teams
C1 C2 C3
C4 C5 C6
C7 C8 C9
CBR group 1
U1 D1 I1
U2 D2 I2
… … …
U6 D6 I6
PBR group 1
U1 D1 I6
U2 D2 I1
… … …
U6 D6 I5
PBR group 2
…
CBR PBRCom
parisons
…
C1 C2 C3
C4 C5 C6
C7 C8 C10
CBR group 2
…
01016064000!6
!6!6
!3673437310
PCCC
05588352000!6
!6!6
!3673538311
PCCC
Hospital system
Seminar system
Number of comparisons:

19
Osaka University
Team data analysis (1/2)Team data analysis (1/2)CBR and PBR teams were compared with respect to Team defect
detection effectiveness
Software system
Team defects detection effectiveness
CBR>PBR PBR>CBR CBR=PBR
Seminar 54 753 326 68854 753 326 688 585 743 712 544 449 600
Hospital 10 160 482 17610 160 482 176 8 064 149 760
100 defects ofnumber Total
members team by found defects unique ofNumber _ esseffectivenTeam
Number or comparisons, in which either CBR or PBR was more effective, or both techniques showed similar effectiveness
CBR teams more effective than PBR teams

20
Osaka University
Team data analysis (2/2)Team data analysis (2/2)
Comparison typeSoftwaresystem
Defect detection effectiveness
CBR > PBR PBR > CBR CBR = PBR
All defects includedSeminar 76315579687631557968 0 0
Hospital 72338738487233873848 0 0
Syntactic defect omitted
Seminar 69681600006968160000 0 0
Hospital 8512200085122000 0 0
T-test with significance level of 2.5% was used to evaluate in which comparisons there was a significant difference between CBR and PBR team effectiveness
Two types of comparisons made All defects included Syntactic defects omitted
CBR teams more effective than PBR teams

21
Osaka University
Experiment resultsExperiment resultsIndividual inspector results
Inspectors who use PBR spend on average 18% less time on inspection
Cost per defect of Inspectors who use PBR is on average 39% higher
There is no statistically significant difference in defect detection effectiveness between individual CBR and PBR inspectors, however on average
• PBR is more effective for Semantic and Consistency defects• PBR is more effective for Activity and Component diagrams• CBR is more effective for Syntactic defects• CBR is more effective for Class diagrams
Three-person virtual team results CBR teams exhibit higher defect detection effectiveness than
PBR teams
22
Osaka University
Threats to validityThreats to validityInternal validity
Selection: experiment was a mandatory part of the course Instrumentation: objects which we used could have influence
External validity Students were used as subjects Design documents were similar to those which are used in
practice, but the size of systems in industry is usually largerThere were threats to internal and external validity, but they
were not considered large in this experiment
23
Osaka University
Conclusions and Further researchConclusions and Further researchUML diagram inspection experiment was conductedThe results of the experiment indicate that
There is no statistically significant difference in effectiveness of CBR and PBR individual inspectors
CBR virtual teams are more effective than PBR virtual teamsFuture research will be directed to further investigation of
UML diagram inspection A replication of experiment was conducted in July 2002, during
which real team meeting were performed More detail analysis of both individual and team data Research of Fault Content Estimation methods

24
Osaka University
Software Engineering LaboratorySoftware Engineering Laboratory
http://iip-lab.ics.es.osaka-u.ac.jp/http://iip-lab.ics.es.osaka-u.ac.jp/

25
Osaka University
ADDITIONAL SLIDES: 26-32
26
Osaka University
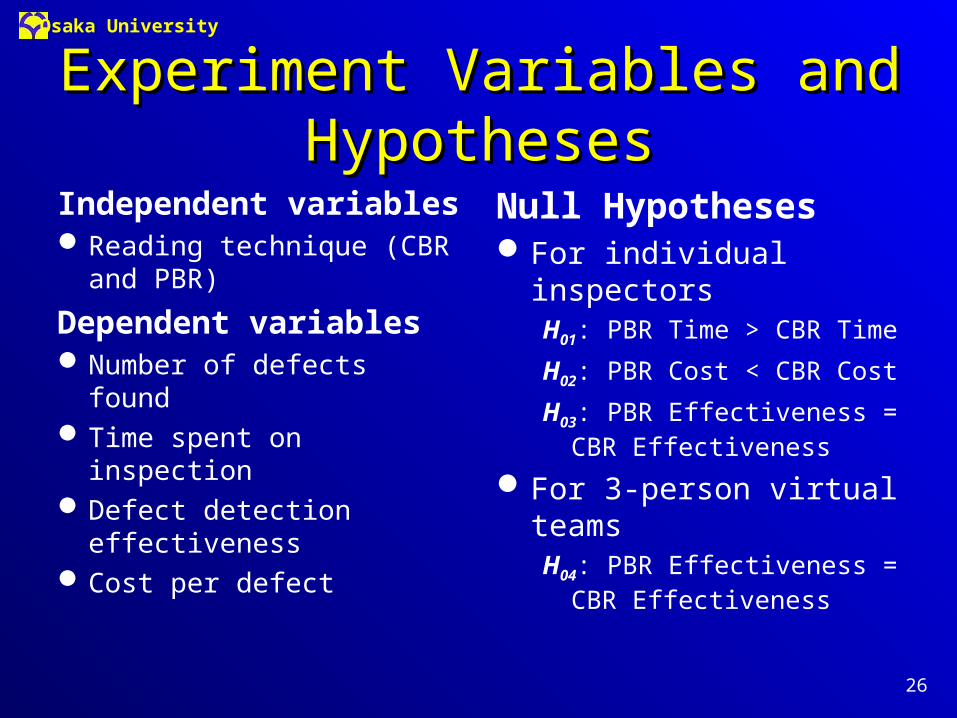
Experiment Variables and HypothesesExperiment Variables and Hypotheses
Independent variablesReading technique (CBR and
PBR)
Dependent variablesNumber of defects foundTime spent on inspectionDefect detection effectivenessCost per defect
Null HypothesesFor individual inspectors
H01: PBR Time > CBR Time
H02: PBR Cost < CBR Cost
H03: PBR Effectiveness = CBR Effectiveness
For 3-person virtual teamsH04: PBR Effectiveness = CBR
Effectiveness

27
Osaka University
Information systems inspectedInformation systems inspectedSeminar information system
System supports the process of a company which organizes seminars
Includes activities from seminar planning to issuing the qualification certificate
Designs relationships among personnel of seminar company, participants, lecturers, etc.
Hospital information system System supports the process of a hospital Includes activities such as patient registration, medical examination,
treatment, prescription of the medicines, etc. Designs the relationships among the personnel of a hospital,
patients, pharmacists, etc.

28
Osaka University
Collected dataCollected dataTwo types of data collected during experiment
Defect data Time data
Number of inspectors
Defects Inspection time (min)
Number of detectable
defects
Average number of
defects detected
max/min Average max/min
Seminar information system
PBR User 7 7 4.43 6 / 3 60.43 90 / 46
PBR Designer 6 6 5.00 6 / 4 65.50 80 / 51
PBR Implementer 6 9 6.50 9 / 5 76.67 95 / 40
CBR 11 15 10.55 13 / 8 74.64 90 / 62
Hospital information system
PBR User 7 7 4.43 6 / 3 48.29 70 / 25
PBR Designer 6 6 3.83 5 / 3 59.17 73 / 30
PBR Implementer 6 9 6.33 7 / 5 63.30 77 / 44
CBR 10 15 10.50 12 / 8 70.10 94 / 60

29
Osaka University
CBR ChecklistCBR ChecklistCHECKLISTLocate the following diagrams: Class Diagrams, Activity Diagrams, Sequence Diagrams and
Component Diagrams. Answer the questions related to corresponding diagrams. When you detect a defect, mark it on the diagram and fill the necessary information in the Defect registration form. If you have any comments write them in Comment form.
…
SEQUENCE DIAGRAMS
10. Aren’t there any inconsistencies among Sequence Diagram, Class Diagram and Requirements Specification?
yes no
11. Are all the necessary Objects and Messages defined? yes no
12. Is every Class from Class Diagram included in any of Sequence Diagrams and vice versa?
yes no
13. Is every Use Case from Use-Case Diagram implemented in at least one of Sequence Diagrams?
yes no
14. Are there no redundant elements (Objects of Messages) in Sequence Diagram?
yes no
…

30
Osaka University
PBR ScenarioPBR ScenarioDESIGNER SCENARIOAssume that you are the Designer of the system. The concern of the designer is to ensure that the
designer’s needs are completely satisfied in the following documents: Requirement specification, Class Diagram and Sequence Diagram. During the inspection process you will need to inspect those documents in order to detect defects in Class and Sequence Diagrams from designer’s point of view.
Please perform tasks following Step1 through Step3. For each step you must locate corresponding documents, follow the instructions and answer the given questions. When you detect a defect, mark it on the diagram and fill the necessary information in the Defect registration form. If you have some comments write them in Comment form.
Step 3 Locate the Class Diagram and Sequence Diagrams
Make a list of all Objects included in Sequence Diagrams and answer the following questions.
3.1. Are all the Objects of Sequence Diagrams defined in Class Diagrams?
Are all Classes of Class Diagrams defined in Sequence Diagrams?
3.2. Are all the Messages between objects Sequence Diagram defined as Methods of the corresponding Class in Class Diagram?
3.3. Are there no redundant elements in Sequence diagrams?

31
Osaka University
Defect registration formDefect registration form

32
Osaka University
Software development processSoftware development process The main steps of software development process
1. Development of Use-case diagrams2. Describing system activities in Activity diagrams3. Defining static structure of the system in Class diagrams 4. Modelling dynamic aspects of the system in Sequence diagrams 5. Detailed description of object states in Statechart diagrams6. Development of the Component diagrams
User’s perspective in our experiment covered the second, and partially the third and the fourth steps
Designer’s perspective covered the third and the fourth steps Implementer’s perspective covered the sixth step, and partially the
third and the fourth steps