Embed Size (px)
Citation preview

8/7/2019 Orographic Precipitation in the Tropics-Experiments in Dominica
http://slidepdf.com/reader/full/orographic-precipitation-in-the-tropics-experiments-in-dominica 1/19
Orographic Precipitation in the Tropics: Experiments in Dominica
R. B. SMITH AND P. SCHAFER
Yale University, New Haven, Connecticut
D. J. KIRSHBAUM
University of Reading, Reading, United Kingdom
E. REGINA
Me te o-France, Fort-de-France, Martinique
(Manuscript received 8 August 2008, in final form 23 October 2008)
ABSTRACT
The ‘‘natural laboratory’’ of mountainous Dominica (158N) inthe trade wind beltis used to study the physics
of tropical orographic precipitation in its purest form, unforced by weather disturbances or by the diurnal cycle
of solar heating. A cross-island line of rain gauges and 5-min radar scans from Guadeloupe reveal a large
annual precipitation at high elevation (7 m yr21) and a large orographic enhancement factor (2 to 8) caused
primarily by repetitive convective triggering over the windward slope. The triggering is caused by terrain-
forced lifting of the conditionally unstable trade wind cloud layer. Ambient humidity fluctuations associated
with open-ocean convection may play a key role. The convection transports moisture upward and causes
frequent brief showers on the hilltops. The drying ratio of the full air column from precipitation is less than 1%
whereas the surface air dries by about 17% from the east coast to the mountain top. On the lee side, a plunging
trade wind inversion and reduced instability destroys convective clouds and creates an oceanic rain shadow.
1. Motivation
Orographic precipitation supplies mountain glaciers
and rivers and provides water for irrigation, hydropower,
and human consumption. Air mass drying by orographic
precipitation reduces the humidity and precipitation in
downwind regions. Orographic precipitation is thought
to occur in all latitudes and climate zones on earth, but
the physical mechanisms may vary. Many examples of
orographic precipitation have been studied over the last
50 yr [see reviews by Banta (1990), Smith (2006), and
Rotunno and Houze (2007), among others], but almostall these studies have been in midlatitudes. A common
element of previous studies is that orographic precipi-
tation events were forced, either by a weather distur-
bance that is already precipitating, (e.g., frontal cyclone,
squall line, easterly wave, or hurricane) or by the diur-
nal cycle of solar heating. We have two objectives: (i) to
examine the physics of orographic precipitation in the
tropics and (ii) to identify a location with pure oro-
graphic precipitation with a dominance of mechanical
lifting and where neither weather disturbances nor di-
urnal forcing are needed.
One possible location for pure tropical orographic
precipitation is the big island of Hawaii at 208N (e.g.,
Woodcock 1960; Esteban and Chen 2008). During the
long warm season, precipitation is found almost every day
on the windward (east) coast. There is, however, a distinct
diurnal cycle to the precipitation there and argumentspersist about the relative importance of forced lifting by
terrain and thermally induced circulation as a cause of
precipitation. The mountain peaks are so high, and the
trade wind inversion so strong, that most air goes around
the island rather than over it. On the sheltered west coast,
a diurnal land–sea breeze occurs in the warm season. In
wintertime, cyclonic disturbances influence precipitation.
A second well-studied place is Taiwan at 238N lati-
tude (e.g., Yeh and Chen 1998). Although it does not lie
in the trade wind belt, it is subject to nearly steady
Corresponding author address:Professor Ronald B. Smith, Dept.
of Geology and Geophysics, Yale University, P.O. Box 208109,
New Haven, CT 06520–8109.
E-mail: [email protected]
1698 J O U R N A L O F T H E A T M O S P H E R I C S C I E N C E S VOLUME 66
DOI: 10.1175/2008JAS2920.1
Ó 2009 American Meteorological Society

8/7/2019 Orographic Precipitation in the Tropics-Experiments in Dominica
http://slidepdf.com/reader/full/orographic-precipitation-in-the-tropics-experiments-in-dominica 2/19
periods of monsoon wind. On the whole, however, the
location and size of Taiwan give it a complex precipi-
tation pattern, including frequent cyclonic disturbances
and a diurnal cycle.
Our search for a pure example of tropical orographic
precipitation led us to the island of Dominica at 158N in
the West Indies. It has a strong orographic enhance-ment and the processes involved repeat themselves day
after day. Another motivation for a Dominica study is
the dominance of orographically triggered convection
there. For the most part, previous studies of orographic
precipitation have ignored the details of triggered con-
vection because neither the observations nor the mod-
els could resolve it. Some relevant exceptions in mid-
latitude observations are Browning et al. (1974) for
South Wales, Smith et al. (2003) for the Alps, and Colle
et al. (2008) in western North America. No such ob-
servations are known for the tropics. Cloud-resolving
models have recently begun to capture triggered con-vection over terrain (e.g., Kirshbaum and Durran 2005;
Fuhrer and Schar 2005; Kirshbaum and Smith 2008),
but none of these numerical studies was focused on the
tropics.
2. Dominica as a natural laboratory
a. Geography of the island
The volcanic island of Dominica (158259N, 618219W) is
the most mountainous island in the Lesser Antilles
chain and receives the most precipitation (Reed 1926;Lang 1967). It lies midway between French islands of
Guadeloupe and Martinique in the easterly trade winds.
The island terrain forms a simple north–south ridge
(Fig. 1) but with higher peaks in the north and south
(e.g., Morne Diablotins, 1447 m and Morne Trois Pi-
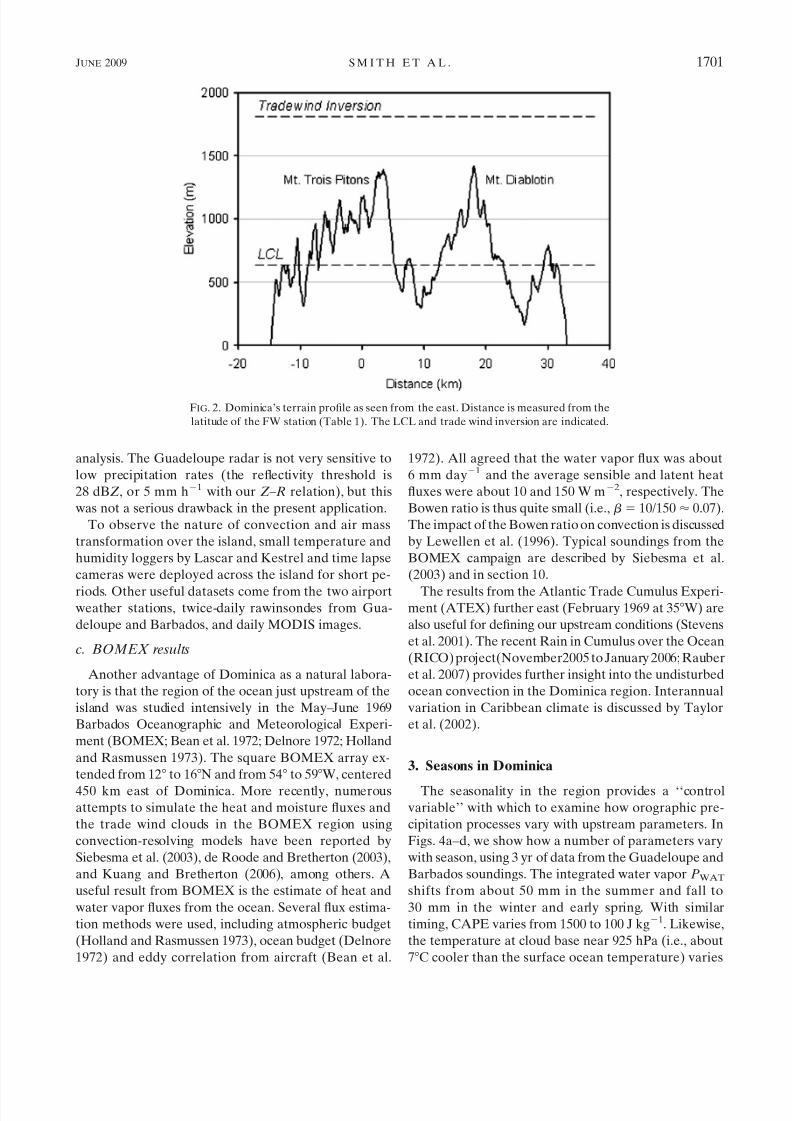
tons, 1424 m). As shown in Fig. 2, these mountains are
higher than the lifting condensation level (LCL) in the
region (;600 m) but lower than the trade wind inver-
sion (;1800 m). The dimensions of the island are about
17 km in the east–west direction by 45 km north–south.
Vegetation on the island grades from tropical rain forest
on the east coast to dry grasslands on the west coast. Theisland is known for its waterfalls, rushing rivers, and
flash floods. About half of the electrical energy for
72 000 inhabitants comes from hydropower.
Reed (1926) was the first to note the remarkable
rainfall gradients in Dominica. Reviewing the climate of
all the Caribbean islands, he wrote: ‘‘The most striking
example of a great difference in precipitation within a
few miles is found in Dominica. Roseau, on the western
coast, at an elevation of 25 feet, has a mean annual
precipitation of 78 inches, while Shawford, about 3 miles
to the northeast, at an elevation of 560 feet, has a mean
annual amount of 185 inches.’’
In 1935, Harrison (1935) published a geographic de-
scription of Dominica. She included a table showing
significant terrain enhancement of rainfall. A more
complete analysis of the precipitation distribution was
provided by Lang (1967) for the period 1920 to 1965. Heused monthly data from 80 rain collectors at plantations
on the island to draw contours of annual rainfall. His
data show a strong correspondence between rainfall and
elevation.
The lack of upstream terrain contributes to the lab-
oratory value of Dominica. The easterly trades blow
rather steadily against the island in all seasons (Fig. 3).
Several dozen back trajectories were run from Dominica
using the National Oceanic and Atmospheric Adminis-
tration (NOAA) Hybrid Single-Particle Lagrangian In-
tegrated Trajectory (HYSPLIT) model, based on the
gridded National Centers for Environmental Prediction(NCEP) reanalysis. These calculations show that air
parcels take about 4 days to cross the 4000-km width of
tropical Atlantic from the Canary or Azore Islands to
Dominica (i.e., about the same path as Columbus’ sec-
ond voyage, but 10 times faster). Most of the trajectories
show slow subsidence, with parcels typically descending
1 or 2 km during the Atlantic crossing.
b. Instrumentation
The Yale Dominica Precipitation Project began in
March 2007, with the objective of understanding the
mechanism of the orographic enhancement in tropicalDominica. Since then, eight HOBO tipping-bucket rain
gauges have been installed across the high mountains in
the southern part of the island (Table 1; Fig. 1). These
gauges record the time of each tip corresponding to
0.2 mm of precipitation. When data are downloaded every
5 months, the logger clocks have been found accurate to
better than 1 min, allowing detailed analysis of the rain
rate throughout the test period. The location of Fresh-
water Lake station is taken as a reference point in later
diagrams. In Table 1, the total 12-month precipitation is
given for four stations, and a 6-month total is given for
all eight stations during the dry season.The values in Table 1 confirm the relationship be-
tween rainfall and elevation found by Lang (1967). For
stations along the coast, however, Lang’s values are 30%
greater than our 2007/08 values. In addition to showing
the elevational control on precipitation, Table 1 com-
pares three pairs of gauges at similar elevation. On the
east coast, Rosalie and LaPlaine (5 km apart) receive
similar amounts of rain. On the highest terrain, Fresh-
water Lake and Boeri Lake (1.5 km apart) are in very
good agreement, including the day by day and hour by
JUNE 2009 S M I T H E T A L . 1699

8/7/2019 Orographic Precipitation in the Tropics-Experiments in Dominica
http://slidepdf.com/reader/full/orographic-precipitation-in-the-tropics-experiments-in-dominica 3/19
hour variations. On the west coast, Botanical Garden
and Canefield Airport (5 km apart) are quite different.
Canefield lies in the rain shadow of the high southern
hills, whereas Botanical Garden further south does not.A key aspect of Dominica that makes it an effective
natural laboratory is its proximity to the two conven-
tional Me te o-France 2.8-GHz S-band weather radars on
Guadeloupe and Martinique. These two radars are lo-
cated approximately 60 km north and south of the rain
gauge line across Dominica. The Guadeloupe radar,
with a beam angle of 1.28, is especially helpful because
it has very little beam blockage to the south (with the
exception of azimuth 1608 from true north). The 5-min,
200-km Guadeloupe radar scan is used in this paper with
the Z –R relationship Z 5 85R1.2 from Regina (2007),
where Z is the radar reflectivity and R is the rain rate in
mm h21. This Z–R relationship was recently optimized
for Hurricane Dean using with rain gauge data fromMartinique, and it agrees well with the rain gauges in
the present study. Other S-band radars, such as the
Weather Surveillance Radar–1988 Doppler (WSR-88D),
use a similar exponent (i.e., 1.2) in the tropics. For the
standard 0.58 PPI scan, the beam is about 1.5 km above
sea level at the distance of Dominica. A moderate ground
clutter–contaminated echo can be detected from the
northern peaks (Morne Diablotins, 1447 m) and occa-
sionally from the southern peaks (Morne Trois Pitons,
1424 m). Echo over both peaks was removed in our
FIG. 1. The terrain of Dominica with rain gaugelocations (see Table 1). Elevations derived
from NASA’s Shuttle Radar Topography Mission (SRTM). The Freshwater Lake (FW)
station is a reference point for other figures. The viewing site is Riviere Cyrique (Fig. 11).
1700 J O U R N A L O F T H E A T M O S P H E R I C S C I E N C E S VOLUME 66
8/7/2019 Orographic Precipitation in the Tropics-Experiments in Dominica
http://slidepdf.com/reader/full/orographic-precipitation-in-the-tropics-experiments-in-dominica 4/19
analysis. The Guadeloupe radar is not very sensitive to
low precipitation rates (the reflectivity threshold is
28 dBZ , or 5 mm h21 with our Z–R relation), but this
was not a serious drawback in the present application.
To observe the nature of convection and air mass
transformation over the island, small temperature and
humidity loggers by Lascar and Kestrel and time lapse
cameras were deployed across the island for short pe-
riods. Other useful datasets come from the two airportweather stations, twice-daily rawinsondes from Gua-
deloupe and Barbados, and daily MODIS images.
c. BOMEX results
Another advantage of Dominica as a natural labora-
tory is that the region of the ocean just upstream of the
island was studied intensively in the May–June 1969
Barbados Oceanographic and Meteorological Experi-
ment (BOMEX; Bean et al. 1972; Delnore 1972; Holland
and Rasmussen 1973). The square BOMEX array ex-
tended from 128 to 168N and from 548 to 598W, centered
450 km east of Dominica. More recently, numerousattempts to simulate the heat and moisture fluxes and
the trade wind clouds in the BOMEX region using
convection-resolving models have been reported by
Siebesma et al. (2003), de Roode and Bretherton (2003),
and Kuang and Bretherton (2006), among others. A
useful result from BOMEX is the estimate of heat and
water vapor fluxes from the ocean. Several flux estima-
tion methods were used, including atmospheric budget
(Holland and Rasmussen 1973), ocean budget (Delnore
1972) and eddy correlation from aircraft (Bean et al.
1972). All agreed that the water vapor flux was about
6 mm day21 and the average sensible and latent heat
fluxes were about 10 and 150 W m22, respectively. The
Bowen ratio is thus quite small (i.e., b5 10/150 ’ 0.07).
The impact of the Bowen ratio on convection is discussed
by Lewellen et al. (1996). Typical soundings from the
BOMEX campaign are described by Siebesma et al.
(2003) and in section 10.
The results from the Atlantic Trade Cumulus Experi-ment (ATEX) further east (February 1969 at 358W) are
also useful for defining our upstream conditions (Stevens
et al. 2001). The recent Rain in Cumulus over the Ocean
(RICO) project(November2005 to January 2006; Rauber
et al. 2007) provides further insight into the undisturbed
ocean convection in the Dominica region. Interannual
variation in Caribbean climate is discussed by Taylor
et al. (2002).
3. Seasons in Dominica
The seasonality in the region provides a ‘‘controlvariable’’ with which to examine how orographic pre-
cipitation processes vary with upstream parameters. In
Figs. 4a–d, we show how a number of parameters vary
with season, using 3 yr of data from the Guadeloupe and
Barbados soundings. The integrated water vapor P WAT
shifts from about 50 mm in the summer and fall to
30 mm in the winter and early spring. With similar
timing, CAPE varies from 1500 to 100 J kg21. Likewise,
the temperature at cloud base near 925 hPa (i.e., about
78C cooler than the surface ocean temperature) varies
FIG. 2. Dominica’s terrain profile as seen from the east. Distance is measured from the
latitude of the FW station (Table 1). The LCL and trade wind inversion are indicated.
JUNE 2009 S M I T H E T A L . 1701

8/7/2019 Orographic Precipitation in the Tropics-Experiments in Dominica
http://slidepdf.com/reader/full/orographic-precipitation-in-the-tropics-experiments-in-dominica 5/19
from 228 to 198C. By contrast, the wind speed (average
of 925- and 850-hPa values) has an almost semiannual
cycle between 6 and 10 m s21.
Two important derived parameters (not plotted) are the
horizontal water vapor flux F 05Ð ‘0 r qV Udz;P WATÁ U
and layer Froude number Fr 5 U / ffiffiffiffiffiffiffiffig0H p
(with g9 5
gDu/ u). The water vapor flux has a complicated time series
but generally lies between 200 and 400 kg m21 s21. The
Froude number definition uses the average wind and the
potential temperature difference (Du) between 700 and
925 hPa to compute the ratio of wind speed to the speed
of atmospheric gravity waves. The layer depth H is
taken to be about 1500 m, representing the height of the
combined static stability of the cloud layer and inver-
sion. With these choices, the Froude number varies
between Fr 5 0.25 and 0.5 (i.e., in the subcritical range
Fr , 1), indicating that gravity waves are able to
propagate upstream (see the appendix).
Precipitation also has a seasonal cycle (see Figs. 4e and
5). Over the ocean to the east of Dominica, where average
conditions are relatively uniform, satellite-derived Na-
tional Aeronautic and Space Administration (NASA)Global Precipitation Climatology Project (GPCP) data
provide estimates of the seasonal cycle of precipitation
(Adler et al. 2000). The precipitation for 3 yr for two grid
cells centered at 58.758W and at 13.758N and 16.258N,
respectively, is shown in Fig. 4e. The average annual
rainfall is about 700 mm. Although these satellite esti-
mates have their own errors, they provide another basis
for judging the orographic enhancement over Dominica.
This rainfall, about 2 mm day21, is less than the BOMEX
estimate of evaporation (6 mm day21) cited earlier.
The radar data from Guadeloupe (Fig. 5a) show
rainfall in four sampling areas for the period March2007 to March 2008. The undisturbed ocean patch
(75 km northeast of Dominica) shows about 8 mm day21
in the summer and fall, with only 1 mm day21 in the
winter and spring. It somewhat exceeds the GPCP sat-
ellite rainfall data in Figs. 4e and 5.
When averaged over the entire island of Dominica
(Fig. 5a), the precipitation is much larger, with 20 and
4 mm in the rainy and dry seasons, respectively. If we
sharpen the focus to a few pixels over the southern hills
(Mountain in Fig. 5a), we get a still larger precipitation:
30 mmday21 in the wet season and8 mm day21 in the dry
season. The driest region is found over the ocean down-stream of the island (Fig. 5a). This oceanic ‘‘rain shadow’’
receives 5 mm day21 in the wet season and 0.5 mm day21
in the dry season. As shown in the dashed curves (Fig. 5a),
the wet season 5 mm day21 in the rain shadow is mostly
due to a few large events, such as Hurricane Dean.
A similar seasonal cycle of precipitation is seen in the
data from four rain gauges (Fig. 5b). Generally speaking,
the radar and rain gauge values agree fairly well. For
FIG. 3. Wind rose for the Guadeloupe upper-air station for
the average 925- and 850-hPa level winds. Radius is the relative
frequency of soundings in a 108 azimuthal increment over a 3-yr
period (2005–07).
TABLE 1. Yale rain gauges on Dominica (see Fig. 1).
No. Location Elevation
Latitude
(north)
Longitude
(west) Install
PrecipitationApril 2007–March
2008 (mm)
PrecipitationJanuary–June
2008 (mm)
1 Rosalie (RO) 10 15822.4099 61815.2899 January 2008 — 743.2
2 LaPlaine (LP) 70 15819.9579 61814.8159 March 2007 2324.3 703.1
3 Grand Fond (GF) 262 15821.6399 61816.5509 January 2008 — 1120.04 Freshwater Lake (FW) 800 15820.4189 61818.5829 March 2007 6539.6 2753.4
5 Boeri Lake (BL) 877 15821.0999 61819.2119 January 2008 — 2868.7*
6 Springfield (SP) 400 15820.8609 61822.0809 March 2007 2948.2 847.4
7 Botanical Garden (BG) 30 15817.9229 61822.9429 August 2007 — 515.68 Canefield (CA) 10 15820.1149 61823.5609 March 2007 1395.2 353.2
* Corrected for lost data.
1702 J O U R N A L O F T H E A T M O S P H E R I C S C I E N C E S VOLUME 66

8/7/2019 Orographic Precipitation in the Tropics-Experiments in Dominica
http://slidepdf.com/reader/full/orographic-precipitation-in-the-tropics-experiments-in-dominica 6/19
example, at Freshwater Lake, the August area-averaged
radar value is 29 mm day21, while the rain gauge gives
37 mm day21. The radar value may be lower because it
includes some adjacent pixels over lower terrain with
less rain. In general, from Fig. 5 one gets the impression
that it rains heavily in all seasons on the high terrain in
Dominica. The coastal sites and nearby oceans have a
stronger seasonal cycle.
4. Orographic enhancement
The spatial pattern of orographic enhancement shown
in Fig. 6 is derived from a full year of Guadeloupe’s
5-min radar scans during easterly flow. Several days
with noneasterly flow were removed from the analysis,
as were Hurricane Dean on 17 August 2007 (Smith et al.
2009) and a large easterly wave event on 10 September
FIG. 4. Seasonal cycle of five smoothed environmental variables
for 3 yr (2005–07). (a)–(d) Data from the Guadeloupe and Barba-
dos upper air stations: (a) integrated water vapor (mm), (b) CAPE
(J kg21), (c) temperature at the 925-hPa level, and (d) wind speed
(m s21), averaged between the 850- and 925-hPa levels. (e) The
satellite-derived precipitation from the GPCP archive for two pixels
just upstream of Dominica.
JUNE 2009 S M I T H E T A L . 1703

8/7/2019 Orographic Precipitation in the Tropics-Experiments in Dominica
http://slidepdf.com/reader/full/orographic-precipitation-in-the-tropics-experiments-in-dominica 7/19
2007. A slight upstream enhancement is seen, extending
about 10 km upwind of the east coast. Over the island,the average rain rate roughly follows the terrain, with
isolated maxima over the high terrain in the north and
south. Precipitation drops off steeply on the western
leeward slopes and a dry rain shadow is seen over the
ocean 25 km west of the island. The only significant
precipitation in the rain shadow occurs during those few
disturbed days each year when the wind is not easterly.
Another view of theenhancementis shown in theeast–
west transect across the southern mountains (Fig. 7).
In this diagram, days have been divided into three types
according to the amount of precipitation over the sea
upwind (type 1: ,2 mm day21; type 2: 2–10 mm day21;type 3: 10–25 mm day21). In general, the radar and rain
gauge data agree well. Under dry type-1 conditions
(most days), the average rain rate increases from about
1 mm day21 upwind to 8 mm day21 over the highest
terrain. The enhancement factor (i.e., the ratio of
mountain to upstream precipitation) is 8. On wetter
days, the enhancement as an absolute amount is greater,
but the enhancement factor is smaller, about 2 to 3.
Again, the lee region is much dryer than the undisturbed
upwind region.
FIG. 5. Seasonal cycle of precipitation for 1 yr from (a) Guadeloupe’s radar and (b) four
rain gauges (Table 1). In (a), data are averaged over a large area upstream and downstream,
namely the area of Dominica and a small area near Mt. Trois Pitons; upstream GPCP dataare also included. Dotted curves have removed a few large events in the rainy season.
1704 J O U R N A L O F T H E A T M O S P H E R I C S C I E N C E S VOLUME 66

8/7/2019 Orographic Precipitation in the Tropics-Experiments in Dominica
http://slidepdf.com/reader/full/orographic-precipitation-in-the-tropics-experiments-in-dominica 8/19
Monthly enhancement factors are given in Table 2.
For rain gauge data we use LaPlaine as the upstream
reference whereas for radar data we use the upstreamocean region. The former enhancement factor ranges
from 2 to 5; the latter, with a dryer reference point,
ranges mostly from 4 to 10. The rain gauge data show a
larger enhancement in the dryer months of January
through April.
5. Diurnal modulation
In many parts of the world, over both land and sea,
the diurnal cycle of solar heating influences the oc-
currence of convective precipitation (e.g., Bell and
Reid 1993). Diurnal control in Dominica would not besurprising because the island’s surface has a large di-
urnal range in temperature, reaching 78C on the lower
slopes (Smith et al. 2009). To determine the diurnal
cycle in precipitation near and over Dominica, we use
the radar and rain gauge data (Fig. 8). To reduce
noise, the rain amount is summed into twelve 2-h
segments. Several large events such as Hurricane
Dean on 17 August were removed. Because only 1 yr
of data was analyzed, there are statistical limitations
on how well we can constrain the amplitude of the
diurnal cycle. In Fig. 8, neither the radar nor rain
gauge data shows a significant diurnal cycle, although
we cannot rule out a possible 20% morning maximumin the mountain precipitation. The implication of the
absent diurnal modulation in precipitation is that the
triggering of convective precipitation over Dominica
is purely due to mechanical lifting of the airstream.
The convection caused by daytime solar heating plays
little role.
The lack of diurnal effect on precipitation can be
partly explained with an order-of-magnitude estimate of
the vertical velocity that results from island heating.
According to the steady-state hydrostatic solutions of
Smith and Lin (1982), the dimensionless ratio of vertical
velocities caused by heat and terrain (with values in SIunits) is
W HEAT
W Terrain5
gFL
r C P ThU 3
’(9.8)(300)(15 000)
(1.2)(1004)(300)(1000)(83)’3 3 10À4,
where F , L, H , T , and U are the sensible heat flux, island
width, hill height, temperature, and wind speed, re-
spectively. In this example, the heat effect is negligible.
FIG. 6. Averaged daily precipitation over Dominica derived from the Guadeloupe radar for
the period March 2007–February 2008 during easterly flow. Contour interval is 2 mm day21.
Maximum rate is 14 mm day21 (i.e., 5100 mm yr21). Note the slight upwind enhancement and
the ocean rain shadow to the west. The dashed line is the transect shown in Fig. 7.
JUNE 2009 S M I T H E T A L . 1705

8/7/2019 Orographic Precipitation in the Tropics-Experiments in Dominica
http://slidepdf.com/reader/full/orographic-precipitation-in-the-tropics-experiments-in-dominica 9/19
Heating could dominate if the island were wider and
flatter in a weaker wind.
6. Rain rate statistics
Visitors to Dominica quickly discover that rain there
comes in short bursts, as it does in many other tropical
locations. Extensive time-lapse photography of cloudsover the windward slopes confirms the rapid development
of convective cells over the island, with little occurrence
of stratiform clouds. The dominance of convective pre-
cipitation can be shown with a rain rate histogram (Fig. 9).
The ordinate of this diagram is the percent that each
rain rate contributes to the total annual precipitation.
By this measure, the rain gauge (Fig. 9a) and radar (Fig.
9b) data agree. Both show a peak in the rain rate his-
togram near 40 mm h21. This large rain rate suggests a
brevity to the rainfall. At Freshwater Lake, for exam-
ple, the typical duration of heavy precipitation is the
ratio of average rain rate to the typical rain rate; thatis, T 5 (0.6 mm h21)/(40 mm h21) 5 0.015 h h21, or
22 min day21.
For reference purposes, we include in Fig. 9 a rain
rate histogram from North Haven, Connecticut (418N),
from the same instrument over a 9-month period. The
peak rate of 3 mm h21 is an order of magnitude weaker
than the Dominica peak rain rate.
The statistical relationships between pairs of stations
are also informative. Gauge data from each site were
averaged over different intervals (e.g., 1 h, 12 h, etc.)
and then compared with other sites using scatterplots
and correlations. The rainfall at Rosalie and LaPlaine
on the east coast (5 km apart) correlate with R-squared
values of 0.28, 0.37, 0.41, 0.61, and 0.61 for averagingintervals of 1,12, 18, 24, and 48 h, respectively. Thus,
these two stations seldom experience the same con-
vective cell, but they do experience the same cluster of
cells or weather systems. By contrast, Freshwater and
Boeri Lakes, 1.5 km apart on high ground, have
R-squared values of 0.75 and 0.9 for 1 and 12 h; thus,
they usually experience the same cells. If the typical cell
diameter is about 3 km (i.e., between 1.5 and 5 km) and
the cell speed is 7 m s21, the typical shower duration
would be 430 s. Using the daily duration of 22 min, the
typical daily number of events at a particular point is
N 5 1320 s/430 s ’ 3. Other statistical methods mightyield different estimates.
7. Properties of the incoming flow
As we develop hypotheses for the precipitation
physics in Dominica, it is necessary to have some infor-
mation about the fluctuations in the incoming flow. In
addition to the BOMEX literature, the simplest and
least expensive method for characterizing the inflow
is to monitor the temperature, humidity, and wind at
the east coast beach. A portable Kestrel 4500 weather
logger (manufactured by Nielsen–Kellerman) was placedat LaPlaine beach for this purpose. The sensor height
was 2 m and it was placed 3 m horizontally from the
water line. At this location some errors could arise from
nearby breaking ocean waves and spray, but good dew-
point agreement was found with higher sensors and with
sensors further back from the beach.
The Kestrel sensors can record several hours of data
with a sampling interval of 10 s and they have a NIST
traceable calibration. Prior to the experiment, using square
wave inputs with moderate ventilation, we determined
FIG. 7. Averaged daily precipitation along an east–west Dom-
inica transect for the period March 2007–February 2008 derived
from the Guadeloupe radar and four rain gauges. Days are divided
into three groups based on the intensity of precipitation at sea.
Type 1 has , 2 mm day21, type 2 has 2–10 mm day21, and type 3
has . 10 mm day21. Only days with easterly flow are included.
TABLE 2. Monthly orographic enhancement factors.
Month 2007/08 Rain gauge Radar
March 4.1 8.4
April 5.4 4.9
May 3.3 5.5
June 2.8 1.8
July 2.5 4.4August 2.8 10.1
September 2.0 6.5
October 1.8 3.1
November 2.7 17.2
December 2.7 7.1
January 4.3 7.9
February 4.8 8.5
Total 2.8 4.6
1706 J O U R N A L O F T H E A T M O S P H E R I C S C I E N C E S VOLUME 66

8/7/2019 Orographic Precipitation in the Tropics-Experiments in Dominica
http://slidepdf.com/reader/full/orographic-precipitation-in-the-tropics-experiments-in-dominica 10/19
that the Kestrel wind sensor responds within 3 s to sud-
den changes whereas the temperature and humidity
sensors require about 15 s for an 80% approach to the
correct value. The mean measured temperature and hu-
midity values were verified with portable Lascar sensors.
A short time series from LaPlaine beach for midday
on 29 June 2008 (Fig. 10; Table 3) shows little variation
in temperature T but does indicate dewpoint fluctua-tions T d of 18C. Wind speed varied between 2.5 and
4.5 m s21. The small relative magnitude of the temper-
ature fluctuations compared to the dewpoint fluctuations
(see Woodcock 1960) is consistent with the small Bowen
ratio found in BOMEX. The large eddies are trans-
porting more water vapor than heat. Similar Kestrel
deployments in other locations have always given a ratio
of temperature to dewpoint variance in qualitative pro-
portionality to the Bowen ratio. The inverse correlation
between dewpoint and wind speed indicates, as expected,
that convection over the sea is transporting water vapor
upward and westward momentum downward.
The observed fluctuation in dewpoint is relevant to
convective triggering because the dewpoint depression
(DPD5T 2T d) is linked to the lifting condensation level
[i.e., Z LCL(m) ’ 120 3 DPD]. With a constant tempera-
ture of 288C, parcels with dewpoint of 248 or 258C will
have LCLs of 480 or 360 m respectively. Sudden larger
shifts in dewpoint are sometimes observed at LaPlaine,
associated with the arrival of small offshore air masses.
FIG. 8. Diurnal cycle of Dominica’s precipitation from (a)
Guadeloupe radar and (b) rain gauges. Areas and gauges are the
same as in Fig. 5. Data from a 1-yr period is averaged in 2-h blocks.
Several large events were removed.
FIG. 9. Rain rate histogram from (a) rain gauges and (b) Gua-
deloupe radar. Areas and gauges are the same as in Fig. 5. Data
from three large events on 17 August, 10 September, and 26–27October have been removed. The rain gauge plot includes data
from a midlatitude site (North Haven, CT) over a similar period
with the same instrument. The radar plot includes open-ocean data
from the Martinique radar.
JUNE 2009 S M I T H E T A L . 1707

8/7/2019 Orographic Precipitation in the Tropics-Experiments in Dominica
http://slidepdf.com/reader/full/orographic-precipitation-in-the-tropics-experiments-in-dominica 11/19
The qualitative nature of the incoming cloud field was
determined using many hours of time-lapse photogra-
phy from a viewing site at Riviere Cyrique (Fig. 1).
Looking east, groups of cumulus castellanus (Fig. 11)
drift against the island with no evident deflection. Only
a small fraction of these clouds precipitate over the sea.
About half form small anvils at the trade wind inversion.
Although some of the anvils have virga, virga are notseen below cloud base. A few clouds penetrate the in-
version to higher altitudes. Aloft, cirrus layers drift in
different directions on different days. Looking north
over the windward slopes of the island, the cloud bases
thicken and rapid tower growth occurs.
8. Air mass drying
A useful measure of orographic precipitation is the
drying ratio (DR), the fraction of incoming water vapor
flux removed from the atmosphere by precipitation over
the mountain. The ambient water vapor flux, derivedfrom the Guadeloupe sounding, is typically F 0 5 300
kg m21 s21 (section 3). The total water vapor removed
by orographic precipitation is estimated by integrating
the east–west distribution of average precipitation rate
in Fig. 7
P TOT5
ð X 2
X 1
(P À P 0)dx, (1)
where P 0 is the upstream precipitation—for the three types
in Fig. 7, with values of P TOT 5 1.2, 2.4, 3.5 kg m21 s21
giving drying ratios of
DR5P TOT/F 0 50.004, 0.008, 0.012. (2)
These small values of drying ratio (0.4% to 1.2%)
contrast strikingly with recent estimates of DR in the
30%–50% range for major midlatitude mountain ranges
(e.g., Smith and Evans 2007) and are surprising given
the large annual rainfall at Freshwater Lake (i.e., 7 m).
One implication of the small DR is that the net loss of water from the airstream by precipitation could not be
the cause for the rain shadow to the west. The rain shadow
must be caused by other factors.
Another measure of air mass drying is the change in
specific humidity at the surface across the island. The
specific humidity across the southern part of the island
was determined during a 1-week deployment of six
Lascar temperature/humidity sensors and a number of
shorter deployments of Kestrel sensors at locations
FIG. 10. Short time series of temperature, dewpoint, and wind speed at LaPlaine beach on
the east coast of Dominica on 29 Jun 2008.
TABLE 3. East coast/mountain thermodynamic comparison
(typical June/July 2008).
Attribute LaPlaine beach Freshwater lake
Latitude 15820.6709N 15820.4189N
Longitude 61814.9159W 61818.5829W
Elevation (m) 0 800
Pressure (hPa) 1014 932
Temperature (8C) 28 21.5
Standard deviation (8C) 0.1 0.2
Dewpoint (8C) 25 21
Standard deviation (8C) 0.4 0.3Specific humidity 0.0197 0.0163
1708 J O U R N A L O F T H E A T M O S P H E R I C S C I E N C E S VOLUME 66

8/7/2019 Orographic Precipitation in the Tropics-Experiments in Dominica
http://slidepdf.com/reader/full/orographic-precipitation-in-the-tropics-experiments-in-dominica 12/19
across the island. Whereas other sites show significant
diurnal modulation of dewpoint, the LaPlaine beach site
on the east coast and the high-elevation saddle atFreshwater Lake do not. Typical properties at the beach
and mountain sites for the period 29 June–4 July 2008
are given in Table 3.
The dramatic 17% decrease in specific humidity be-
tween the east coast beach and mountain top has two
possible explanations. A sharp isolated hill with flow
splitting would penetrate into the atmosphere, sampling
dryer air aloft. Freshwater Lake, however, is a saddle in
the terrain at 800 m, surrounded by peaks reaching 1200
to 1400 m. Air is more likely to stream toward this site
than to split around it. A second and more likely ex-
planation is that the surface air has lost water vapor byvertical mixing. The air aloft is generally quite dry in the
‘‘trade wind tropics’’ due to subsidence. Mixing will
transport water vapor upward and bring dry air to the
surface. The mixing arises from the same vigorous
convection that brings precipitation to the peaks.
This drop in surface specific humidity (17%) is more
than an order of magnitude greater than the drying ratio
derived from the average precipitation rate (2), sug-
gesting that far more water is transported upward than
is precipitated (see also Smith et al. 2003; Kirshbaum
and Smith 2008). Because neither the precipitation nor
the air mass drying varies diurnally, the vertical mixing
must be driven by mechanical lifting and instabilityrather than solar heating. Further drying may occur along
the lee slopes, but we have not measured this change.
9. Case studies
To improve our understanding of precipitation physics
in Dominica, we used the rain gauge data from Fresh-
water Lake in 2007 to select, from hundreds of precipi-
tation events, nine events that coincided with Moderate
Resolution Imaging Spectroradiometer (MODIS) over-
passes. Thermal band data with 1-km resolution and re-
flective band data with 500-m resolution were examined.In addition, the 5-min radar scans from Guadeloupe were
studied for each case. These cases are summarized in
Table 4. The upstream ocean rainfall (i.e., upstream in-
dex) and the cloud top temperatures vary widely, and
neither correlates with Freshwater Lake rainfall. Cases 2
and 4 with the largest CAPE have the coldest cloud top
temperatures. Otherwise, the cloud tops were little
colder than the inversion.
The example of 29 September 2007 (case 4 in Table 4)
was reasonably representative of days with little ocean
FIG. 11. Photograph of trade wind cumuli to the east of Dominica. These clouds are drifting towards the camera
location at the Riviere Cyrique viewing site (Fig. 1).
JUNE 2009 S M I T H E T A L . 1709

8/7/2019 Orographic Precipitation in the Tropics-Experiments in Dominica
http://slidepdf.com/reader/full/orographic-precipitation-in-the-tropics-experiments-in-dominica 13/19
precipitation and repeated precipitation events over the
island. The accumulated gauge precipitation (Fig. 12)shows the brevity and frequency of rain pulses charac-
teristic of Dominica and the large orographic en-
hancement. The 24-h accumulated radar precipitation
‘‘streakplot’’ (Fig. 13) shows the generation and move-
ment of convective systems near the island. A wind-
oriented Hovmo ller plot through Freshwater Lake (Fig. 14)
shows at least six independent cells forming and dying
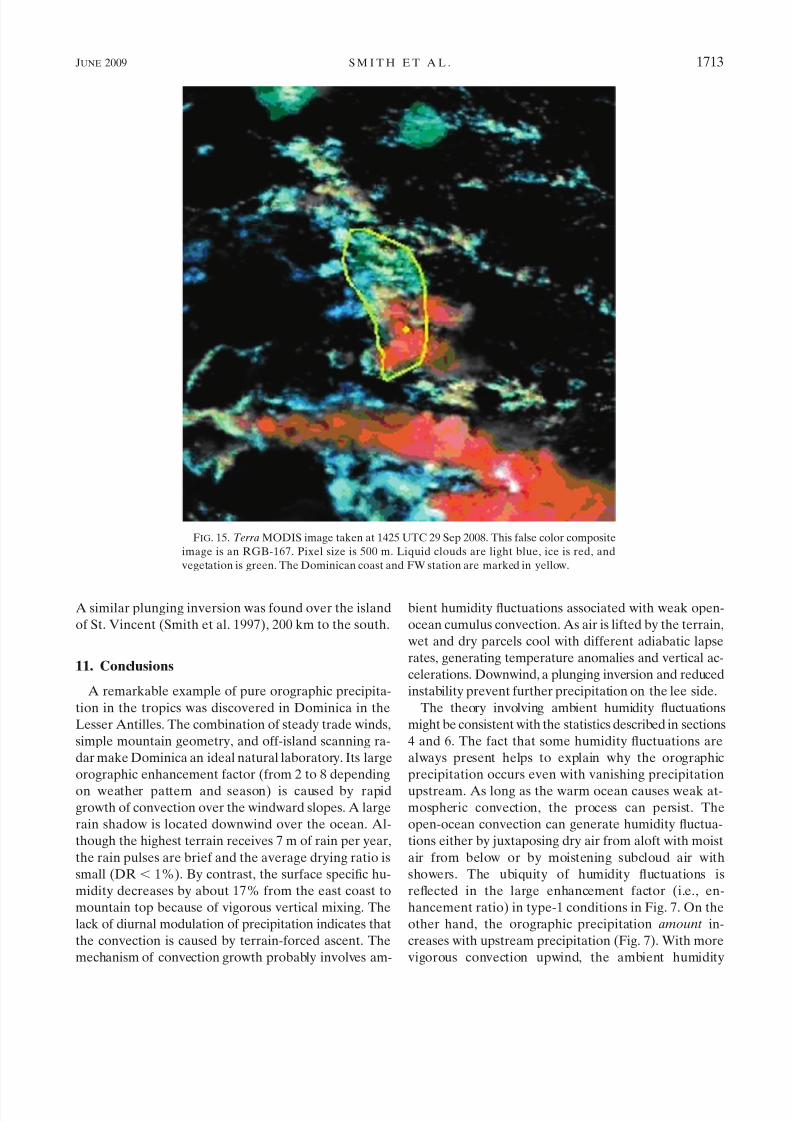
over the island. An instantaneous MODIS snapshot is
shown in Fig. 15. By using mid-IR bands we can dif-
ferentiate ice and liquid clouds. The rain from the large
east–west-oriented cell south of Dominica in the image
(Fig. 15) can be identified in Fig. 13. Overall, the fre-quent weak convective events over the island are more
relevant to the full precipitation climatology than these
occasional larger ocean events (Fig. 6).
10. Conceptual model of convective triggering
To understand the mechanism of convective develop-
ment over Dominica, we consider two theories, both
related to the conditional instability in the ambient flow.
Before discussing these slightly different theories, we
describe the properties of the ambient flow and the na-
ture of the lifting by the terrain.According to Holland and Rasmussen (1973) and
Siebesma et al. (2003), the lower part of the typical
BOMEX sounding consists of three layers (Fig. 16).
From the surface to about 500 m, the lapse rate is dry
adiabatic, with temperature dropping from 288C at the
sea surface to 238C. The relative humidity increases from
about 80% at the sea surface to 90% at the top, while the
specific humidity decreases upward from about 17 g kg21
at the sea surface to 16 g kg21. In the cloud layer, from
500 to 1500 m, the average dewpoint depression is about
28 and the relative humidity is about 90% (i.e., unsatu-
rated). The lapse rate is about 26.68C km21
and themoist adiabat has a slope of 24.68C km21, making the
layer conditionally unstable. The specific humidity de-
creases upward from 16 to 11 g kg21. The temperature
at the top of the cloud layer is about 178C. The third
layer is the trade wind inversion, from 1500 to 2000 m,
with potential temperature increasing rapidly and spe-
cific humidity decreasing upward. This three-layer
structure is the balanced result of competing influences
of large-scale subsidence and advection and small-scale
convection (Siebesma et al. 2003).
As the surface air in the easterly trade wind encoun-
ters the;0.15 slope of the island’s higher terrain, it riseswith a typical vertical speed of 1 m s21, cools adiabati-
cally, and quickly reaches the LCL. Aloft, near the
TABLE 4. Case studies in 2007.
Case 1 2 3 4* 5 6 7 8 9
Date 4/29 7/23 9/23 9/29 10/9 10/15 11/2 11/23 11/26
Image time (UTC) 1430 1450 1500 1425 1500 1425 1410 1430 1500
Upstream index (mm day21) 2.73 12.04 2.97 2.17 0.50 0.49 0.36 0.23 2.1
Wind speed (m s21) 10.5 11.6 3.7 9.5 4.4 9.5 9.8 4.3 12.1
Wind direction 100 85 124 95 98 93 105 80 81CAPE (J kg21) 40.2 2476.6 421.5 2001.3 424.84 0 756 0 4.35
Gauge precipitation (mm)
LP 33.4 2.2 0 13.4 0.2 5.4 3.0 14.6 2.8
FW 36.2 23.8 31.0 100.4 8.8 17.2 29.8 79.2 29.6
SF 4.4 15.6 55.8 30.0 0 6.4 7.0 6.4 28.4
CF 1.4 8.2 13.0 4.2 0 1.2 0.4 2.4 14.8
Cloud top temp. (8C) 5.9 263.1 9.2 230.8 10.3 10.7 15.4 12.1 22.6
Ocean temp. (8C) 28.5 28.1 26.0 26.9 29.3 24.8 28.1 29.4 28.9
* See Figs. 12–15.
FIG. 12. Accumulated precipitation (mm) from four rain gauges on
29 Sep 2007.
1710 J O U R N A L O F T H E A T M O S P H E R I C S C I E N C E S VOLUME 66

8/7/2019 Orographic Precipitation in the Tropics-Experiments in Dominica
http://slidepdf.com/reader/full/orographic-precipitation-in-the-tropics-experiments-in-dominica 14/19
inversion, we assume that that the air does not lift ap-
preciably. In subcritical hydraulic flow, a stable layer
will rise or descend only slightly as the air approaches a
ridge top (see the appendix). In between, the lower half of the cloud layer from 500 to 1000 m lifts with a slower
vertical velocity; cooling slightly and reaching satura-
tion (Fig. 16).
The first theory we consider is that of Kirshbaum and
Durran (2005) and Fuhrer and Schar (2005). As air is
lifted, the conditionally unstable cloud layer is brought
uniformly to saturation. All that is needed for convective
development is a perturbation to start the exponential
growth. The e-folding time scale can be estimated from
the moist stability frequency using the moist adiabatic
(GM ) and actual (g ) lapse rates,
N 2M ’g
T
(g À GM )’ À0.00005 sÀ2, (3)
so the e-folding growth time is T 5 1/N M 5 141s.
Considering that parcels take 1000 s to move from the
east coast to the mountain peaks, small disturbances
have 1000/141 ; 7 e-foldings of growth with an ampli-
fication of about e7;1000. The initial perturbation
could arise from existing temperature fluctuations in the
ambient flow or inhomogeneities in the pattern of lifting
caused by the rough terrain. This exponential growth
would continue until nonlinearities begin, such as the
desaturation of the descending air.
There are two weaknesses to this theory. First, with a
no explicit proposal for the source of the small fluctu-ations, no estimates of convection strength can be made.
Thus, it is an incomplete theory. The observed ambient
temperature fluctuations in Fig. 10 are very small and
not accurately known. Second, as the convection begins
to grow, downdrafts may develop fairly early in the
development. If downdrafts occur, they will quickly
desaturate the air so that our assumption of a fully
saturated layer is violated. The moist stability frequency
(3) would not give an accurate growth rate estimate in a
cloud field with saturated updrafts and dry downdrafts.
If the spatial variation in humidity is sufficiently large,
there never will be a moment when the lifted layer isfully saturated.
The second theory we consider is the bulk lifting of
the conditionally unstable layer with embedded satu-
rated and unsaturated parcels (Woodcock 1960). Two
lines of evidence support the existence of these hu-
midity fluctuations. As seen in Fig. 11, there are trade
wind cumuli, with small cloud fraction, constantly drift-
ing toward the island. These clouds have greater hu-
midity than the surrounding air. Furthermore, according
to the surface data in Fig. 10, there are dewpoint
FIG. 13. Accumulated precipitation (mm) near Dominica on 29 Sep 2007 from the
Guadeloupe radar. Contour interval is 20 mm. Line shows transect for the Hovmo ller plot
in Fig. 14.
JUNE 2009 S M I T H E T A L . 1711

8/7/2019 Orographic Precipitation in the Tropics-Experiments in Dominica
http://slidepdf.com/reader/full/orographic-precipitation-in-the-tropics-experiments-in-dominica 15/19
fluctuations of about 18C in the ambient flow, even at
the surface. These fluctuations are caused by the weak
trade cumulus convection over the sea upwind. As this
heterogeneous layer is lifted by the terrain, the cloudy
and dry air will cool adiabatically at different rates,
quickly generating temperature differences approach-
ing 18C. A temperature anomaly of 18 produces an ac-
celeration of g9 5 g(DT /T ) ’ 0.03 m s22. After only 100
s, this acceleration will produce a vertical velocity of 3 m
s21. Similarly, if heterogeneous air in the subcloud layer
is lifted by the terrain, the moist parcels will reach theirLCLs first. A dewpoint difference of 18C gives an LCL
difference of 120 m. As moist and dry parcels lift to-
gether by 120 m moving along different adiabats, they
quickly generate a temperature difference approaching
18C. Unlike the first theory, this theory is not invalidated
by the coexistence of saturated and unsaturated air.
In a companion paper (Kirshbaum and Smith 2009),
large-eddy simulations of tropical orographic convec-
tion are carried out to discover the mechanism of con-
vective growth over Dominica. Those results favor the
latter theory in which the ambient humidity fluctuations
play a key role, along with conditional instability. This
dependence of orographic precipitation on weak up-
stream heterogeneity and convection casts doubt on the
old paradigm that knowledge of the mean upstream
sounding and the terrain geometry is sufficient to predict
orographic precipitation. The simulation of Dominica
rainfall requires the consideration of the shallow trade
wind convection upwind and the related humidity fluc-
tuations.
The sudden disappearance of clouds and precipitationon the lee side of the island is probably due to two ef-
fects. First, the convection over the windward slope
dries the surface air and removes any column instability
(section 8). Second, the plunging of the trade wind in-
version over the lee slopes warms the air adiabatically.
According to dry hydrostatic ‘‘hydraulic’’ theory, a
layer of dense fluid flowing with Fr , 1 will descend
slightly over the windward slope and plunge violently
(like a waterfall) over the lee slope. With Fr ; 0.25–0.5
(section 3), this behavior will be robust (see appendix).
FIG. 14. A wind-oriented Hovmo ller plot through the FW reference point for 29 Sep 2007
(mm h21). Vertical lines indicate the coasts of Dominica. Horizontal line is the time of the
MODIS image in Fig. 15.
1712 J O U R N A L O F T H E A T M O S P H E R I C S C I E N C E S VOLUME 66
8/7/2019 Orographic Precipitation in the Tropics-Experiments in Dominica
http://slidepdf.com/reader/full/orographic-precipitation-in-the-tropics-experiments-in-dominica 16/19
A similar plunging inversion was found over the island
of St. Vincent (Smith et al. 1997), 200 km to the south.
11. Conclusions
A remarkable example of pure orographic precipita-
tion in the tropics was discovered in Dominica in the
Lesser Antilles. The combination of steady trade winds,
simple mountain geometry, and off-island scanning ra-
dar make Dominica an ideal natural laboratory. Its large
orographic enhancement factor (from 2 to 8 depending
on weather pattern and season) is caused by rapidgrowth of convection over the windward slopes. A large
rain shadow is located downwind over the ocean. Al-
though the highest terrain receives 7 m of rain per year,
the rain pulses are brief and the average drying ratio is
small (DR , 1%). By contrast, the surface specific hu-
midity decreases by about 17% from the east coast to
mountain top because of vigorous vertical mixing. The
lack of diurnal modulation of precipitation indicates that
the convection is caused by terrain-forced ascent. The
mechanism of convection growth probably involves am-
bient humidity fluctuations associated with weak open-
ocean cumulus convection. As air is lifted by the terrain,
wet and dry parcels cool with different adiabatic lapse
rates, generating temperature anomalies and vertical ac-
celerations. Downwind, a plunging inversion and reduced
instability prevent further precipitation on the lee side.
The theory involving ambient humidity fluctuations
might be consistent with the statistics described in sections
4 and 6. The fact that some humidity fluctuations are
always present helps to explain why the orographic
precipitation occurs even with vanishing precipitation
upstream. As long as the warm ocean causes weak at-mospheric convection, the process can persist. The
open-ocean convection can generate humidity fluctua-
tions either by juxtaposing dry air from aloft with moist
air from below or by moistening subcloud air with
showers. The ubiquity of humidity fluctuations is
reflected in the large enhancement factor (i.e., en-
hancement ratio) in type-1 conditions in Fig. 7. On the
other hand, the orographic precipitation amount in-
creases with upstream precipitation (Fig. 7). With more
vigorous convection upwind, the ambient humidity
FIG. 15. Terra MODIS image taken at 1425 UTC 29 Sep 2008. This false color composite
image is an RGB-167. Pixel size is 500 m. Liquid clouds are light blue, ice is red, and
vegetation is green. The Dominican coast and FW station are marked in yellow.
JUNE 2009 S M I T H E T A L . 1713

8/7/2019 Orographic Precipitation in the Tropics-Experiments in Dominica
http://slidepdf.com/reader/full/orographic-precipitation-in-the-tropics-experiments-in-dominica 17/19
fluctuations will be larger, seeding more convection
over the island.
The evidence for convective triggering presentedhere contrasts with Dominica’s rainfall physics during
Hurricane Dean in August 2007 (Smith et al. 2009).
With Dean’s high winds and supercritical Froude num-
bers, no convection could be triggered by the terrain.
Orographic enhancement then was due to the seeder–
feeder mechanism acting within a hurricane rainband.
Future research on Dominica precipitation will use
high-resolution numerical simulation to investigate the
details of how convection is triggered in rapidly rising
conditionally unstable air with pre-existing perturba-
tions (Kirshbaum and Smith 2009). Direct in situ ob-
servations of cloud structure over the island may berequired to clarify the physics of convective growth. The
suggested role of ambient humidity fluctuations could
be tested with upstream monitoring. Cloud microphys-
ics has also been neglected so far. Finally, we would like
to know if orographic precipitation in other tropical
regions has similar physics to that in Dominica.
Acknowledgments. Thanks to the people and gov-
ernment of the Commonwealth of Dominica for hosting
this research, especially the Divisions of Agriculture
and Forestry. Special thanks to Arlington James of the
Forestry Division who helped to find sites for the gauges
and shared existing rain collector data. Thanks also toNathaniel Isaac from the Met Office, Nancy Osler from
the Archbold Tropical Research and Education Center,
Verna Dejean Frederick from the Grand Fond School,
Joyce Pascal and Jem Winston of Rosalie, and Ricky
Brumant from the Agricultural Training Center. Sigrid
R.-P. Smith assisted with the field work. Larry Bonneau
assisted with the image analysis. The MODIS image was
provided by NASA. NOAA supports the HYSPLIT
model. Sounding data came from the University of Wy-
oming website. David Bolvin from NASA assisted with
the GPCP data. This research was supported by Me te o-
France and by a grant to Yale University from the Na-tional Science Foundation (ATM-112354).
APPENDIX
Airflow and Inversion Dynamics
As a background to the precipitation problem, we
outline the fluid dynamics of airflow past Dominica using
the idealized hydrostatic equations for a single layer of
FIG. 16. Schematic of the BOMEX sounding and convection triggering. The upstream
sounding has three layers: the subcloud dry layer (0–500 m), the cloud layer (500–1500 m),
and the inversion (1500–2000 m). The cloud layer is conditionally unstable but subsaturated.
Forced lifting brings the lower part of the cloud layer to saturation, triggering convection.
1714 J O U R N A L O F T H E A T M O S P H E R I C S C I E N C E S VOLUME 66

8/7/2019 Orographic Precipitation in the Tropics-Experiments in Dominica
http://slidepdf.com/reader/full/orographic-precipitation-in-the-tropics-experiments-in-dominica 18/19
fluid beneath a density discontinuity (e.g., Scha r and
Smith 1993; Smith et al. 1997). This formulation should
give a fair description of disturbed trade wind flow be-
neath the inversion, if moisture and convection can be
neglected.
According to Scha r and Smith (1993; see their ap-
pendix C), the linearized partial differential equation forinversion displacement h(x, y) caused by a hill h(x, y) is
hxx À Fr2(hxx 1hyy)5hxx, (A1)
where Fr is the upstream ambient layer Froude number
Fr 5 U /ffiffiffiffiffiffiffiffig0H
p , H is the average layer depth, and g9 is the
reduced gravity. Equation (A1) is valid when the ratio
of mountain height to layer depth M 5 h/H is small. For
subcritical flow (i.e., Fr , 1), (A1) is elliptic and, in
principle, the disturbance caused by an isolated hill will
be felt everywhere. In supercritical flow (i.e., Fr . 1),
(A1) is hyperbolic, waves cannot propagate upstream,and the disturbance will be found only downstream of the
hill. In the special case of an infinite ridge across the flow,
(A1) has the simple solution h(x) 5 h(x) Fr2/(Fr2 2 1).
According to this solution, the inversion displacement is
strictly local (only found over the hill). For subcritical
flow, as the terrain rises, the inversion sinks in proportion
to the local terrain height. For isolated hills in two hori-
zontal dimensions, the solutions to (A1) are nonlocal. On
the flow centerline over an axisymmetric hill, the inver-
sion rises before sinking over the hill. The higher pres-
sure under the lifted inversion will cause slight flow di-
version. At the surface, of course, the airflow rises withthe terrain. If there is deep stratification above the in-
version, the vertically propagating mountain waves will
cause an additional upstream lifting of the inversion.
When the ratio of mountain height to layer depth
M 5 h/H becomes finite, the linear theory is no longer
valid. As seen in Fig. 2, Dominica has M ’ 0.6 and thus
nonlinearity will be important. When a critical moun-
tain height is reached, the local Froude number over the
peak will equal or exceed unity and leeside plunging,
hydraulic jumps, and a momentum deficit wake will oc-
cur. For an infinite ridge, the critical mountain height is
given by
M CRIT 511 (1/2)(Fr2À 3Fr2/3), (A2)
whereas for an axisymmetric hill
M CRIT ’ (1 À Fr)1/3, (A3)
Dominica’s shape probably lies in between these two
shapes in regards to nonlinearity. For an ambient Froude
number of Fr 5 0.4, (A2) and (A3) give M CRIT 5 0.27
and M CRIT 5 0.5, respectively, so Dominica’s height
exceeds both critical values. The theory thus predicts
plunging flow over the lee slopes of Dominica. Other
applications of this theory to the Lesser Antilles are de-
scribed in Smith et al. (1997). They found that both the
cloud layer and the inversion contribute to the reduced
gravity (g9) in the theory.
REFERENCES
Adler, R. F., G. J. Huffman, D. T. Bolvin, S. Curtis, and E. J.
Nelkin, 2000: Tropical rainfall distributions determined using
TRMM combined with other satellite and rain gauge infor-
mation. J. Appl. Meteor., 39, 2007–2023.
Banta, R. M., 1990: The role of mountains in making clouds.
Atmospheric Processes over Complex Terrain, W. Blumen,
Ed., Amer. Meteor. Soc., 59–81.
Bean, B., R. Gilmer, R. Grossman, R. McGavin, and C. Travis,
1972: An analysis of airborne measurements of vertical water
vapor flux during BOMEX. J. Atmos. Sci., 29, 860–869.
Bell, T. L., and N. Reid, 1993: Detectingthe diurnal cycle of rainfall
using satellite observations. J. Appl. Meteor., 32, 311–322.Browning, K. A., F. F. Hill, and C. W. Pardoe, 1974: Structure andmechanism of precipitation and the effect of orography in
a wintertime warm sector. Quart. J. Roy. Meteor. Soc., 100,
309–330.
Colle, B. A., Y. Lin, S. Medina, and B. F. Smull, 2008: Orographic
modification of convection and flow kinematics by the Oregon
Coast Range and Cascades during IMPROVE-2. Mon. Wea.
Rev., 136, 3894–3916.
Delnore, V. E., 1972: Diurnal variation of temperature and energy
budget for the oceanic mixed layer during BOMEX. J. Phys.
Oceanogr., 2, 239–247.
de Roode, S. R., and C. S. Bretherton, 2003: Mass-flux budgets of
shallow cumulus clouds. J. Atmos. Sci., 60, 137–151.
Esteban, M. A., and Y. L. Chen, 2008: The impact of trade wind
strength on precipitation over the windward side of the island
of Hawaii. Mon. Wea. Rev., 136, 913–928.
Fuhrer, O., and C. Scha r, 2005: Embedded cellular convection in
moist flow past topography. J. Atmos. Sci., 62, 2810–2828.
Harrison, L. C., 1935: Dominica: A wet tropical human habitat.
Econ. Geogr., 11, 62–76.
Holland, J. Z., and E. M. Rasmussen, 1973: Measurements of
the atmospheric mass, energy, and momentum budgets over a
500-kilometer square of tropical ocean. Mon. Wea. Rev., 101,
44–55.
Kirshbaum, D. J., and D. R. Durran, 2005: Atmospheric factors
governing banded orographic precipitation. J. Atmos. Sci., 62,
3758–3774.
——, and R. B. Smith, 2008: Temperature and moist-stability ef-
fects on midlatitude orographic precipitation. Quart. J. Roy.
Meteor. Soc., 134, 1183–1199.
——, and ——, 2009: Orographic precipitation in the tropics:
Large-eddy simulations and theory. J. Atmos. Sci., in press.
Kuang, Z., and C. S. Bretherton, 2006: A mass-flux scheme view of
a high-resolution simulation of a transition from shallow to
deep cumulus convection. J. Atmos. Sci., 63, 1895–1909.
Lang, D. M., 1967: Soil and land use surveys, No. 21: Dominica.
Soil and Land Use Surveys, Trinidad: Imperial College of
Tropical Agriculture, 1–58.
Lewellen, D., W. Lewellen, and S. Yoh, 1996: Influence of Bowen
ratio on boundary-layer cloud structure. J. Atmos. Sci., 53,
175–187.
JUNE 2009 S M I T H E T A L . 1715

8/7/2019 Orographic Precipitation in the Tropics-Experiments in Dominica
http://slidepdf.com/reader/full/orographic-precipitation-in-the-tropics-experiments-in-dominica 19/19
Rauber, R. M., and Coauthors, 2007: Rain in shallow cumulus over
the ocean: The RICO campaign. Bull. Amer. Meteor. Soc., 88,
1912–1928.
Reed, W. W., 1926: Climatological data for the West Indian Is-
lands. Mon. Wea. Rev., 54, 133–160.
Regina, E., 2007: Analyse de l’episode Dean a partir des donne es
du radar du Diamant et des pluviometres. Direction Inter-
re gionale Antilles-Guyane, Me te o-France, 21 pp.
Rotunno, R., and R. A. Houze, 2007: Lessons on orographic pre-
cipitation from the mesoscale alpine programme. Quart. J.
Roy. Meteor. Soc., 133, 811–830.
Scha r, C., and R. B. Smith, 1993: Shallow-water flow past isolated
topography. Part I. Vorticity production and wake formation.
J. Atmos. Sci., 50, 1373–1400.
Siebesma, A. P., and Coauthors, 2003: A large eddy simulation
intercomparison study of shallow cumulus convection. J. At-
mos. Sci., 60, 1201–1219.
Smith,R. B., 2006: Progress on the theory of orographic precipitation.
Special Paper 398: Tectonics, Climate, and Landscape Evolution,
S. D. Willett et al., Eds., Geological Society of America, 1–16.
——, and Y.-L. Lin, 1982: The addition of heat to a stratified air-
stream with application to the dynamics of orographic rain.
Quart. J. Roy. Meteor. Soc., 108, 353–378.
——, and J. P. Evans, 2007: Orographic precipitation and water
vapor fractionation over the southern Andes. J. Hydrome-
teor., 8, 3–19.
——, A. C. Gleason, P. A. Gluhosky, and V. Grubis ic, 1997: The
wake of St. Vincent. J. Atmos. Sci., 54, 606–623.
——, Q. F. Jiang, M. G. Fearon, P. Tabary, M. Dorninger, J. D.
Doyle, and R. Benoit, 2003: Orographic precipitation and air
mass transformation: An Alpine example. Quart. J. Roy.
Meteor. Soc., 129, 433–454.
——, P. Schafer, D. Kirshbaum, and E. Regina, 2009: Orographic
enhancement of precipitation inside Hurricane Dean. J. Hy-
drometeor., 10, 820–831.
Stevens, B., and Coauthors, 2001: Simulations of trade wind cumuli
under a strong inversion. J. Atmos. Sci., 58, 1870–1891.
Taylor, M. A., D. B. Enfield, and A. A. Chen, 2002: Influence of the
tropical Atlantic versus the tropical Pacific on Caribbean rain-
fall. J. Geophys. Res., 107, 3127, doi:10.1029/2001JC001097.
Woodcock, A. H., 1960: The origin of trade-wind orographic
shower rains. Tellus, 12, 315–326.
Yeh, H.-C., and Y.-L. Chen, 1998: Characteristics of rainfall
distributions over Taiwan during the Taiwan Area Meso-
scale Experiment (TAMEX). J. Appl. Meteor., 37, 1457–
1469.
1716 J O U R N A L O F T H E A T M O S P H E R I C S C I E N C E S VOLUME 66