Embed Size (px)
Citation preview
ARTICLE
Organo–organic and organo–mineral interfaces insoil at the nanometer scaleAngela R. Possinger 1,6, Michael J. Zachman 2,7, Akio Enders1,8, Barnaby D. A. Levin 2,
David A. Muller 2,3, Lena F. Kourkoutis 2,3 & Johannes Lehmann 1,4,5✉
The capacity of soil as a carbon (C) sink is mediated by interactions between organic matter
and mineral phases. However, previously proposed layered accumulation of organic matter
within aggregate organo–mineral microstructures has not yet been confirmed by direct
visualization at the necessary nanometer-scale spatial resolution. Here, we identify dis-
ordered micrometer-size organic phases rather than previously reported ordered gradients in
C functional groups. Using cryo-electron microscopy with electron energy loss spectroscopy
(EELS), we show organo–organic interfaces in contrast to exclusively organo–mineral inter-
faces. Single-digit nanometer-size layers of C forms were detected at the organo–organic
interface, showing alkyl C and nitrogen (N) enrichment (by 4 and 7%, respectively). At the
organo–mineral interface, 88% (72–92%) and 33% (16–53%) enrichment of N and oxidized
C, respectively, indicate different stabilization processes than at organo–organic interfaces.
However, N enrichment at both interface types points towards the importance of N-rich
residues for greater C sequestration.
https://doi.org/10.1038/s41467-020-19792-9 OPEN
1 Soil and Crop Sciences, School of Integrative Plant Science, Cornell University, Ithaca, NY 14853, USA. 2 School of Applied and Engineering Physics, CornellUniversity, Ithaca, NY 14853, USA. 3 Kavli Institute at Cornell for Nanoscale Science, Cornell University, Ithaca, NY 14853, USA. 4 Institute for AdvancedStudy, Technical University of Munich, Garching, Germany. 5 Cornell Atkinson Center for Sustainability, Ithaca, NY 14853, USA. 6Present address:Department of Forest Resources and Environmental Conservation, Virginia Tech, Cheatham Hall, Blacksburg, VA 24060, USA. 7Present address: Center forNanophase Materials Sciences, Oak Ridge National Laboratory, Oak Ridge, TN 37831, USA. 8Present address: Department of Biological and EnvironmentalEngineering, Cornell University, Ithaca, NY 14853, USA. ✉email: [email protected]
NATURE COMMUNICATIONS | (2020) 11:6103 | https://doi.org/10.1038/s41467-020-19792-9 | www.nature.com/naturecommunications 1
1234
5678
90():,;
Soil organic carbon (SOC) constitutes a critical reservoir inthe global C cycle, which highlights the importance ofunderstanding the processes that drive soil organic matter
(SOM) persistence, ranging from global (e.g., climate) to very finescales (e.g., organo–mineral surface interactions)1–4. Improvingthe ability to describe drivers of SOM persistence, includingmechanisms of SOM protection, enables better prediction ofchanges in the soil C reservoir in light of global environmentalchange5.
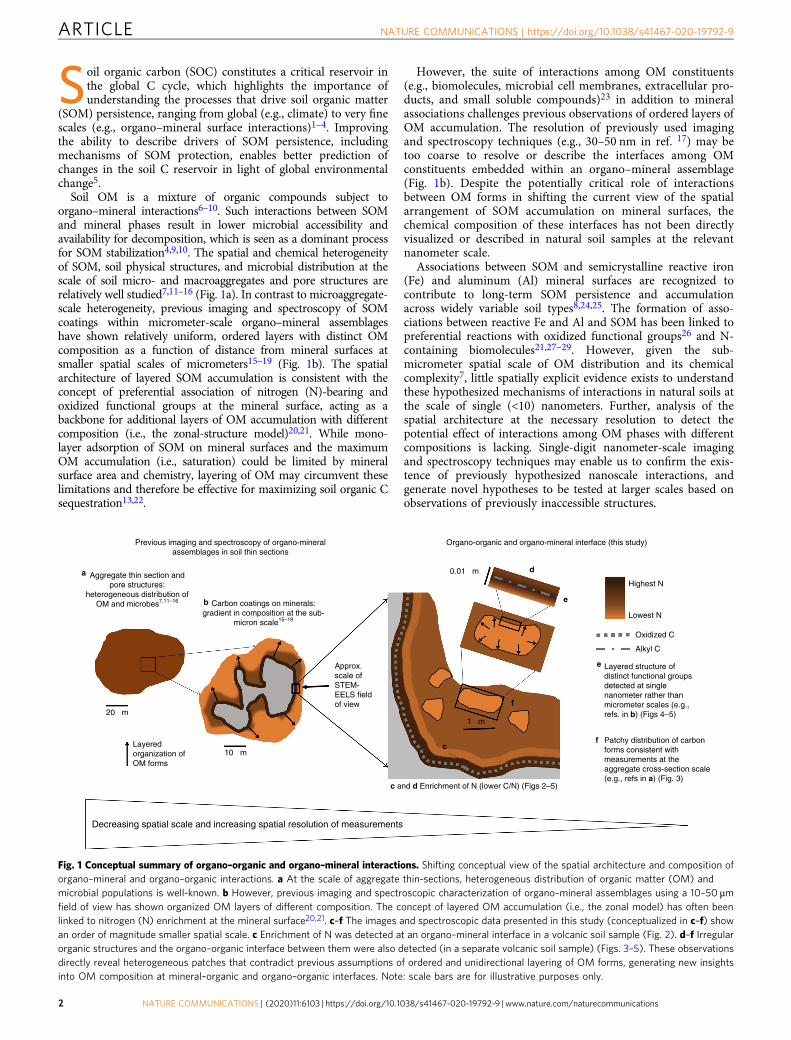
Soil OM is a mixture of organic compounds subject toorgano–mineral interactions6–10. Such interactions between SOMand mineral phases result in lower microbial accessibility andavailability for decomposition, which is seen as a dominant processfor SOM stabilization4,9,10. The spatial and chemical heterogeneityof SOM, soil physical structures, and microbial distribution at thescale of soil micro- and macroaggregates and pore structures arerelatively well studied7,11–16 (Fig. 1a). In contrast to microaggregate-scale heterogeneity, previous imaging and spectroscopy of SOMcoatings within micrometer-scale organo–mineral assemblageshave shown relatively uniform, ordered layers with distinct OMcomposition as a function of distance from mineral surfaces atsmaller spatial scales of micrometers15–19 (Fig. 1b). The spatialarchitecture of layered SOM accumulation is consistent with theconcept of preferential association of nitrogen (N)-bearing andoxidized functional groups at the mineral surface, acting as abackbone for additional layers of OM accumulation with differentcomposition (i.e., the zonal-structure model)20,21. While mono-layer adsorption of SOM on mineral surfaces and the maximumOM accumulation (i.e., saturation) could be limited by mineralsurface area and chemistry, layering of OM may circumvent theselimitations and therefore be effective for maximizing soil organic Csequestration13,22.
However, the suite of interactions among OM constituents(e.g., biomolecules, microbial cell membranes, extracellular pro-ducts, and small soluble compounds)23 in addition to mineralassociations challenges previous observations of ordered layers ofOM accumulation. The resolution of previously used imagingand spectroscopy techniques (e.g., 30–50 nm in ref. 17) may betoo coarse to resolve or describe the interfaces among OMconstituents embedded within an organo–mineral assemblage(Fig. 1b). Despite the potentially critical role of interactionsbetween OM forms in shifting the current view of the spatialarrangement of SOM accumulation on mineral surfaces, thechemical composition of these interfaces has not been directlyvisualized or described in natural soil samples at the relevantnanometer scale.
Associations between SOM and semicrystalline reactive iron(Fe) and aluminum (Al) mineral surfaces are recognized tocontribute to long-term SOM persistence and accumulationacross widely variable soil types8,24,25. The formation of asso-ciations between reactive Fe and Al and SOM has been linked topreferential reactions with oxidized functional groups26 and N-containing biomolecules21,27–29. However, given the sub-micrometer spatial scale of OM distribution and its chemicalcomplexity7, little spatially explicit evidence exists to understandthese hypothesized mechanisms of interactions in natural soils atthe scale of single (<10) nanometers. Further, analysis of thespatial architecture at the necessary resolution to detect thepotential effect of interactions among OM phases with differentcompositions is lacking. Single-digit nanometer-scale imagingand spectroscopy techniques may enable us to confirm the exis-tence of previously hypothesized nanoscale interactions, andgenerate novel hypotheses to be tested at larger scales based onobservations of previously inaccessible structures.
Organo-organic and organo-mineral interface (this study)
f
c
Lowest N
Oxidized C
Alkyl C
f Patchy distribution of carbonforms consistent withmeasurements at theaggregate cross-section scale(e.g., refs in a) (Fig. 3)
e Layered structure ofdistinct functional groupsdetected at singlenanometer rather thanmicrometer scales (e.g.,refs. in b) (Figs 4–5)
e
d
Highest N
Previous imaging and spectroscopy of organo-mineralassemblages in soil thin sections
b Carbon coatings on minerals:gradient in composition at the sub-
micron scale15–19
20 µm
10 µm
1 µm
0.01 µma Aggregate thin section andpore structures:
heterogeneous distribution ofOM and microbes7,11–16
Approx.scale ofSTEM-EELS fieldof view
c and d Enrichment of N (lower C/N) (Figs 2–5)
Decreasing spatial scale and increasing spatial resolution of measurements
Layeredorganization ofOM forms
Fig. 1 Conceptual summary of organo–organic and organo–mineral interactions. Shifting conceptual view of the spatial architecture and composition oforgano–mineral and organo–organic interactions. a At the scale of aggregate thin-sections, heterogeneous distribution of organic matter (OM) andmicrobial populations is well-known. b However, previous imaging and spectroscopic characterization of organo–mineral assemblages using a 10–50 μmfield of view has shown organized OM layers of different composition. The concept of layered OM accumulation (i.e., the zonal model) has often beenlinked to nitrogen (N) enrichment at the mineral surface20,21. c–f The images and spectroscopic data presented in this study (conceptualized in c–f) showan order of magnitude smaller spatial scale. c Enrichment of N was detected at an organo–mineral interface in a volcanic soil sample (Fig. 2). d–f Irregularorganic structures and the organo–organic interface between them were also detected (in a separate volcanic soil sample) (Figs. 3–5). These observationsdirectly reveal heterogeneous patches that contradict previous assumptions of ordered and unidirectional layering of OM forms, generating new insightsinto OM composition at mineral–organic and organo–organic interfaces. Note: scale bars are for illustrative purposes only.
ARTICLE NATURE COMMUNICATIONS | https://doi.org/10.1038/s41467-020-19792-9
2 NATURE COMMUNICATIONS | (2020) 11:6103 | https://doi.org/10.1038/s41467-020-19792-9 | www.nature.com/naturecommunications
The goal of this study was to examine the hypothesizedzonal-structure model of interaction and identify the functionalgroups at the organo–mineral interface. To gain further insightinto the properties of organo–mineral interactions in naturalsoil samples and to ascertain the presence of what we callorgano–organic interactions, we developed a novel approachfor cryogenic sample preparation in conjunction with analy-tical cryogenic scanning transmission electron microscopy andelectron energy-loss spectroscopy (cryo-STEM-EELS). Thisapproach pairs single-digit nanometer spatial resolution withthe ability to resolve variations in the C bonding environmentacross organo–mineral and organo–organic interfaces. Thisapproach also avoids the use of C-based stabilizing resins thattypically make interpretation of the native soil C content andbonding environments difficult, and enables direct visualiza-tion and analysis of the interfaces between organic and mineralphases in soil without alteration of the spatial architecture.We applied cryo-STEM-EELS to probe organo–organic andorgano–mineral interfaces in archetypical high-reactive Fe andAl volcanic soils (Supplementary Table 1) with a knowncapacity for long-term C accumulation8,26,30.
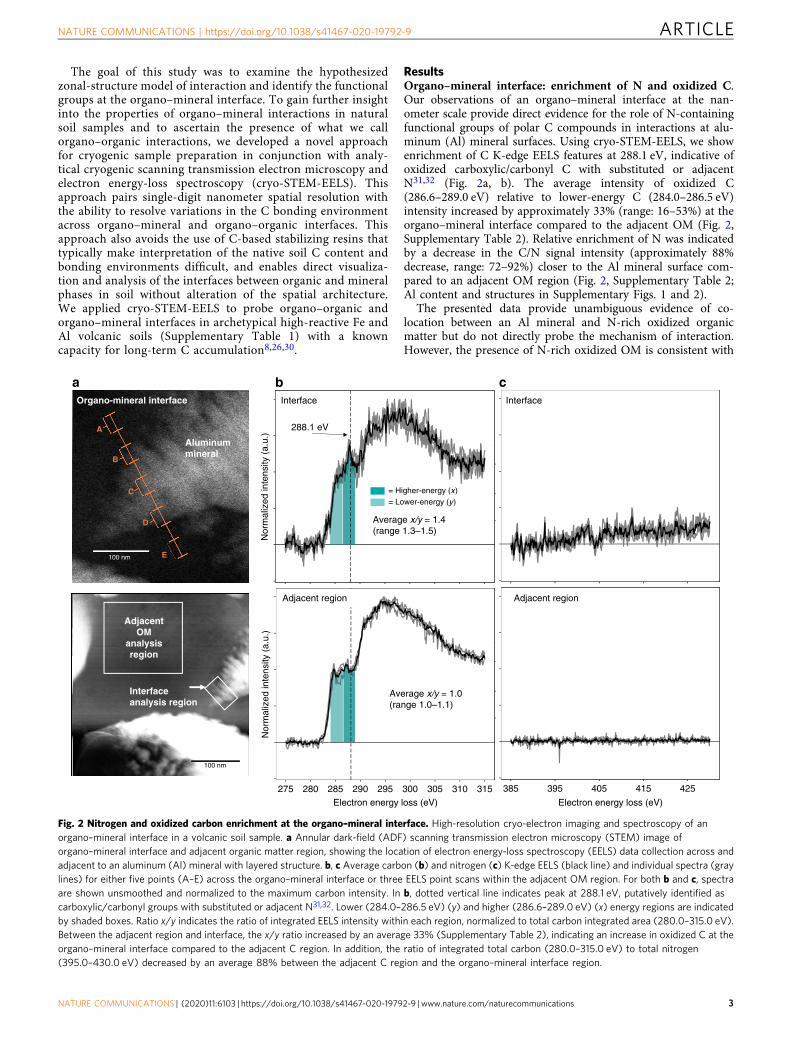
ResultsOrgano–mineral interface: enrichment of N and oxidized C.Our observations of an organo–mineral interface at the nan-ometer scale provide direct evidence for the role of N-containingfunctional groups of polar C compounds in interactions at alu-minum (Al) mineral surfaces. Using cryo-STEM-EELS, we showenrichment of C K-edge EELS features at 288.1 eV, indicative ofoxidized carboxylic/carbonyl C with substituted or adjacentN31,32 (Fig. 2a, b). The average intensity of oxidized C(286.6–289.0 eV) relative to lower-energy C (284.0–286.5 eV)intensity increased by approximately 33% (range: 16–53%) at theorgano–mineral interface compared to the adjacent OM (Fig. 2,Supplementary Table 2). Relative enrichment of N was indicatedby a decrease in the C/N signal intensity (approximately 88%decrease, range: 72–92%) closer to the Al mineral surface com-pared to an adjacent OM region (Fig. 2, Supplementary Table 2;Al content and structures in Supplementary Figs. 1 and 2).
The presented data provide unambiguous evidence of co-location between an Al mineral and N-rich oxidized organicmatter but do not directly probe the mechanism of interaction.However, the presence of N-rich oxidized OM is consistent with
)*+,-./01+0+.231*/4415+67
8/.9
:*;<
+=
1;0-
+04
;-31
5:>
?>7
)*+,-./01+0+.231*/4415+67
Nor
mal
ized
inte
nsity
(a.
u.)
Nor
mal
ized
inte
nsity
(a.
u.)
385 395 405 415 425
8/.9
:*;<
+=
1;0-
+04
;-31
5:>
?>7
275 280 285 290 295 300 305 310 315
Electron energy loss (eV) Electron energy loss (eV)
a b
288.1 eV
= Higher-energy (x)= Lower-energy (y)
AdjacentOM
analysisregion
Aluminummineral
A
B
C
D
E
Interfaceanalysis region
100 nm
100 nm
Average x/y = 1.4(range 1.3–1.5)
Average x/y = 1.0(range 1.0–1.1)
Organo-mineral interface
cInterface
Adjacent region Adjacent region
Interface
Fig. 2 Nitrogen and oxidized carbon enrichment at the organo–mineral interface. High-resolution cryo-electron imaging and spectroscopy of anorgano–mineral interface in a volcanic soil sample. a Annular dark-field (ADF) scanning transmission electron microscopy (STEM) image oforgano–mineral interface and adjacent organic matter region, showing the location of electron energy-loss spectroscopy (EELS) data collection across andadjacent to an aluminum (Al) mineral with layered structure. b, c Average carbon (b) and nitrogen (c) K-edge EELS (black line) and individual spectra (graylines) for either five points (A–E) across the organo–mineral interface or three EELS point scans within the adjacent OM region. For both b and c, spectraare shown unsmoothed and normalized to the maximum carbon intensity. In b, dotted vertical line indicates peak at 288.1 eV, putatively identified ascarboxylic/carbonyl groups with substituted or adjacent N31,32. Lower (284.0–286.5 eV) (y) and higher (286.6–289.0 eV) (x) energy regions are indicatedby shaded boxes. Ratio x/y indicates the ratio of integrated EELS intensity within each region, normalized to total carbon integrated area (280.0–315.0 eV).Between the adjacent region and interface, the x/y ratio increased by an average 33% (Supplementary Table 2), indicating an increase in oxidized C at theorgano–mineral interface compared to the adjacent C region. In addition, the ratio of integrated total carbon (280.0–315.0 eV) to total nitrogen(395.0–430.0 eV) decreased by an average 88% between the adjacent C region and the organo–mineral interface region.
NATURE COMMUNICATIONS | https://doi.org/10.1038/s41467-020-19792-9 ARTICLE
NATURE COMMUNICATIONS | (2020) 11:6103 | https://doi.org/10.1038/s41467-020-19792-9 | www.nature.com/naturecommunications 3
the preferential retention of N-containing functional groups andoxidized (e.g., carboxylic acid) OM in soils with short-rangeordered (SRO) Fe and Al mineralogy. Aromatic and carboxylicacids have been identified as key C forms in stabilizinginteractions with reactive metals not only in archetypical soilswith SRO mineralogy (e.g., the studied Andisols26), but also inbroadly distributed forest soils33. While our data do not addressthe frequency or distribution of organo–reactive metal interac-tions, reactive metal phases are present in most soil types assurface coatings on silicate clays and primary minerals, Feprecipitates, and Fe–OM co-precipitates under fluctuating redoxconditions10. In addition, spatial associations of N-rich OM onreactive metal surfaces have been identified both within SRO-richsoils34 and temperate soil organic horizons28. More broadly, therole of N in organo–mineral associations is consistent with therole of microbially derived residues for the accumulation of OM,a foundation of the microbial efficiency-matrix stabilization(MEMS) framework35 and mineral–microbe biogeochemicalmodels5. Multiple mechanisms of N-rich OM interaction withreactive Fe and Al minerals have been proposed, includingindirect association via reactive phosphate groups in phosphory-lated proteins and hydrogen bond formation20,28.
While inner-sphere ligand exchange is well documentedfor oxidized carboxylic and aromatic acids26, ligand exchange
mechanisms specific to N-substituted carboxylic groups are lesswell-known. In this study, the very high enrichment of total N(88% lower C/N intensity ratio) at the interface also suggests thatthe N-rich OM association may co-occur with the accumulationof inorganic N (e.g., electrostatic retention of NH4
+). Thepotential for either competitive or synergistic interactionsbetween organic and inorganic N at reactive metal surfacesprovides a new direction for the evaluation of N in OMstabilization. In addition, interactions between N-rich OM andreactive Al (as identified here) have received less attention thanN-rich OM and reactive Fe28,29. With an emerging focus on Al-mediated OM stabilization under conditions of Fe depletion34,36,further experiments should target possible divergence inphysicochemical mineral–organic mechanisms between N-richOM and reactive Al in contrast to Fe.
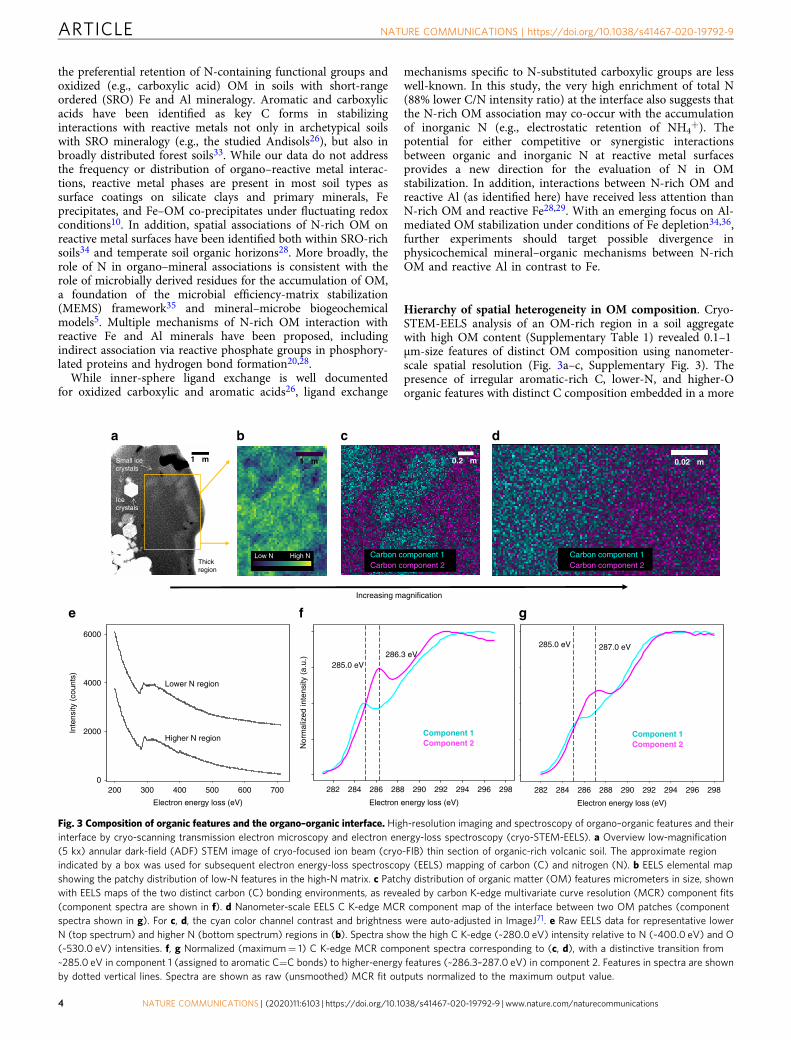
Hierarchy of spatial heterogeneity in OM composition. Cryo-STEM-EELS analysis of an OM-rich region in a soil aggregatewith high OM content (Supplementary Table 1) revealed 0.1–1µm-size features of distinct OM composition using nanometer-scale spatial resolution (Fig. 3a–c, Supplementary Fig. 3). Thepresence of irregular aromatic-rich C, lower-N, and higher-Oorganic features with distinct C composition embedded in a more
Nor
mal
ized
inte
nsity
(a.
u.)
$
b
286.3 eV
c d
285.0 eV
287.0 eV285.0 eV
Increasing magnification
Component 1Component 2
Component 1Component 2
Carbon component 1Carbon component 2
a
e f
Low N High N Carbon component 1Carbon component 2
1 µm 1 µm 0.2 µm 0.02 µm
Thickregion
Small icecrystals
Icecrystals
g
0
2000
4000
6000
200 300 400 500 600 700 282 284 286 288 290 292 294 296 298
Electron energy loss (eV) Electron energy loss (eV)
282 284 286 288 290 292 294 296 298
Electron energy loss (eV)
Inte
nsity
(co
unts
)
Lower N region
Higher N region
Fig. 3 Composition of organic features and the organo–organic interface. High-resolution imaging and spectroscopy of organo–organic features and theirinterface by cryo-scanning transmission electron microscopy and electron energy-loss spectroscopy (cryo-STEM-EELS). a Overview low-magnification(5 kx) annular dark-field (ADF) STEM image of cryo-focused ion beam (cryo-FIB) thin section of organic-rich volcanic soil. The approximate regionindicated by a box was used for subsequent electron energy-loss spectroscopy (EELS) mapping of carbon (C) and nitrogen (N). b EELS elemental mapshowing the patchy distribution of low-N features in the high-N matrix. c Patchy distribution of organic matter (OM) features micrometers in size, shownwith EELS maps of the two distinct carbon (C) bonding environments, as revealed by carbon K-edge multivariate curve resolution (MCR) component fits(component spectra are shown in f). d Nanometer-scale EELS C K-edge MCR component map of the interface between two OM patches (componentspectra shown in g). For c, d, the cyan color channel contrast and brightness were auto-adjusted in ImageJ71. e Raw EELS data for representative lowerN (top spectrum) and higher N (bottom spectrum) regions in (b). Spectra show the high C K-edge (~280.0 eV) intensity relative to N (~400.0 eV) and O(~530.0 eV) intensities. f, g Normalized (maximum= 1) C K-edge MCR component spectra corresponding to (c, d), with a distinctive transition from~285.0 eV in component 1 (assigned to aromatic C=C bonds) to higher-energy features (~286.3–287.0 eV) in component 2. Features in spectra are shownby dotted vertical lines. Spectra are shown as raw (unsmoothed) MCR fit outputs normalized to the maximum output value.
ARTICLE NATURE COMMUNICATIONS | https://doi.org/10.1038/s41467-020-19792-9
4 NATURE COMMUNICATIONS | (2020) 11:6103 | https://doi.org/10.1038/s41467-020-19792-9 | www.nature.com/naturecommunications
alkyl-rich C with higher-N and lower-O organic matrix contra-dicts previous observations of micrometer-sized ordered gra-dients as a function of distance to mineral surfaces15–19 (Fig. 1b).
EELS C K-edge fine structure varied greatly between thefeatures and the surrounding matrix, which were identified asdiscrete C forms using multivariate curve resolution (MCR)(Fig. 3c, f). Within the observed patchy features, the EELS finestructure is dominated by a low-energy feature at ~285 eV, whichis assigned to the C 1s–π*C=C transition of C=C bonds associatedwith aromatic structures32. In contrast, the EELS fine structure ofthe surrounding matrix distinctly shifts from ~285 eV to higher
energy (Fig. 3f, g). At higher spatial resolution (approximately 2nm) (Fig. 3d), the higher-energy feature is at ~287 eV (Fig. 3g,Fig. 4d). While many overlapping transitions occur in this region,features can be broadly linked to alkyl C-H bonds with a varietyof transitions (e.g., C 1s–π*C–H)32,37.
By observing C/N, C/O, and aromatic/alkyl C ratios across theboundaries of the OM patches, the improved spatial resolutionof cryo-STEM-EELS over previously utilized techniques (such asscanning transmission X-ray spectroscopy with near-edge X-rayabsorption fine structure15–19) enabled the discovery ofnanometer-scale ordered gradients of layered OM at the boundary
0.00
0.25
0.50
0.75
1.00
0 010 1020 2030 3040 4050 50Lateral distance (nm) Lateral distance (nm)
Nor
mal
ized
rat
io
25
50
75
100
Nor
mal
ized
rat
e of
cha
nge
(%)
1 2 3 4 5
C/N
C/O
a
d
Aromatic/alkyl C
b
1 to 2
1 to 3
1 to 4
c
1 2 3 4 5
50 n
m
0
30
60
90
500 525 550 575 600
Oxygen
Box 1
Box 4
Box 2
Box 3
Box 5
0
500
1000
1500
275 285 295 305 315
Electron energy loss (eV) Electron energy loss (eV) Electron energy loss (eV)
Inte
sity
(co
unts
)
Carbon
285.0eV
287.0 eV
0
100
200
300
375 385 395 405 415 425
Nitrogen
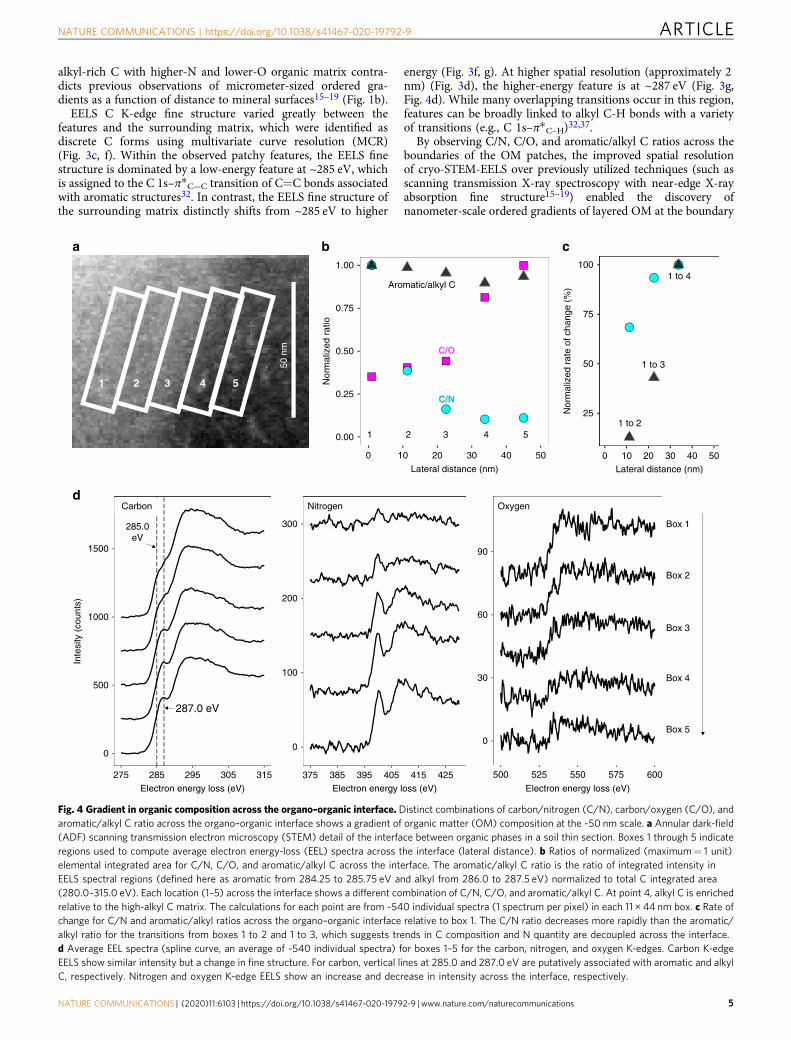
Fig. 4 Gradient in organic composition across the organo–organic interface. Distinct combinations of carbon/nitrogen (C/N), carbon/oxygen (C/O), andaromatic/alkyl C ratio across the organo–organic interface shows a gradient of organic matter (OM) composition at the ~50 nm scale. a Annular dark-field(ADF) scanning transmission electron microscopy (STEM) detail of the interface between organic phases in a soil thin section. Boxes 1 through 5 indicateregions used to compute average electron energy-loss (EEL) spectra across the interface (lateral distance). b Ratios of normalized (maximum= 1 unit)elemental integrated area for C/N, C/O, and aromatic/alkyl C across the interface. The aromatic/alkyl C ratio is the ratio of integrated intensity inEELS spectral regions (defined here as aromatic from 284.25 to 285.75 eV and alkyl from 286.0 to 287.5 eV) normalized to total C integrated area(280.0–315.0 eV). Each location (1–5) across the interface shows a different combination of C/N, C/O, and aromatic/alkyl C. At point 4, alkyl C is enrichedrelative to the high-alkyl C matrix. The calculations for each point are from ~540 individual spectra (1 spectrum per pixel) in each 11 × 44 nm box. c Rate ofchange for C/N and aromatic/alkyl ratios across the organo–organic interface relative to box 1. The C/N ratio decreases more rapidly than the aromatic/alkyl ratio for the transitions from boxes 1 to 2 and 1 to 3, which suggests trends in C composition and N quantity are decoupled across the interface.d Average EEL spectra (spline curve, an average of ~540 individual spectra) for boxes 1–5 for the carbon, nitrogen, and oxygen K-edges. Carbon K-edgeEELS show similar intensity but a change in fine structure. For carbon, vertical lines at 285.0 and 287.0 eV are putatively associated with aromatic and alkylC, respectively. Nitrogen and oxygen K-edge EELS show an increase and decrease in intensity across the interface, respectively.
NATURE COMMUNICATIONS | https://doi.org/10.1038/s41467-020-19792-9 ARTICLE
NATURE COMMUNICATIONS | (2020) 11:6103 | https://doi.org/10.1038/s41467-020-19792-9 | www.nature.com/naturecommunications 5
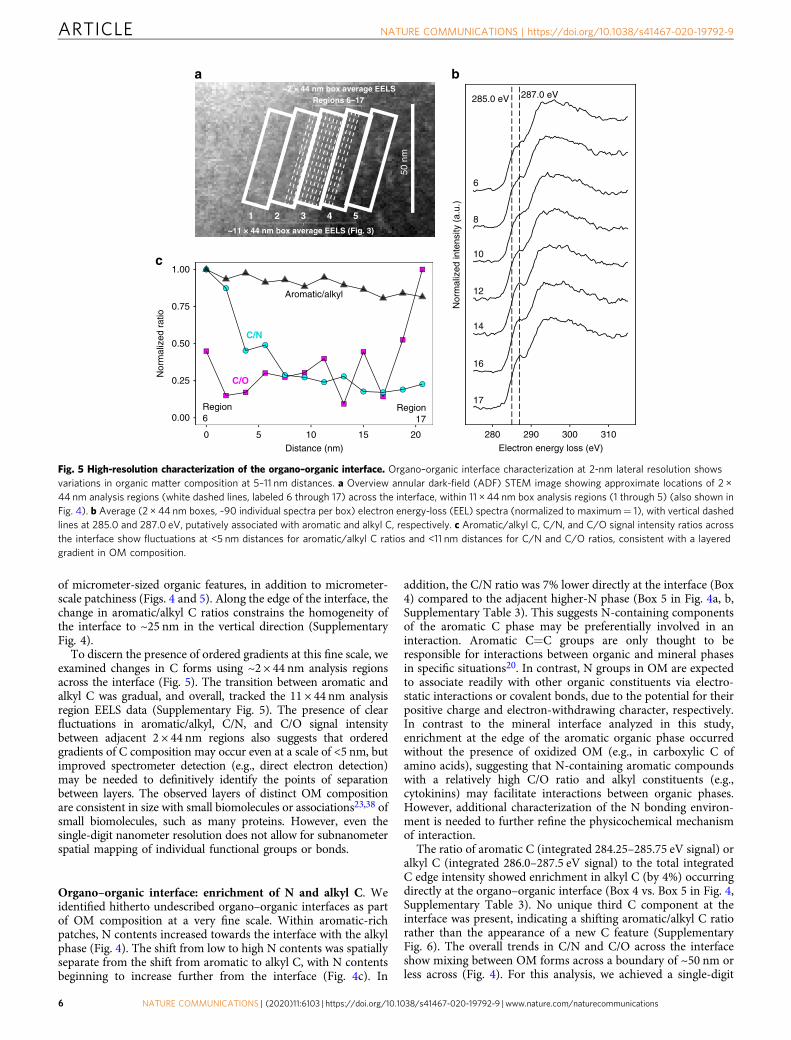
of micrometer-sized organic features, in addition to micrometer-scale patchiness (Figs. 4 and 5). Along the edge of the interface, thechange in aromatic/alkyl C ratios constrains the homogeneity ofthe interface to ~25 nm in the vertical direction (SupplementaryFig. 4).
To discern the presence of ordered gradients at this fine scale, weexamined changes in C forms using ~2 × 44 nm analysis regionsacross the interface (Fig. 5). The transition between aromatic andalkyl C was gradual, and overall, tracked the 11 × 44 nm analysisregion EELS data (Supplementary Fig. 5). The presence of clearfluctuations in aromatic/alkyl, C/N, and C/O signal intensitybetween adjacent 2 × 44 nm regions also suggests that orderedgradients of C composition may occur even at a scale of <5 nm, butimproved spectrometer detection (e.g., direct electron detection)may be needed to definitively identify the points of separationbetween layers. The observed layers of distinct OM compositionare consistent in size with small biomolecules or associations23,38 ofsmall biomolecules, such as many proteins. However, even thesingle-digit nanometer resolution does not allow for subnanometerspatial mapping of individual functional groups or bonds.
Organo–organic interface: enrichment of N and alkyl C. Weidentified hitherto undescribed organo–organic interfaces as partof OM composition at a very fine scale. Within aromatic-richpatches, N contents increased towards the interface with the alkylphase (Fig. 4). The shift from low to high N contents was spatiallyseparate from the shift from aromatic to alkyl C, with N contentsbeginning to increase further from the interface (Fig. 4c). In
addition, the C/N ratio was 7% lower directly at the interface (Box4) compared to the adjacent higher-N phase (Box 5 in Fig. 4a, b,Supplementary Table 3). This suggests N-containing componentsof the aromatic C phase may be preferentially involved in aninteraction. Aromatic C=C groups are only thought to beresponsible for interactions between organic and mineral phasesin specific situations20. In contrast, N groups in OM are expectedto associate readily with other organic constituents via electro-static interactions or covalent bonds, due to the potential for theirpositive charge and electron-withdrawing character, respectively.In contrast to the mineral interface analyzed in this study,enrichment at the edge of the aromatic organic phase occurredwithout the presence of oxidized OM (e.g., in carboxylic C ofamino acids), suggesting that N-containing aromatic compoundswith a relatively high C/O ratio and alkyl constituents (e.g.,cytokinins) may facilitate interactions between organic phases.However, additional characterization of the N bonding environ-ment is needed to further refine the physicochemical mechanismof interaction.
The ratio of aromatic C (integrated 284.25–285.75 eV signal) oralkyl C (integrated 286.0–287.5 eV signal) to the total integratedC edge intensity showed enrichment in alkyl C (by 4%) occurringdirectly at the organo–organic interface (Box 4 vs. Box 5 in Fig. 4,Supplementary Table 3). No unique third C component at theinterface was present, indicating a shifting aromatic/alkyl C ratiorather than the appearance of a new C feature (SupplementaryFig. 6). The overall trends in C/N and C/O across the interfaceshow mixing between OM forms across a boundary of ~50 nm orless across (Fig. 4). For this analysis, we achieved a single-digit
0.00
0.25
0.50
0.75
1.00
0 5 10 15 20
Distance (nm)
Nor
mal
ized
rat
io
1 2 3 4 5
50 n
m
~2 × 44 nm box average EELSRegions 6–17
~11 × 44 nm box average EELS (Fig. 3)
a
c
Region6
Region17
Aromatic/alkyl
C/N
C/O
b
280 290 300 310
Electron energy loss (eV)N
orm
aliz
ed in
tens
ity (
a.u.
)
6
8
10
12
14
16
17
285.0 eV 287.0 eV
Fig. 5 High-resolution characterization of the organo–organic interface. Organo–organic interface characterization at 2-nm lateral resolution showsvariations in organic matter composition at 5–11 nm distances. a Overview annular dark-field (ADF) STEM image showing approximate locations of 2 ×44 nm analysis regions (white dashed lines, labeled 6 through 17) across the interface, within 11 × 44 nm box analysis regions (1 through 5) (also shown inFig. 4). b Average (2 × 44 nm boxes, ~90 individual spectra per box) electron energy-loss (EEL) spectra (normalized to maximum= 1), with vertical dashedlines at 285.0 and 287.0 eV, putatively associated with aromatic and alkyl C, respectively. c Aromatic/alkyl C, C/N, and C/O signal intensity ratios acrossthe interface show fluctuations at <5 nm distances for aromatic/alkyl C ratios and <11 nm distances for C/N and C/O ratios, consistent with a layeredgradient in OM composition.
ARTICLE NATURE COMMUNICATIONS | https://doi.org/10.1038/s41467-020-19792-9
6 NATURE COMMUNICATIONS | (2020) 11:6103 | https://doi.org/10.1038/s41467-020-19792-9 | www.nature.com/naturecommunications
nanometer spatial resolution (see “Methods”), suggesting thatthe size of the overall boundary represents a property of theinterface itself rather than the instrument resolution. However,the dimension of the boundary may be overestimated due to theunknown orientation of the boundary within the <200 nm-thickthin section. The transition in C EELS fine structure (regions ofinterest (ROI) 1–4 in Fig. 4a) from more aromatic (~285 eV) toalkyl C (~287 eV) was sharper than the gradual change in N andO composition (Fig. 4c).
DiscussionTaken together, these observations provide evidence for a shiftingview (Fig. 1) of the hierarchy of OM spatial distribution in soiland the possible role of OM accumulation facilitated byorgano–organic interactions. At the scale of a microaggregate andsoil pore, OM is inherently heterogeneous in spatial distributionand composition7,11–16. The spatial separation of OM composi-tion within an OM-rich region observed here underscores theneed to consider nonlinear organization of organo–mineralinteraction models due to patchy, disordered OM accumulationat a very fine scale. At such high resolution, we show evidence for<5–11 nm-thick layers of OM forms (Figs. 4 and 5), approachinga meaningful scale to consider the implications for the zonalmodel20, though still larger than the size of individual functionalgroups or bonds. At this scale, our observations do not contradictthe existence of discrete zones (i.e., layers of OM composition).However, we highlight that the arrangement in space may notonly extend in ordered layers away from a mineral surface butalso at the boundaries of irregularly shaped organic patches(Fig. 1d–f). In addition, enrichment of N co-occurred with oxi-dized C at the mineral interface, in contrast to alkyl C at theorgano–organic boundary. This distinction suggests the need toconsider a combination of convergent and unique interactionpathways of organo–organic interactions in addition to the cur-rent focus only on the variations among organo–mineral inter-action mechanisms.
The existence of organic patches and organo–organic interfaceswith different organic C composition than those at organo–mineralinterfaces generates important information for sequestering soilorganic C and predicting its changes. The described organo–organicinteractions may occur at a distance to or separately from mineralsurfaces, pointing toward the need to consider soil organic C sta-bilization mechanisms that are independent of soil minerals (de-emphasizing variables such as mineral surface area or surfacechemistry), and involve N-rich surfaces13. In litter decomposition,organo–organic interactions between aromatic and N-rich com-pounds have been linked to slower litter turnover39. Here, wesuggest interactions between relatively low and high-N OM formsmay also be relevant for soil OM.
The demonstrated existence of organo–organic in addition toorgano–mineral interactions may also provide an avenue to helpexplain that saturation of soil organic C is often not clearlypredictable in the field, even though SOM saturation is a theo-retically reasonable and experimentally sound expectation40,41.Despite the emerging evidence that N-rich OM promotes SOMaccumulation35,42, major Earth system models (e.g., the Com-munity Land Model 5.0) treat soil N availability as primarily alimitation on decomposition43. Further, long-term N fertilizationexperiments in the field have shown mixed effects on SOM,ranging from decreased SOM decomposition rates and facilitationof occlusion under N fertilization42 to recent work44 showing noor inconsistent effects of N addition. Further, the distinctionbetween SOM accumulation (i.e., amount) and persistence (i.e.,turnover time) with respect to N involvement in stabilization isnot well-known. The potential for system-specific (i.e., dependent
on soil physicochemical properties) N effects on SOM accumu-lation and decomposition44 emphasizes the need to furtherinterrogate the biophysical mechanism of SOM persistence thatmay be conferred by N.
The characteristics of the identified organo–mineral andorgano–organic interfaces provide an incentive to perform tar-geted experiments testing the biogeochemical importance oforgano–organic interactions in soils, including the implications ofinput composition varying in N functional group composition(e.g., plant and animal manures, soil fungal and bacterial necro-mass or metabolites). These observations also provide motivationto expand a one-dimensional model of SOM stabilization ofchanging OM composition with distance to mineral surfaces to amulti-dimensional model45,46, even at a very small scale asinvestigated here, recognizing that multi-phase organic matterdoes not align at a predictable gradient with respect to the soilmineral matrix.
However, the presented data on their own are not sufficient toquantify the persistence that N-facilitated organo–mineral ororganic–organic interactions may confer to SOM. The link betweenreactive Fe and Al mineral abundance and increased persistence ofbulk SOM is built on the assumption that mineral bonding limitsmicrobial access to the substrate and slows OM desorption9. In ourstudy, we cannot resolve the age of the OM observed (e.g., via Δ14C),though previous soil Δ14C measurements indicate that bulk OM isvery old at the studied site, typically more than 6500 radiocarbonyears47–49. To demonstrate a difference in persistence of OM at themineral surface requires further methodological advancement to pairhigh-resolution imaging with quantification of C composition andnatural abundance Δ14C measurements (e.g., by the advancement ofmonochromated EELS techniques50,51 for damage-sensitive mate-rials). Additionally, our results provide direct evidence only ofinteractions between the studied mineral and organic materials, butthese techniques can in the future be applied to other soil types toevaluate their importance in other systems. Future research shouldalso include cryo-electron tomography and the development ofmethods that pair ultrahigh-resolution measurements with com-plementary imaging at the scale of aggregate cross-sections. Furtherwork to reveal the full three-dimensional structure and spatialcontext of both organo–organic and organo–mineral interfaces mayultimately inform a multi-dimensional spatial model of SOMaccumulation.
MethodsOverview. In this study, we identified and analyzed naturally occurring interfacesbetween mineral and organic phases in a natural soil sample. Our approachemployed a combination of very high spatial resolution imaging by STEM andcompositional analysis of organic carbon by EELS under cryogenic conditions(cryo-STEM-EELS). Due to the targeted nature of our analysis, we emphasized:(1) the likelihood of encountering such interfaces within a very small (micrometer-scale) analytical field of view (Supplementary Fig. 7), (2) how to prevent changes tothe mineral–organic interface architecture due to drying or formation of crystallineice, and (3) a method for effective preparation of the electron-transparent(<~200 nm thick) thin sections necessary for STEM-EELS.
Study site and sample collection. Cryo-STEM-EELS procedures to revealorgano–organic and organo–mineral interactions were conducted using subsoilswith a high carbon (C) and iron (Fe) content derived from volcanic parentmaterials (Andisols). While Andisols occupy a relatively small land area (0.7%globally), this soil type stores a disproportionately large amount of SOC (1.3% ofglobal SOC to a depth of 1 m)52. Andisols have been studied as an archetype ofreactive Fe and Al control on SOM persistence for several decades. The oldest SOMin this study system is expected between 20 and 1500 kyr of soil development8. Forthis study, subsoils were collected from the Pololu Flow on Kohala, HI, withapproximately 350 kyr of soil development from tholeiitic lavas, and contain highC, Fe, and Al (Supplementary Table 1, Supplementary Figs. 1–3)34. Subsoils werechosen for analysis due to their expected increased mineral-associated SOM con-tent, older radiocarbon ages, the lower contribution of particulate OM, and reducedsignal of land use or vegetation2,34,53–55. Soil pits were excavated by hand to ~1 mand sampled by the pedogenic horizon (in 2014) as described in previous
NATURE COMMUNICATIONS | https://doi.org/10.1038/s41467-020-19792-9 ARTICLE
NATURE COMMUNICATIONS | (2020) 11:6103 | https://doi.org/10.1038/s41467-020-19792-9 | www.nature.com/naturecommunications 7
studies26,30. Horizon boundaries were defined by changes in color, texture, andstructure as outlined in standard soil survey protocols56 and named by top tobottom depth (e.g., 0.7–0.9 m). For each horizon, a bulk sample was collectedquantitatively (i.e., from top to bottom edges to represent the average bulk com-position of each horizon). Previous bulk Δ14C measurements indicate a fractionmodern (Fm) value of ~0.28 (in the high organic content sample) and similarvalues for nearby subsoils47–49, as well as high oxalate-extractable (noncrystallineand semicrystalline) Fe and Al mineral contents (e.g., allophane, imogolite, andferrihydrite)34 (Supplementary Table 1). Soils were stored at field moisture con-ditions in coolers during sampling and transport (4–9 °C range) prior to cryo-STEM sample preparation and imaging (conducted in 2014–2017). Soil sampleswere not dried or frozen to prevent artifacts that may alter the architecture of theorgano–mineral interface57,58.
Cryogenic thin-section preparation. Background: The heterogeneity of soil pro-vides a methodological challenge for preparing soil samples for high-resolutiontransmission electron microscopy, particularly for C, N, and other light elementseasily damaged by high-energy analysis techniques. Specifically, sample preparationapproaches are needed that: (1) maintain mineral–organic, organic–organic, andpore space spatial distribution, (2) eliminate the use of C-based resins that precludethe interpretation of C spectroscopic data, (3) reduce the risk of beam damage,(4) result in appropriate sample thicknesses (<100–200 nm) for electron trans-parency, and (5) avoid freeze–thaw and wet-dry fluctuations that altermineral–OM interactions57,58.
To be able to resolve native soil OM composition, thin-sectioning without theuse of stabilizing materials that interfere with OM detection provides a technicalchallenge and avenue for methodological advancement. For nanoscale secondaryion mass spectrometry (NanoSIMS), this has been addressed by using C-basedresins with distinctive isotope signatures or chemical markers59. However, EELS isgenerally not sensitive to isotope signatures at core-loss edges. Elemental sulfur (S)has been employed as a stabilizing material60 but is sensitive to temperaturechanges, sublimates in the vacuum of the electron microscope at roomtemperature61, and does not fully permeate the aggregate microstructure60.
Performing sample thin-sectioning under cryogenic conditions—a commonway to reduce sample damage for microscopy and spectroscopy of biologicalmaterials62,63—is an approach to stabilize hydrated soil samples that precludes theneed for either C-based resins or elemental S15. Cryo-thin-sectioning followed byroom-temperature imaging and spectroscopy is a common approach, thoughsample thawing and drying is often required15. To address the methodologicalchallenges above, we developed an integrated sample preparation procedure thatmaintained the soil aggregate in cryogenic conditions for initial sectioning,thinning to electron transparency, and STEM-EELS mapping (SupplementaryFigs. 7–9).
Aggregate cryo-ultramicrotome pre-thinning: Cryogenic thin-sectioning (toapproximately 1–5 μm thickness) was undertaken to improve efficiency andselection of regions for subsequent cryo-focused ion beam (FIB) milling to electrontransparency. Subsamples (~100 g) of bulk soils from two subsoil horizons weresieved (53–150 μm) without added pressure at field moisture to isolate naturalmicroaggregates. This size fraction was selected because microaggregates areexpected to represent the aggregate fraction with the greatest contribution topersistent carbon64–66. Aggregates were sparsely distributed on glass fiber filterpaper (Whatman GF/A) and gradually hydrated with deionized (DI) water usingan ultrasonic humidifier at its lowest setting (SPT Ultrasonic Humidifier,Sunpentown, Inc., City of Industry, CA)15. Single intact microaggregates wereselected with a fine metal pin under a dissecting microscope and transferred to a DIwater droplet on an aluminum cryo-microtome pedestal. This was inverted toencourage migration of the aggregate to the droplet surface, then rapidly cooled byimmersion in slush nitrogen (N2) (average temperature −207 °C67) to decrease thesize of ice crystals relative to a standard freezer (e.g., −20 to −80 °C). Aggregateswere sectioned to a thickness of 1–5 μm with a diamond knife using a Leica EMUC7/FC7 (Leica Microsystems, Inc., Buffalo Grove, IL). The sample temperatureduring microtoming was kept at −60 °C. Thin sections were transferred via drypick-up using an eyelash tool and placed on either 300 or 400-mesh, adhesive-coated, copper TEM grids, and stored in cryo-TEM grid boxes under liquid N2.
Cryo-FIB transfer: Pre-thinned samples were transferred from storage to thecryo-FIB stage at temperatures near that of liquid N2 and maintained in the cryo-FIB at −165 °C. Further details describing the cryo-transfer system are publishedin ref. 68.
Cryogenic FIB Milling: Preparation of <100–200 nm sections for STEM-EELSwas completed using an FEI Strata 400 STEM DualBeam FIB (FEI Company,Hillsboro, OR) equipped with a Quorum PP3010T Cryo-FIB/SEM PreparationSystem (Laughton, East Sussex, UK). To maintain spatial characteristics andprevent sample loss or damage for relatively brittle and heterogeneous soil thinsections, two thinning approaches were adopted: (1) thinning with the Ga+ ionbeam at a shallow angle to the surface of the soil section, creating a wedge with atapered thickness and an edge approaching zero thickness; and (2) milling bothabove and below the region of interest in the soil section at a shallow angle togenerate a lamella of nearly uniform thickness (<200 nm) in the material(Supplementary Figs. 8, 9). Scanning EM images to monitor the milling processwere collected sparingly at 5 kV, using a low beam current to minimize damage.
For milling, an ion beam voltage of 30 kV was used, with current varying betweenapproximately 5 and 500 pA.
Cryo-FIB sample damage assessment: While cryogenic techniques improvesample integrity62,63, sample damage remains a consideration for both cryogenicFIB sample preparation and subsequent cryogenic analytical electron microscopy.In order to assess improvement in sample integrity with cryo-FIB samplepreparation versus using room temperature FIB, we completed the preparation andimaging of a volcanic soil sample thin-section using room-temperature lift-out FIBtechniques. Initial pre-thinning to approximately 1–5 µm-thickness was completedusing cryogenic ultramicrotome preparation as described for cryogenic FIB. Aftercryo-ultramicrotome thinning, thin sections were transferred to 400-mesh copperTEM grids with self-prepared thin C coating, brought to room temperature, andair-dried.
Samples were transferred to an FEI Strata 400 STEM FIB instrument (FEICompany, Hillsboro, OR) at room temperature. After air-drying, the aggregatecross-section broke apart along natural pore space borders, allowing for FIB lift-outof appropriately sized aggregate regions (approximately 20 × 15 × 1 µm) withouton-grid cross-section (e.g., trench) milling (Supplementary Fig. 10). The aggregateregion of interest was fastened to a tungsten (W) FIB lift-out needle usingdeposited platinum (Pt) organo-metallic alloy and transferred to a Cu TEM lift-outgrid (Electron Microscopy Sciences, Hatfield, PA). After transfer, the top edge ofthe sample was coated with Pt for further thinning. The sample was stored dry atroom temperature prior to STEM imaging in an FEI F20 S/TEM instrument (FEICompany, Hillsboro, OR) at 200 kV.
With room temperature FIB, sample redeposition during milling and distortionof sample structure was observed at both the millimeter and nanometer-scale(Supplementary Fig. 10). Higher-contrast spots are likely a result of theredeposition of sample material, or possibly implantation of gallium ions (Ga+)directly from the ion beam milling. While some Ga+ was detected in cryo-FIBsamples (Supplementary Fig. 1), the sample distortion and higher-contrast spotsobserved with room-temperature FIB were not observed with cryo-FIB samplepreparation (Fig. 2).
Cryogenic EDX elemental analysis. The elemental composition of the soil thinsections was assessed using electron dispersive X-ray (EDX) spectroscopy. For theorgano–mineral interface soil sample (wedge thin section), elemental maps werecollected for regions located near the primary EELS analysis region with an FEI F20TEM-STEM instrument (FEI Company, Hillsboro, OR) equipped with an OxfordInstruments X-Max 80 mm2 EDX detector (Oxford Instruments, Abingdon,Oxfordshire, UK) (Supplementary Figs. 1, 2). For the organo–organic interface soilsample (lamella thin section), an EDX point scan was collected (5 kV voltage)adjacent to the thin-section area during cryo-FIB preparation with an OxfordInstruments X-Max 80 mm2 EDX detector installed on the FEI Strata FIB/SEMinstrument described above (Supplementary Fig. 3).
Cryogenic STEM-EELS. Wedge thin-sections were transferred under liquid N2
into a Gatan Model 626 cryo-transfer holder, and subsequently into an FEI F20TEM STEM instrument (FEI Company, Hillsboro, OR) equipped with a GatanTridium spectrometer (Gatan Inc., Pleasanton, CA) which was operated at 200 kVfor the EELS experiments. Lamella thin-sections were similarly transferred into anaberration-corrected FEI Titan Themis S/TEM instrument (FEI Company, Hills-boro, OR) with a Gatan GIF Quantum 965 spectrometer (Gatan Inc., Pleasanton,CA) operated at 120 kV. During experiments on both instruments, the sampleswere maintained at approximately −180 °C.
ROI for high-resolution imaging and analysis were selected based on the sampleposition (over vacuum) and electron transparency. Given these criteria were met,the analysis was conducted on visible features with contrast differences and adetectable C signal. The approach to selecting the analysis region is described indetail in Supplementary Fig. 7 (analysis workflow).
Overview annular dark-field STEM images were obtained prior to the collectionof EELS point and line spectra (wedge) and 2D maps (lamella). EELS data werecollected with parameters to optimize EELS counts but minimize dose(Supplementary Table 4). For EELS maps collected on the Titan Themisinstrument, DualEELS was used to simultaneously collect the low-loss and high-loss regions, and the zero-loss peak position was used to correct for energy shifts inthe data due to large fields of view.
Cryo-STEM-EELS spatial resolution: Fundamentally, the spatial resolution of ameasurement is limited by the STEM probe size, ranging from sub-Å (Titaninstrument) to ~2 Å (F20 instrument). However, when performing EELS mappingover relatively large fields of view (in Figs. 3–5)—important for capturing relevantfeatures in the soil specimen—the spatial sampling, i.e., the step size, sets theeffective lower limit of spatial resolution relevant to statistical analysis of EELSdata. In this study, step sizes used were an order of magnitude larger than theSTEM probe size to minimize sample damage. The smallest step size used in thisstudy was ~1 nm (10 Å), resulting in an effective spatial resolution of 2 nm set bythe Nyquist limit (Figs. 3d, 4, and 5).
Cryo-STEM-EELS damage assessment: We assessed evidence of artifacts in the CK-edge resulting from the cryo-STEM-EELS analysis. For the organo–organicinterface sample (Titan instrument), potential sample damage from cryo-STEM-EELS was assessed by repeated measurements of a semicrystalline iron oxide-
ARTICLE NATURE COMMUNICATIONS | https://doi.org/10.1038/s41467-020-19792-9
8 NATURE COMMUNICATIONS | (2020) 11:6103 | https://doi.org/10.1038/s41467-020-19792-9 | www.nature.com/naturecommunications
organic material serving as reference material for the volcanic semicrystalline soilsanalyzed. The reference material was prepared by precipitation of ferrihydrite(nominally Fe2O3·0.5H2O) in the presence of water-extractable organic matter(WEOM) derived from a soil organic horizon (Oa) at a 10:1 C:Fe ratio (WEOMextraction methods described in ref. 36). Precipitation of ferrihydrite was completedusing a low-concentration modification of standard laboratory ferrihydritesynthesis69 and purified by dialysis (1000 D molecular weight cut-off).Ferrihydrite-WEOM suspensions were applied to Cu grids and air-dried. Sampleswere transferred at room temperature to an aberration-corrected FEI Titan ThemisS/TEM instrument (FEI Company, Hillsboro, OR) with a Gatan GIF Quantum965 spectrometer (Gatan Inc., Pleasanton, CA) operated at 120 kV. The sampleswere cooled after loading into the instrument for cryo-STEM-EELS toapproximately −180 °C.
Sample damage was assessed by 7 repeated EELS measurements (640 kxmagnification) of the C K-edge over the same field of view (1247 × 1247 Å2). Forthe damage test, total dose ranged from ~10,000 (initial) to 67,000 (final) electrons(e−) Å−2 (Supplementary Table 4). Spectra were processed using the CornellSpectrum Imager package70 in ImageJ v. 2.0.071. Background subtraction wasperformed using a standard linear combination of power laws (LCPL) with thebackground subtraction region of 209.9–259.3 eV. The C K-edge intensity wasestimated by calculation of area under the curve (AUC) from 280.0 to 315.0 eV inthe DescTools package for R in RStudio72–74. The ratio of the integrated areabetween lower (284.5–286.5 eV) higher-energy (286.5–289.0 eV) spectral regions(normalized to the total C area) was used to assess change in fine structure as afunction of electron dose. For all AUC calculations, intensity counts less than 0were excluded.
Only minor changes in total C intensity and low/high-energy ratios wereobserved across the damage test series (Supplementary Fig. 11). Both total C andlow/high-energy ratios increased slightly between 10,000 and ~20,000 e−Å−2 dose,suggesting that for the highest magnification EELS map (~11,000 e−Å−2), theintensity of lower-energy features may be overestimated relative to lower-magnification EELS maps (Supplementary Fig. 11). However, the interpretations ofshifts in fine structure ratios of the organo–organic interface are contained withinthe same EELS map. In addition, no appearance of new features with increasingdoses (i.e., damage artifacts) were observed (Supplementary Fig. 11). The lack ofartifact development attests to EELS data quality.
For the organo–mineral interface sample (F20 instrument), multiple point scansin the thin OM region adjacent to the organo–mineral interface (Fig. 2) were usedto assess the effect of increasing dose (by a factor of 3.5) on the C K-edge EELSspectrum. Dose estimates are summarized in Supplementary Table 4. Withincreasing dose, a slight decrease in the ratio of high (region x)/low (region y)energy regions was observed (Fig. 2). For point 1, ratio x/y= 1.1 and for points 2and 3, x/y= 1.0. However, the lack of change between points 2 and 3 despite a1.25-factor increase in the dose (Supplementary Table 4) suggests that thesedifferences may be due to fine-scale sample heterogeneity rather than beamdamage. Further, the same dose was used for each point in the organo–mineralinterface lines as for adjacent OM point 1, supporting the validity of comparinghigh-/low-energy ratios. Accounting for ranges in high-/low-energy features givenpotential sample damage, the enrichment of higher-energy C features at theorgano–mineral interface (33%) could range from ~16 to 53% (minimum x/y= 1.1vs. 1.3 and maximum x/y= 1.0 vs. 1.5) (Supplementary Table 2).
Image and spectral analysis. Electron energy-loss spectra: EELS data (spectrumimages, line scans, and point data) were initially processed using the CornellSpectrum Imager package70 in ImageJ v. 2.0.071. Background subtraction wasperformed using a linear combination of power laws (LCPL) function with thefollowing background subtraction regions: C K-edge (210.0–259.5 eV), N K-edge(369.8–388.8 eV), and O K-edge (488.0–510.0 eV) for organo–organic interfacespectra. For the organo–mineral interface sample, the 260.0 to 276.9–277.0 eVenergy region was used for the C K-edge, and 369.0–378.8 to 385.4–394.2 eV forthe N K-edge. The background subtraction was performed with 3-pixel over-sampling. One outlier point (at 405.8 eV) was excluded from all N K-edge spectraat the mineral interface due to detector error. For the EELS spectrum images andline scans, energy alignment was completed using the peak position of the zero-losspeak in low-loss EELS datasets paired to each measurement by nearby location orsimultaneous measurement. For the adjacent OM to the organo–mineral interface,the high magnification precluded the use of zero-loss measurements and no energyshift was applied.
To estimate the intensity of non-normalized spectra for elemental and finestructural ratios, the integrated area was approximated by applying the AUCfunction (trapezoidal method) in the DescTools package for R in RStudio72–74. Forall spectra, total C and N integration regions were set to 280.0–315.0 eV and395.0–430.0 eV, respectively. For the organo–mineral interface, the higher- andlower-energy regions (called here regions x and y) were set to 286.6–289.0 eV and284.0–286.5 eV, respectively. For the organo–organic interface, O integrated areawas determined for 530.0–565.0 eV, and higher-energy (putatively alkyl C) andlower-energy (aromatic C) integrated areas were determined for 286.0–287.5 eVand 284.25–285.75 eV regions, respectively. For all AUC calculations, intensitycounts less than 0 were excluded. The EELS spectra were not flattened or otherwiseadjusted. For calculations of aromatic/alkyl ratios (e.g., Figs. 4 and 5) and other fine
structure analyses of C, the integrated area was normalized to the total Cintegrated area.
EELS fine structure analysis: Statistical analysis of the EELS fine structure for theorgano–organic interface was conducted by MCR as described previously37,75,76,performed in this study using Matlab v. R2017a. Briefly, MCR is an approach todecompose a spectrum image matrix into substituent components without a prioriknowledge of chemical composition or use of analytical standards, given a setnumber of components and an initial selection of putative components. Theresulting spectral components are then fit to the original data to produce mapsshowing component spatial distribution, such as those shown in Fig. 3.
Data availabilityThe analytical microscopy data that support the findings of this study are available in theCornell University eCommons Repository with the identifier https://doi.org/10.7298/6vtr-c66877.
Code availabilityCode used for multivariate curve resolution (MCR) analysis is available on reasonablerequest to the authors.
Received: 17 January 2020; Accepted: 30 October 2020;
References1. Lal, R. Soil carbon sequestration impacts on global climate change and food
security. Science 304, 623–1627 (2004).2. Schmidt, M. W. I. et al. Persistence of soil organic matter as an ecosystem
property. Nature 478, 49–56 (2011).3. Ciais, P. et al. Carbon and other biogeochemical cycles. in Climate Change
2013: The Physical Science Basis. Contribution of Working Group I to the FifthAssessment Report of the Intergovernmental Panel on Climate Change (edsStocker, T. F. et al.) Chapter 6, 465–570 (IPCC, Cambridge University Press,2013).
4. Lehmann, J. & Kleber, M. The contentious nature of soil organic matter.Nature 528, 60–68 (2015).
5. Wieder, W. R., Grandy, A. S., Kallenbach, C. M. & Bonan, G. B. Integratingmicrobial physicology and physio-chemical principles in soils with theMIcrobial-MIneral Carbon Stabilization (MIMICS) model. Biogeosciences 11,3899–3917 (2014).
6. Solomon, D., Lehmann, J., Kinyangi, J., Liang, B. & Schäfer, T. Carbon K-edgeNEXAFS and FTIR-ATR spectroscopic investigation of organic carbonspeciation in soils. Soil Sci. Soc. Am. J. 69, 107–119 (2005).
7. Lehmann, J. et al. Spatial complexity of soil organic matter forms atnanometre scales. Nat. Geosci. 1, 238–242 (2008).
8. Torn, M. S., Trumbore, S. E., Chadwick, O. A., Vitousek, P. M. & Hendricks,D. M. Mineral control of soil organic carbon storage and turnover. Nature389, 170–173 (1997).
9. Deng, Y. & Dixon, J. B. Soil organic matter and organic-mineral interactions.In Soil Mineralogy with Environmental Applications, SSSA Book Series No. 7.(eds Dixon, J. B. & Shultze, D. G.) (Soil Science Society of America, Madison,WI, 2002).
10. Kleber, M. et al. Mineral-organic associations: formation, properties, andrelevance in soil environments. Adv. Agron. 130, 1–140 (2015).
11. Nunan, N. et al. Quantification of the in situ distribution of soil bacteria bylarge-scale imaging of thin sections of undisturbed soil. FEMS Microbiol. Ecol.37, 67–77 (2001).
12. Raynaud, X. & Nunan, N. Spatial ecology of bacteria at the microscale in soil.PLoS ONE 9, e8217 (2014).
13. Vogel, C. et al. Submicron structures provide preferential spots for carbon andnitrogen sequestration in soils. Nat. Commun. 5, 2947 (2014).
14. Steffens, M. et al. Identification of distinct functional microstructural domainscontrolling C storage in soil. Environ. Sci. Technol. 51, 12181–12189 (2017).
15. Kinyangi, J. et al. Nanoscale biogeocomplexity of the organomineralassemblage in soil: Application of STXM microscopy and C 1s-NEXAFSspectroscopy. Soil Sci. Soc. Am. J. 70, 1708–1718 (2006).
16. Lehmann, J., Kinyangi, J. & Solomon, D. Organic matter stabilization in soilmicroaggregates: implications from spatial heterogeneity of organic carboncontents and carbon forms. Biogeochemistry 85, 45–57 (2007).
17. Lehmann, J. & Solomon, D. Organic carbon chemistry in soils observed bysynchrotron-based spectroscopy. in Developments in Soil Science, Vol. 34 (edsMcBratney, A. B. & Hartemink, A. E.), 289–312 (Elsevier, 2010).
18. Milne, A. E., Lehmann, J., Solomon, D. & Lark, R. M. Wavelet analysis of soilvariation at nanometre to micrometer-scales: an example of organic carboncontent in a micro-aggregate. Eur. J. Soil Sci. 62, 617–628 (2011).
NATURE COMMUNICATIONS | https://doi.org/10.1038/s41467-020-19792-9 ARTICLE
NATURE COMMUNICATIONS | (2020) 11:6103 | https://doi.org/10.1038/s41467-020-19792-9 | www.nature.com/naturecommunications 9
19. Solomon, D. et al. Micro- and nano-environments of carbon sequestration:multi-element STXM-NEXAFS spectromicroscopy assessment of microbialcarbon and mineral associations. Chem. Geol. 329, 53–73 (2012).
20. Kleber, M., Sollins, P. & Sutton, R. A conceptual model of organo-mineralinteractions in soils: self-assembly of organic molecular fragments into zonalstructures on mineral surfaces. Biogeochemistry 85, 9–24 (2007).
21. Sollins, P. et al. Organic C and N stabilization in a forest soil: Evidence fromsequential density fractionation. Soil Biol. Biochem. 38, 3313–3324 (2006).
22. Mayer, L. M. & Xing, B. Organic matter-surface area relationships in acidsoils. Soil Sci. Soc. Am. J. 65, 250–258 (2001).
23. Schmidt, M. P. & Martinez, C. E. Supramolecular association impactsbiomolecule adsorption onto goethite. Environ. Sci. Technol. 52, 4079–4089(2018).
24. Rasmussen, C. et al. Beyond clay: towards an improved set of variables forpredicting soil organic matter content. Biogeochemistry 137, 297–306 (2018).
25. Kramer, M. G. & Chadwick, O. A. Climate-driven thresholds in reactivemineral retention of soil carbon at the global scale. Nat. Clim. Change 8,1104–1108 (2018).
26. Kramer, M. G., Sanderman, J., Chadwick, O. A., Chorover, J. & Vitousek, P.M. Long-term carbon storage through retention of dissolved aromatic acids byreactive particles in soil. Glob. Change Biol. 18, 2594–2605 (2012).
27. Knicker, H. Soil organic N—an under-rated player for C sequestration insoils? Soil Biol. Biochem. 43, 1118–1129 (2011).
28. Keiluweit, M. et al. Nano-scale investigation of the association of microbialnitrogen residues with iron (hydr)oxides in a forest soil O-horizon. Geochim.Cosmochim. Acta 95, 213–226 (2012).
29. Heckman, K., Throckmorton, H., Horwath, W. R., Swanston, C. W. &Rasmussen, C. Variation in the molecular structure and radiocarbonabundance of mineral-associated organic matter across a lithosequence offorest soils. Soil Syst. 2, 2020036 (2018).
30. Grant, K. E., Galy, V. V., Chadwick, O. A. & Derry, L. A. Thermal oxidation ofcarbon in organic matter rich volcanic soils: insights into SOC agedifferentiation and mineral stabilization. Biogeochemistry 144, 291–304(2019).
31. Kaznacheyev, K. A. et al. Inner-shell absorption spectroscopy of amino acids.J. Chem. Phys. 106, 3153–3168 (2002).
32. Solomon, D. et al. Carbon (1s) NEXAFS spectroscopy of biogeochemicallyrelevant reference organic compounds. Soil Sci. Soc. Am. J. 73, 1817–1830(2009).
33. Zhao, Q. et al. Iron-bound organic carbon in forest soils: quantification andcharacterization. Biogeosciences 13, 4777–4788 (2016).
34. Inagaki, T. M. et al. Subsoil organo-mineral associations under contrastingclimate conditions. Geochim. Cosmochim. Acta 270, 244–263 (2020).
35. Cotrufo, M. F., Wallenstein, M. D., Boot, C. M., Denef, K. & Paul, E. TheMicrobial Efficiency-Matrix Stabilization (MEMS) framework integrates plantlitter decomposition with soil organic matter stabilization: do labile plantinputs form stable soil organic matter? Glob. Change Biol. 19, 988–995 (2013).
36. Possinger, A. R. et al. Organo-mineral interactions and soil carbonmineralizability with variable saturation cycle frequency. Geoderma 375,114483 (2020).
37. Zachman, M. J. et al. Cryo-STEM mapping of solid-liquid interfaces anddendrites in lithium-metal batteries. Nature 560, 345–349 (2018).
38. Sutton, R. & Sposito, G. Molecular structure in soil humic substances: the newview. Environ. Sci. Technol. 39, 9009–9015 (2005).
39. Verkaik, E., Jongkind, A. G. & Berendse, F. Short-term and long-term effectsof tannins on nitrogen mineralisation and litter decomposition in kauri(Agathis australis (D. Don) Lindl.) forests. Plant Soil 287, 337–345 (2006).
40. Six, J., Conant, R. T., Paul, E. A. & Paustian, K. Stabilization mechanisms ofsoil organic matter: implications for C-saturation of soils. Plant Soil 241,155–176 (2002).
41. Stewart, C. E., Paustian, K., Conant, R. T., Plante, A. F. & Six, J. Soil carbonsaturation: evaluation and corroboration by long-term incubations. Soil Biol.Biochem. 40, 1741–1750 (2008).
42. Riggs, C. E., Hobbie, S. E., Bach, E. M., Hofmockel, K. S. & Kazanski, C. E.Nitrogen addition changes grassland soil organic matter decomposition.Biogeochemistry 125, 203–219 (2015).
43. Lawrence, D. et al. Technical Description of Version 5.0 of the CommunityLand Model (CLM) (National Center for Atmospheric Research, UniversityCorporation for Atmospheric Research, Boulder, CO, 2018).
44. Kazanski, C. E., Riggs, C. E., Reich, P. B. & Hobbie, S. E. Long-term nitrogenaddition does not increase soil carbon storage or cycling across eithertemperature forest and grassland sites on a sandy outwash plain. Ecosystem 22,1592–1605 (2019).
45. Stockmann, U. et al. The knowns, known unknowns and unknowns ofsequestration of soil organic carbon. Agric. Ecosyst. Environ. 164, 80–99(2013).
46. Totsche, K. U. et al. Microaggregates in soils. J. Plant Nutr. Soil Sci. 181,104–136 (2018).
47. Hemingway, J. D. et al. Mineral protection regulates long-term globalpreservation of organic carbon. Nature 570, 228–231 (2019).
48. Hemingway, J. D. et al. Assessing the blank carbon contribution, isotope massbalance, and kinetic isotope fractionation of the ramped pyrolysis/oxidationinstrument at NOSAMS. Radiocarbon 59, 179–193 (2017).
49. Hemingway, J. D. Ramped Pyrolysis/Oxidation (RPO) Database (Version0.0.1) Data set. Zenodo https://doi.org/10.5281/zenodo.1158742 (2018).
50. Jokisaari, J. R. et al. Vibrational spectroscopy of water with high spatialresolution. Adv. Mater. 30, 1802702 (2018).
51. Hachtel, J. A. et al. Identification of site-specific isotopic labels by vibrationalspectroscopy in the electron microscope. Science 363, 525–528 (2019).
52. Eswaran, H. et al. Global carbon stocks. in Global Climate Change andPedogenic Carbonates (eds Lal, R. et al.) 13–26 (Lewis Publishers, 2000).
53. Kelly, E. F., Chadwick, O. A. & Hilinski, T. E. The effect of plants on mineralweathering. Biogeochemistry 42, 21–53 (1998).
54. Kleber, M., Mikutta, R., Torn, M. S. & Jahn, R. Poorly crystalline mineralphases protect organic matter in acid subsoil horizons. Eur. J. Soil Sci. 56,717–725 (2005).
55. Chadwick, O. A., Kelly, E. F., Hotchkiss, S. C. & Vitousek, P. M. Precontactvegetation and soil nutrient status in the shadow of Kohala Volcano. Hawaii.Geomorphol. 89, 70–83 (2007).
56. Schoeneberger, P. J., Wysocki, D. W., Behnam, E. C. & Broderson, W. D. FieldBook for Describing and Sampling Soils (Natural Resources ConservationService, USDA, National Soil Survey Center, 1998).
57. Kaiser, M., Kleber, M. & Berhe, A. A. How air-drying and rewetting modifysoil organic matter characteristics: an assessment to improve datainterpretation and inference. Soil Biol. Biochem. 80, 324–340 (2015).
58. Kim, E.-A. & Choi, J. H. Changes in the mineral element compositions of soilcolloidal matter caused by a controlled freeze-thaw event. Geoderma 318,160–166 (2018).
59. Höschen, C. et al. Novel sample preparation technique to improvespectromicroscopic analyses of micrometer-sized particles. Environ. Sci.Technol. 49, 9874–9880 (2015).
60. Lehmann, J. et al. Near-edge X-ray absorption fine structure (NEXAFS)spectroscopy for mapping nano-scale distribution of organic carbon forms insoil: Application to black carbon particles. Glob. Biogeochem. Cycles 19,GB1013 (2005).
61. Levin, B. D. A. et al. Characterization of sulfur and nanostructured sulfurbattery cathodes in electron microscopy without sublimation artifacts.Microsc. Microanal. 23, 155–162 (2017).
62. Van Heel, M. et al. Single-particle electron cryo-microscopy: towards atomicresolution. Q. Rev. Biophys. 33, 307–369 (2000).
63. Miot, J., Benzerara, K. & Kappler, A. Investigating microbe-mineralinteractions: recent advances in X-ray and electron microscopy and redox-sensitive methods. Annu. Rev. Earth Planet. Sci. 42, 271–289 (2014).
64. Edwards, A. P. & Bremner, J. M. Microaggregates in soils. J. Soil Sci. 18, 64–73(1967).
65. Six, J., Elliott, E. T. & Paustian, K. Soil macroaggregate turnover andmicroaggregate formation: a mechanism for C sequestration under no-tillagriculture. Soil Biol. Biochem. 32, 2099–2103 (2000).
66. Tisdall, J. M. & Oades, J. M. Organic matter and water-stable aggregates insoils. J. Soil Sci. 33, 141–163 (1982).
67. Sansimena, M., Santon, M. V., Zaritzky, N. & Chirife, J. Comparison of heattransfer in liquid and slush nitrogen by numerical simulation of cooling ratesfor French straws used for sperm cryopreservation. Theriogenology 77,1717–1721 (2012).
68. Zachman, M. J., Asenath-Smith, E., Estroff, L. A. & Kourkoutis, L. F. Site-specific preparation of intact solid-liquid interfaces by label-free in situlocalization and cryo-focused ion beam lift-out. Microsc. Microanal. 22,1338–1349 (2016).
69. Schwertmann, U. & Cornell, R. M. Iron Oxides in the Laboratory: Preparationand Characterization, 2nd Edition (Wiley-VCG Verlag GmbH, Weinheim,DE, 2000).
70. Cueva, P., Hovden, R., Mundy, J. A., Xin, H. L. & Muller, D. A. Dataprocessing for atomic resolution electron energy loss spectroscopy. Microsc.Microanal. 18, 667–675 (2012).
71. Schneider, C. A., Rasband, W. S. & Eliceiri, K. W. NIH Image to ImageJ: 25years of image analysis. Nat. Methods 9, 671–675 (2012).
72. Signorell, A. et al. DescTools: Tools for Descriptive Statistics. R Package Version0.99.28 (2019).
73. R Core Team. R: A Language and Environment for Statistical Computing. (RFoundation for Statistical Computing, Vienna, Austria, 2017) https://www.R-project.org/.
74. RStudio Team. RStudio: Integrated Development for R. (RStudio, Inc., Boston,MA, 2017). http://www.rstudio.com/.
75. Mundy, J. A. et al. Visualizing the interfacial evolution from chargecompensation to metallic screening across the manganite metal-insulatortransition. Nat. Commun. 5, 3464 (2014).
ARTICLE NATURE COMMUNICATIONS | https://doi.org/10.1038/s41467-020-19792-9
10 NATURE COMMUNICATIONS | (2020) 11:6103 | https://doi.org/10.1038/s41467-020-19792-9 | www.nature.com/naturecommunications
76. Baek, D. J. et al. Ultrathin epitaxial barrier layer to avoid thermally inducedphase transformation in oxide heterostructures. ACS Appl. Mater. Interfaces 9,54–59 (2016).
77. Possinger, A. R. et al. Data From: Organo-Organic and Organo-MineralInterfaces in Soil at the Nanometer Scale. Data Set. https://doi.org/10.7298/6vtr-c668 (Cornell University eCommons Repository, 2020).
AcknowledgementsFunding for this study was provided by the NSF IGERT in Cross-Scale Biogeochemistryand Climate at Cornell University (NSF Award #1069193) and the Technical Universityof Munich Institute for Advanced Study. Additional research funds were provided by theAndrew W. Mellon Foundation and the Cornell College of Agriculture and Life SciencesAlumni Foundation. M.J.Z. and L.F.K. acknowledge support by the NSF (DMR-1654596)and Packard Foundation. This work made use of the Cornell Center for MaterialsResearch Shared Facilities which are supported through the NSF MRSEC program(DMR-1719875). Additional support for the FIB/SEM cryo-stage and transfer system wasprovided by the Kavli Institute at Cornell (KIC) for Nanoscale Science and the EnergyMaterials Center at Cornell, DOE EFRC BES (DE-SC0001086). The FEI Titan Themis300 was acquired through NSF-MRI-1429155, with additional support from CornellUniversity, the Weill Institute, and the KIC. The authors thank Katherine E. Grant andLouis A. Derry (Cornell University Earth and Atmospheric Sciences) for providing soilsamples from the Polulu Flow, HI. The authors also thank John Grazul and MalcolmThomas of the CCMR facility for technical assistance.
Author contributionsA.R.P and J.L. developed the research question and scope and wrote the paper. D.A.M, L.F.K., B.D.A.L, and M.J.Z. provided guidance in method development and data inter-pretations. A.E. conducted sample preparation using the cryo-ultramicrotome andprovided general technical assistance and method development. B.D.A.L., M.J.Z., and A.R.P. collected microscopy and spectroscopy data, conducted data analysis, and generatedplots, figures, and images in the manuscript. All authors contributed to paper revisions.
Competing interestsThe authors declare no competing interests.
Additional informationSupplementary information is available for this paper at https://doi.org/10.1038/s41467-020-19792-9.
Correspondence and requests for materials should be addressed to J.L.
Peer review information Nature Communications thanks the anonymous reviewers fortheir contributions to the peer review of this work. Peer review reports are available.
Reprints and permission information is available at http://www.nature.com/reprints
Publisher’s note Springer Nature remains neutral with regard to jurisdictional claims inpublished maps and institutional affiliations.
Open Access This article is licensed under a Creative CommonsAttribution 4.0 International License, which permits use, sharing,
adaptation, distribution and reproduction in any medium or format, as long as you giveappropriate credit to the original author(s) and the source, provide a link to the CreativeCommons license, and indicate if changes were made. The images or other third partymaterial in this article are included in the article’s Creative Commons license, unlessindicated otherwise in a credit line to the material. If material is not included in thearticle’s Creative Commons license and your intended use is not permitted by statutoryregulation or exceeds the permitted use, you will need to obtain permission directly fromthe copyright holder. To view a copy of this license, visit http://creativecommons.org/licenses/by/4.0/.
© The Author(s) 2020
NATURE COMMUNICATIONS | https://doi.org/10.1038/s41467-020-19792-9 ARTICLE
NATURE COMMUNICATIONS | (2020) 11:6103 | https://doi.org/10.1038/s41467-020-19792-9 | www.nature.com/naturecommunications 11