Embed Size (px)
Citation preview

Organizational Structure and Coordination in Electronic
Retailing: A Competitive Analysis
Abstract
This study examines coordination issues that occur between the Marketing department and the
Information Technology (IT) department in electronic retail settings. The Marketing department is
responsible for traffic generation whereas the Information Technology is responsible for choosing IT
capacity to provide web visitors a satisfactory web experience. The focus here is to examine how
duopolistic completion among firms can affect the structure as well as coordination processes that occur
between the internal units of firms, i.e., how the nature of intra-firm coordination is affected in the
presence of inter-firm competition. As a benchmark, we set and solve a centralized spending model where
the levels of advertising and IT capacity are jointly chosen in each firm to maximize profit. This is
compared with an uncoordinated spending model, in which the marketing department over-advertises
because IT costs (capacity cost and lost sales due to inadequate capacity) are ignored. A sequential
coordination scheme is discussed, in which optimized decisions can be achieved via a two-part tariff
contract between the two departments. We find that competition can sometimes lead to an uncoordinated
equilibrium (where both firms chose not to coordinate among their internal departments) at the firms.
More importantly, we find that an asymmetric uncoordinated equilibrium could be Pareto-dominant. We
examine the impact of the inter-firm competition on firm profit, satisfied customers, and the coordinating
tariff.
Keywords: intra-organization, coordination, advertising competition
2
1. Introduction
In recent years, there has been a remarkable increase in online shopping. According to analysts at
Forrester Research, online retail sales in the United States in 2010 grew 12.6% to reach $176.2 billion,
and were projected to reach $278.9 billion in 2015 (Mulpuru et al. 2011). This market is likely to keep
growing since the worldwide online population is projected to grow to 2.7 billion in 2015, which will
account for 40% of the world’s population (IDC, 2011). As electronic commerce expands, the drive for
web traffic and online marketing among electronic retailing firms continues to become more competitive
(Mullaney and Hof 2004).
With a growing competition, electronic retailers tend to act more aggressively to attract customers,
spending more on marketing effort. However, more traffic drawn to a website can result in a poor web
site performance and lost customers, unless online visitors are adequately served. With abundant
alternatives and with speedier broadband connection, consumers are becoming increasingly intolerant to
slowdowns. According to the market analysis firm Zona Research, more than $21 billion lost sales per
year occur due to slow response time (Tillett 2001). In 2010, Bojan Simic, the founder of TRAC Research,
estimated that $4,100 of revenue was lost per hour due to slow web site performance (Choney 2011).
A system slow-down can occur when a system capacity is not sufficient to handle the incoming
traffic. For electronic retailers, this might be because of inaccurate traffic estimation and capacity
requirements (Karpinski 2000) or unbalanced resource allocation between marketing effort and IT
capacity planning. If an e-tailer puts in too much marketing effort to draw traffic but does not provide
adequate capacity, customers are likely to be lost, often never to return. Hence, to fully take advantage of
the incoming traffic, e-tailers must avoid over-advertising, and coordinate marketing effort decisions with
IT capacity decisions.
Coordination has been an important element of organizational strategy, and is a key issue in the
design of organizational structures and processes (de Vreede, van Eijck, 1998). Coordination within
organizations, especially with marketing departments has been reported and extensively studied over

3
many decades (Anderson et al 1965). However, as IT systems become increasingly customer-facing,
managing Information Technology (IT) has become an important aspect of organizational strategy. Not
only is IT a tool for automation, but more importantly, IT can enable organizational change leading to
significant productivity gains (Dedrick et al. 2003). In e-retailing, along with Marketing, IT is core
business function and must be integrated as a key player in organizational planning (Eschbach, 2007).
In this paper, we examine coordination issues between the Marketing and IT functions of firms in a
competitive setting. We study these issues in the context of two electronic retailers that engage in traffic
competition. In most pervious research, however, coordination has been discussed from a pure intra-
organizational lens. We argue here that internal organizational units (namely, Marketing and IT) may
have to adjust their coordination strategies when outside competitive pressures act on the firms.
Surprisingly, we find that firms may sometimes prefer not to coordinate internally in response to
competition.
To provide a clearer understanding into the need for coordination between the Marketing and IT
departments of an e-tailing firm, consider a customer’s visit to a typical e-commerce site. The visit may
turn into an actual sale or the customer may leave without buying. In the latter case, the customer may
finish browsing but decide not to purchase or the customer could renege from the web site frustrated by
slow response time. Our study concerns the last scenario, where lost sales occur because of poor web site
performance. To reduce such lost revenue, it may be better to increase IT capacity or attract less traffic
and divert some resources to improve the response time. This requires coordination between the
department responsible for choosing the level of advertising (for simplicity, Marketing) and the
department responsible for choosing the processing capacity of the site (for simplicity, IT). Of course, if
the two decisions are made by a central authority, then the coordination problem is not relevant. In this
case, the problem reduces to one of jointly optimizing traffic generation and IT capacity decisions.
When two firms engage in traffic competition, the equilibrium traffic attracted by each firm affects
the internal structure and coordination processes of the two firms. If a firm chooses to coordinate its
internal departments, the coordination processes within the firm need to react to the external competitive

4
pressure. However, the decision taken by each firm (to coordinate or not) must itself be examined in
equilibrium. Here, in some cases, we find that being uncoordinated is not only an equilibrium outcome,
but also is one that is preferred by one of the firms.
2. Literature Review
2.1 Horizontal Channels Coordination
The idea of cross-functional organizational coordination has been a consistent interest area in the
organization design literature (Fauli-Oller and Giralt 1995; Carr et al 2008; Kato and Owan 2011).
Shapiro (1977) studies coordinated decisions between the marketing and the production functions of an
organization, and later Pekgun et al (2008) develop a mechanism to coordinate these functions. Typically,
coordinated decisions result in a higher profit for a firm. Kouvelis and Lariviere (2000) develop a
coordination mechanism that utilizes an internal market mechanism. More recently, Faraj and Xiao (2006)
discuss organizational coordination issues in a fast-response environment. Hart and Moore (2005) derive
a theory of coordination as a hierarchy, and argue that an optimal structure is one where a coordination
agent has a higher hierarchical order than a specialization agent. Riechmann and Weimann (2008)
experimentally show that inter-group competition can serve as an efficient intra-firm coordination device.
Tan and Mookerjee (2005) examine internal allocation mechanisms of spending between advertising and
Information Technology.
A considerable amount of research has been devoted to distribution channel structures with intra-
firm coordination using two-part tariff contracts. Bonanno and Vickers (1988) show that a manufacturer
is better off with vertical separation rather than with vertical integration and that two-part tariffs can be
used to extract all retailer-surplus. Coughland and Wernerfelt (1989) show that with two-part tariffs
decentralization results in a unique equilibrium irrespective of the degree of product differentiation.
Contrasting those results, Goupta and Loulou (1998) investigate distribution channel design, where profit-
maximizing retailers are inserted into a system of manufacturers. They highlight the importance of
considering cross-functional interaction across marketing and operational decisions to understand the

5
underlying incentives for firm and market structure. Nault and Tyagi (2001) consider two mechanisms to
coordinate horizontal alliances; linear transfer fees between members if one member’s customers are
served by another member, and an ownership of an equal share of the alliance profits otherwise. More
recently, Zaccour (2008) shows that a two-part tariff policy may not coordinate dynamic marketing
channels.
Coordination with dynamic marketing efforts has been studied in the context of advertising.
Jørgensen et al (2001) examine dynamic advertising and promotion strategies in a marketing channel
where the retailer promotes the manufacturer’s product and the manufacturer spends on advertising to
build a stock of goodwill. By constructing a Stackelberg game, they find a cooperative advertising
program enables both members to get higher profits. More recently, Xie and Wei (2009) investigate the
cooperative advertising problem under the assumption that the market traffic can be affected by both
advertising efforts and retail price, and find that higher channel-wide profits can be generated with a
cooperative advertising strategy as compared to non-cooperative strategy. He et al (2009), examine
optimal feedback Stackelberg strategies in cooperative advertising and pricing in a dynamic and
stochastic marketing channel.
2.2 Vertical Channels Coordination
There is also a rich literature on coordination in supply chain management. Ho et al. (2002) discuss how a
firm should manage its supply processes in a new product diffusion environment with back orders and
lost sales. Another line of study in coordination as profit maximization scheme is inter-firm coordination.
Boyaci and Gallego (2004) explore three strategies for customer service competition between supply
chains; uncoordinated, coordinated, and a hybrid strategy. They find that even though coordination is a
dominant strategy, both supply chains are worse off under a coordinated strategy relative to
uncoordinated strategy.
There exist different mechanisms to induce channel coordination. Weng (1995) examines quantity
discounts and shows that these alone are not sufficient to guarantee joint profit maximization if variable

6
operational costs must be taken into consideration. Xiao and Qi (2008) investigate quantity discount
mechanisms to coordinate a manufacturer with two competing retailers. Raju and Zhang (2005) study
coordination mechanisms between a manufacturer and competing retailers when there is a dominant
retailer, and shows that the manufacturer can be better off when the channel is coordinated with a two-
part tariff. Cachon and Kok (2010) investigate the scenario where there exists one retailer and multiple
competing manufacturers, and find that the retailer is better off with quantity discounts and two-part tariff
contracts as compared to wholesale-price contracts because the manufacturers are forced to compete more
aggressively under these two contracts. Cui et al (2007) examine how channel coordination occurs when
fairness is a important concern among channel members, and find that a simple wholesale price can be set
by the manufacturer to achieve the coordination. Cachon and Lariviere (2005) demonstrate that revenue
sharing contracts can also coordinate a retailer and a supplier, where the retailer can pick the optimal price
and quantity. Linh and Hong (2008) use revenue sharing contracts to induce coordination between a
wholesaler and a retailer, and find that the optimal ratio of revenue sharing increases linearly as the
optimal wholesale price increases.
Li (2002) provides insights on the direct and the indirect effects of vertical information sharing on
the profitability of firms, where the indirect effect is due to changes in strategy by other firms, while
direct effect is due to changes by the involved parties. They find the indirect effect discourages vertical
information sharing on traffic while encouraging information sharing on cost. This is an interesting result
that we can relate to in the context of this paper.
2.3 Impact of Competition on Organizational Behavior
Given the dynamics of global supply landscape, organizational design concerns are critical to sustained
organizational success (Trent 2004). The dynamics of organizational response to competition has been
studied as adaptation theory (Baum and Singh 1996). Another interesting study is on the effects of
competition on retail structure (Miller et al 1999). Henderson and Mitchell (1997) examine the strategy
and performance of an organization as a sequential inter-relationship, and suggest organizations
sequentially adapt capabilities in competitive environments. Degryse and Ongena (2007) study the impact

7
of the inter-bank competition on the orientation of bank branches, and find that the choice of relationship-
based orientation is more common for bank branches with more intense local competition. Vroom (2006)
raises questions on how the combination of organizational structure and compensation systems affects
competition, and vice versa. Following a game theoretical model, the result is that organizational design
can be used as a commitment device to reduce competitive rivalry, and, in equilibrium, firms stay
heterogeneous in terms of organizational design. Competition effects on these vertical channel
coordination mechanisms also have been studied. Yao et al (2008) examine how to coordinate a channel
with one manufacturer and two competing retailers using a revenue-sharing contract.
Our work differs from this stream of previous literature because we consider a sequential intra-firm
coordination scheme in the presence of inter-firm competition.
3. The Model
3.1 Preliminaries
Consider an electronic retailing firm with two departments that produce value through joint work. For
example, Department M (Marketing) is responsible for attracting traffic (or visitors) to the firm’s web site;
while Department IT (Information Technology) is responsible for managing the web site to allow visitors
to browse and place orders. The parameters and decision variables for the following model are
summarized in Table 1.
Table 1. Notation
Parameters:
b Competition intensity (<1)
Marketing
a Advertising cost parameter
Information Technology
Capacity cost coefficient
Decision Variables:
* Optimal traffic level (arrival rate)
* Optimal IT capacity level (processing rate)
Processing Tariff
8
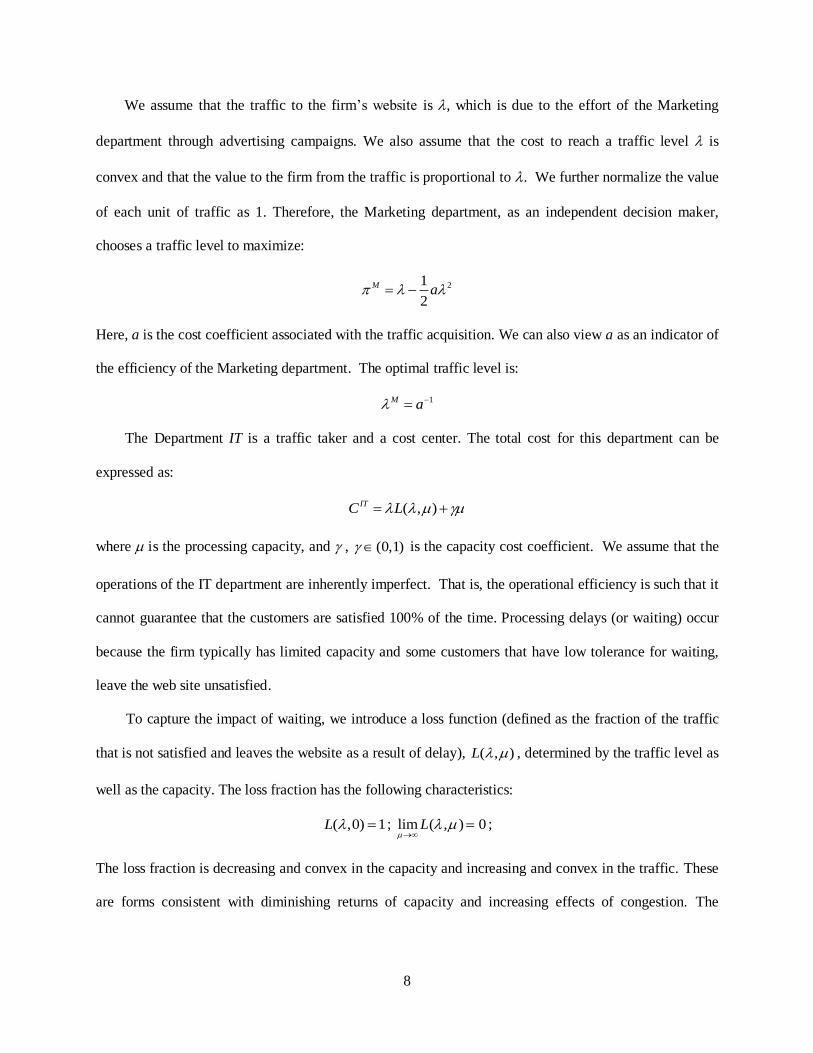
We assume that the traffic to the firm’s website is , which is due to the effort of the Marketing
department through advertising campaigns. We also assume that the cost to reach a traffic level is
convex and that the value to the firm from the traffic is proportional to . We further normalize the value
of each unit of traffic as 1. Therefore, the Marketing department, as an independent decision maker,
chooses a traffic level to maximize:
21
2
M a
Here, a is the cost coefficient associated with the traffic acquisition. We can also view a as an indicator of
the efficiency of the Marketing department. The optimal traffic level is:
1M a
The Department IT is a traffic taker and a cost center. The total cost for this department can be
expressed as:
( , )ITC L
where is the processing capacity, and , (0,1) is the capacity cost coefficient. We assume that the
operations of the IT department are inherently imperfect. That is, the operational efficiency is such that it
cannot guarantee that the customers are satisfied 100% of the time. Processing delays (or waiting) occur
because the firm typically has limited capacity and some customers that have low tolerance for waiting,
leave the web site unsatisfied.
To capture the impact of waiting, we introduce a loss function (defined as the fraction of the traffic
that is not satisfied and leaves the website as a result of delay), ( , )L , determined by the traffic level as
well as the capacity. The loss fraction has the following characteristics:
( ,0) 1L ; lim ( , ) 0L
;
The loss fraction is decreasing and convex in the capacity and increasing and convex in the traffic. These
are forms consistent with diminishing returns of capacity and increasing effects of congestion. The

9
explicit form of L reflects the operational details of the IT department. Since the loss occurs from
congestion effects (or queuing delays), we use a loss fraction of the form:
( , )L
.
A cost-minimizing IT department will set its capacity at:
1/2( ) 1 ,
after observing the traffic level .
3.2 Centralized Structure
If the decision making in a firm is centralized, the decisions are taken to maximizing the overall profit.
That is:
,max M ITC
We find the optimal traffic level:
2
* 1
0 1a (3.1)
and the optimal capacity:
3
* * 1 1/2
0 0( ) 1a .
3.3 Coordination
We now consider a coordinated scenario in which both departments are independent decision makers.
Comparing M with *
0 ( *
0
M ), obviously, the Marketing department, when making its decision
independently, over-spends and attracts traffic that is higher than the optimal level. Clearly, the problem
occurs because the Marketing department (being an independent decision maker), ignores the downstream
costs incurred by Information Technology. It is therefore in the interest of a firm to achieve the
centralized solution by coordinating the activities of the two departments. In such situations, a simple
scheme two-part tariff model can help coordinate.
We propose a tariff

10
0( )
that is charged to the Marketing department. In the tariff, 0 is a fixed charge and is the per unit charge
on traffic.
ssasdsa
2
Figure 1. The tariff as a function of the capacity cost coefficient
Proposition 1. The following tariff charged to the Marketing department coordinates:
0( ) , where 2
The fixed component of the tariff can be set to zero if the IT department is treated as a cost center,
otherwise it can be set to some positive value to ensure that the profits of this department are positive. For
simplicity, we use set the fixed cost to zero. Because, 22 1 (1 ) , and since (0,1) , we
can infer that (0,1) . The per-unit charge on traffic imposed on the Marketing department is further
illustrated in Figure 1. Note that, is concavely increasing in the cost coefficient associated with IT
department, but is independent of a , the cost coefficient of Marketing department. The charge
aggregates the IT cost as well as the operational efficiency of this department, associated with the loss
function L. With this tariff imposed on the Marketing department, both the cost and operational efficiency
of the IT department get reflected in the Marketing objective function. Thus the optimal traffic chosen by
Marketing is adjusted accordingly and the centralized solution is achieved.
11
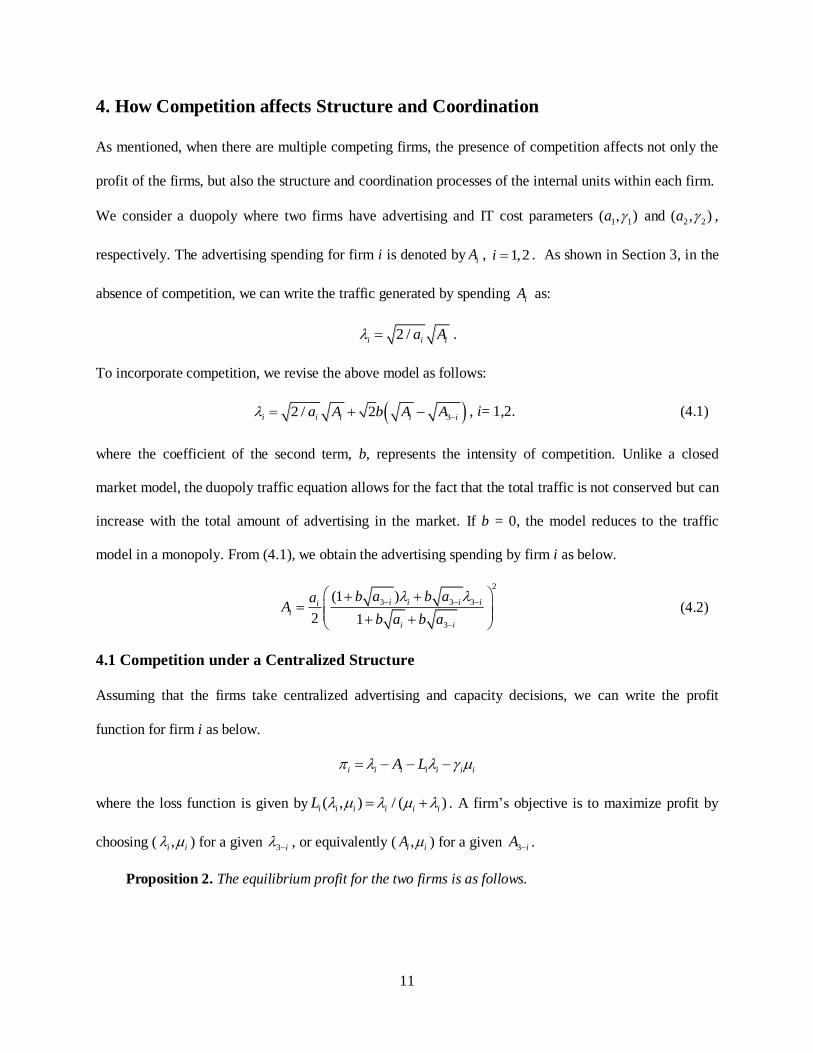
4. How Competition affects Structure and Coordination
As mentioned, when there are multiple competing firms, the presence of competition affects not only the
profit of the firms, but also the structure and coordination processes of the internal units within each firm.
We consider a duopoly where two firms have advertising and IT cost parameters 1 1( , )a and 2 2( , )a ,
respectively. The advertising spending for firm i is denoted by iA , 1,2i . As shown in Section 3, in the
absence of competition, we can write the traffic generated by spending iA as:
2 /i i ia A .
To incorporate competition, we revise the above model as follows:
32 / 2i i i i ia A b A A , i= 1,2. (4.1)
where the coefficient of the second term, b, represents the intensity of competition. Unlike a closed
market model, the duopoly traffic equation allows for the fact that the total traffic is not conserved but can
increase with the total amount of advertising in the market. If b = 0, the model reduces to the traffic
model in a monopoly. From (4.1), we obtain the advertising spending by firm i as below.
2
3 3 3
3
(1 )
2 1
i i i iii
i i
b a b aaA
b a b a
(4.2)
4.1 Competition under a Centralized Structure
Assuming that the firms take centralized advertising and capacity decisions, we can write the profit
function for firm i as below.
i i i i i i iA L
where the loss function is given by ( , ) / ( )i i i i i iL . A firm’s objective is to maximize profit by
choosing ( ,i i ) for a given 3 i , or equivalently ( ,i iA ) for a given 3 iA .
Proposition 2. The equilibrium profit for the two firms is as follows.

12
2 22
2 1 2 1 2 3 3*
, , 1 2 2
33
1 1 2 2 111 1
2 11
i i i
i c c i
i ii i
b a b a b a a b ab a b a
a b aa b a
for i = 1,2. The subscript “c” in *
, ,i c c stands for centralized.
As seen in the above proposition, the equilibrium profit for a firm depends on the advertising and IT
parameters of both firms. The equilibrium solution in Proposition 2 can also be achieved in the following
way. To start, both firms use a tariff to manage their internal departments. The tariff at each firm is
chosen in equilibrium. Next the Marketing departments at the two firms engage in advertising
competition. Finally, the IT departments at each firm chose optimal capacities to respond to the
equilibrium levels of traffic.
To achieve coordination, a tariff defined below
( )i i i
is charged to the Marketing department of firm i, and i is the per unit charge on traffic. The revised
objective function of the Marketing department becomes
)(max iii Ai
The objective is to maximize the above by choosing i for a given 3 i , or equivalently, iA for a given
3 iA . The IT department then reacts to the chosen level of traffic to minimize cost.
Proposition 3. The centralized solution at equilibrium is achieved by imposing the following tariff
2 2 2
3 3 3
2
3 3
(1 ) (1 ) (1 ) (1 )1
(1 ) (1 )
i i i i i i
i
i i i i
a b a ba b a
a b a ba b a
Corollary 1. When firms compete under a centralized structure, the tariff will be strictly positive
unless the IT cost parameter for both firms is zero.
The above corollary implies that a decentralized structure does not arise as a special case of the
analysis of a centralized structure. Thus, this solution has to be separately investigated to see if a
decentralized structure can be chosen in equilibrium by one or both firms.
13
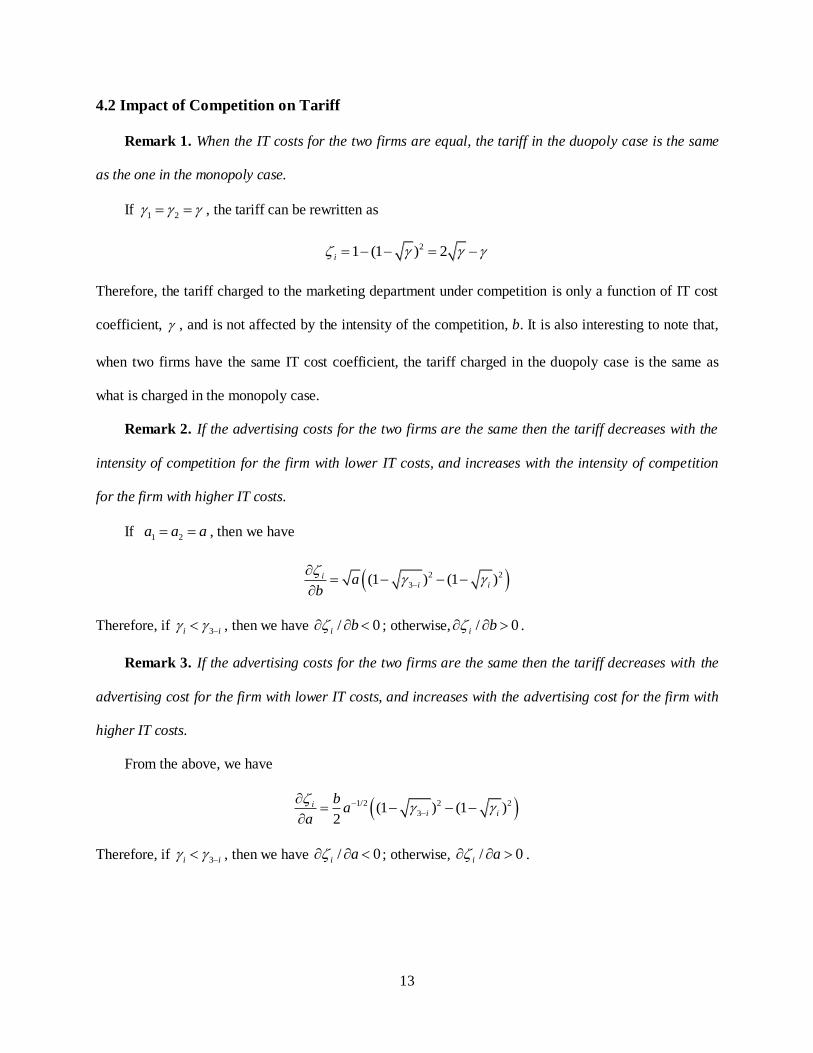
4.2 Impact of Competition on Tariff
Remark 1. When the IT costs for the two firms are equal, the tariff in the duopoly case is the same
as the one in the monopoly case.
If 1 2 , the tariff can be rewritten as
21 (1 ) 2i
Therefore, the tariff charged to the marketing department under competition is only a function of IT cost
coefficient, , and is not affected by the intensity of the competition, b. It is also interesting to note that,
when two firms have the same IT cost coefficient, the tariff charged in the duopoly case is the same as
what is charged in the monopoly case.
Remark 2. If the advertising costs for the two firms are the same then the tariff decreases with the
intensity of competition for the firm with lower IT costs, and increases with the intensity of competition
for the firm with higher IT costs.
If 1 2a a a , then we have
2 2
3(1 ) (1 )ii ia
b
Therefore, if 3i i , then we have / 0i b ; otherwise, / 0i b .
Remark 3. If the advertising costs for the two firms are the same then the tariff decreases with the
advertising cost for the firm with lower IT costs, and increases with the advertising cost for the firm with
higher IT costs.
From the above, we have
1/2 2 2
3(1 ) (1 )2
ii i
ba
a
Therefore, if 3i i , then we have / 0i a ; otherwise, / 0i a .

14
4.3 Competition under a Decentralized Structure
Suppose that both firms are decentralized, implying that the Marketing and the IT departments in both
firms make uncoordinated, independent decisions. We write the profit function for the Marketing
department of firm i as below.
M
i i iA
The Marketing department’s objective is to maximize its profit by choosing i for a given 3 i , or
equivalently, iA , given 3 iA . In turn, the IT departments choose capacity to minimize the following cost:
2IT ii i i i i
i i
C L
Proposition 4. The equilibrium profits for the two firms are:
2
1 2 1 2 1 2
2
3* * * 1 2
, ,2
3
3
1 2 2 (2 )(1 )(1 )
(1 )1
2 2 (1 )
(1 )
i i
i iM IT
i d d i i
i i
i i
b a b a b a a b a b a
a b ab a b aC
b a
a b a
where the subscript “d” in *
, ,i d d stands for decentralized.
The above expressions indicate the equilibrium profits of the firms are dependent on the IT and
advertising cost parameters of both firms as well as the intensity of competition.
4.4 Nash Equilibrium Analysis
We next consider the organization structure chosen by each firm in equilibrium. Let
2
1 2
2
1 2 1 2
11
1 2
b a b a
b a b a b a a
.
It is easy to see that 0 1 . We refer to as a structure threshold.
Proposition 5. In a duopoly with competition,
i. if 1 and 2 , then the stable equilibrium is (d, d)
ii. if 1 and 2 , then the stable equilibrium is (c, d)

15
iii. if 1 and 2 , then the stable equilibrium is (d, c)
iv. if 1 and 2 , then the stable equilibrium is (c, c)
As indicated in the above proposition, the equilibrium structure may be symmetric or asymmetric. If
the capacity cost coefficients of both firms are higher than , then both firms prefer centralization in
equilibrium; if both firms have capacity cost coefficients that are lower than , then both firms prefer
decentralization in equilibrium. If exactly one firm’s capacity cost coefficient is higher than , then the
firm with the higher cost prefers centralization while the one with the lower cost prefers decentralization.
Put differently, a firm’s organization structure in equilibrium depends on whether its capacity cost
coefficient exceeds the structure threshold. A firm with a high capacity cost coefficient would suffer
tremendously from the loss of customers from limited capacity, so the firm has an incentive to take
capacity constraints into consideration when planning advertising, implying that the centralized planning
of advertising and capacity is needed.
A closer examination of a firm’s traffic level in equilibrium indicates that centralization reduces the
firm’s traffic level if the other firm’s structure decision is held constant. Thus, for a firm with a low
capacity cost coefficient, centralization obstructs aggressive advertising, and hence decentralization is
preferred. We summarize this result in the corollary below.
Corollary 2. If the IT cost parameter for a firm is lower than the structure threshold, then, it is a
dominant strategy for the firm to adopt a decentralized structure; otherwise, it is a dominant strategy to
adopt a centralized structure.
It is interesting to note that the structure threshold is the same for both firms, and is a function of the
advertising cost parameters of both firms and the intensity of competition. As competition intensifies, the
structure threshold increases and centralization becomes less attractive. We summarize this result in the
following proposition.
Proposition 6. Competition can break down centralization in equilibrium.
The above proposition holds due to / 0b . As mentioned earlier, centralization keeps firms
16
from advertising too aggressively. Therefore, as the intensity of competition increases, firms are more
likely to give up the intra-firm coordination in order to advertise more aggressively.
Corollary 3. In the absence of competition, both firms will adopt centralization.
In the absence of completion (b 0), the structure threshold becomes zero ( 0 ), and for any
positive IT cost, both firms will choose centralization in equilibrium. Clearly, this case is the same as the
monopoly case where centralization, if course, to be expected. In addition to the intensity of competition,
advertising cost is also an important factor affecting the choice of organizational structure. We present
this finding in the corollary below.
Corollary 4. A high advertising cost can break down centralization.
This finding indicates that structure decisions are also affected by the magnitude of the advertising
costs. As discussed earlier, centralization can keep firms from over-advertising, which, in turn, could
result in an inferior outcome owing to insufficient capacity. However, as a firm’s advertising costs
increase, the issue of insufficient capacity becomes less influential for the firm. As a result, the benefits of
centralization reduce. It is interesting to note that the advertising costs of the two firms affect the structure
threshold in the same way. Therefore, even if a firm’s advertising costs do not change, its structure in
equilibrium can still be affected by a change in the advertising costs of the other firm.
4.5 Impact of Competition on Firms and Customers
Here we discuss the impact of the competition intensity parameter (b) on the profits of the firms as well
the total number of customers satisfied by the firms (total traffic minus total loss). To simplify the
analysis, we consider a relatively small perturbation in the intensity of competition that can cause an
impact on firm profits and satisfied customer, but not so large that it changes the organization structure.
We further assume that the firms are at an intra-firm coordination equilibrium.
4.5.1. Profit Impact
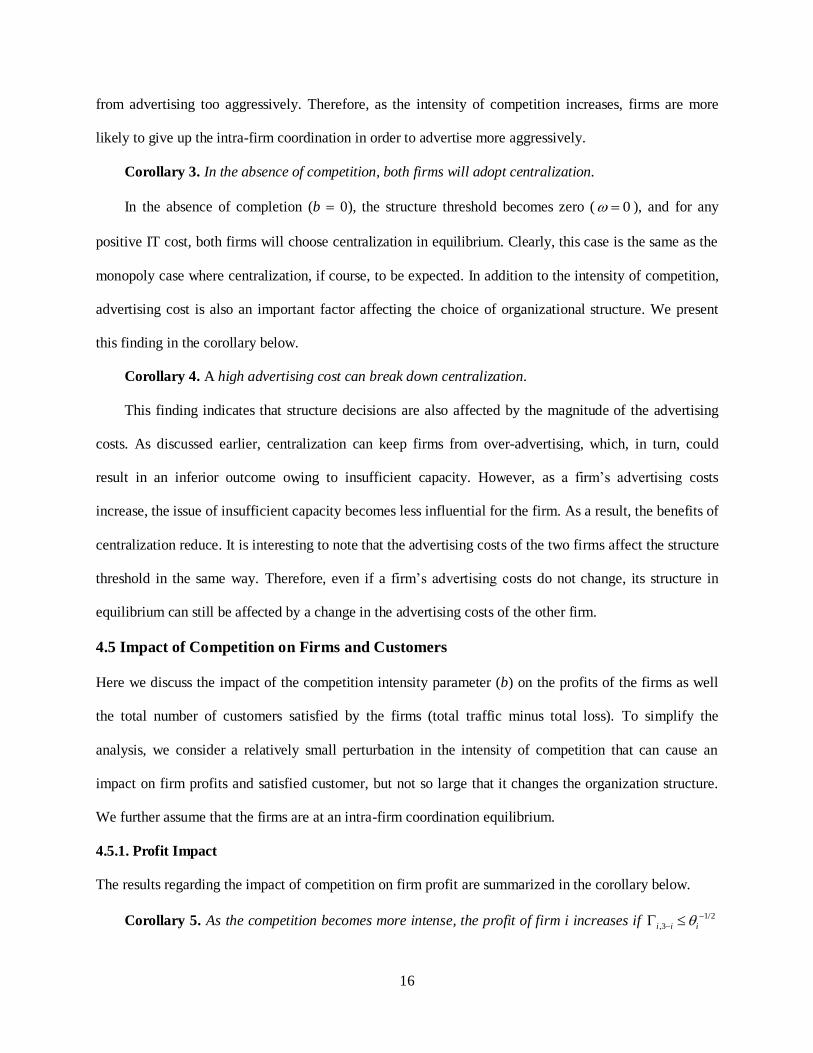
The results regarding the impact of competition on firm profit are summarized in the corollary below.
Corollary 5. As the competition becomes more intense, the profit of firm i increases if 1/2
,3i i i

17
and decreases otherwise.
The expression of i is provided in the proof of Corollary 5 in Appendix, and is a function of
advertising cost coefficient, , 1,2,ia i , and the degree of competition, b. Therefore, the effect of
competition on profit depends on the values of the advertising cost and capacity cost coefficients of the
two firms. It is also interesting to see how competition affects firms’ capability of serving their customers,
which is reflected by the numbers of satisfied customers at firms. To this end, we first examine how the
advertising competition affects the traffic level at each individual firm. The traffic at firm i is shown as
below:
* 2 2 3
1 2 3
33
11 1(1 ) (1 ) (1 )
1 1
i i
i i i
i ii i
b a b ab a b a
a ab a b a
Let ,3 3(1 ) / (1 )i i i i , and ,3i i can be interpreted as the relative magnitude of the
capacity cost coefficient of firm i as compared to that of firm 3-i. Intuitively, the firms would increase
their marketing efforts when facing more intense competition, and therefore arriving traffic increases.
However, as shown in the corollary below, that is not always the case.
Proposition 7.
i. *
0id
db
and
*
3 0id
db
, if 3 ,3
1i i i
i
ii. *
0id
db
and
*
3 0id
db
, if ,3 3i i i
iii. *
0id
db
and
*
3 0id
db
, if ,3
1i i
i
The expression of i is provided in the proof of Proposition 7 in Appendix, and is a function of
advertising cost coefficient, , 1,2,ia i , and the degree of competition, b. From the above proposition,
Corollary 6 immediately follows.
Corollary 6. The traffic levels at the two firms do not reduce simultaneously as the competition

18
becomes more intense.
As shown in Proposition 7, as the advertising competition becomes more intense, if the relative
magnitude of capacity cost coefficient of firm i is above the threshold 1/ i , then firm i reduces its
traffic while firm 3-i increases the traffic. This phenomenon can be explained as follows. When firm i’s
capacity cost coefficient is sufficiently high, its capacity costs wear down the profits from increased
traffic, thus it is better to act conservatively in marketing competition. On the other hand, when firm 3-i’s
capacity cost coefficient is sufficiently low, its profits from increased traffic outweigh the capacity costs,
and therefore it is better to act aggressively in marketing competition. However, if the relative magnitude
of capacity cost coefficient of firm i is between 3 i and 1/ i , both firms increase their advertising
efforts with increased competition. In such a case, the profits from increased traffic outweigh the capacity
costs for both firms, and therefore they both act more aggressively in marketing competition. It is
interesting to note that under higher level of competition, i.e., as b increases, at least one firm will engage
in increasing their marketing effort. This observation, as described in Corollary 6, implies that it will
never happen that both firms reduce their marketing effort simultaneously as the competition intensifies.
Therefore, as the competition becomes more intense, if one firm reduces its marketing effort, then the
other firm will find it profitable to increase its marketing effort. As a matter of fact, this observation is
consistent with the results shown in Proposition 8, which excludes the scenario where both firms reduce
their marketing effort as the competition intensifies. In a special case where the advertising costs at the
two firms are the same, i.e., 1 2a a a we have 21 1/ (2(1 ) )b a . It is easy to see that (0,1) .
Therefore, if ,3 1/i i , both firms act more aggressively in marketing competition as the
competition intensifies; otherwise, one firm lowers its traffic while the other firm increases its traffic.
Letting * denote the overall traffic in the system, where 2* *
1 ii
, we have
2 2
* 3 3
33
(1 ) (1 )1 1
1 1
i i i i
i ii i
b a b a
a ab a b a

19
We can show that * / 0d db holds. Thus, the following proposition can be obtained immediately.
Proposition 8. The overall traffic level in the system increases with the intensity of the competition.
This finding implies that the advertising competition between the two firms helps attract more traffic
for the whole system. One remaining question is how competition affects the satisfied traffic. To address
this question, we first examine firms’ loss rate, i.e., the rate of losing unsatisfied customers, at
equilibrium. The main result of this analysis is presented in the proposition below.
Proposition 9. In the presence of advertising competition, when both firms have intra-firm
coordination at equilibrium, the equilibrium loss rate at firm i is a constant, i , and the equilibrium
capacity level linearly increases with the equilibrium traffic level.
It is worth noting that the equilibrium loss rate of each firm involved in the advertising competition
remains unchanged as the values of some of the model parameters (e.g., the level of competition intensity,
and firms’ advertising cost) change, and has a concise expression as the square root of the firm’s capacity
cost coefficient. Furthermore, the larger the capacity cost coefficient is, the higher the loss rate of the
system remains. Hence, in the presence of advertising competition, the only way for firms to lower down
their loss rate is through lowering down the capacity cost coefficient. We also find that firms’ capacity
levels at equilibrium are linearly proportional to their equilibrium traffic levels. This result is intuitive
since more capacity is needed to accommodate more traffic.
Corollary 7. As competition becomes more intense, the number of satisfied customers at firm i are
proportional to its arriving traffic.
Since the satisfied customers at firm i are (1 )i i , the above result can be easily obtained.
Observation. As competition becomes more intense, if traffic at firm i increases, then the number of
satisfied customers at this firm also increase. This implies that, as competition intensifies, the firms attract
more customers and also provide an adequate IT experience to a greater number of customers. On the
other hand, if traffic at firm i decreases with competition (i.e., case III in Proposition 7), then the number
of satisfied customers at this firm also decrease.

20
It is also interesting to see whether competition would benefit the customers of both firms. Let
stand for the total number of satisfied traffic (customers), where2
1(1 )i ii
L
. Since i iL at
equilibrium, we have
)1(
)(1()1(
)1(
)(1()1()1(
21
11212
1
12
22122
2
21aba
ab
aba
ababab
We numerically illustrate the impact of competition on in Figure 2 below. The parameter values used
in this numerical study are 1 2 1 21, 10, 0.9, 0.1a a .
Figure 2. The Impact of Competition on Total Number of Satisfied Customers
As shown in Figure 2, as competition becomes more intense, the total number of satisfied customers
increases monotonically. Therefore, competition can benefit customers in
5. Profit Comparison among Nash Equilibria
As shown in the previous section, firms may or may not adopt centralization at equilibrium depending on
the values of the firms’ cost parameters. Next, we compare firms’ profits among all possible equilibria (c,
c), (d, d), (c, d), (d, c). Recall from Proposition 5 that a firm prefers centralization if and only if its
capacity cost coefficient is higher than the threshold . Therefore, the following inequalities hold:
* *
1, , 1, ,c s d s if 1 where s = c, d
21
* *
2, , 2, ,s c s d if 2 where s = c, d
Let 2
1/22
2 1( ) 1 1 1 1 1
1i i i
i
and
2
1/22
2 1( ) 1 1 1 1 1
1i i i
i
, where
2
3 1 2 1 2
2
3
(1 )(1 2 )
2 (1 )
i i
i
i i
a b a b a b a b a a
ba b a
, we have the following result.
Proposition 10. If (c, c) is a Nash Equilibrium, then it is a unique Pareto Optimum, and it is strictly
preferred by each firm.
According to the above proposition, if (c, c) is a Nash Equilibrium, then it is a unique Pareto
Optimum strictly preferred by each firm. This also implies that the two-firm system as a whole reaches its
optimum when both firms adopt centralization at equilibrium, and therefore there is no need for any inter-
firm coordination.
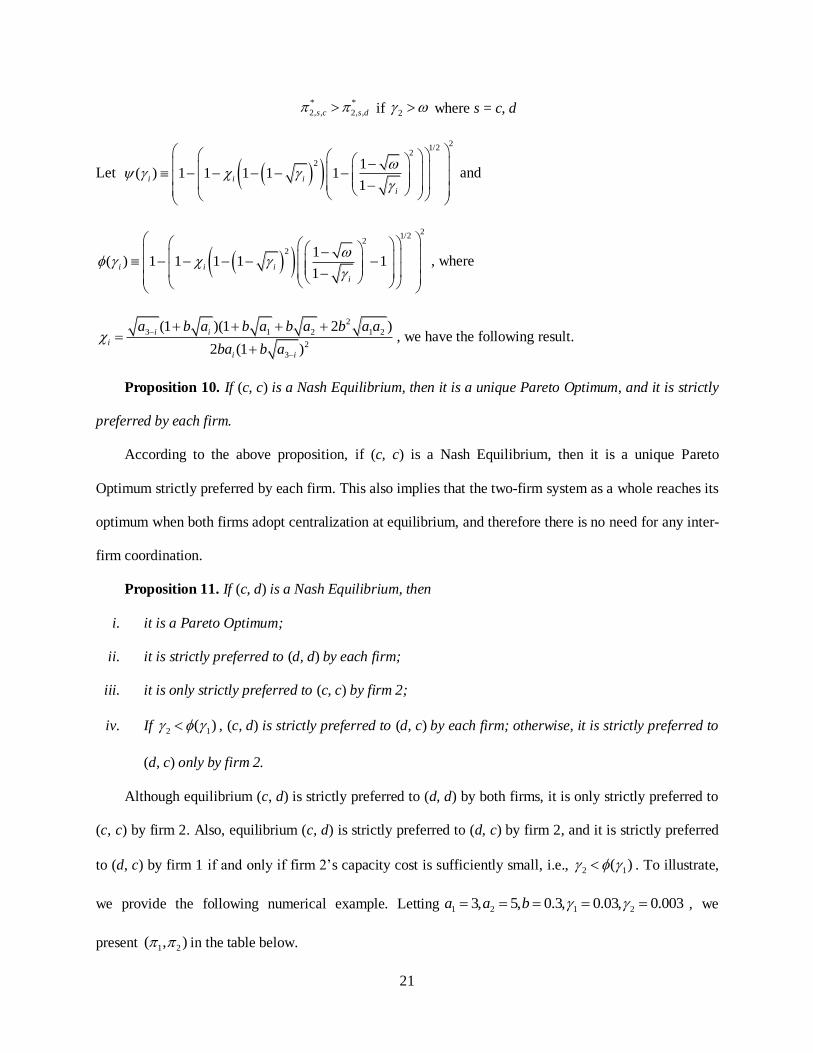
Proposition 11. If (c, d) is a Nash Equilibrium, then
i. it is a Pareto Optimum;
ii. it is strictly preferred to (d, d) by each firm;
iii. it is only strictly preferred to (c, c) by firm 2;
iv. If 2 1( ) , (c, d) is strictly preferred to (d, c) by each firm; otherwise, it is strictly preferred to
(d, c) only by firm 2.
Although equilibrium (c, d) is strictly preferred to (d, d) by both firms, it is only strictly preferred to
(c, c) by firm 2. Also, equilibrium (c, d) is strictly preferred to (d, c) by firm 2, and it is strictly preferred
to (d, c) by firm 1 if and only if firm 2’s capacity cost is sufficiently small, i.e., 2 1( ) . To illustrate,
we provide the following numerical example. Letting 1 2 1 23, 5, 0.3, 0.03, 0.003a a b , we
present 1 2( , ) in the table below.
22
Firm 2
Firm 1
c d
c (0.0583, 0.0800) (0.0443, 0.0839)
d (0.0494, 0.0158) (0.0353, 0.0197)
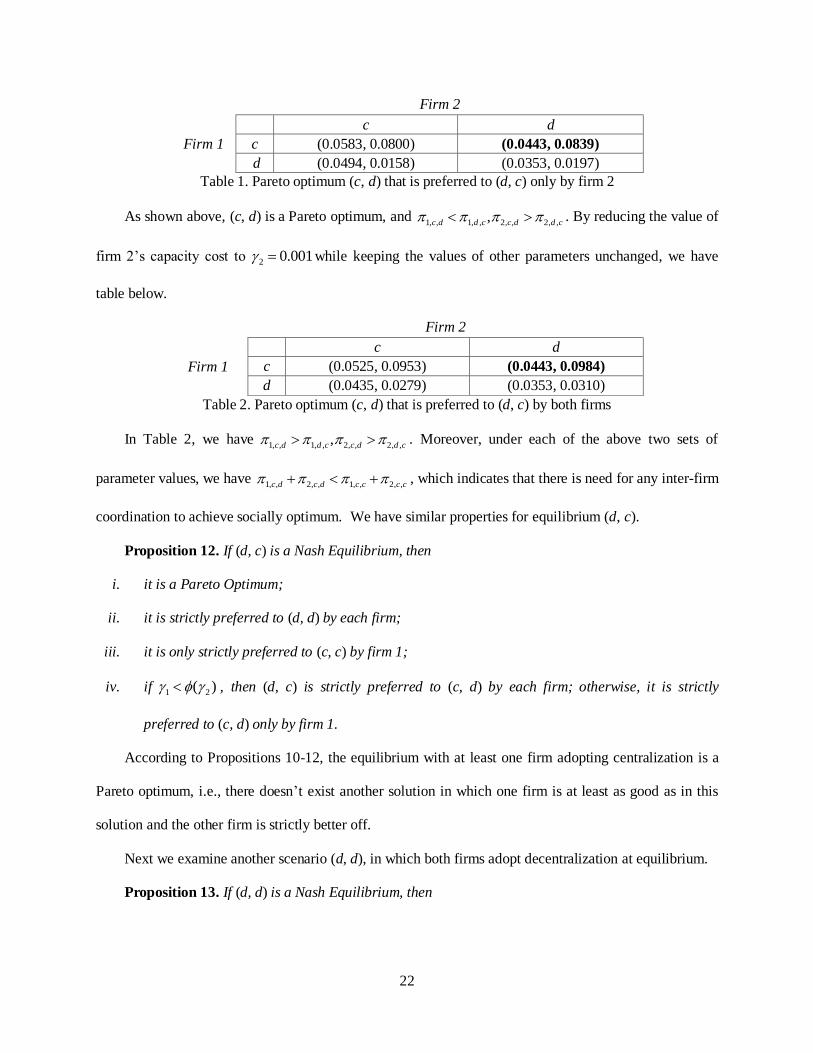
Table 1. Pareto optimum (c, d) that is preferred to (d, c) only by firm 2
As shown above, (c, d) is a Pareto optimum, and 1, , 1, , 2, , 2, ,,c d d c c d d c . By reducing the value of
firm 2’s capacity cost to 2 0.001 while keeping the values of other parameters unchanged, we have
table below.
Firm 2
Firm 1
c d
c (0.0525, 0.0953) (0.0443, 0.0984)
d (0.0435, 0.0279) (0.0353, 0.0310)
Table 2. Pareto optimum (c, d) that is preferred to (d, c) by both firms
In Table 2, we have 1, , 1, , 2, , 2, ,,c d d c c d d c . Moreover, under each of the above two sets of
parameter values, we have 1, , 2, , 1, , 2, ,c d c d c c c c , which indicates that there is need for any inter-firm
coordination to achieve socially optimum. We have similar properties for equilibrium (d, c).
Proposition 12. If (d, c) is a Nash Equilibrium, then
i. it is a Pareto Optimum;
ii. it is strictly preferred to (d, d) by each firm;
iii. it is only strictly preferred to (c, c) by firm 1;
iv. if 1 2( ) , then (d, c) is strictly preferred to (c, d) by each firm; otherwise, it is strictly
preferred to (c, d) only by firm 1.
According to Propositions 10-12, the equilibrium with at least one firm adopting centralization is a
Pareto optimum, i.e., there doesn’t exist another solution in which one firm is at least as good as in this
solution and the other firm is strictly better off.
Next we examine another scenario (d, d), in which both firms adopt decentralization at equilibrium.
Proposition 13. If (d, d) is a Nash Equilibrium, then

23
i. if 3 ( )i i , {1,2}i , then (d, d) is a Pareto Optimum, and it is strictly preferred to (c, c) by
firm I;
ii. Equilibrium (d, d) is strictly preferred to (d, c) only by firm 2, and strictly preferred to (c, d) only
by firm 1.
If the capacity cost coefficient of firm i , 3 i , is lower than ( )i , {1,2}i , then firm i will be
worse off when both firms adopting centralization as compared to its solution in (d, d). This also implies
that firm i is more likely to be better off staying at the equilibrium in which both firms adopt
decentralization as the capacity cost of firm 3-i, i=1,2 , reduces. Note that the total traffic of the two firms
when both firms adopt centralization is
* * 2 2
1, , 2, , 1 2 1 1 2 2 2 1(1 ) (1 ) / ( (1 )) (1 ) / ( (1 ))c c c c b a b a a b a a b a , while the total
traffic when both firms adopt decentralization is
* *
1, , 2, , 1 2 1 2 2 1(1 ) 1/ ( (1 )) 1/ ( (1 ))d d d d b a b a a b a a b a . Therefore, firms’ overall traffic is
shrinking when both firms adopt centralization. When the capacity cost coefficient at firm 3-i is relatively
small, i.e., 3 ( )i i , firm i would be better off advertising aggressively. However, centralization
restrains such aggressive advertising. As a result, firm i is worse off when adopting centralization. To
illustrate, we provide the following numerical example. Letting
1 2 1 23, 5, 0.2, 0.004, 0.004a a b , we present 1 2( , ) in the table below.
Firm 2
Firm 1
c d
c (0.1394, 0.0501) (0.1266, 0.0507)
d (0.1403, 0.0347) (0.1275, 0.0353)
Table 3. Equilibrium (d, d) at which 1, , 1, ,c c d d , and 2, , 2, ,c c d d
We have 2, , 2, ,d c d d , and 1, , 1, ,c d d d , and therefore (d, d) is a Nash Equilibrium. Furthermore,
we have 2 1( ) , and 1 2( ) , and correspondingly, 1, , 1, ,c c d d , and 2, , 2, ,c c d d . If we reduce

24
the value of firm 2’s capacity cost to 2 0.000005 while keeping the other parameters’ values
unchanged, we present 1 2( , ) in the table below.
Firm 2
Firm 1
c d
c (0.1271, 0.0812) (0.1266, 0.0814)
d (0.1280, 0.0638) (0.1275, 0.0639)
Table 4. Equilibrium (d, d) at which1, , 1, ,c c d d , and
2, , 2, ,c c d d
In the above table, we have 2 1( ) , and 1 2( ) , and correspondingly, 1, , 1, ,c c d d , and
2, , 2, ,c c d d . It is also interesting to note that we cannot find a numerical instance at which 2 1( ) ,
and 1 2( ) both hold, which implies that firms cannot achieve social optimum at equilibrium (d, d).
Corollary 8. If (d, d) is an equilibrium, and 1 2a a a , then 1 2( ) and 2 1( ) cannot
both hold.
From the above Corollary, if the advertising cost coefficients of the two firms are the same, and no
one adopts centralization at equilibrium, then this equilibrium cannot be preferred by both firms although
it can still be a strong Pareto optimum.
Corollary 9. If 1 2a a a and 1 2 , then (c, c) is a strictly preferred to (d, d).
In above special case, where all the cost parameters at the two firms are identical, the equilibrium (d,
d) is clearly not Pareto-optimum.
6. Conclusions and Future Research
We examine two electronic retailing firms engaged in duopolistic traffic competition. The issue of interest
is how coordination structures and processes internal to the firms are affected by the presence of
competition. We find that, at equilibrium, depending on values of cost parameters, coordination decisions
need not always be symmetric.
A firm’s capacity cost coefficient can affect its decision on intra-firm coordination at equilibrium. If
its capacity cost coefficient exceeds a certain threshold, a firm prefers centralization (via intra-firm
coordination) to decentralization since over-advertising can be restrained with intra-firm coordination. As
25
the advertising competition becomes more intensive, or the advertising costs become higher, firms are
more likely to engage in intra-firm coordination. As the advertising competition between two firms
becomes more intense, equilibrium traffic reaching each firm does not synchronously reduce. Specifically,
the firm that has much higher capacity costs attracts less traffic while the other attracts more traffic. We
also find that when both firms are decentralized at equilibrium, one of the firms can be worse off by if it
coordinates its internal units.
A topic for future study is to also consider back-end competition between firms (e.g., quality of
service competition) and examine how the intensity of advertising marketing can affect back-end
competition. Finally, when firms are caught in an uncoordinated equilibrium, similar to a prisoner’s
dilemma, it would be useful to examine inter-firm coordination schemes that can induce firms that can
help them reach a better equilibrium.
References
Anderson, R. C., E. W. Cundiff. 1955. Patterns of Communication in Marketing Organization. J.
Marketing 29(3) 30-34.
Baum, J. A. C., J. V. Singh. 1996. Dynamics of Organizational Responses to Competition. Social Forces
74(4) 1261-1297.
Bonanno, G., J. Vickers. 1988. Vertical Separation. J. Industrial Economics 36(3) 257-266.
Boyaci, T., G. Gallego. 2004. Supply Chain Coordination in a Market with Customer Service
Competition. Production and Operations Management 13(1) 3-22.
Cachon, G. P., M. A. Lariviere. 2005. Supply Chain Coordination with Revenue-Sharing Contracts:
Strengths and Limitations. Management Sci. 51(1) 30-44.
Cachon, G. P., A. G. Kok. 2010. Competing Manufactures in a Retail Supply Chain: On Contractual
Form and Coordination. Management Sci. 56 (3) 571-589.
Carr, A. S., H. Kaynak, S. Muthusamy. 2008. The Cross-functional Coordination Between Operations,
Marketing, Purchasing and Engineering and the Impact on Performance. International Journal of
Manufacturing Technology and Management 13(1) 55-77.
Choney, S. 2011. Facebook Leads in Social Media Site Reliability, Speed.
http://technolog.msnbc.msn.com/_news/2011/07/07/7036408-facebook-leads-in-social-media-site-
reliability-speed
ClickZ.com. 2006. http://clickz.com/showPage.html?page=151151.

26
Coughland, A., B. Wernerfelt. 1989. On Credible Delegation by Oligopolists: A Discussion of
Distribution Channel Management. Management Sci. 35(2) 226-239.
Cui, T. H., J. S. Raju, Z. J. Zhang. 2007. Fairness and Channel Coordination. Management Sci. 53(8)
1303-1314.
De Vreede, Gert-Jan, D. T. T. van Eijck. 1998. Modeling and Simulating Organizational Coordination.
Simulation and Gaming 29(1) 60-88.
Degryse, H., S. Ongena. 2007. The Impact of Competition on Bank Orientation. Journal of Financial
Intermediation 16(3) 399-424.
Eschbach, P. 2007. Communication and IT: Taming the Three-headed Dog. Communication World 24(5)
48.
Faraj, S., Y. Xiao. 2006. Coordination in Fast-Response Organizations. Management Sci. 52(8) 1155-
1169.
Fauli-Oller, R., M. Giralt. 1995. Competition and Cooperation with a Multidivisional Firm. J. Industrial
Economics XLIII 77-99.
Goupta, S., R. Loulou. 1998. Process Innovation, Product Differentiation, and Channel Structure:
Strategic Incentives in a Duopoly. Marketing Sci. 17(4) 301-316.
Hart, O., J. Moore. 2005. On the Design of Hierarchies: Coordination versus Specialization, J. Political
Economy 113(41) 675-702.
He, X., A. Prasad, S. P. Sethi. 2009. Cooperative Advertising and Pricing in a Dynamic Stochastic Supply
Chain: Feedback Stackelberg Strategies. Production and Operations Management 18(1) 78-94.
Ho, T. H., S. Savin, C. Terwiesch. 2002. Managing Traffic and Sales Dynamics in New Product Diffusion
Under Supply Constraint. Management Sci. 13(4) 402-419.
IDC: More Mobile Internet Users Than Wireline Users in the U.S. by 2015. 2011. IDC-Press Release.
http://www.idc.com/getdoc.jsp?containerId=prUS23028711
Jørgensen, S., S. Taboubi, G. Zaccour. 2001. Cooperative Advertising in Marketing Channel. J.
Optimization Theory and Applications 110(1) 145-158.
Kanodia, C. 1979. Risk Sharing and Transfer Price Systems under Uncertainty. J. Accounting Res. 17 74-
98.
Karpinski, R. 2000. E-Retailers Balance IT, Marketing. Internet Week, no. 795, page 1.
Kato, Takao, H. Owan. 2011. Market Characteristics, Intra-firm Coordination, and the Choice of Human
Resource Management Systems: Theory and Evidence. J. of Economic Behavior and Organization.
doi: 10.1016/j.physletb.2003.10.071.
Kouvelis, P., M. A. Lariviere. 2000. Decentralizing Cross-Functional Decisions: Coordination Through
Internal Markets, Management Sci. 46(8) 1049-1058.

27
Lacity, M. C., L. P. Willcocks. 2001. Global Information Technology Outsourcing. Wiley, New York.
Li, L. 2002. Information Sharing in a Supply Chain with Horizontal Competition. Management Sci. 48(9)
1196-1212.
Mahajan, V., E. Muller. 1986. Advertising Pulsing Policies for Generating Awareness for New Products.
Marketing Sci. 5 86-106.
Miller, C. E., J. Reardon, D. E. McCorkle. 1999. The Effects of Competition on Retail Structure: An
Examination of Intratype, Intertype, and Intercategory Competition. J. Marketing 63(4) 107-120.
Mullaney, T., R. Hof. 2004. Business Week Online
(http://www.businessweek.com/magazine/content/04_51/b3913048_mz011.htm?chan=search)
Mulpuru, S., V. Sehgal, P. F. Evans, D. Roberge. 2011. US Online Retail Forecast, 2010-2015
eCommerce Growth Accelerates Following “The Great Recession”.
http://www.forrester.com/rb/Research/us_online_retail_forecast,_2010_to_2015/q/id/58596/t/2
Nault, B. R., R. K. Tyagi. 2001. Implementable Mechanisms to Coordinate Horizontal Alliances,
Management Sci. 47(6) 787-799.
Pekgun, P., P. M. Griffin, P. Keskinocak. 2008. Coordination of Marketing and Production for Price and
Leadtime Decisions. IIE Transactions 40(1), 12-30.
Riechmann, T., J. Weimann. 2007. Competition as a Coordination Device : Experimental Evidence from
a Minimum Effort Coordination Game. European Journal of Political Economy 24(2) 437-454.
Sevcik, K. C., I. Mitrani. 1981. The Distribution of Queuing Network States at Input and Output Instants.
J. ACM 28 358-371.
Shapiro, B. P. 1977. Can Marketing and Manufacturing Coexist? Harvard Business Review 55 104-114.
Sogomonian, A. G., C. S. Tang. 1993. A Modeling Framework for Coordinating Promotion and
Production Decisions within a Firm. Management Sci. 39 191-203.
Tan, Y., V. S. Mookerjee, K. Moinzadeh. 2005. Optimal Processing Policies for an e-Commerce Web
Server. INFORMS J. Comput. 17 99-110.
Tan, Y., V. S. Mookerjee 2005. Allocating Spending Between Advertising and Information Technology
in Electronic Retailing. Management Sci. 51 1236-1249.
Tillett, L. S. 2001. Report: Slow Sites Cost $25 Billion in Lost Sales. Internetweek.com. Available at
http://www.internetweek.com/story/INW20010506S0001.
Trent, R. J. 2004. The Use of Organizational Design Features in Purchasing and Supply Chain
Management. J. Supply Chain Management 40(3) 4-16.
Victor, B. 1990. Coordinating Work in Complex Organizations. J. Organizational Behavior. 11(3) 187-
199.
Vroom, G. 2006. Organizational Design and the Intensity of Rivalry. Management Sci. 52(11) 1689-1702.

28
Weng, Z. K. 1995. Channel Coordination and Quantity Discount, Management Sci. 41(9) 1509-1522.
Xiao, T., X. Qi. 2008. Price Competition, Cost, and Traffic Disruptions and Coordination of a Supply
Chain with One Manufacturer and Two Competing Retailers. Omega 36(5) 741-753.
Xie, J., J. C. Wei. 2008. Coordinating Advertising and Pricing in a Manufacturer-Retailer Channel.
European Journal of Operational Research 197(2) 785-791.
Yao, Z., S. C. H. Leung, K. K. Lai. 2008. Manufacturer’s Revenue-sharing Contract and Retail
Competition. European Journal of Operational Research 186(2) 637-651.
Zaccour, G. 2008. On the Coordination of Dynamic Marketing Channels and Two-part Tariffs.
Automatica 44(5) 1233-1239.
Appendix
Proof of Proposition 1
The new objective function of Department M becomes
,max ( )M
The new (coordinated) traffic level is:
1(1 )M
r a
Equating M
r to *
0 , we find the per unit traffic charge:
2
Proof of Proposition 2
Substituting iA in (4.2), the profit function for firm i can be rewritten as follows
2
3 3
3 3
( 2 / 2 ) 2
2 / 2 / 2 /
i i ii ii i i
i i i i i i
a b b
b a b a a a
Thus, in equilibrium, we have the following FOCs,
23 3 3
2 2
3 3
2(( 2 / 2 ) 2 )( 2 / 2 )0
( ) (2 / 2 / 2 / )
i i i ii i
i i i i i i i
a b b a b
b a b a a a
(A-1)
2
20
( )
i ii
i i i
(A-2)
29
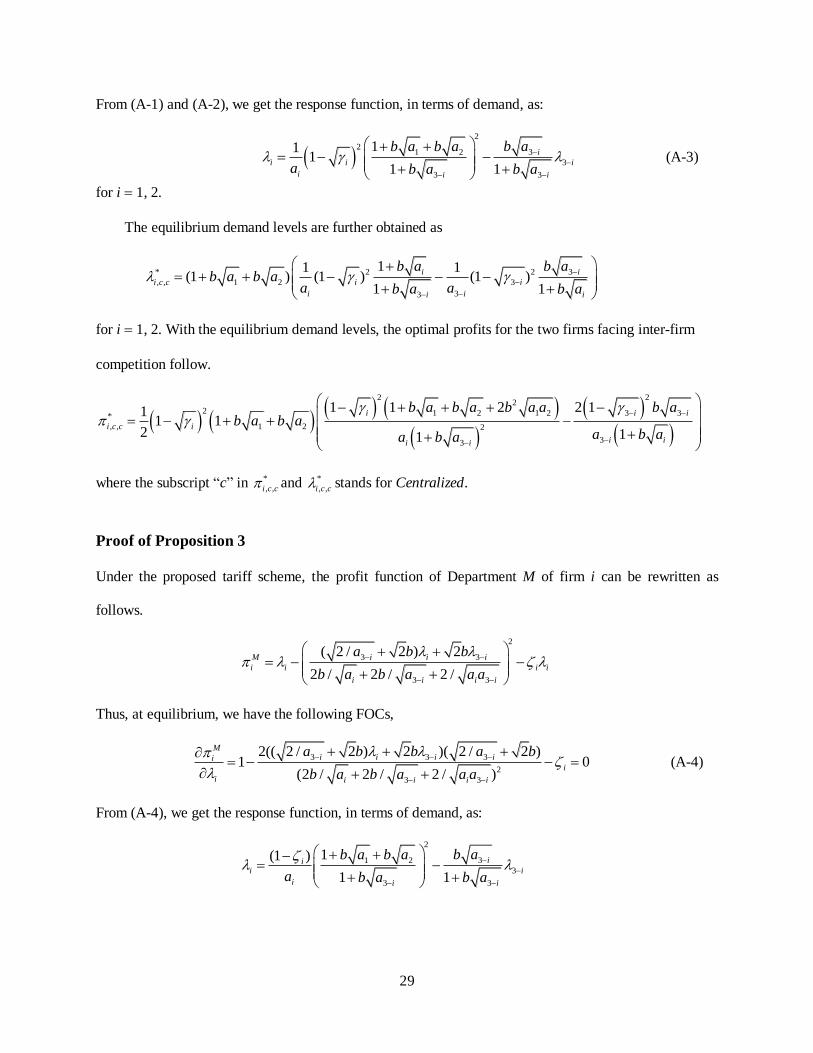
From (A-1) and (A-2), we get the response function, in terms of demand, as:
2
231 2
3
3 3
111
1 1
i
i i i
i i i
b ab a b a
a b a b a
(A-3)
for i 1, 2.
The equilibrium demand levels are further obtained as
* 2 2 3
, , 1 2 3
33
11 1(1 ) (1 ) (1 )
1 1
i i
i c c i i
i ii i
b a b ab a b a
a ab a b a
for i 1, 2. With the equilibrium demand levels, the optimal profits for the two firms facing inter-firm
competition follow.
2 22
2 1 2 1 2 3 3*
, , 1 2 2
33
1 1 2 2 111 1
2 11
i i i
i c c i
i ii i
b a b a b a a b ab a b a
a b aa b a
where the subscript “c” in *
, ,i c c and *
, ,i c c stands for Centralized.
Proof of Proposition 3
Under the proposed tariff scheme, the profit function of Department M of firm i can be rewritten as
follows.
2
3 3
3 3
( 2 / 2 ) 2
2 / 2 / 2 /
M i i i
i i i i
i i i i
a b b
b a b a a a
Thus, at equilibrium, we have the following FOCs,
3 3 3
2
3 3
2(( 2 / 2 ) 2 )( 2 / 2 )1 0
(2 / 2 / 2 / )
Mi i i ii
i
i i i i i
a b b a b
b a b a a a
(A-4)
From (A-4), we get the response function, in terms of demand, as:
2
31 2
3
3 3
1(1 )
1 1
iii i
i i i
b ab a b a
a b a b a
30
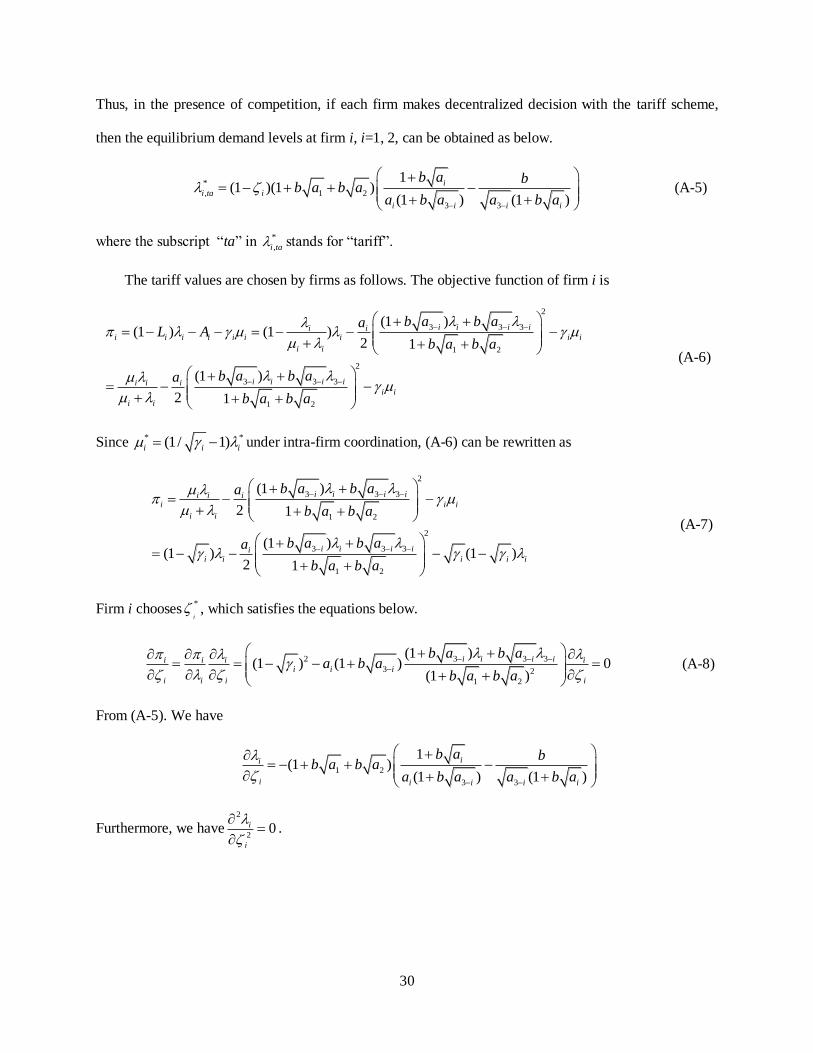
Thus, in the presence of competition, if each firm makes decentralized decision with the tariff scheme,
then the equilibrium demand levels at firm i, i=1, 2, can be obtained as below.
*
, 1 2
3 3
1(1 )(1 )
(1 ) (1 )
i
i ta i
i i i i
b a bb a b a
a b a a b a
(A-5)
where the subscript “ta” in *
,i ta stands for “tariff”.
The tariff values are chosen by firms as follows. The objective function of firm i is
2
3 3 3
1 2
2
3 3 3
1 2
(1 )(1 ) (1 )
2 1
(1 )
2 1
i i i ii ii i i i i i i i i
i i
i i i ii i ii i
i i
b a b aaL A
b a b a
b a b aa
b a b a
(A-6)
Since * *(1/ 1)i i i under intra-firm coordination, (A-6) can be rewritten as
2
3 3 3
1 2
2
3 3 3
1 2
(1 )
2 1
(1 )(1 ) (1 )
2 1
i i i ii i ii i i
i i
i i i iii i i i i
b a b aa
b a b a
b a b aa
b a b a
(A-7)
Firm i chooses*
i , which satisfies the equations below.
2 3 3 3
3 2
1 2
(1 )(1 ) (1 ) 0
(1 )
i i i ii i i ii i i
i i i i
b a b aa b a
b a b a
(A-8)
From (A-5). We have
1 2
3 3
1(1 )
(1 ) (1 )
ii
i i i i i
b a bb a b a
a b a a b a
Furthermore, we have2
20i
i
.

31
222 23 2 3 3 3
32 22 2
1 2 1 2
22
3
2
1 2
(1 ) (1 )(1 ) (1 )
(1 ) (1 )
(1 )0
(1 )
i i i i i ii i ii i i
i i i
i i i
i
a b a b a b aa b a
b a b a b a b a
a b a
b a b a
Therefore, the solution from (A-8) is a local maximum. From (A-5), we have
3 3
10
(1 ) (1 )
i
i i i i
b a b
a b a a b a
, which means 0i
i
. Therefore, the solution from (A-8) has to
satisfy the equations below.
2 3 3 3
3 2
1 2
(1 )(1 ) (1 ) 0
(1 )
i i i i
i i i
b a b aa b a
b a b a
(A-9)
Solving (A-9), we have
* 2 2
1 2 3
3 3
11 1(1 ) (1 ) (1 )
1 1
i
i i i
i i i i
b a bb a b a
a b a a b a
(A-10)
Note that (A-10) is same as (4-3), which means that coordination scheme achieves the centralized solution.
Equating *
i in (A-10) to *
,i ta in (A-5), we find the per unit demand charge:
2 2 2
3 3 3
2
3 3
(1 ) (1 ) (1 ) (1 )1
(1 ) (1 )
i i i i i i
i
i i i i
a b a ba b a
a b a ba b a
Proof of Corollary 1
From (A-5), if * 0i , we have 3 3
10
(1 ) (1 )
i
i i i i
b a b
a b a a b a
, and therefore 0i
i
For * 0i to be an optimal solution, it has to hold that 0i
i
, which leads to
2 3 3 3
3 2
1 2
(1 )(1 ) (1 )
(1 )
i i i i
i i i
b a b aa b a
b a b a
(A-11)
Substituting 1 and 2 (when * 0i ) in (A-5), (A-11) can be rewritten as 2(1 ) 1i , which is
infeasible. Therefore, * 0i cannot be the optimal solution.

32
Proof of Proposition 4
The profit function of Department M of firm i can be rewritten as follows.
2
3 3
3 3
( 2 / 2 ) 2
2 / 2 / 2 /
M i i i
i i
i i i i
a b b
b a b a a a
Thus, at equilibrium, we have the following FOCs,
3 3 3
2
3 3
2(( 2 / 2 ) 2 )( 2 / 2 )1 0
(2 / 2 / 2 / )
Mi i i ii
i i i i i
a b b a b
b a b a a a
(A-12)
From (A-12), we get the response function, in terms of demand, as:
2
31 2
3
3 3
11
1 1
i
i i
i i i
b ab a b a
a b a b a
Thus, in the presence of competition, if both firms make decentralized decisions on advertising and IT
planning, then the equilibrium demand levels at firm i, i=1, 2, can be obtained as below.
* 3
1 2
3 3
1(1 )
(1 ) (1 )
i i
i
i i i i
b a b ab a b a
a b a a b a
(A-13)
We write the cost function for Department IT of firm i as below.
2IT ii i i i i
i i
C L
From / 0IT
i iC , we have * *(1/ 1)i i i . Thus,
* *(2 )IT
i i i iC
The optimal profits for the two firms facing competition follow.
2
1 2 1 2 1 2
2
3* * * 1 2
, ,2
3
3
1 2 2 (2 )(1 )(1 )
(1 )1
2 2 (1 )
(1 )
i i
i iM IT
i d d i i
i i
i i
b a b a b a a b a b a
a b ab a b aC
b a
a b a
where the subscript “d” in *
, ,i d d stands for decentralized.
Proof of Proposition 5
1) Only One Firm Adopts Centralization
33
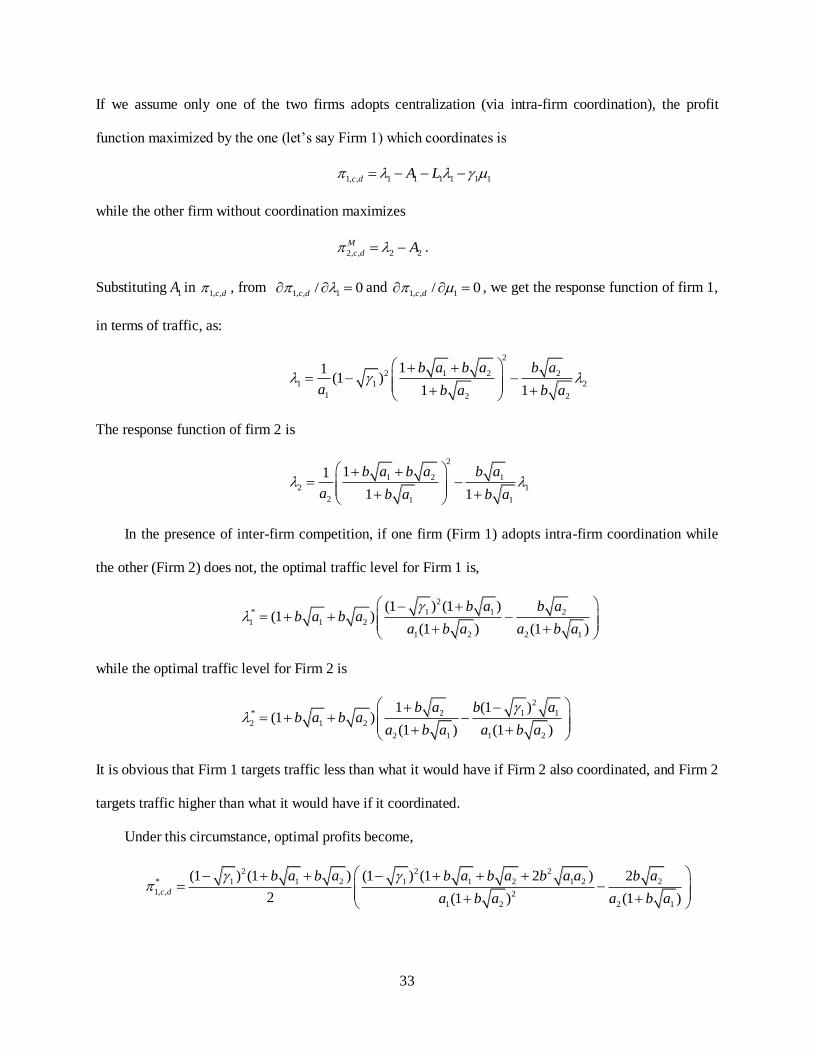
If we assume only one of the two firms adopts centralization (via intra-firm coordination), the profit
function maximized by the one (let’s say Firm 1) which coordinates is
1, , 1 1 1 1 1 1c d A L
while the other firm without coordination maximizes
2, , 2 2
M
c d A .
Substituting 1A in 1, ,c d , from
1, , 1/ 0c d and 1, , 1/ 0c d , we get the response function of firm 1,
in terms of traffic, as:
2
2 1 2 2
1 1 2
1 2 2
11(1 )
1 1
b a b a b a
a b a b a
The response function of firm 2 is
2
1 2 1
2 1
2 1 1
11
1 1
b a b a b a
a b a b a
In the presence of inter-firm competition, if one firm (Firm 1) adopts intra-firm coordination while
the other (Firm 2) does not, the optimal traffic level for Firm 1 is,
2
* 1 1 2
1 1 2
1 2 2 1
(1 ) (1 )(1 )
(1 ) (1 )
b a b ab a b a
a b a a b a
while the optimal traffic level for Firm 2 is
2
* 2 1 1
2 1 2
2 1 1 2
1 (1 )(1 )
(1 ) (1 )
b a b ab a b a
a b a a b a
It is obvious that Firm 1 targets traffic less than what it would have if Firm 2 also coordinated, and Firm 2
targets traffic higher than what it would have if it coordinated.
Under this circumstance, optimal profits become,
2 2 2
* 1 1 2 1 1 2 1 2 2
1, , 2
1 2 2 1
(1 ) (1 ) (1 ) (1 2 ) 2
2 (1 ) (1 )c d
b a b a b a b a b a a b a
a b a a b a

34
2 2
* 1 2 1 2 1 2 1 1
2, , 2
2 1 1 2
(1 ) 1 2 2 (1 )
2 (1 ) (1 )
M
c d
b a b a b a b a b a a b a
a b a a b a
Here, the superscript “M” stands for the Marketing department.
Since IT department of firm 2 is trying to minimize
* *
2 2 2 2 2 2( , )ITC L
Thus, we have * *
2 2 2 2(1 ) / , and * *
2 2 2 2(2 )ITC . The optimal profits of firm 2 become,
2
1 2 1 2 2 2 1 2
2
2 1* 1 2
2, ,2 2
1 1 2
1 2
1 2 2 (2 )(1 )(1 )
(1 )1
2 2 (1 ) (1 )
(1 )
c d
b a b a b a a b a b a
a b ab a b a
b a
a b a
A closer examination shows that * *
1, , 1, ,c d c c . Let
2
1 2
2
1 2 1 2
11
1 2
b a b a
b a b a b a a
When 21 , we have * *
2, , 2, ,c d c c ; when 20 , we have * *
2, , 2, ,c d c c . Thus, the symmetric
case is only stable when the capacity cost is above a specific threshold.
2) Both Firms Adopt Decentralization
When both firms adopt decentralization, the profit function maximized is
i i iA
And the outcomes of the optimal traffic levels are
* 3
1 2
3 3
1(1 )
(1 ) (1 )
i i
i
i i i i
b a b ab a b a
a b a a b a
2
* 31 2 1 2 1 2
, , 2
3 3
21 1 2
2 (1 ) (1 )
M i
i d d
i i i i
b ab a b a b a b a b a a
a b a a b a
Here, the superscript “M” in *
, ,
M
i d d stands for the Marketing department.

35
2
IT ii i i i i
i i
C L
From 0IT
i
i
C
, we have
*(1/ 1)i i i . Thus, * *
, , (2 )IT
i d d i i iC
* * *
, , , , , ,
2 2
1 2 1 2 1 2 31 2
2
3 3
1 2 2 (2 )(1 )(1 ) 2 (1 )1
2 (1 ) (1 )
M IT
i d d i d d i d d
i i i i
i i i i
C
b a b a b a a b a b a b ab a b a
a b a a b a
When 1 , it holds that* *
1, , 1, ,c d d d and when 1 , it holds that * *
1, , 1, ,c d d d . Similarly, when
2 , it holds that * *
2, , 2, ,d c d d and when 2 , it holds that * *
2, , 2, ,d c d d .
Proof of Corollary 2
If 2 , we can show that * *
2, , 2, ,c n c c and * *
2, , 2, ,n n n c . If 2 , it holds that * *
2, , 2, ,c c c n and
* *
2, , 2, ,n c n n . We can also show that the same results hold for firm 1.
Proof of Proposition 6
It is easy to show that 0d
db
. As b increases to b’, the threshold for intra-firm coordination increases
to ' . When the competition level is b, if i , then firm i chooses to adopt intra-firm coordination at
equilibrium; however, when b increases to b’, it may hold that 'i , and if that is the case, then firm i
will choose not to adopt intra-firm coordination at equilibrium.
Proof of Corollary 3
When b=0, we have 0 , and it always hold that 1 , and 2 . Therefore, the only equilibrium
is (c, c).
Proof of Corollary 4
It holds that 1
0d
da
and
2
0d
da
.
Proof of Corollary 5
Firm i’s profit in the centralized case is

36
2 22
2 1 2 1 2 3 3*
, , 1 2 2
33
1 1 2 2 111 1
2 11
i i i
i c c i
i ii i
b a b a b a a b ab a b a
a b aa b a
*
, ,
4 2 3
3 1 2 1 2
4
3
4 2 3 4 4 2
3 3 1 2 1 2 3 3
4
3
2 2
1 2 1 2 1 2
2
3
(1 ) 6 4 4
(1 )
(1 ) 4 4
(1 )
(1 ) (1 ) (( ) (1 ) 1 )
(1 )
i c c
i i i i i
i i
i i i i i i i
i i
i
i i
d
db
a a b a b a a ba b a a
a b a
b a a b a a a b a a a b a a
a b a
a a b b a b a b a
a b a
Let
4
3
2
3
1 2 1 2
2 3 2 3 4 4 2
3 1 2 1 2 3 3 1 2 1 2 3 3
(1 )
(1 )
( ) (1 ) 1
6 4 4 4 4
i i
i
i i
i
i i i i i i i i i i
a b a
a b a
a a b b a b a b a
a a b a b a a ba b a a b a a b a a a b a a a b a a
If 3
1
1
i
i
i
, then 0id
db
; otherwise, 0id
db
Proof of Proposition 7
The effects of the advertising competition level b on the traffic level of each individual firm can be
analyzed as follows.
22 2
3 3 3
2
3
22 2
3 3 3
2
3
1 2 2 2
1
1 1 2 2
1
i i i i i ii
i i
i i i i i i
i i
b a b a b a a b a
b a b a
b a b a b a a b a
a b a
Let us define
2 2
3 3
2 2
3 3 3
1 2 1
1 1 2 1
i i i i i
i
i i i i i
a b a b a b a b a
a b a b a b a b a
. Since 3 1i i , we have
3 1/i i , which implies 3 1/i i .

37
Proof of Corollary 6
The proof of this Corollary follows immediately from Proposition 7.
Proof of Proposition 8
The overall traffic level in the system is * * *
1 2 , and therefore
2 2
* 3 3
33
(1 ) (1 )1 1
1 1
i i i i
i ii i
b a b a
a ab a b a
We can show that * / 0d db .
Proof of Proposition 9
Equation (A-2) implies that *
*
* *
ii i
i i
L
. We can further get * *1( 1)i i
i
.
Proof of Proposition10
If (c, c) is a Nash Equilibrium, then we have
* * 1 2
2, , 2, ,
4 2 4
1 2 2 2 2 1 2 2
2
2 1
1
2
(1 )(1 )((1 ) 1 2 (2 )) ((1 ) 1)0
(1 )
c c c d
b a b a
b a b a b a a
a b a
(A-14)
Since [0,1]i , we have
2 2
1 2 1
1 2
2 (1 ) (1 (1 ) )0
(1 )
b a
a b a
(A-15)
From (A-14) and (A-15), we have,
* * 1 2
2, , 2, ,
4 2 4
1 2 2 2 2 1 2 2
2
2 1
2 2
1 2 1
1 2
1
2
(1 )(1 )((1 ) 1 2 (2 )) ((1 ) 1)
(1 ) 0
2 (1 ) (1 (1 ) )
(1 )
c c d d
b a b a
b a b a b a a
a b a
b a
a b a
38
2 2
* * 2 1 2 1
2, , 2, ,
1 2
(1 ) (1 )(1 (1 ) )0
(1 )c c d c
b b a b a
a b a
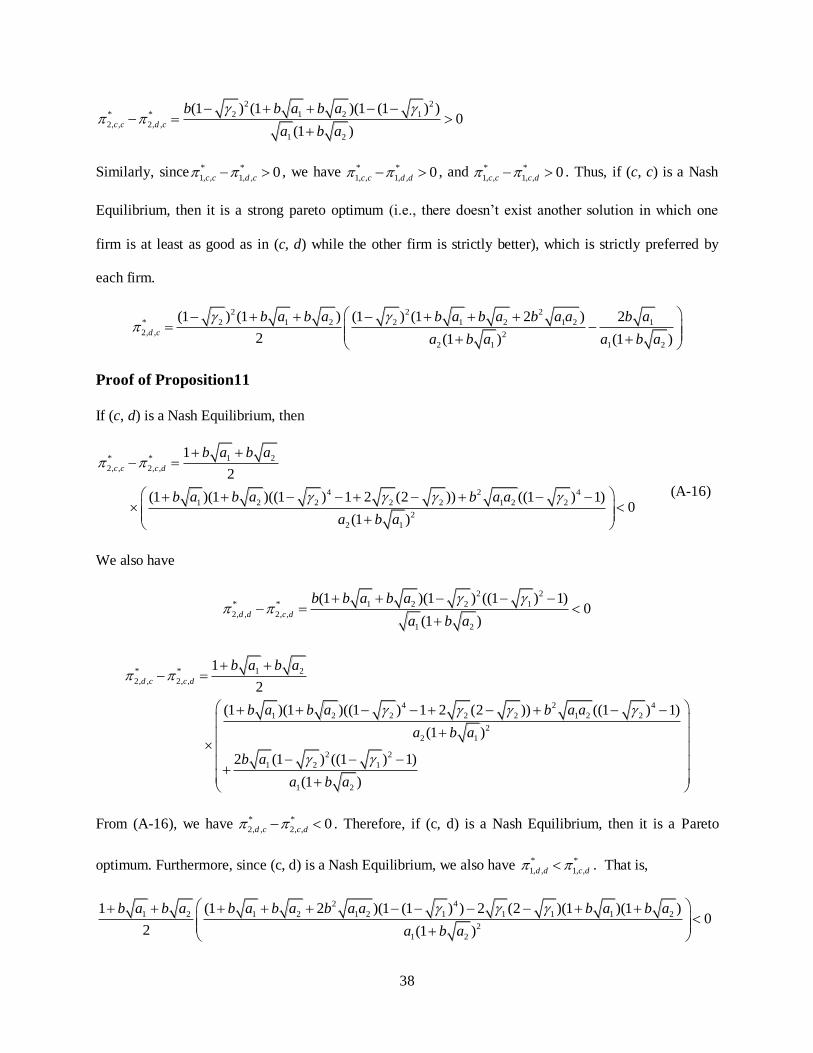
Similarly, since * *
1, , 1, , 0c c d c , we have * *
1, , 1, , 0c c d d , and * *
1, , 1, , 0c c c d . Thus, if (c, c) is a Nash
Equilibrium, then it is a strong pareto optimum (i.e., there doesn’t exist another solution in which one
firm is at least as good as in (c, d) while the other firm is strictly better), which is strictly preferred by
each firm.
2 2 2
* 2 1 2 2 1 2 1 2 1
2, , 2
2 1 1 2
(1 ) (1 ) (1 ) (1 2 ) 2
2 (1 ) (1 )d c
b a b a b a b a b a a b a
a b a a b a
Proof of Proposition11
If (c, d) is a Nash Equilibrium, then
* * 1 2
2, , 2, ,
4 2 4
1 2 2 2 2 1 2 2
2
2 1
1
2
(1 )(1 )((1 ) 1 2 (2 )) ((1 ) 1) 0
(1 )
c c c d
b a b a
b a b a b a a
a b a
(A-16)
We also have
2 2
* * 1 2 2 1
2, , 2, ,
1 2
(1 )(1 ) ((1 ) 1)0
(1 )d d c d
b b a b a
a b a
* * 1 2
2, , 2, ,
4 2 4
1 2 2 2 2 1 2 2
2
2 1
2 2
1 2 1
1 2
1
2
(1 )(1 )((1 ) 1 2 (2 )) ((1 ) 1)
(1 )
2 (1 ) ((1 ) 1)
(1 )
d c c d
b a b a
b a b a b a a
a b a
b a
a b a
From (A-16), we have * *
2, , 2, , 0d c c d . Therefore, if (c, d) is a Nash Equilibrium, then it is a Pareto
optimum. Furthermore, since (c, d) is a Nash Equilibrium, we also have * *
1, , 1, ,d d c d . That is,
2 4
1 2 1 2 1 2 1 1 1 1 2
2
1 2
1 (1 2 )(1 (1 ) ) 2 (2 )(1 )(1 )0
2 (1 )
b a b a b a b a b a a b a b a
a b a

39
Therefore, equilibrium (c, d) is strictly preferred to (d, d) by each firm.
* 1 2
1, ,
2 2
1 2 1 2 1 1 1 2 2 1
2
1 2 2 1
1
2
1 2 2 (2 )(1 )(1 ) 2 (1 )
(1 ) (1 )
d d
b a b a
b a b a b a a b a b a b a
a b a a b a
2 2 2
* 2 1 1 2 1 2 2 2
1, , 1 1 2 2
1 2 2 1
(1 ) (1 2 ) 2(1 )1(1 ) (1 )
2 (1 ) (1 )c c
b a b a b a a b ab a b a
a b a a b a
4 2 2
* 1 2 1 1 2 1 2 2 1
1, , 2
1 2 2 1
(1 ) (1 ) (1 2 ) 2 (1 )
2 (1 ) (1 )c d
b a b a b a b a b a a b a
a b a a b a
* * 21 1 2
1, , 1, , 2
2 1
(1 ) (1 )(1 (1 ) ) 0
2 (1 )c c c d
b b a b a
a b a
Thus, equilibrium (c, d) is strictly preferred to (c, c) only by firm 2.
2
1 2 1 2 1 1 1 2
2
1 2* 1 2
1, ,2 2
2 2 1
2 1
1 2 2 (2 )(1 )(1 )
(1 )1
2 2 (1 ) (1 )
(1 )
d c
b a b a b a a b a b a
a b ab a b a
b a
a b a
* * 1 2
1, , 1, ,
2 4
1 2 1 2 1 1 1 1 2
2
1 2
2 2
2 2 1
2 1
1
2
(1 2 )(1 (1 ) ) 2 (2 )(1 )(1 )
(1 )
2 (1 (1 ) )(1 )
(1 )
d c c d
b a b a
b a b a b a a b a b a
a b a
b a
a b a
* *
1, , 1, , 0d c c d holds if and only if
2 2 2
2 2 1 2 1 1 2 1
2 2 1 1 2 2
1 2 1
(1 )(1 )(1 (1 ) ) (1 (1 ) )1 (1 ) (1 )(1 (1 ) )
2 (1 ) (1 )
b a b a b a aa b a
ba b a
which can be further simplified as
2
2 2
2 1 1
1
11 (1 ) (1 (1 ) ) 1
1
w

40
Let 2
1/22
2 1( ) 1 1 1 1 1
1i i i
i
. Therefore, if 2 1( ) , then * *
1, , 1, ,d c c d ,
which implies that (c, d) is strictly preferred to (d, c) by each firm; otherwise, it is strictly preferred to (d,
c) only by firm 2.
Proof of Proposition12
The proof is similar to that for Proposition 11.
Proof of Proposition13
If (d, d) is a Nash Equilibrium, then we have
* * 1 2
2, , 2, ,
4 2 4
1 2 2 2 2 1 2 2
2
2 1
1
2
(1 )(1 )((1 ) 1 2 (2 )) ((1 ) 1) 0
(1 )
d c d d
b a b a
b a b a b a a
a b a
(A-17)
* * 1 2
1, , 1, ,
4 2 4
1 2 1 1 1 1 2 1
2
1 2
1
2
(1 )(1 )((1 ) 1 2 (2 )) ((1 ) 1) 0
(1 )
c d d d
b a b a
b a b a b a a
a b a
(A-18)
We can show that
2 2
* * 1 2 2 1
2, , 2, ,
1 2
(1 )(1 ) (1 (1 ))0
(1 )c d d d
b b a b a
a b a
2 2
* * 1 2 1 1
1, , 1, ,
2 1
(1 )(1 ) (1 (1 ) )0
(1 )d c d d
b b a b a
a b a
Therefore, equilibrium (d, d) is strictly preferred to (c, d) only by firm 2, and strictly preferred to (d, c)
only by firm 1.
The profit difference of firm i, i=1, 2, at two different equilibria (c, c) and (d, d) is

41
* * 1 2
, , , ,
4 2 4
1 2 1 2
2
3
2 2
3 3
3
1
2
(1 )(1 )((1 ) 1 2 (2 )) ((1 ) 1)
(1 )
2 (1 ) (1 (1 ) )
(1 )
i c c i d d
i i i i
i i
i i i
i i
b a b a
b a b a b a a
a b a
b a
a b a
Therefore, * *
, , , ,i c c i d d holds if and only if
2 2
3 3
2 22
1 2 1 2
2 2
3
1 1 1 1 1
1 1 1 1 1 1
2 1 1
i i i i
i i
i i i
a b a
b a a b a b a
ba b a
,
which can be further simplified as
2
2 2
3
11 1 1 1 1
1i i i
i
(A-19)
where
2
3 1 2 1 2
2
3
1 1 2
2 1
i i
i
i i
a b a b a b a b a a
ba b a
. Let
2
1/22
2 1( ) 1 1 1 1 1
1i i i
i
.
Therefore, if {1,2}i , where 3 ( )i i , then * *
, , , ,i c c i d d , which implies that (d, d) is a strong Pareto
optimum.
Proof of Corollary 8
This is because if 1 2( ) and 2 1( ) both hold for this case, then we have 1 2 2( ) and
2 1 1( ) , which is apparently a contradiction.
Proof of Corollary 9
If 1 2a a a and 1 2 , we have

42
2
, , , , (2 )(1 2 )( (2 ) 2 ) / (2 (1 ) ) 0i c c i d d b a b a a b a , i.e., (c, c) is a strictly
preferred to (d, d).