Embed Size (px)
Citation preview

FEDERAL RESERVE BANK OF ST. LOUIS REVIEW JULY/AUGUST 2005 555
Organizational Dynamics Over the Business Cycle: A View on Jobless Recoveries
Kathryn Koenders and Richard Rogerson
labor. Specifically, we assume that inefficienciesregarding the use of labor emerge over time withinan organization. Eliminating these inefficiencies(a process we refer to as reorganizing) requiresscarce organizational resources that must bediverted away from current production. Thistrade-off generates opportunities for intertemporalsubstitution, and we show that reorganization willbe postponed to periods in which production isrelatively low. It follows that after a long expan-sion, many more organizations have postponedreorganization. Because reorganization leads tothe shedding of unnecessary labor and takes time,this gives rise to an extended period in which theeconomy sheds labor, thereby delaying the dateat which aggregate employment begins to increaseduring the recovery.
The first part of this paper presents one formu-lation of a model of organizations that generatesthese effects. The core model should be seen asan extension of the Lucas (1978) span-of-controlmodel and the Hopenhayn (1992) industry equilib-
Since the work of Burns and Mitchell(1946), economists who study businesscycle fluctuations typically refer to the“business cycle facts” without need to
reference a particular episode in a particularcountry. One of the accepted stylized facts ofbusiness cycle movements is that employmentand output are strongly positively correlated,although employment lags output by about onequarter. The apparent slow growth of employmentin the recoveries following the past two U.S.recessions (i.e., the so-called “jobless recovery”phenomenon) runs counter to this stylized fact.This paper suggests a possible explanation forthis apparently anomalous behavior.
The two most recent recessions in the UnitedStates share a common property: Both followedunusually long expansions. Motivated by thisobservation, we propose an economic mechanismthat links the speed at which employmentincreases during the recovery from a recession tothe length of the expansion preceding the reces-sion.1 This mechanism stresses the manner inwhich organizations seek to eliminate unneeded
This paper proposes a new explanation for the apparent slow growth in employment during thepast two recoveries. The authors’ explanation emphasizes dynamics within growing organizationsand the intertemporal substitution of organizational restructuring. A key implication of the analysisis that recoveries from recessions following long expansions will have slower employment growth.Empirical analysis shows that the recovery that began in 1970 also exhibited slow employmentgrowth, consistent with this prediction of the analysis.
Federal Reserve Bank of St. Louis Review, July/August 2005, 87(4), pp. 555-79.
1 As noted by Kliesen (2003), these two recessions are also relativelymild. Our theory does not address this regularity.
Kathryn Koenders is a doctoral student and Richard Rogerson is the Rondthaler Professor of Economics at the W.P. Carey School of Economicsat Arizona State University. The authors thank Fernando Alvarez and conference participants and seminar participants at the Federal ReserveBanks of Atlanta, Cleveland, New York, and Philadelphia for comments. Richard Rogerson acknowledges support from the National ScienceFoundation.
© 2005, The Federal Reserve Bank of St. Louis. Articles may be reprinted, reproduced, published, distributed, displayed, and transmitted intheir entirety if copyright notice, author name(s), and full citation are included. Abstracts, synopses, and other derivative works may be madeonly with prior written permission of the Federal Reserve Bank of St. Louis.

rium model to allow for a richer set of dynamicswithin an organization. Although we focus onthe implications for business cycles, we believethis model may also prove useful for examiningplant- and firm-level dynamics more generally.The model is purposefully simplified to highlightthe key economic trade-offs, and the analysisfocuses on the qualitative nature of the interac-tions. The task of building a model suitable forquantitative analysis of the forces is left for futurework.2
Any theory that links the speed of the recoveryin employment to the length of the precedingexpansion would seem to be a viable candidatefor explaining the anomalous behavior of employ-ment following the past two recessions. However,because the recession of 1969-70 also followedan unusually long expansion, an obvious impli-cation of any such theory is that a slow recoveryof employment should also have been observedfollowing this recession. The second part of thepaper turns to this issue and argues that, whenviewed from the perspective of our model, thebehavior of employment in the 1970 recovery isin fact very similar to the behavior of employmentin the recoveries of 1991 and 2001 and is qualita-tively different from the behavior of employmentin the other post-World War II recoveries.
One interpretation of our explanation is thatthe recent recessions do not represent counter-examples to the standard set of business cyclefacts, but rather that the business cycle facts needto be modified somewhat to acknowledge thatrecoveries following long expansions exhibitsomewhat different dynamics. There are, ofcourse, other types of explanations that one mightappeal to. For example, if one thought that it isonly the two most recent recessions that appeardifferent, one might consider the possibility thatthe business cycle facts are evolving and seek tounderstand what features of the economy arechanging that would lead to the change in businesscycle dynamics of employment. Schreft and Singh(2003) pursue this tack, arguing that increasedflexibility in personnel policies are responsible
for the change. A second general class of expla-nations is to posit that the anomalous behaviorof employment in any particular cycle is due toan additional shock or policy change that happensto coincide with the recovery. The work of Coleand Ohanian (2004) on employment during thesecond half of the Great Depression is exactly thistype of explanation: They argued that employmentdid not recover as one would have expectedbecause of the adoption of the New Deal policies.A third and related class of explanations stressesthat the economic changes taking place in thebackground may influence the nature of cyclicalepisodes. Along these lines, a commonly heardexplanation for the recent slow recovery ofemployment was that the world had become moreuncertain, leading firms to postpone increases inemployment. Another explanation in this classis that the current period involves a greater degreeof structural change. Groshen and Potter (2003)examine data on sectoral employment sharesand argue that this is the case.3 Andolfatto andMacDonald (2004) present a model in which cer-tain types of technological change can generatethis outcome. We do not compare our explanationwith these others, but do note that the extent towhich the 1970 recovery is viewed as being simi-lar to the two most recent recoveries would castsome doubt on the theory that there is evolutionin the business cycle facts.
The mechanism that we describe is related toothers that have appeared in the literature, andit is of interest to note the similarities and differ-ences. An old idea in the business cycle literatureis that recessions are periods of restructuring.However, modern formulations of this idea, suchas Lilien (1982), are based on the notion that thekey element of restructuring is across organiza-tions—in particular, that resources need to bereallocated across sectors. In contrast, our modeldoes not stress the reallocation of resources fromone organization to another but rather the restruc-turing that takes place within organizations thatleads to the elimination of wasteful employment.Hall (1991) argued that recessions should be
Koenders and Rogerson
556 JULY/AUGUST 2005 FEDERAL RESERVE BANK OF ST. LOUIS REVIEW
2 van Rens (2004) presents an alternative theory that stresses invest-ment in organizational capital as a key factor in explaining thepace of employment growth coming out of a recession.
3 See Aaronson, Rissman, and Sullivan (2004) for an argumentagainst this interpretation.

thought of as reorganizations, but the reorganiza-tions that he stresses were really reallocations oflabor across activities. As noted here previously,Groshen and Potter (2003) have stressed that theamount of reallocation needed may vary over timeand be higher in some business cycle episodesthan in others.
A second related literature is associated withthe work of Caballero and Engel (1999) and Kruselland Smith (1998). Both papers consider the possi-bility that the distribution of individual state vari-ables can influence how the economy respondsto shocks. Caballero and Engel argue that the dis-tribution of the difference between plant-levelcapital stocks and their ideal points was quantita-tively significant for the response of the economyto shocks. Krusell and Smith examine how thedistribution of asset holdings across consumersaffects propagation of shocks. Qualitatively, ourmodel emphasizes a similar channel, because weargue that the distribution of efficiencies of organ-izations matters for how the economy respondsto shocks. However, despite the similarity, themechanics are quite different. In particular, ifcarried over to the labor setting, the Caballeroand Engel model cannot explain why aggregatedemand for labor would continue to decrease inthe face of positive aggregate shocks, a result thatcan emerge in our model and is central to account-ing for the delayed increase in employment thataccompanied the past two recoveries.
An outline of the next five sections follows:We describe our benchmark model, which cap-tures the evolution of an individual organizationover its life cycle. Then we consider how aggregatetemporary shocks interact with the decisions ofthe organization and derive our key result:Organizations will concentrate reorganizationsduring periods with negative aggregate shocks.The last sections (i) discuss the implications ofthis finding for the cyclical properties of labordemand and (ii) carry out an empirical analysisof postwar business cycles to show that the recov-ery following the 1969-70 recession exhibits pat-terns for employment that are quantitatively verysimilar to those found in the two most recentrecoveries.
BENCHMARK MODEL:A LIFE CYCLE MODEL OF ORGANIZATIONAL DYNAMICS
In this section we formulate a model of thelife cycle of an organization. In the next sectionwe will use this benchmark model to investigatehow the resulting pattern of organizationaldynamics may be affected by shocks that weinterpret to be business cycle shocks. The goalof these two sections is to highlight a particularinteraction between organizational dynamicsand business cycle shocks.4 With this in mind,we purposefully work in a very simple setting tobest highlight this interaction. We leave the devel-opment of a model that would be useful for aquantitative assessment of these interactions tofuture work.
The essence of the benchmark model is asfollows. We view an organization as producinga differentiated product and therefore facing adownward sloping demand curve for its product.Our model captures the following stylized evolu-tion of an organization over its life cycle: Whenan organization is first created it faces a relativelylow demand for its product. But, over time, thissituation may change. Some organizations failand disappear, while others experience largeincreases in the demand for their product andhence grow. However, even those organizationsthat grow and become large will at some pointexperience decreases in their demand and even-tually cease to exist.
The model that we describe here is one ofan individual organization that faces stochasticdemand for its product but takes all input pricesas given, prices that remain constant over time.We assume that the organization maximizes thepresent discounted value of profits using a dis-count rate of β, which one can think of as 1divided by the sum of 1 plus the interest rate.We now describe the specifics of the model inmore detail.
Koenders and Rogerson
FEDERAL RESERVE BANK OF ST. LOUIS REVIEW JULY/AUGUST 2005 557
4 Our model without aggregate shocks can also be viewed as extend-ing the model of Hopenhayn (1992) to consider richer decision-making processes within organizations.

Demand
Let P(yt,εt) be the inverse demand faced by theorganization in period t, where yt is the amountof output produced in the current period and εt
is a stochastic shock to the demand for the outputof the organization. For a given value of εt, weassume that this function is twice continuouslydifferentiable and strictly decreasing in y and thatthe product P(y,ε)y is strictly concave in y andsatisfies the boundary conditions:
The first condition will ensure that an organiza-tion that remains in existence will always wantto produce a positive amount of output, and thesecond condition states that output can effectivelybe viewed as bounded for any given ε, becausethe organization will never produce beyond thepoint where revenues are decreasing in output.
We assume a very simple form for the sto-chastic process on ε. In particular, we assumethat εt takes on only one of two values, εs or εl,where εs < εl, with the interpretation that εs isthe low demand state that will give rise to asmall organization, while εl is the high demandstate that will give rise to a large organization. Togenerate the standard life-cycle profile of organi-zation size, we assume that when an organiza-tion is first created it will have a value of ε equalto εs and that over time the state of demand mayincrease to εl. We simplify this process byassuming that the probability that ε increasesfrom εs to εl is given by the value πl, which isassumed to be constant over time. We alsoassume that the process never transits from εl
back to εs. To capture the notion that state εl isbetter than state εs, we assume that P(y,εl ) >P(y,εs) for all positive values of y and that
for all positive y as well.If the stochastic evolution of ε just described
were a complete description of the uncertaintyfacing a given organization, then all new organi-zations would eventually become “large” and
ddy
P y yd
dyP y yl s, ,ε ε( ) > ( )
lim , , lim , .y y
ddy
P y yd
dyP y y
→ →( ) = ( ) <
00ε ε`
`and�
remain that way forever. We incorporate the factthat organizations do not last forever by assumingthat organizations face an exogenous probabilityof death and that this probability varies with thestate of their demand, ε. In particular, we assumethat an organization with demand state εi faces aprobability λi of death. This assumption impliesnot only that organizations do not last forever, butalso that not all new organizations will necessarilybecome “large.”5 We assume that the realizationsof the random variables are independent.
Our assumption about timing is as follows.An organization that produced in period t withdemand state εi finds out the realizations of thedemand and death shocks at the beginning ofperiod t+1 but before any decisions are made inperiod t+1.
Production
We assume that labor is the only factor ofproduction. The production technology in ourmodel has several key features, which we detailin several steps.
Scale Effects. We assume that there are differ-ent ways to organize production and that theoptimal way to organize production depends onthe scale of production. In general, one couldimagine a large set of possible ways to organizeproduction, but given that we are restrictingattention to a model with two demand stateswe also assume that there are only two ways inwhich production can be organized. We refer toeach different way to organize production as adistinct technology. We let hi(y) denote thelabor necessary to produce output y using tech-nology i. Because we will implicitly restrictparameter values so that an organization withdemand state εs will always use technology 1and an organization with demand state εl willalways use technology 2, we will also use s andl to index the two technologies. The idea is thattechnology 1 is better when producing at a smallscale, whereas technology 2 is better when pro-
Koenders and Rogerson
558 JULY/AUGUST 2005 FEDERAL RESERVE BANK OF ST. LOUIS REVIEW
5 This specification amounts to assuming that there are three demandtypes, with the third state being an absorbing state in which theorganization cannot sell any positive amount of output and stillreceive a positive price. We identify this third state with death ofthe organization.
ducing at a large scale. We adopt the followingfunctional forms for the two technologies. Weassume that hs(y) = asy for all positive values ofy, where as > 0. The other technology is operableonly above some minimum threshold scale, y–,and for y $ y– we assume that hl(y) takes the formhl(y) = aly, where al < as. More generally wecould specify that this technology can operateat a scale less than y– but that the average productof labor is sufficiently low that no one wouldchoose to operate it below scale y–. We assumefree disposal of output, implying that an organi-zation could choose to operate the large-scaletechnology but only sell a fraction of the output,though in our analysis we will implicitly assumethat this never happens.
We assume that the organization hires laborin a competitive market and hence takes the wagerate as given. In what follows we normalize thewage rate to 1.
Organizational Waste. An important goal forany organization is to use its resources efficiently.The large differences in measured productivityacross organizations suggest that organizationsvary in the degree to which they accomplish this.Inefficient use of resources may take severalforms. We incorporate one particular form ofinefficiency, which we refer to as waste. Whatwe have in mind is that in any organization thereis potentially some duplication of effort or unnec-essary tasks being performed that affect laborproductivity in an inframarginal way. In particu-lar, in the context of the technologies describedin the previous section, we assume that anorganization with waste φ has labor requirementh(y) + φ rather than h(y). The key feature of thiswaste is that it affects average labor productivitybut not marginal labor productivity. One couldobviously consider inefficiency that also servesto alter the slope of h(y). Inefficiencies of thisform are certainly plausible. We assume ineffi-ciency only of the form as characterized by theparameter φ because it is this type of inefficiencythat will be central to our analysis. We interpretthis inefficiency as reflecting inefficiency in theorganizational design and not inefficiency dueto workers shirking, for example.
For our purposes there are two key issues
associated with these inefficiencies. The first iswhere they come from, and the second is howorganizations can eliminate them. Again, our for-mulation will be somewhat specialized to isolatea particular effect. In general, one could imaginethat inefficiencies stochastically occur withinany organization and that it takes organizationalresources to get rid of them. One could also assumethat organizations devote resources to these activi-ties ex ante to reduce the likelihood that they arise.Our formulation relies on the notion that changesin organizational scale are likely to be associatedwith the appearance of inefficiencies because theorganization is less likely to know how to best useresources as it moves to a new organizationalstructure.6 Motivated by this idea, we assumethat all organizations operating the small-scaletechnology do so efficiently, but that wheneveran organization switches from the small-scaletechnology to the large-scale technology it willnecessarily move to a positive level of inefficiencythat we denote by the parameter φ–. That is, if anorganization used technology s in period t –1 andswitches to technology l in period t, then theirlabor requirement function will be aly + φ– for y$ y–. We note that it would be straightforward toalso assume that a new organization that is oper-ating the small-scale technology for the first timealso begins with an inefficiency, but we abstractfrom this possibility for simplicity. We assume thatthe level of inefficiency is known to the organi-zation. Although one could consider interestingissues that arise from organizations not havingcomplete information about the state of theirefficiency and needing to learn over time aboutthem, we abstract from them here.
Having described how inefficiencies arise,we now turn to the issue of how an organizationcan get rid of them. We adopt a simple and straight-forward formulation. In particular, in any givenperiod an organization makes a discrete decisionabout whether to try to eliminate inefficiency.Having done so, with probability πe the organiza-tion will decrease its inefficiency to zero in thefollowing period, whereas with probability 1– πe
Koenders and Rogerson
FEDERAL RESERVE BANK OF ST. LOUIS REVIEW JULY/AUGUST 2005 559
6 Bertschek and Kaiser (2001) present evidence from a data set ofGerman firms that changes in productivity are linked with changesin organizational structure.

the organization will experience no change in itslevel of inefficiency. Assuming that there is noimprovement in efficiency, the organization cancontinue to try to get rid of the inefficiency in eachsubsequent period.
Our formulation assumes that a given organi-zation makes stochastic transitions between twolevels of efficiency. If we had a large number oforganizations all with inefficiency φ– and they allcontinued to try to eliminate this inefficiencyuntil successful, then the average level of ineffi-ciency among this group of organizations woulddecrease monotonically and approach zeroasymptotically. As we will see later in the analysis,this is the pattern that we want to generate. Ofcourse, this pattern could also be generated byhaving each individual organization experiencea monotonically decreasing level of inefficiencyrather than the all-or-nothing form that we spec-ify. We have chosen the all-or-nothing form ofimprovements to simplify the analysis of themodel.
In the next subsection we describe in moredetail the cost to the organization of trying toreduce its level of inefficiency. Note that weassume that there is no direct cost associatedwith changing from one technology to another. Itwould be straightforward to add such a cost butit is not central to the effects that we stress below.Last, our model is related to models of costlyadjustment and models of organizational capital,so it is of interest to remark on these relationships.At a general level, the inefficiency associated withchange of scale can obviously be interpreted as aform of adjustment cost. We note, however, thatour specification differs from most specificationsof adjustment costs because the cost does notnecessarily disappear in the periods followingthe adjustment. That is, most models of adjustmentcosts assume a one-time cost associated with theadjustment, but here the cost is permanent unlessthe organization takes some actions. The restruc-turing that takes place within organizations in ourmodel can also be interpreted as a form of invest-ment in organizational capital. However, ourmodel differs from many formulations of organi-zational capital in that we implicitly assume thatthis investment in organization capital is a substi-
tute for labor input because it leads to a reductionin labor, whereas most analyses assume thatincreases in organizational capital lead to increasesin the marginal product of labor.
The Role of the Manager. We assume thateach organization has one manager and poten-tially many workers. The labor requirementfunctions described in the previous subsectionshould be thought of as specifying the requiredamount of nonmanagerial labor input. In thisregard our model is similar to the standard span-of-control model of Lucas (1978). However, wedeviate from that model by allowing a managerto choose between two primary uses of their time.In particular, we assume that managers can devotetheir time either to facilitating production or totrying to reduce inefficiency. We shall cast thischoice as having the manager choose between“producing” or “reorganizing,” which we willdenote as m = p and m = r, respectively. Thecost of having managers devote time to reorgan-izing is that they are not able to focus on pro-duction. We model this cost as a decrease in theefficiency of labor used in the organization. Inparticular, we assume that if a manager of anorganization using large-scale technology withinefficiency φ– devotes time to reorganization,then the labor requirement function becomes(1+η–)hl(y) +φ–, where η– >0 is the efficiency lossassociated with the manager not focusing atten-tion on production. The benefit of having themanager focus on reorganizing is that it makes itpossible for the organization to be more efficientin the future. As this description makes clear, akey trade-off that a manager faces when makingdecisions about time allocation is between currentefficiency and future expected efficiency. As wewill see in the next section, it is this tradeoff andhow it interacts with business cycle shocks thatis at the heart of our analysis.
We assume a competitive market for (homo-geneous) managers. The organization will there-fore also take the managerial wage as given, whichwe also assume to be constant over time. Becausean organization cannot function without a man-ager, managerial compensation is effectively afixed per-period cost for the organization. Wedenote this wage by wm. The only way that anorganization can avoid having to hire a manager
Koenders and Rogerson
560 JULY/AUGUST 2005 FEDERAL RESERVE BANK OF ST. LOUIS REVIEW

is to cease to exist. We assume that if an organi-zation chooses this option that it cannot returnin the future.
The Organizational Life Cycle
It is straightforward to formulate the optimiza-tion problem of the organization just depicted. Wedo it recursively. The state vector for the organi-zation that remains alive is denoted by s = (ε,φ),where ε is the state of demand for its productand φ is its level of inefficiency if it chooses tooperate the large-scale technology. An organiza-tion is always born into the state (εs,φ
–), which isto say that a new organization begins with demandin the low state and an inefficiency level of φ–.Note that the level of inefficiency begins at φ–
because, if a new organization were to use thelarge-scale technology, it would be faced withthe inefficiency. But, as noted earlier, as long asit chooses to operate the small-scale technology,it can do so without experiencing any inefficiency.In each period, after observing its current statevariable, if the organization remains alive it facesthree choices: which technology to use (i = s orl ), how much output to produce (y), and how toallocate the manager’s time (m = p or r). Given theorganization’s state vector and choices for eachof these decisions, we can determine the currentrevenues net of payments to nonmanagerial laborthat would accrue to the organization, which wewill denote by R(ε,φ,i,y,m). This function takesthe following form:
(1)
where Im= r is the indicator function for m= r (i.e.,the manager reorganizes) and Ii = l is the indicatorfunction for using the large-scale technology.
It is now easy to write the Bellman equationfor the maximization problem faced by theorganization:
(2)
where the outer max reflects the decision ofwhether to remain active and the inner max
VR e i y m
EVi y m iε φ
φ
β λ, max ,max
, , , ,
, ,( ) =
( )+ −( ) ′
01 εε φ,
,′( )
R i y m
P y y h y I wm ri
i l
ε φ
ε η φ
, , , ,
, I
( )= ( ) − +( ) ( ) − −= =1 mm,
reflects the optimal choices, assuming that theorganization remains active. We have assumedthat if the organization ceases to exist, eitherthrough choice in the current period or becauseof a death shock in the next period, all futurereturns will be zero. The expectation operator Eincorporates two elements. First it incorporatesthe dynamics in the demand state ε, and second itincorporates the dynamics in the level of ineffi-ciency if the organization chooses to have themanager devote time to reorganization.
Given our assumptions thus far, we cannotrule out some rather extreme or degenerate out-comes that are of little interest. We describe someof these now. In what follows we do not offer anyspecific conditions on the model specification torule out these outcomes, but do note intuitivelywhat parameters would be relevant in ruling outcertain outcomes.
It is possible that a newly created organizationcannot earn positive expected lifetime profitsand hence will choose to shut down. In particular,as noted previously, the managerial wage acts likea fixed cost of being in operation, and it is wellknown that in a model with a fixed cost it is notenough to guarantee positive net revenues fromthe variable factors, as our earlier assumption onP does. Of course, if a newly created organizationis choosing to shut down and there is some costassociated with creating an organization in thefirst place, then this would imply that new organi-zations are never created. In an equilibrium con-text in which consumption is infinitely valuedat the margin when consumption is zero, such anoutcome could not be an equilibrium outcome.In view of this, it is natural to assume that wagesare sufficiently low relative to the price of outputthat new firms choose to operate. Given ourassumptions on the price function, P, it followsthat if the expected present discounted value ofprofits is positive for a newly created organization,then it is positive for any feasible state vector. Thisproperty does not necessarily imply that theorganization will have positive current-periodprofits in all states; it is possible that a neworganization remains active only because of thepossibility of transiting to the higher demand stateand that the higher demand state is the only state
Koenders and Rogerson
FEDERAL RESERVE BANK OF ST. LOUIS REVIEW JULY/AUGUST 2005 561

that is profitable in a static sense. Given ourassumptions on P, however, it is true that if anorganization remains active it will always chooseto produce a positive amount of output, even ifcurrent-period profits are negative.
The model has been constructed to focus onthe change in scale of production and the associ-ated change in organization structure that occursas organizations successfully mature. Given aprice function, P, however, if the value of y– issufficiently large then no organization will everchoose to operate the large-scale technology; if y–
is too small, then all organizations will choose tooperate the large-scale technology. In the contextof our model, neither of these cases is particularlyinteresting. So, in what follows, we assume thatit is optimal for an organization in demand stateεs to operate the small-scale technology and foran organization in the demand state εl to operatethe large-scale technology. We note, as a featureof our specification, that it is not possible to elimi-nate future inefficiency while currently operatingthe small-scale technology. It follows that, even ifan organization decides to reorganize and therebyexperiences the current loss of efficiency associ-ated with η, the organization will still choose tooperate the large-scale technology.
Last, it is also possible that the values of φ andη– are such that no organization would ever chooseto reorganize. This could happen if the level ofinefficiency (i.e., φ) is sufficiently small relativeto the foregone productivity (i.e., η– is large) or theprobability of failure in reorganization (i.e., 1–π e).Conversely, if the size of the inefficiency is suffi-ciently large relative to the cost of eliminating it,then an organization would always choose toreorganize. Because the case of no reorganizationis not very interesting in the context of our model,we assume in what follows that we are in a regionof parameter space in which organizations dosometimes choose to reorganize.
Conditional on assuming that a newly createdorganization chooses to remain in existence, thatorganizations in the low (high) demand stateoperate the small- (large-) scale technology, andthat organizations sometimes choose to eliminateinefficiency, it is fairly easy to characterize thelife cycle dynamics that emerge. In particular,any newly created organization will operate the
small-scale technology and hire an amount oflabor that we denote by hs, producing outputdenoted by ys. Over time there are three thingsthat may happen to this organization. It mayreceive a shock and cease to exist, it may remainin the same position and hence continue to hirehs workers, or it may experience a shock thatincreases its demand to the high state.
If it is sometimes optimal to try to eliminateinefficiency, then because the organization’sproblem is recursive, it must be optimal to do itthe first time the organization reaches the highdemand state. While in the high state and reor-ganizing, the organization is employing the large-scale technology and hires labor that we denote byhr, producing output denoted by yr. Even thoughthe manager’s devotion of time to reorganizinglowers the marginal product of labor, it still mustbe the case that hr > hs. To see this, note the fol-lowing. First, this organization must be producingat least y– units of output, which must exceed theamount of output produced in the low demandstate; otherwise it would not have been optimalto use the small-scale technology in the lowdemand state. Now, if it was possible to producemore output with less labor, then the organizationcould have chosen this combination in the pre-vious state and chosen not to sell all of the outputproduced. It follows that hr must exceed hs. Itfollows that if an organization experiences animprovement in its demand state, it increasesboth its labor input and its output. Note that wecannot say anything about what happens to aver-age labor productivity. Productivity will dependon the magnitudes of the parameters η– and φ–.
An organization in the high demand statethat is reorganizing can in turn experience threedifferent transitions. First, it may receive a badshock and cease to exist. Second, it may be unsuc-cessful in eliminating inefficiency and remain inthe same state, in which case it chooses the sameactions again. Third, it may be successful in elimi-nating the inefficiency. We denote the levels of yand h that result in this case as hl and yl. How dothe values of hl,yl and yl/hl compare with thecorresponding values from earlier in the life cycle?The first-order condition for current-period choiceof output combined with our assumptions on Pimplies that output will definitely increase when
Koenders and Rogerson
562 JULY/AUGUST 2005 FEDERAL RESERVE BANK OF ST. LOUIS REVIEW

the manager focuses on production rather thanreorganization. This occurs because the term (1 + η–) goes away from the first-order condition.However, it is ambiguous whether this leads toan increase or decrease in h, for two reasons. First,even if the only effect were the improved effi-ciency associated with the managerial time alloca-tion, the effect on labor, as opposed to output, willdepend on the elasticity of the demand function.Second, the elimination of the inefficiency meas-ured by φ– necessarily implies a decrease in laborin the amount of φ–. However, although the effecton h is ambiguous, it is easy to see that independ-ently of what happens to h, average labor produc-tivity will necessarily increase.
Although with our implicit assumptions onparameter values that the organization will neverchoose to postpone reorganization once it reachesthe high demand state, we can still ask what levelsof h and y would be optimal if it chose to do so.Denote these levels by hp and yp. We ask how hp
and hl compare. In making this comparison weare assuming that the current-period marginalefficiencies are the same because in both casesthe manager is focusing on production. Givenour formulation, it follows that output will bethe same in each case ( i.e., yp = yl ). However,because of the waste in the former case, we knowthat hp > hl, which will be of particular interestlater because it states that an inefficient firm thatchooses to postpone reorganization will necessar-ily shed workers in the future.
As a final remark in this section, we notethat our model emphasizes the restructuring thataccompanies growth of an organization. It seemsequally plausible that restructuring within shrink-ing organizations would also be of importance.For the implications that we stress, we believethat similar results would emerge from this situ-ation as well, so we have chosen to focus on grow-ing organizations purely for simplicity.
THE MODEL WITH TEMPORARYSHOCKS
The previous model considered the decision-making of an organization over its life cycle. Theonly shocks in that model were highly persistent,
and we interpreted them to be organization spe-cific. In this section we add purely temporaryshocks to the model and examine how these tem-porary shocks influence the life cycle dynamicsthat we studied earlier. Although our model ispurely decision theoretic, we will interpret thei.i.d. shocks that we introduce as reflecting(aggregate) business cycle shocks.
Formally, we assume a second shock thatinfluences demand; for simplicity we assumethat this shock is multiplicative, so that we writethe inverse demand function facing the organiza-tion as ε2tP(yt,ε1t), where P is the same function asdescribed earlier, ε1t is the shock that we previ-ously labeled as εt, and ε2t is an i.i.d. shock thatis drawn from a distribution with cdf F(ε2). Weassume that realizations of ε2 lie in the interval[εmin,εmax] and that this interval contains 1 in itsinterior. Note that if ε2t =1 for all t, then the modelis identical to that considered previously. All otheraspects of the environment are left unchanged.
Proceeding as before, we define the revenueassociated with decisions in a particular state asR(ε1,ε2,φ,i,y,m). This function takes the followingform:
(3)
where Im= r is the indicator function for m= r (i.e.,the manager reorganizes) and Ii = l is the indicatorfunction for using the large-scale technology. It isimmediate that both R and Ry are increasing in ε2.
It is again easy to write the Bellman equationfor the maximization problem faced by theorganization:
(4)
For future reference it is worthwhile to elaborateon the expected value term in more detail. Asnoted earlier, this expectation takes into accountthe evolution of the exogenous shocks as well asthe evolution of the inefficiency variable inresponse to the decision about reorganization. Ifε1 = εs, then the only value of φ of interest is φ = φ–.
VR i y m
i y mε ε φ
ε ε φ
β1 21 2
01
, , max ,max, , , , ,
, ,( ) =
( )+ −−( ) ′ ′ ′( )
λ ε ε φi EV 1 2, ,.
R i y m
P y y I h ym ri
ε ε φ
ε ε η1 2
2 1 1
, , , , ,
,
( )= ( ) − +( ) ( ) −= II wi l m= −φ ,
Koenders and Rogerson
FEDERAL RESERVE BANK OF ST. LOUIS REVIEW JULY/AUGUST 2005 563

Assuming this configuration plus an arbitraryvalue for ε2, the term for the next period’s valuein the Bellman equation becomes
(5)
If the organization has ε1 = ε l, then the only effi-ciency value of interest is still φ = φ–, becauseotherwise there is no need for a decision aboutreorganization and the problem becomes static.For an arbitrary value of ε2, if the organizationdecides to reorganize, then the future term in theBellman equation becomes
(6) ;
whereas, if it chooses not to reorganize, then thesame term becomes
(7)
As was true in the previous subsection,depending on parameter values there are variousforms that the optimal decision rules may take.We modify our previous assumptions marginally,so we now assume that when ε1 = εs the organiza-tion will choose to remain active independentlyof the value of ε2.7 We furthermore assume thatwhen an organization experiences an increase inits demand state from εs to ε l that there is at leastsome interior value of ε2 for which the organiza-tion would choose to reorganize.
Finally, we also place an implicit assumptionon the size of the shocks to ε1 and ε2. In particularwe assume that life-cycle shocks are much largerthan business-cycle shocks. The significance ofthis is that we assume that when ε1 = εs the organ-ization does not wish to operate the large-scale
β λ ε ε φ β λ ε ε φ ε1 11 2−( ) ′ ′ ′( ) = −( ) ∫ ( ) (i l lEV V dF, , , , )).
β λ ε ε φ
β λπ ε ε ε
1
10
1 2−( ) ′ ′ ′( )
= −( ) ( )i
le l
EV
V dF
, ,
, , (( )+ −( ) ( ) ( )∫
∫
1 π ε ε φ εe lV dF, ,;
β λ ε ε φ
β λπ ε ε φ ε
1
1
1 2−( ) ′ ′ ′( )
= −( ) ( )i
sl l
EV
V dF
, ,
, , (( )+ −( ) ( ) ( )∫
∫
1 π ε ε φ εl sV dF, ,.
technology independently of the realization of ε2.Similarly, we assume that when ε1 = ε l the organ-ization never chooses to operate the small-scaletechnology independently of the realization of ε2.This model is identical to the model of the previ-ous section if we assume that εmin = εmax = 1. Itfollows that, if the previous model implies tech-nology i is operated only in demand state i, thismodel will also generate this result if the rangeof ε2s is not too large.
We are now able to prove our main result,which is that the decision to reorganize when instate (ε l,ε2,φ
–) is characterized by a reservationvalue of ε2, with the property that it is optimal toreorganize if ε2 < ε∗
2, and not to reorganize if ε2 > ε∗2.
The intuition for the result is simple: It basicallyreflects intertemporal substitution of reorganiza-tion. Reorganization imposes a cost today in termsof foregone efficiency of labor, but offers a futuregain in reducing waste. If ε2 is i.i.d., then futuregains are the same independently of the currentvalue of ε2. But, we will show that the current-period cost of reorganizing is increasing in theamount of production desired in the event of notreorganizing, which in turn is increasing in ε2.
We now establish these results. Consider anorganization in state (ε l,ε2,φ
–). Let yP denote theoptimal level of production if the organizationwere to choose not to reorganize, and let yr denotethe optimal level of production were the organi-zation to choose to reorganize. Conditional ondeciding whether to reorganize, note that theresulting decision about the optimal choice of yis static and can be represented as
(8)
where η takes on the value 0 in the event of m = pand η = η– in the event that m = r. We denote theoptimal choice of y as y(ε2,η). Note that the first-order condition that defines this function is
(9)
Given our assumptions, it follows trivially thatthe optimal value of y is increasing in ε2 anddecreasing in η.
Let VP(ε l,ε2,φ–) and Vr(ε l,ε2,φ
–) be the resultingoptimal values obtained from choosing not to
ε ε ε η2 1 1yP y P y h yl l, , .( ) + ( ) = +( ) ′( )
W P y y h yy
lε η ε ε η2 2 1, max , ,( ) = ( ) − +( ) ( ){ }
7 More generally, it would be straightforward to allow for the possi-bility that the organization will not remain in operation for allrealizations of ε2. In this case there will be a reservation value ofε2 that dictates whether the organization remains.
Koenders and Rogerson
564 JULY/AUGUST 2005 FEDERAL RESERVE BANK OF ST. LOUIS REVIEW
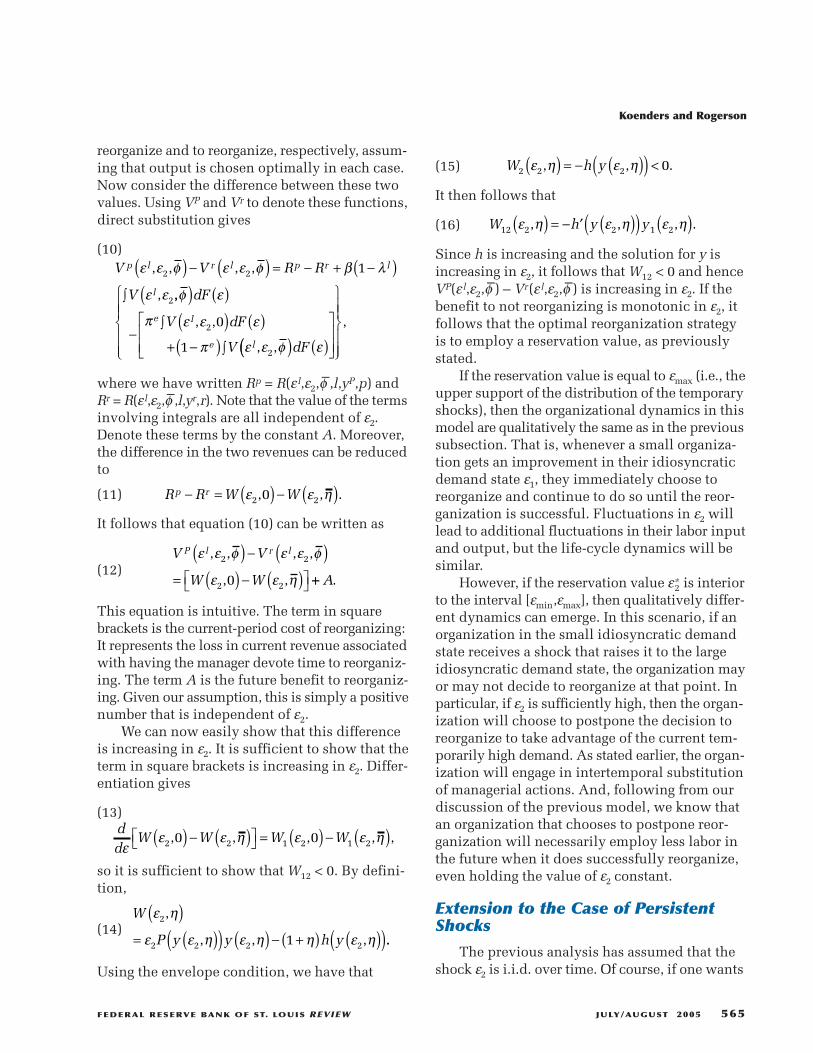
reorganize and to reorganize, respectively, assum-ing that output is chosen optimally in each case.Now consider the difference between these twovalues. Using VP and Vr to denote these functions,direct substitution gives
(10)
where we have written Rp = R(ε l,ε2,φ–,l,yP,p) and
Rr = R(ε l,ε2,φ–,l,yr,r). Note that the value of the terms
involving integrals are all independent of ε2.Denote these terms by the constant A. Moreover,the difference in the two revenues can be reducedto
(11)
It follows that equation (10) can be written as
(12)
This equation is intuitive. The term in squarebrackets is the current-period cost of reorganizing:It represents the loss in current revenue associatedwith having the manager devote time to reorganiz-ing. The term A is the future benefit to reorganiz-ing. Given our assumption, this is simply a positivenumber that is independent of ε2.
We can now easily show that this differenceis increasing in ε2. It is sufficient to show that theterm in square brackets is increasing in ε2. Differ-entiation gives
(13)
so it is sufficient to show that W12 < 0. By defini-tion,
(14)
Using the envelope condition, we have that
W
P y y h y
ε η
ε ε η ε η η ε η2
2 2 2 21
,
, , ,
( )= ( )( ) ( ) − +( ) ( )( )..
dd
W W W Wε
ε ε η ε ε η2 2 1 2 1 20 0, , , , ,( ) − ( ) = ( ) − ( )
V V
W W
P l r lε ε φ ε ε φ
ε ε η
, , , ,
, ,
2 2
2 20
( ) − ( )= ( ) − ( ) ++ A.
R R W Wp r− = ( ) − ( )ε ε η2 20, , .
V V R R
V
p l r l p r l
l
ε ε φ ε ε φ β λ
ε ε
, , , ,
,
2 2
2
1( ) − ( ) = − + −( ),,
, ,
, ,
φ ε
π ε ε ε
π ε ε φ
( ) ( )
−( ) ( )
+ −( )
dF
V dF
V
e l
e l
2
2
0
1 (( ) ( )∫
∫
∫
dF ε
,
(15)
It then follows that
(16)
Since h is increasing and the solution for y isincreasing in ε2, it follows that W12 < 0 and henceVP(ε l,ε2,φ
–) – Vr(ε l,ε2,φ–) is increasing in ε2. If the
benefit to not reorganizing is monotonic in ε2, itfollows that the optimal reorganization strategyis to employ a reservation value, as previouslystated.
If the reservation value is equal to εmax (i.e., theupper support of the distribution of the temporaryshocks), then the organizational dynamics in thismodel are qualitatively the same as in the previoussubsection. That is, whenever a small organiza-tion gets an improvement in their idiosyncraticdemand state ε1, they immediately choose toreorganize and continue to do so until the reor-ganization is successful. Fluctuations in ε2 willlead to additional fluctuations in their labor inputand output, but the life-cycle dynamics will besimilar.
However, if the reservation value ε∗2 is interior
to the interval [εmin,εmax], then qualitatively differ-ent dynamics can emerge. In this scenario, if anorganization in the small idiosyncratic demandstate receives a shock that raises it to the largeidiosyncratic demand state, the organization mayor may not decide to reorganize at that point. Inparticular, if ε2 is sufficiently high, then the organ-ization will choose to postpone the decision toreorganize to take advantage of the current tem-porarily high demand. As stated earlier, the organ-ization will engage in intertemporal substitutionof managerial actions. And, following from ourdiscussion of the previous model, we know thatan organization that chooses to postpone reor-ganization will necessarily employ less labor inthe future when it does successfully reorganize,even holding the value of ε2 constant.
Extension to the Case of PersistentShocks
The previous analysis has assumed that theshock ε2 is i.i.d. over time. Of course, if one wants
W h y y12 2 2 1 2ε η ε η ε η, , , .( ) = − ′ ( )( ) ( )
W h y2 2 2 0ε η ε η, , .( ) = − ( )( ) <
Koenders and Rogerson
FEDERAL RESERVE BANK OF ST. LOUIS REVIEW JULY/AUGUST 2005 565

to think of the ε2 shock as proxying for businesscycle movements in the demand faced by anindividual organization, then the i.i.d. assumptionis not very appealing. A well-documented prop-erty of business cycles is that they are persistent,in the sense that if the economy is above trendtoday then we also expect it to be above trendnext period. In view of this, it is of interest to askwhether our result about the reservation value willextend to the case of persistent shocks. In fact, theargument is easily extended.
In the i.i.d. case, we argued that the currentcost of reorganizing is increasing in the currentvalue of ε2 and that the expected future benefit ofreorganizing is independent of the current-periodvalue of ε2. The first statement is independent ofwhether the realizations of ε2 are i.i.d. or not. How-ever, a key observation about the structure of ourmodel is that the benefit to successful reorganiza-tion is in fact independent of future realizationsof ε2. The reason for this is that, in our model,successful reorganization does not influence themarginal product of labor, and as a result an effi-cient organization and an inefficient organizationwill choose the same level of output conditionalon having the same managerial time allocation.The only effect on profit is from saving labor inthe amount of φ– for each future period that theorganization remains in existence, and this savingis independent of all future realizations of ε2.
The additional issue that needs to be addressedin the context of a model with persistent shocksto ε2 is the following: An organization faced witha current realization of ε2 can also consider thepossibility of waiting a period to reorganize. If thebenefit from waiting increases as ε2 decreases, thenthe reservation property might not be preserved. Inthe i.i.d. case, the benefit from waiting is actuallyincreasing in ε2, because next period’s expectedone-period cost of reorganizing is independentof ε2; thus, a higher current value of ε2 indicateslower expected costs in the future, whereas a lowvalue of ε2 indicates higher expected costs in thefuture.
With this in mind we can present the alter-native characterization of the decision to reor-ganize. In particular, let C(ε) = W(ε,0) – W(ε,η–) bethe gain this period from not reorganizing. Let
G = βπeφ–/(1 – β(1 – λl)) be the (expected) gain fromchoosing to reorganize today. Letting H(ε) be thebenefit of today’s managerial choice relative toreorganizing today, we have that H(ε) satisfies
(17)
where the first term indicates the gain from notreorganizing today and the second term indicatesthat if the manager chooses to reorganize then thegain is clearly zero. We know that C(ε) is increas-ing in ε from our previous analysis. If we knewthat the term C(ε) + β∫H(ε′ )F(dε′,ε) was increasingin ε, the current realization of the shock, then wecould easily conclude that the reservation propertyholds. As stated earlier, note that if ε is i.i.d., thenthe integral is independent of ε and the propertyholds based on the property of C. However, findingconditions under which the integral is increasingin ε is a standard problem in dynamic stochasticmodels. In particular, if we assume that
(18)
is increasing in ε for any increasing function, thenwe can easily show that the value function H willin fact be increasing and hence that the integralhas the desired property.
Loosely speaking, a process for ε2 that impliedmean reversion would tend to satisfy this property.This is because a high value of ε2 today impliesthat future values of ε2 will be lower, implyingthat it is beneficial to wait to reorganize. On theother hand, a very low value of ε2 today impliesthat future values of ε2 will be higher, implyingthat there is greater incentive to reorganize todayrather than in the future.
We conclude that the reservation value prop-erty for the optimal reorganization decision willalso hold in the case of persistent shocks underreasonable conditions.
IMPLICATIONS FOR BUSINESSCYCLE DYNAMICS
Our formal analysis has considered only thedecision problem of an individual organizationthat takes demand for its product as given, assum-
g F d∫ ′( ) ′( )ε ε ε,
H C H F dε ε β ε ε ε( ) = ( ) + ′( ) ′( )∫{ }max , , ,0
Koenders and Rogerson
566 JULY/AUGUST 2005 FEDERAL RESERVE BANK OF ST. LOUIS REVIEW

ing that wages for workers and managers and thereal interest rate are constant over time. Such amodel can be cast in an industry equilibriumsetting, as in Hopenhayn and Rogerson (1993),in which the organizational dynamics that wedescribe can capture the steady-state dynamicsof a general equilibrium model in which allshocks are idiosyncratic (i.e., there are no aggre-gate shocks). If one introduces aggregate shocksinto such a model, then one would need to takeinto account the effect that these shocks have onwage rates and the real interest rate. Veracierto(2002) and Thomas (2002) are examples of modelsin which these general equilibrium effects areconsidered. Hence, in its current form the modelis really not appropriate to discuss how the econ-omy responds to aggregate shocks. Nonetheless,in this section we want to discuss some potentialeffects suggested by previous analysis for busi-ness cycle dynamics. We leave development ofthe appropriate framework and the associatedformal analysis for future work.
Consider the following situation. We have aunit mass of entry of new organizations eachperiod, each of which enters into the individualstate (ε s,φ–). We consider the ε2 shock to be com-mon to all organizations, while the ε1 shock isidiosyncratic, and trace out the evolution of theeconomy assuming that wage rates and the interestrate remain constant. The first observation that wewant to stress is that the aggregate state of thiseconomy will be the realization of the aggregateshock ε2 and the distribution of organizationsacross individual states. Entering a given periodthere are three types of organizations: those thatare in the state (ε s,φ–) (which we call type 1), thosethat are in the state (ε l,φ–) (which we call type 2),and those that are in the state (ε l,0) (which we calltype 3). We let µi be the mass of firms in each ofthe three states. The evolution of the µis is affectedby the realization of the aggregate shock because itdetermines whether organizations in state 2 will bereorganizing, thereby influencing the probabilitythat an organization transits to state 3. In partic-ular, let µit be the distribution of active organiza-tions in period t. Then, if ε2t > ε∗
2, we have thefollowing:
(19)
If, on the other hand, we have ε2t < ε∗2, then the
distribution will evolve according to
(20)
Two simple conclusions can be drawn from theselaws of motion. First, note that the law of motionfor µ1t is independent of the realization of ε2. Itfollows that, if entry is constant as we haveassumed, the value of µ1 will approach a constantand will not be affected by realizations of ε2. Theconstant fraction of type 1 organizations is easilycomputed to be λl/(λl + πl ).The second point tonote is that the remaining mass of organizationswill be split between type 2 and type 3 organiza-tions and that this division will depend on thehistory of the ε2 realizations. Specifically, if ε2remains above ε∗
2, then there is a greater buildupof type 2 organizations at the expense of type 3organizations. It follows that the longer theaggregate shock remains above the reservationvalue, the greater will be the buildup of type 2organizations. In what follows, we illustrate thepotential effects that this can have on how theeconomy responds to subsequent shocks.
A Reduced-Form Example
For present purposes, the most effective wayto illustrate the interaction between the distribu-tion of organizations and the response of theeconomy to a given sequence of aggregate shocksis with a very specific reduced-form example.Consider an economy at time 0 with unit mass oforganizations that are distributed across types.We assume that the stochastic process for ε2 hasa sequence of realizations of the following form.In period 0 the economy is hit by a (very) negativevalue of ε2 but, subsequent to this, experiences aconstant and gradual increase back toward itsunconditional mean value. We assume that it takesthe economy 20 periods to reach this value, at
µ λ π µ
µ λ π µ π µ1 1 1
2 1 2 1
1 1
1t
s lt
tl e
tl
+
+
= − −( ) +
= − −( ) + tt
tl
te
tµ λ µ π µ3 1 3 21+ = −( ) + .
µ λ π µ
µ λ µ π µ
µ
1 1 1
2 1 2 1
3
1 1
1t
s lt
tl
tl
t
+
+
= − −( ) +
= −( ) +
ttl
t+ = −( )1 31 λ µ .
Koenders and Rogerson
FEDERAL RESERVE BANK OF ST. LOUIS REVIEW JULY/AUGUST 2005 567

which time it remains there. This type of realiza-tion could be thought of as tracing out the impulseresponse function in the presence of a mean-reverting process.
We assume the following reduced-form prop-erties in our example. First, we assume that reor-ganization is optimal for this entire range ofrealized ε2 values. Second, we assume that whenan organization reorganizes successfully, the effecton labor input is a decrease of e f, holding ε2 con-stant, and is independent of the level of ε2. Third,we assume that, for each period in which ε2 isincreasing, the aggregate effect of this on laborinput is an increase in labor input of eh, which weassume is distributed across organizations accord-ing to size.8 We assume that in period 0 a smallorganization employs 10 workers and that a largereorganized organization employs 100 workers.By assumption, a large organization in the processof reorganizing will employ 100 + ef workers. Theprobabilities π l,πe,λs, and λl are as before.
Our goal here is to illustrate the potential forthe initial distribution of organizations to influ-ence the resulting response of employment to agiven sequence of shocks. With this in mind, wesimulate the implied path of aggregate employ-ment for several different initial conditions. Asalready noted above, with a constant rate of entryof new organizations, asymptotically there willbe a constant mass of organizations and a constantfraction of them will be of type 1 (i.e., in the lowdemand state with inefficiency φ–). In view of thiswe always consider the initial fraction of type 1organizations to correspond to this fraction. Wenormalize the total mass to equal 1 and henceassume that µ10 = λl/(λl + πl ). As noted earlier,however, at any given point the distribution ofthe remaining organizations between type 2 andtype 3 will be influenced by the previous historyof realizations of ε2, and we therefore considerdifferent scenarios for how this remaining mass isallocated across type 2 and type 3 organizations.
For the paths shown in Figure 1 we have seteh = 0.1 and ef = 10. Setting eh = 0.1 amounts toassuming that the accumulated increases in ε2
over the 20 periods would increase aggregateemployment by roughly 4 percent over the courseof 20 periods, holding all else constant. We setε f = 10, implying that successful reorganizationleads to a reduction in employment of roughly10 percent. We set λl = π l = 0.0025, implying thatover the course of the 20 periods the accumulatedprobability of failure for a large organization orsuccess for a small organization is roughly 5 per-cent. Finally, we set πe = 0.05, which implies anexpected duration of 20 periods for successfulreorganization. Although we have offered thesequantitative guides to thinking about the parameterselections, we also emphasize that this exampleis purely illustrative. We leave a rigorous quanti-tative assessment of the economic mechanismsdescribed here for future work.
Figure 1 shows the employment paths thatresult for three different initial values of µ2. Ineach case, the curve represents deviations frommeans for each path to focus attention on theimplications for timing. The figure shows that asµ20 increases it takes longer to reach the turningpoint of employment. This result is intuitive. Thegreater the value of µ20, the greater is the totalamount of reorganization that needs to be done.As this reorganization takes place, successfulorganizations will be shedding labor. This laborshedding is an opposing force to the increases inlabor associated with the gradual improvementin the aggregate shock ε2. A key point to note isthat in our model, reorganization is potentially along-lasting process in the sense that in any givenperiod only a given fraction πe of the remainingreorganization will be carried out. In fact, it isinteresting to note the implications of the extremecase in which πe = 1. In this case all of the “accu-mulated” reorganization will be carried out inthe first period and there will be a large drop inemployment, but after this we will see a continualincrease in aggregate employment as ε2 increases.Hence, a large amount of accumulated reorgani-zation will simply lead to a very large one-timedrop in employment, but will not lead to a delayedturning point for aggregate employment.
To understand the dynamics of the opposingforces, Figure 2 shows the time paths of firing and
8 One could interpret this reduced form as reflecting a log lineariza-tion of the individual demand for labor functions.
Koenders and Rogerson
568 JULY/AUGUST 2005 FEDERAL RESERVE BANK OF ST. LOUIS REVIEW

hiring for each of the three scenarios consideredin Figure 1.9
In all three cases the hiring associated withthe improvement in ε2 is constant over time andequal to 0.1. However, although each economyhas the same fundamentals, the variation of theinitial distribution of µ implies that the time pathof fires associated with successful reorganizationwill be different. As Figure 2 shows, the curvesare effectively parallel shifts of each other, withthe highest value of µ20 associated with the high-est level of firing. Because successful reorganiza-tion takes time, the path of firing is fairly drawnout. The important feature to note is that aggregateemployment will continue to drop as long as thefiring curve lies above the hiring curve. Andbecause a higher value of µ20 raises the firing curvebut leaves the hiring curve unchanged, it illus-trates how restructuring can influence the pointat which aggregate employment begins to increase.
We should emphasize that the dynamics thatwe have just traced out are obviously not defini-
tive predictions of the model. As noted earlier,whether reorganization leads to labor sheddingdepends on parameter values. The main pointwe want to emphasize is that the model suggestsa mechanism that can produce these types ofdynamics.
Firing versus Hiring
The results of the numerical example reportedin the previous section show that aggregateemployment growth is slower because manyorganizations are reducing the size of their work-forces. This finding suggests that slow aggregateemployment growth should be associated withhigh separation rates. In fact, Shimer (2005a,b)argues that the slow aggregate employment growthin the recent recovery is due to a low rate of hiringand not to a high rate of separations, includinglayoffs. In this subsection we discuss how ourmechanism could be made consistent with thisobservation. First note that the curves that welabeled as hires and fires do not actually corre-spond to their counterparts in the data. Rather,these two curves simply reflect two differentforces, one leading to lower employment andone leading to greater employment. If the force
Koenders and Rogerson
FEDERAL RESERVE BANK OF ST. LOUIS REVIEW JULY/AUGUST 2005 569
0 5 10 15 20−0.2
−0.1
0
0.1
0.2
0.3
0.4
0.5
Period
Employment (Deviation from Mean)
2 = 0.30 2 = 0.35 2 = 0.40
µµµ
Figure 1
Effect of Initial Conditions on Employment
0 5 10 15 20
0.06
0.08
0.1
0.12
0.14
0.16
0.18
0.2
Period
Employment
Fires, 2 = 0.30Fires, 2 = 0.35Fires, 2 = 0.40Hires, all cases
µµ
µ
Figure 2
Initial Conditions and Hiring and Firing
9 An organization that successfully reorganizes may, of course,choose to fire fewer than 10 workers and not hire any new workers;so, when measured, hiring and firing in the economy may notreproduce these curves.

leading to lower employment called for a decreaseof ten workers in an organization and the forceleading to higher employment called for anincrease of eight workers in that same organiza-tion, then we would expect this to show up as asituation with zero hires and two separations.
We argue here that a simple extension of ourmodel can potentially explain why it is low hiringrather than high separations that seems to be theproximate cause of the slow employment growth.If an organization finds itself with too many work-ers, but expects that over time these workers willbe needed, then if the workers possess some valu-able organization capital it may be optimal for thefirm to simply keep the workers around and letany decreases in employment occur through attri-tion. This policy could produce a pattern of rela-tively stable separation rates coupled with anextended period of very low hiring rates. Thispossibility would become even more relevant ifthe organizations that grew during the precedingexpansion are also the ones that are expected togrow the most in the near future, because theywould then represent both the organizations withthe most unneeded labor currently and the onesmost expected to expand their labor forces in thenear future.
General Equilibrium Considerations
Although our analysis has considered thedecision problems of only individual organiza-tions and then aggregated holding wage andinterest rates constant, it is worthwhile to discusshow general equilibrium considerations couldpossibly affect the types of outcomes that we areemphasizing. In particular, it is important toemphasize this issue in the context of the litera-ture related to the work of Caballero and Engel(1999) referred to in the introduction. In thatpaper, they argue that changes in the distributionof individual firm state variables is important ininfluencing how the economy responds to shocks.However, the work of Veracierto (2002) andThomas (2002) show that, in general equilibriumversions of the model, the effects of interest ratemovements basically offset the partial equilibriumeffects.
There are two main issues that arise. The first
concerns how changes in prices might impactthe incentives for intertemporal substitution inour decision problem, as represented in our keyanalytic result showing the existence of a reser-vation value of ε2 for the reorganization decision.With constant wages and interest rates, reorgani-zation will be shifted away from periods of higheconomic activity and toward periods of loweconomic activity. If real wages are procyclical,they could generate an opposing force to ourintertemporal substitution. If wages are higher inperiods of high economic activity and shocks arepersistent, then this produces a cost of not reorgan-izing that is procyclical. Simply put, the benefitof shedding labor is greater if wages are higher.
General equilibrium effects could also operatethrough changes in the real interest rate. However,if one views the case of procyclical real interestrates as the case of primary interest, then thiseffect will actually reinforce our result. If currentreal interest rates are high, then current-periodcosts are amplified and future benefits are atten-uated, increasing the incentive to postpone reor-ganization in good times.
One could plausibly argue that some othermargins that we have assumed to be constant overtime would also exhibit variability over the cycle.For example, although we assumed that transitionprobabilities are constant over time, one couldargue that the probability of a small-scale organi-zation becoming successful increases in goodtimes (i.e., that π l is higher in good times). Thisaspect by itself would tend to accentuate theeffects that we have emphasized, because this willlead to a larger buildup of type 2 organizationsduring good times. Similarly, if entry is higher inexpansions, then this aspect will also tend toaccentuate the buildup of type 2 organizations.
A second issue that must be addressed in amore complete model is why the workers that arebeing released due to restructuring do not findemployment somewhere. One possible channelis standard intertemporal substitution effects.When an organization restructures, the shift ofmanagerial time away from production and towardrestructuring leads to a decrease in the marginalproduct of labor. A second channel that is not inour model but could be important is that the organ-
Koenders and Rogerson
570 JULY/AUGUST 2005 FEDERAL RESERVE BANK OF ST. LOUIS REVIEW

izations with the greatest expected increases inemployment in the future may be those that haverecently experienced large increases. If this is true,it could be that the organizations that decide torestructure are the same organizations that willeventually add the most workers. One couldimagine a more detailed model in which an organ-ization does not add to its existing labor force atthe same time that it is trying to reorganize. Hence,the decision to reorganize is implicitly a decisionto postpone new hires. Last, if one were to imbedour model into a model in which it takes time forworkers to move from one organization to another,then a long-lasting increase in separations wouldalso lead to a long-lasting decline in employment.
A CLOSER LOOK AT JOBLESSRECOVERIES
In this section, we argue that the insightsderived from the preceding discussion may berelevant for understanding some features ofbusiness cycle dynamics and that in particularthey may be very relevant for the discussion ofthe phenomenon that has become known as thejobless recovery. As noted in the introduction,many individuals have coined the term “joblessrecovery” to describe the apparent slow growthin employment following the troughs of the twomost recent recessions, in 1991 and 2001. Viewedin a broader perspective, the obvious implicationof such a description is that not all business cyclesare alike, which is an old and recurring theme inthe business cycle literature. Burns and Mitchell(1946) were among the first to systematically meas-ure the business cycle and argued that businesscycles bear a remarkable similarity to each otheralong many dimensions. In particular, they devel-oped the notion of a reference cycle to representthe “typical” business cycle. Influenced by thiswork, Lucas (1977) argued that a key stylized factis that all business cycles are the same from theperspective of qualitative comovement of series.At the same time, there are many instances inwhich researchers have argued that some partic-ular business cycle exhibits properties that distin-guish it from its predecessors, while others have
argued that the business cycle phenomenon isslowly changing over time.10
The discussion of the previous section sug-gested that after the end of a long expansion,employment may take longer to start to increaseonce again. This argument is consistent with thefact that each of the past two recessions has exhib-ited a relatively long period before employmentbegan to increase, because each of the past twoexpansions has been extremely long by historicalstandards. However, there is another episode inthe postwar period that would seem to be relevantand that is the recession of 1969-70, which alsofollowed a very long expansion. If the channelthat we point to is quantitatively important, thenthis period should also have produced a “joblessrecovery.” The goal of this section is to argue thatthe evidence is indeed consistent with this predic-tion. In particular, we will argue that there arethree recessions in the postwar period that standout as distinct from the others in terms of thedynamics for employment in the subsequentrecovery: 1969, 1991, and 2001. The materialpresented here draws on the results presented inKoenders (2005), which provides a much morethorough analysis.
A Review of Schreft and Singh
It is useful to begin with a summary of theanalysis of Schreft and Singh (2003). They carryout the following calculation: They start withseasonally adjusted data for employment from theBureau of Labor Statistics Establishment Surveyand then identify the level of employment at eachof the National Bureau of Economic Research(NBER) turning points that corresponds to theend of a recession. For each recovery, they plotthe percentage change in employment from theturning point that occurs over the subsequent 12months. Figure 3 is equivalent to the figure thatthey produce except that we have included thetwo recessions from the 1950s in our analysis andwe have time-aggregated the employment data toquarterly frequency.
But our Figure 1 tells the same story as Chart 1
10 A related but distinct issue is the extent to which business cycleshave become less frequent.
Koenders and Rogerson
FEDERAL RESERVE BANK OF ST. LOUIS REVIEW JULY/AUGUST 2005 571

in their paper. Whereas the typical recovery showssteadily rising employment, with an increase ofmore than 3 percent in the first year of the recov-ery, the two most recent recessions show employ-ment decreasing in each of the four quartersfollowing the turning point. While this picturecertainly suggests that the two recent recoveriesare different from the average of the precedingones, it obviously does not tell us whether thereare previous episodes that also resemble the tworecent ones. For our purposes we are particularlyinterested in whether the recovery that began in1970 also displays this pattern. Figure 4 repeatsthe analysis of Figure 3 except we now considerthree recoveries individually and compare themwith the average of the remaining five recoveries.(Throughout this analysis we ignore the recoveryin the early 1980s because it was so short-lived.)
This figure suggests that the recovery thatbegan in 1970 is much more similar to the averagerecovery than it is to the recoveries following thetwo most recent recessions. One can repeat thisanalysis for the other recoveries as well, and oneobtains a similar pattern in each case. Based onthis analysis, one would be led to conclude thatit is only the two most recent recoveries that
have had particularly distinctive employmentdynamics.
However, there are several issues we want toraise regarding the Schreft-Singh method ofsummarizing the data. The first issue is that theSchreft-Singh method is not consistent withmodern views of the business cycle. FollowingLucas (1977), modern business cycle analysisviews the business cycle as deviations from aslowly changing trend. Properties of businesscycles should be properties of the component ofthe time series that corresponds to these deviationsfrom trend. The Schreft-Singh method neglectsthis consideration in two important regards. First,some recessions are more severe than others. Tothe extent that recessions are temporary departuresfrom trend, a deeper recession would naturallybe expected to be followed by higher subsequentgrowth in employment. The Schreft-Singh methoddoes not incorporate this feature. Second, theirmethod does not distinguish between movementsin the trend and deviations from the trend. If the(raw) level of employment following the troughof a recession starts to increase, how are we toknow to what extent we are moving closer to trend?If the trend always increased at the same rate,
Koenders and Rogerson
572 JULY/AUGUST 2005 FEDERAL RESERVE BANK OF ST. LOUIS REVIEW
−2 −1 0 1 2 3 40.99
0.995
1
1.005
1.01
1.015
1.02
1.025
1.03
1.035
Quarters Before and After the Trough
Index Number, Trough = 1
20011991Average Cycle
Figure 3
The Schreft-Singh Finding
−2 −1 0 1 2 3 40.99
0.995
1
1.005
1.01
1.015
1.02
1.025
1.03
1.035
Quarters Before and After the Trough
Index Number, Trough = 1
20011991
Average Cycle1970
Figure 4
The 1970 Recovery (Schreft-Singh Method)

this issue would be irrelevant because it wouldaffect all recoveries in the same fashion. However,a key feature of the postwar labor market in theUnited States is that trend employment growthhas fluctuated substantially over time, due bothto the entry of the baby boom into the labor marketand the increased participation of women. Table 1illustrates this point by showing the decadalgrowth rates in employment for the U.S. economyfor the five postwar decades.
Table 1 shows that the differences are large:The decadal growth rate in employment duringthe 1960s is more than one and a half times aslarge as the decadal growth rates in the two mostrecent decades. It follows that sorting out relativemovements in trend and deviation from trend maybe an important consideration in documenting thedifferential pace of employment growth duringrecoveries.
Third, the Schreft-Singh method compares thedynamics of recoveries by examining the behaviorgoing forward from the turning point. It is notclear that the turning point is the appropriatecomparison point across cycles. In particular, ifthe downturns preceding the recoveries have beendifferent, it is not clear that behavior should bethe same from the turning point forward. In fact,we will argue later that our model suggests thatthe turning point should not be used as a commonreference point.
Having raised some issues about the statisticsthat Schreft and Singh report, we now describethe method that we use.
An Alternative Look at the Data
Our method is straightforward and is consis-tent with current practice in business cycle analy-sis in terms of documenting properties of cyclicalfluctuations. In particular, let Xt be a quarterlyseries that is seasonally adjusted for which we
have observations going from period 0 to period N.Define xt to be the log of the series Xt. We define thetrend component of xt, denoted by xT
t, by usingthe Hodrick-Prescott filter. In particular, xT
t is thesolution to the following optimization problem:
Following the literature, for quarterly data we usea value of λ = 1,600.
The cyclical component of xt, denoted by xCt,
is simply the deviation of xt from its trend value:xC
t = xt – xTt . Because the series are measured in
logs, the cyclical component reflects the percentdeviation of the variable from its trend.
Figure 5 repeats the exercise of Schreft andSingh but uses the cyclical component definedpreviously as opposed to the raw data. In partic-ular, this graph shows the percent change in thecyclical component of employment in each of thefour quarters following the NBER turning points.11
This figure tells a similar story to the one toldby Figure 3, though we note that some details aredifferent. In particular, whereas Figure 3 indicatedthat in a typical recovery employment begins togrow as soon as the turning point is reached,Figure 5 displays the well-known feature thatemployment lags gross domestic product (GDP).In particular, this figure shows that in a typicalrecovery, employment begins to increase one quar-ter after GDP begins to increase.12 (We note thatthe cyclical component of GDP defined here hasthe property that the turning point for GDP follow-
minx t t
TtT
tT
tT
tT
tT
x x x x x x{ } + −− + −( ) − −(2
1 1λ )) { }∑=
− 2
1
1
t
N.
Koenders and Rogerson
FEDERAL RESERVE BANK OF ST. LOUIS REVIEW JULY/AUGUST 2005 573
Table 1Employment Growth by Decade (percent)
1950-60 1960-70 1970-80 1980-90 1990-2000
20.89 26.81 23.91 17.85 17.45
11 It is important to note that, whenever one detrends the data, thebehavior of the cyclical component at the very beginning and endof the sample is somewhat sensitive to the initial and terminal datapoints. This implies that the properties of the 2001 recovery maylook somewhat different as more data become available.
12 See, for example, the cyclical properties as reported in Cooleyand Prescott (1991).

ing each recession coincides with the NBER turn-ing point dates.)
Next, we again ask if the recovery that beganin 1970 is similar to the two most recent recover-ies. Figure 6 shows the results of carrying out theexercise analogous to that which generatedFigure 4—that is, we now consider three individ-ual recoveries and compare them with the averageof the other five.
We see that Figure 6 offers a very differentconclusion than does Figure 4. Based on analysisof the cyclical component of the employmentseries, the 1970 recovery also shows that, evenone year after the turning point, employmentremains below its level at the turning point. Whilethis picture still indicates quantitative differencesacross the three recoveries, the qualitative behav-ior is in fact similar.
These figures still suffer from the first problemwe mentioned earlier: They do not take intoaccount that the recessions vary quite substantiallyin their severity, and hence we do not know howmuch of the variation in growth simply reflectsdifferences in distances from trend. There aremany ways that we might normalize businesscycles to account for the differing magnitudes.
We employ a simple procedure here, which is tonormalize by the magnitude of the recession asmeasured by the maximum percent deviation ofoutput below trend. We then scale all of theemployment deviations by dividing through bythe absolute value of this number. This calculationis shown in Figure 7.
Qualitatively this figure presents the sameconclusions as the earlier figure, but we note thatit does affect the quantitative differences acrossepisodes.
One way to summarize the properties of thefigures is in terms of the extent to which theturning point for employment lags the turningpoint for GDP. Table 2 shows the values for eachof the post-1950 recessions.
This statistic confirms a property that we sawin the figures presented earlier: Whereas a lag of0 or 1 quarter is typical for the postwar period,there are three recoveries in which the lag islonger, and all three of these are recoveries fromrecessions that follow long expansions. This evi-dence supports our earlier claim about character-izing postwar recoveries. At the same time, Table 2suggests that there is quite a significant differencebetween the 1970 recovery and the two most
Koenders and Rogerson
574 JULY/AUGUST 2005 FEDERAL RESERVE BANK OF ST. LOUIS REVIEW
0 0.5 1 1.5 2 2.5 3 3.5 4−2
−1.5
−1
−0.5
0
0.5
1
1.5
Quarters Since Turning Point
% Change in E (Cyclical Component)
Others19912001
Figure 5
The 1991 and 2001 Recoveries (Detrended)
0 0.5 1 1.5 2 2.5 3 3.5 4−2
−1.5
−1
−0.5
0
0.5
1
1.5
2
Quarters Since Turning Point
% Change in E (Cyclical Component)
Others197019912001
Figure 6
Recoveries of 1970, 1991, and 2001 (Detrended)

recent recoveries. The lags in the two most recentrecoveries are in fact much longer than was expe-rienced in the 1970 recovery. In particular, if weextend the analysis from the four quarters follow-ing the turning point to seven quarters, then weobtain Figure 8.
Figure 8 would seem to suggest that the 1970episode is not so similar to the two most recentones. What we argue next, however, is that thisdifference is illusory. In particular, we argue thatit is driven by the choice of initial point and that,when this initial point is chosen in a way that webelieve is more consistent with the theory laid outearlier in the paper, the differences disappear.
To understand the issue, consider the discus-sion from the previous section. The key point therewas that the time before employment begins to
increase is tied to the time required for reorgani-zation to diminish sufficiently. The key point totake away from this analysis is that the turningpoint is not the point at which reorganizationbegins. Presumably reorganization starts to takeplace at some point during the recession preced-ing the recovery. This possibility is significantbecause the duration of the recession precedingthe turning point differs significantly across reces-sions. In particular, this period is either averageor below average for the two most recent reces-sions and is much above average for the 1969-70recession.
To implement this element, we need to havea method for picking out at what point reorgani-zation begins. One possibility would be that itbegins when the downturn first begins. However,
Koenders and Rogerson
FEDERAL RESERVE BANK OF ST. LOUIS REVIEW JULY/AUGUST 2005 575
0 0.5 1 1.5 2 2.5 3 3.5 4−1.2
−1
−0.8
−0.6
−0.4
−0.2
0
0.2
0.4
0.6% Change in E (Normalized Cyclical Component)
Others197019912001
Quarters Since Turning Point
Figure 7
Cyclical Employment, Normalized byMagnitude of Trough
0 1 2 3 4 5 6−2
−1.5
−1
−0.5
0
0.5
1
Quarters Since Turning Point
% Change in E (Cyclical Component)
197019912001
Figure 8
Comparing the 1970, 1991, and 2001Recoveries
Table 2Lag in Employment Turning Point Relative to GDP (quarters)
1954 1958 1961 1970 1975 1982 1991 2001
1 0 1 3 1 1 6 7

when a recession first begins, output is still quitehigh above trend and the analytic result that weproved earlier in the paper suggested that it isthe level of output that is particularly important.With this in mind, we identify the point at whichreorganization begins to be the first quarter inwhich the cyclical component of output lies belowtrend. This choice is obviously ad hoc, so theanalysis that follows should really be interpretedas illustrating the potential importance of this typeof correction. Table 3 shows, with the data, howmany quarters this occurs prior to the NBER turn-ing point for each of the eight recessions.
Table 3 indicates that the typical number ofquarters that GDP is below trend prior to reachingits turning point is two, but that in 1970 this valuewas four, and in 1991 it was only one.
What we do next is to repeat our earlier analy-
sis, but instead of using the turning point as theinitial condition for each recession, we use theperiod as indicated in Table 3. Once again wecontinue to normalize using the magnitude of thedrop in GDP as our scale factor. Figure 9 showsthe average of the five “typical” recessions versuseach of the three more prolonged recoveries.
It shows that the three recessions all stand outas different from the average of the others.
To this point we have focused on employmentdynamics. Employment is simply one dimensionalong which labor input can vary. An importantissue is the extent to which different behavior ofemployment across cyclical episodes also repre-sents differences in labor input. Alternatively, itcould be that the dominant difference acrossepisodes is the compositional changes in laborinput. More generally, one should also be con-
Koenders and Rogerson
576 JULY/AUGUST 2005 FEDERAL RESERVE BANK OF ST. LOUIS REVIEW
Table 3Quarters Before Turning Point with GDP Below Trend
1954 1958 1961 1970 1975 1982 1991 2001
2 2 2 4 2 4 1 2
0 1 2 3 4 5 6 7−1.5
−1
−0.5
0
0.5
1
Quarters Since GDP Below Trend
Employment (Normalized Cyclical Component)
197019912001Others
Figure 9
Recoveries with Alternative Initial Point
0 1 2 3 4 5 6
−1.5
−1
−0.5
0
0.5
1
Quarters Since GDP Below Trend
Aggregate Hours (Normalized Cyclical Component)
1970199120011975-1982 Average
−2
Figure 10
Behavior of Aggregate Hours

cerned about measuring effective labor inputrather than simply bodies or hours. We leave amore careful analysis of these issues for futurework, but do want to present at least one piece ofevidence to suggest that the differences in thebehavior of employment that we have noted alsoextend to the behavior of aggregate hours. We havehours data only from 1964 on, so this analysis hasonly five cyclical episodes to compare. Figure 10compares the three recoveries that we have focusedon with the average of the other two recoveries.Period 0 in this figure refers to the first period inwhich GDP drops below trend prior to the asso-ciated recovery.
While the basic pattern in this figure is quali-tatively similar to the one found in our graphs foremployment, it is also true that the differencesare much smaller in this graph than in the employ-ment graphs. We infer from this that a more care-ful study of the behavior of labor input along theintensive and extensive margins is warranted.
Last, it is of interest to examine the behaviorof productivity across the cyclical episodes. Ourmodel predicts that when organizations switchfrom producing to reorganizing they experience
a decrease in productivity. However, as timepasses and successful reorganization occurs, weshould see increases in productivity. Having saidthis, we also feel that a large degree of cautionneed be taken with respect to assessing the impli-cations for productivity. We have implicitlyassumed that aggregate fluctuations in our modelare driven by shocks to the demand for the outputof each organization. While this is a convenientformulation for our analysis, it could be that theincrease in demand is driven by improvementsin product quality, which in a more completemodel would also show up as productivitychanges.
Having offered this caveat, we now turn toanalyze the dynamics of productivity. Becausehours data are available only since 1964, we usetwo different measures of productivity. First wecompare output per worker to be able to use alleight recessions and then use output per hour tocompare the five most recent recessions. Figure 11shows how productivity per worker evolves in thethree recoveries of interest.
Note that in all cases productivity drops inthe initial period but then increases thereafter.
Koenders and Rogerson
FEDERAL RESERVE BANK OF ST. LOUIS REVIEW JULY/AUGUST 2005 577
0 1 2 3 4 5 6−1.4
−1.2
−1
−0.8
−0.6
−0.4
−0.2
0
0.2
0.4
0.6GDP Per Employee (Normalized Cyclical Component)
197019912001
Quarters Since GDP Below Trend
Figure 11
Productivity per Employee in the 1970, 1991,and 2001 Recoveries
0 1 2 3 4 5 6−0.4
−0.2
0
0.2
0.4
0.6
0.8
1
Quarters Since GDP Below Trend
GDP per Employee (Normalized Cyclical Component)
1954−1958−1961−1975−1982 Average1970−1991−2001 Average
Figure 12
Comparison of Productivity per EmployeeAcross Recoveries

While the magnitudes are somewhat differentacross the three episodes, the pattern is quite simi-lar. At a very qualitative level this pattern seemsto accord well with the implications of our modeldescribed previously. Next we consider how pro-ductivity changes vary across the different typesof recoveries. Figure 12 compares the average ofthese three recoveries with the average across theother five recoveries.
Both curves show the same qualitative behav-ior. The average of the three recoveries followinglong expansions does indeed have a slightly largerdrop in the initial period and does show somewhathigher subsequent growth. Qualitatively, thesepatterns are consistent with what one wouldexpect from our model, though the quantitativedifferences do not seem that large.
Next we compare the behavior of productivityper hour for the post-1964 recoveries.
Figure 13 shows the same two features: Thethree recoveries associated with recession follow-ing long expansions have a somewhat larger initialdrop in productivity and subsequently experiencesomewhat higher growth.
CONCLUSIONWe have highlighted a simple economic
mechanism that we argue may be relevant forunderstanding the different behavior of labormarket aggregates across business cycles. Themodel stresses two key effects. First, it argues thatinternal organizational dynamics are affected byaggregate shocks. Second, it stresses that the situa-tions of organizations affect the manner in whichthe economy responds to aggregate shocks. Inperiods of high economic activity, organizationspostpone structural changes to take advantage ofcurrent opportunities. But once an organizationbegins the process of restructuring, it is less likelyto hire workers and more likely to release workers.These effects suggest the possibility that longexpansions will be followed by recoveries inwhich employment starts to increase much laterthan output.
We then assess this link by studying eight U.S.recessions in the post-1950 period. We argue thatall three recoveries from recessions that followedlong expansions exhibit the pattern of a long delayin the turning point for aggregate employment.This finding contrasts sharply with the characteri-zation that it is the two most recent recoveriesthat are distinct.
While we think this work is suggestive, wemust also emphasize that it is indeed only sug-gestive. A more rigorous quantitative assessmentof the economic mechanism is called for, as is amore thorough analysis of the data.
REFERENCESAaronson, Daniel; Rissman, Ellen R. and Sullivan,
Daniel G. “Further Evidence on Sectoral Reallocationand the Jobless Recovery. “ Unpublished manuscript,Federal Reserve Bank of Chicago, 2004.
Andolfatto, David and MacDonald, Glenn M. “JoblessRecoveries.” Working paper, 2004.
Bertschek, Irene and Kaiser, Ulich. “ProductivityEffects of Organizational Change: MicroeconometricEvidence.” Unpublished manuscript, 2001.
Burns, Arthur F. and Mitchell, Wesley C. Measuring
Koenders and Rogerson
578 JULY/AUGUST 2005 FEDERAL RESERVE BANK OF ST. LOUIS REVIEW
0 1 2 3 4 5 6−0.8
−0.6
−0.4
−0.2
0
0.2
0.4
0.6
Quarters Since GDP Below Trend
GDP per Hour (Normalized Cyclical Component)
1970−1991−2001 Average1975−1982 Average
Figure 13
Comparison of Productivity per Hour Across Recoveries

Business Cycles. New York: National Bureau ofEconomic Research, 1946.
Caballero, Richard and Engel, Eduardo. “ExplainingInvestment Dynamics in U.S. Manufacturing: AGeneralized (S,s) Approach.” Econometrica, July1999, 67(4), pp. 783-826.
Cole, Harold L. and Ohanian, Lee E. “New DealPolicies and the Persistence of the Great Depression:A General Equilibrium Analysis.” Journal of PoliticalEconomy, August 2004, 112(4), pp. 779-816.
Cooley, Thomas F. and Prescott, Edward C. “EconomicGrowth and Business Cycles,” in Thomas F. Cooley,ed., Frontiers of Business Cycle Research. Princeton,NJ: Princeton University Press, 1991, pp. 1-38.
Groshen, Erica L. and Potter, Simon M. “Has StructuralChange Contributed to a Jobless Recovery?” FederalReserve Bank of New York Current Issues inEconomics and Finance, August 2003, 9(8).
Hall, Robert E. “Labor Demand, Labor Supply andEmployment Volatility,” in Olivier Blanchard andStanley Fischer, eds., NBER MacroeconomicsAnnual 1991. Cambridge, MA: MIT Press, 1991,pp. 17-61.
Hopenhayn, Hugo A. “Entry, Exit and Firm Dynamicsin the Long Run.” Econometrica, September 1992,60(5), pp. 1127-50.
Hopenhayn, Hugo A. and Rogerson, Richard. “JobTurnover and Policy Evaluation: A GeneralEquilibrium Analysis.” Journal of Political Economy,October 1993, 101(5), pp. 915-38.
Kliesen, Kevin L. “The 2001 Recession: How Was ItDifferent and What Development May Have CausedIt?” Federal Reserve Bank of St. Louis Review,September/October 2003, 85(5), pp. 23-38.
Koenders, Kathryn. “Long Expansions and SlowRecoveries: A Closer Look at EmploymentFluctuations.” Unpublished manuscript, ArizonaState University, 2005.
Krusell, Per and Smith, Anthony A. “Income andWealth Heterogeneity in the Macroeconomy.”Journal of Political Economy, October 1998, 106(5),pp. 867-96.
Lilien, David M. “Sectoral Shifts and CyclicalUnemployment.” Journal of Political Economy,August 1982, 90(4), pp. 777-93.
Lucas, Robert E. Jr. “Understanding Business Cycles.”Carnegie-Rochester Series on Public Policy, 1977,5, pp. 7-29.
Lucas, Robert E. Jr. “On the Size Distribution ofBusiness Firm.” Bell Journal of Economics, Autumn1978, 9(2), pp. 508-23.
Schreft, Stacey L. and Singh, Aarti. “A Closer Lookat Jobless Recoveries.” Federal Reserve Bank ofKansas City Economic Review, Second Quarter2003, 88(2), pp. 45-73.
Shimer, Robert. “The Cyclicality of Hires, Separations,and Job-to-Job Transitions.” Federal Reserve Bankof St. Louis Review, July/August 2005a, 87(4), pp.493-507.
Shimer, Robert. “Reassessing the Ins and Outs ofUnemployment.” Working paper, 2005b.
Thomas, Julia J. “Is Lumpy Investment Relevant forthe Business Cycle?” Journal of Political Economy,June 2002, 110(3), pp. 508-34.
van Rens, Thijs. “Organizational Capital andEmployment Fluctuations.” Job Market Paper,Princeton University, 2004.
Veracierto, Marcelo L. “Plant Level IrreversibleInvestment and the Business Cycle.” AmericanEconomic Review, March 2002, 92(1), pp. 181-97.
Koenders and Rogerson
FEDERAL RESERVE BANK OF ST. LOUIS REVIEW JULY/AUGUST 2005 579

580 JULY/AUGUST 2005 FEDERAL RESERVE BANK OF ST. LOUIS REVIEW