Embed Size (px)
Citation preview
رارــــــــــــــإق أنا الموقع أدناه مقدم الرسالة التي تحمل العنوان:
Organizational diagnosis of universities in the Gaza Strip Based on the Six Box Model
(A comparative study)
ت اإلشارة إليو نتاج جيدي الخاص، باستثناء ما تم ىوأقر بأن ما اشتممت عميو ىذه الرسالة إنما ن ىذه الرسالة ككل أو أي جزء منيا لم يقدم من قبل لنيل درجة أو لقب عممي أو حيثما ورد، وا
بحثي لدى أي مؤسسة تعميمية أو بحثية أخرى.
DECLARATION The work provided in this thesis, unless otherwise referenced, is the researcher's own work, and has not been submitted elsewhere for any other degree or qualification
:Student's name صابر موسى عميان :/ةاسم الطالب :Signature صابر التوقيع: :Date 2016/ 01/ 04 التاريخ:
Organizational diagnosis of universities in the Gaza Strip
Based on the Six Box Model
)A comparative study (
By
Saber M. M. Alian
Supervised
Professor Yousif H. Ashour
A Thesis Submitted in Partial Fulfillment of the Requirements for the Degree of MBA
October 2015
The Islamic University- Gaza
Deanship of Graduate Studies
Faculty of Commerce
Business Administration Department

i
بسم هللا الرحمن الرحيم
الِعْلمِ َوأهْولهو َواْلَمالِئَكةه ههوَ ِإلّ ِإَلهَ َل َأّنهه َللّاه َشِهدَ ﴿﴾ الَحِكيمه الَعِزيزه ههوَ ِإلّ ِإَلهَ َل ِباْلِقْسطِ َقاِئًما
صدق هللا العظيم
"18آل عمران: اآلية "سورة
1
1
1
1

ii
Abstract
This research aimed to measure the ability of the universities in Gaza Strip to achieve their
goals based use one of an organizational diagnosis models, this model is a Weisbord six-box
model, which works on the diagnosis of six variables in the organization, (purpose, structure,
relationships, leadership, rewards, and helpful mechanism’s). This research targeted three
universities (Islamic University,Al-Azhar and Al-Aqsa university.
A questionnaire was used as a data collection tool. The research sample was (302) of the three
universities employees (administrative, academic and academic with administrative position).
The results showed that there is a significant relationship between the ability of the universities
in Gaza Strip to achieve their goals and the six independent variables; (purpose, structure,
relationships, leadership, rewards, and helpful mechanism’s) at level of significance α ≤ 0.05.
The research recommended that the universities of Gaza should adopt the organizational
diagnosis strategy periodically to identify organizational problems and solve them. In order to
reach their goals, and functional training programs for employees to develop their personal
skills, and importance of independence of universities and away from the Palestinian political
conflict.

iii
ملخص الدراسة
هذه الدراسة هدفت إلى قياس مدى قدرة الجامعات الفلسطينية في قطاع غزة على تحقيق أهدافها من خالل إستخدام أحد
نماذج التشخيص التنظيمي وهو نموذج الصناديق الستة، حيث يعمل هذا النموذج على تشخيص ستة متغيرات في
، واستهدفت الدراسة ثالثة جامعات الغرض، الهيكل، العالقات، القيادة، العوائد، واإلجراءات المساعدة(المنظمة وهي )
(.مة، وجامعة األقصى كجامعة حكومية)الجامعة اإلسالمية وجامعة األزهر كجامعات عا
موظفي الجامعات الثالثة ( من 302) الدراسة يتكون من عينةفي البحث الستبانة كأداة لجمع البيانات، وكان تاستخدم
.مناصب إدارية، وتم توزيعها وتحليلها باستخدام برنامج التحليل اإلحصائي فيما بين إداري وأكاديمي وأكاديمين
المتغيرات ذات دللة إحصائية بين قدرة الجامعات على تحقيق أهدافها وبينعالقة ناكھوتوضح نتائج التحليل أن
α.=0.05العالقات، القيادة، العوائد، واإلجراءات المساعدة( عند مستوى دللة الغرض، الهيكل،) مھالخمسة و
وأوصت الدراسة الجامعات في غزة بتطبيق استراتيجية التشخيص التنظيمي بشكل دوري لمعرفة المشاكل التنظيمية
دف تطوير مهاراتهم وحلها، كي تكون قادرة على تحقيق أهدافها، باإلضافة إلى دعم برامج التدريب للموظفين به
بعادها عن الصراع السياسي الفلسطيني. الشخصية والوظيفية، وأهمية استقاللية الجامعات وا
iv
DEDICATION
I dedicate this research to my homeland. To the people who die, who
get injured for the sake of their home.
I dedicate it to my parents who are supporting me to reach this level.
I dedicate it to my beloved wife and my little child “Osama”.
To my sisters and brothers, to my family.
To my Father in law and Mother in law Dr. Eyad and Eng. Heyam
Eltayeb
To my friends who accompanied me.
Praying to Allah to help and to guide me in the world and the
Hereafter
Researcher
Saber M. Alian

v
ACKNOWLEDGMENTS
It is a great pleasure, a privilege, an honor, a source of much
personal satisfaction, to introduce my research.
Before I say anything more, I want to thank Allah who reconcile
me to completion this research,
I would like to thank my Prof. Dr. Youssef Ashour who supported
me, from the first step in this research. He gave me all the
information I need, and gave me his recommendations.
None of this would have been possible, had it not been for many,
many friends and colleagues, Prof. Dr. Sami Abu Al Ross and Dr
Nehaya El Telbani who accepted to discuss this research; also Mr.
Ali Sonallah for his helping in the statistical analysis, and Mrs.
Salsabeel Zeineddin, Mrs. Nour Eltayeb for helping me in
translation.
I must also thank the Islamic University, Al-Azhar University,
Al-Aqsa University who were on full cooperation with me. They
facilitate my mission to completion the research. And thanks also
for its employees who helped me to collect the necessary data.
Last, but by no means least, I must gratefully acknowledge the
generous support of my family, especially my parents, my wife,
my sisters, brothers and all my relatives.

vi
List of content
Item Page
Holy Quran Verse i
Abstract ii
Arabic Abstract iii
Dedication iv
Acknowledgement v
List of Contents vi
List of Tables viii
List of Figures x
List of Appendices x
Abbreviations xi
List of terms xi
CHAPTER 1: General Framework
1.1 Introduction 2
1.2 Research Problem 3
1.3 Research Question 4
1.4 Research Variables 5
1.5 Research Hypotheses 6
1.6 Research Objectives 6
1.7 Research Importance 7
1.8 Previous Studies 8
CHAPTER 2: Literature Review
2.1 Introduction 18
2.2 View of universities in Gaza strip 19
2.3 Definitions and concepts of organizational diagnosis. 21
2.4 The role and Purpose of organizational diagnosis 23
2.5 Organizational diagnosis and organizational analysis 25
2.6 Organizational Diagnostic Models 26
2.7 The Weisbord Six-Box Model 32
CHAPTER 3 : Research Methodology
3.1 Introduction 38
3.2 Research Methodology 38
3.3 Research Method 38
3.4 Data Sources 38
3.5 Research Population & Sample 38
3.6 Questionnaire Design and Content 40
3.7 Data Measurement 40
3.8 Research Procedure 41
3.9 Test of Normality 41
3.10 Statistical analysis Tools 42
3.11 Validity of Questionnaire 43
3.12 Internal Validity 43
vii
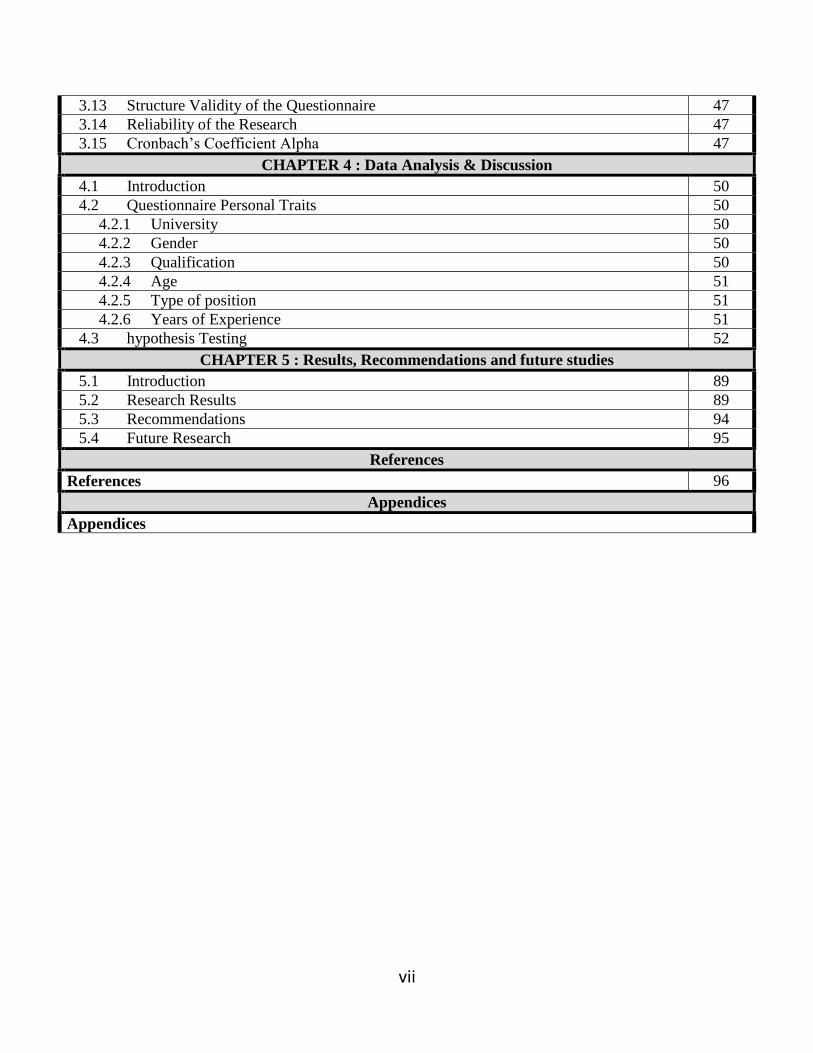
3.13 Structure Validity of the Questionnaire 47
3.14 Reliability of the Research 47
3.15 Cronbach’s Coefficient Alpha 47
CHAPTER 4 : Data Analysis & Discussion
4.1 Introduction 50
4.2 Questionnaire Personal Traits 50
4.2.1 University 50
4.2.2 Gender 50
4.2.3 Qualification 50
4.2.4 Age 51
4.2.5 Type of position 51
4.2.6 Years of Experience 51
4.3 hypothesis Testing 52
CHAPTER 5 : Results, Recommendations and future studies
5.1 Introduction 89
5.2 Research Results 89
5.3 Recommendations 94
5.4 Future Research 95
References
References 96
Appendices
Appendices

viii
List of tables
Table
No. Table Name
Page
No.
(2.1) Distribution of students in higher education institutions in Gaza Strip for the academic year
2015/2014 21
(2.2) comparison of various models that are common models used for diagnostic purposes 30
(2.3) The Weisbord Diagnostic matrix 36
)3.1( Distribution of Research population in universities according to the type of position 39
)3.2( Distribution of Research sample in universities according to the type of position 39
)3.3( Kolmogorov-Smirnov test 42
)3.4( Correlation coefficient of each paragraph of " Purpose " and the total of this field 43
)3.5( Correlation coefficient of each paragraph of " Structure " and the total of this field 44
)3.6( Correlation coefficient of each paragraph of " Leadership" and the total of this field 44
)3.7( Correlation coefficient of each paragraph of " Relationships " and the total of this field 45
)3.8( Correlation coefficient of each paragraph of " Reward " and the total of this field 45
)3.9( Correlation coefficient of each paragraph of " Helpful Mechanisms " and the total of this
field 46
)3.10( Correlation coefficient of each paragraph of " Attitude to change " and the total of this
field 46
)3.11( Correlation coefficient of each field and the whole of questionnaire 47
)3.12( Cronbach's Alpha for each field of the questionnaire 48
(4.1) Illustrates Population Distribution According to university 50
(4.2) Illustrates Population Distribution According to Gender 50
(4.3) Illustrates Population Distribution According to qualification 51
(4.4) Illustrates Population Distribution According to age 51
(4.5) Illustrates Population Distribution According to type of position 51
(4.6) Illustrates Population Distribution According to years of experience 52
)4.7( Means and Test values for “purpose” for all university 53

ix
)4.8( Means and Test values for “purpose” for Islamic university 54
)4.9( Means and Test values for “purpose” for Al Azhar University 55
)4.10( Means and Test values for “purpose” for Al Aqsa University 56
)4.11( Means and Test values for “Structure” for all university 57
)4.12( Means and Test values for “Structure” for Islamic university 58
)4.13( Means and Test values for “Structure” for Al Azhar university 59
)4.14( Means and Test values for “Structure” for Al Aqsa University 60
)4.15( Means and Test values for “Leadership” for all university 61
)4.16( Means and Test values for “Leadership” for Islamic university 62
)4.17( Means and Test values for “Leadership” for Al Azhar university 63
)4.18( Means and Test values for “Leadership” for Al Aqsa University 64
)4.19( Means and Test values for “Relationships” for all university 65
)4.20( Means and Test values for “Relationships” for Islamic university 66
)4.21( Means and Test values for “Relationships” for Al Azhar University 67
)4.22( Means and Test values for “Relationships” for Al Aqsa university 68
)4.23( Means and Test values for “Reward” for all university 69
)4.24( Means and Test values for “Reward” for Islamic university 70
)4.25( Means and Test values for “Reward” for Al Azhar University 71
)4.26( Means and Test values for “Reward” for Al Aqsa university 72
)4.27( Means and Test values for “Helpful Mechanisms” for all university 73
)4.28( Means and Test values for “Helpful Mechanisms” for Islamic university 74
)4.29( Means and Test values for “Helpful Mechanisms” for Al Azhar University 75
)4.30( Means and Test values for “Helpful Mechanisms” for Al Aqsa University 76
)4.31( Means and Test values for “Attitude to change” for all university 77
)4.32( Means and Test values for “Attitude to change” for Islamic university 78
)4.33( Means and Test values for “Attitude to change” for Al Azhar university 79

x
)4.34( Means and Test values for “Attitude to change” for Al Aqsa university 80
)4.35( ANOVA test of the fields and their p-values for university 81
)4.36( Independent Samples T-test of the fields and their p-values for gender 82
)4.37( ANOVA test of the fields and their p-values for Qualification 83
)4.38( ANOVA test of the fields and their p-values for age 84
)4.39( ANOVA test of the fields and their p-values for job title 85
)4.40( ANOVA test of the fields and their p-values for years of experience 86
List of Figures
Figures
No. Figures Name
Page
No.
(1.1) Research Variables 5
(2.1) Six-box Model (Weisbord, 1978) 32
List of Appendices
App.
No. Appendix Name
Page
No.
A Questionnaire (English Version) b
B List of Referees (English) g
C Questionnaire (Arabic Version) i
D List of Referees (Arabic) n

xi
ABBREVIATIONS
Abbreviation Description
CMMI Capability Maturity Model Integration Model
ISO International Standards Organization Model
IUG Islamic University of Gaza
JDI Job Descriptive Index
KMO (Kaiser-Mayer-Olkin) Test
NGO Non-Governmental Organization
OD Organizational Development
ODQ Organizational Diagnosis Questionnaire
P.H.D Doctor of Philosophy Degree
ROI Return On Investment
SPSS Statistical Package for The Social Sciences
UNRWA United Nations Relief and Works Agency
List of terms
terms Definitions
organizational
diagnosis
A process that helps organizations to enhance their capacity to
assess and change dysfunctional aspects of their culture and
patterns of behavior as a basis for developing greater
effectiveness and ensuring continuous improvement, and is an
effective ways of looking at an organization to determine gaps
between current and desired performance and how it can achieve
its goals. (Beer and Spector,1993)
Organizational
diagnostic model
A representation, usually metaphorically, of an organization, It
is a conceptual framework that people use to understand
organizations. They describe the relationships among different
features of the organization, as well as its context and
effectiveness, hence point out what areas to examine and what
questions to ask in assessing how an organization is functioning. (Cummings and Worley, 2005).
1
Chapter 1 Research Framework
Chapter Outline:
1.1 Introduction
1.2 Research Problem
1.3 Research Question
1.4 Research Variables
1.5 The Hypotheses
1.6 Research Objectives
1.7 Research Importance
1.8 Previous Studies

2
1.1 Introduction
Organizations are continually searching for innovative ways of enhancing competitiveness, as
evolving external forces, such as changing demographics, globalization and technology,
require managers to rapidly rethink and retool their organizational management strategies
(Whitfield and Landeros, 2006). Renewed attention to servicing customers, quality,
innovation, constituency management, and speed and efficiency of operations has stimulated
organizations to restructure, reengineer, redesign and retrain (Beckhard and Pritchard, 1992).
In a world of increasing stakeholder expectations and decreasing resources, aggressive cost
cutting programs have run their course. Where do you turn next? Studies have shown that 85%
or more of the root causes of performance problems are in the organizational structures,
systems, and culture within which people work – put good people in bad systems and you get
poor performance. But trying to improve organizational performance by reorganizing,
changing leadership or instituting new training and development programs creates change, but
when done without a rigorous diagnosis of an organization’s structures, systems, and culture,
managers often solve one problem and unintentionally create others. (Breckenridge Institute®,
2011).
While Competing or conflicting groups must tend to teamwork methods. In order to make all
these developments occur and maintain organizations must plan and organize efforts to
achieve the desired change which means that we need regular development program.
Perhaps one of the most important community institutions are universities, where reliable in
the formation of functional competencies whether public or private, which will work on the
upswing, and highlights the role of universities in the Palestinian society under siege imposed
on the Gaza Strip, through the operating or education, where hundreds of workers and
administrators and academics in addition to thousands of students each year, where in Gaza
Strip there is 28 higher education institution which is divided into faculties medium and the
Polytechnic, it has been offering for the study in universities and colleges.
Organizational diagnosis highlights the risk of inaction giving aid to managers in identifying
the most appropriate actions to respond to turbulent business environment.

3
Thus, The primary purpose of an organizational diagnosis is
a) Discover the attitudes and perceptions of employees in the organization. Responses to
interviews or questionnaires are often interpreted and aggregated to determine, as a
whole, the salient concerns of the employees. For example, employees may complain
more often about pay and benefits than any other area, followed by concerns about
communication within the firm. The change practitioner often develops a plan based on
a prioritized list of these concerns (Harrison & Shirom, 1999).
b) Comprehending the existing social and functional reality of an organization. Correctly
diagnosing organizational issues is also a key facet of action research, as the success of
any intervention is dependent on accurately diagnosing the issues that are important to
the organization (Styhre & Sundgren, 2005).
The Six Box Model is based on two main premises. The first premise refers to formal versus
informal systems. Formal systems are those policies and procedures the organization claims to
do. In contrast, informal systems are those behaviors which actually occur. The larger the gap
between the formal and informal dimensions within the organization, the less effective the
organization is. The second premise concerns the fit between the organization and the
environment, that is, the discrepancy between the existing organization (what is) and the way
the organization should function to meet external demands (what ought to be). External
demands being defined as customers, government, and unions. (Burke as cited in Howard,
1994).
The importance of this model is to diagnosis six items: purpose, structure, relationship,
leadership, rewards, and helpful mechanism.
1.2 Research Problem
According to the statistics in the Statistical Yearbook of public education and higher education
in Gaza provinces 2014/2015, which published in February 2015 by Ministry of Education and
Higher Education, it is clear that 144070 of the population of Gaza Strip are enrolled in higher
education institutions, which representing 8.18% of the population of the Gaza Strip
(1,760,037) according to the Palestinian Central Bureau of Statistics report which released in

4
2014. This percentage is an important factor in institutions of higher education role to progress
the society, promote it, and towards its economic growth, The higher education institutions are
facing a big problem which is the blockade imposed on the Gaza Strip. This makes its
development slow in both material or human resources, affect its performance and stand as an
obstacle achieving its objectives. Through this research, we will diagnose these institutions
organizationally and put solutions to the problem they face.
1.3 Research Question
The research will measure the ability of universities in the Gaza Strip to achieve its objectives
Hence, the research question is: Are the universities under investigation able to achieve their
objectives?
The research main question is divided into sub-questions to oversee the steps to achieve a
similar answer to the research question.
The research sub questions are:
a) What is the role of purpose in achieving the objectives of the universities
under investigation?
b) What is the role of structure in achieving the objectives of the universities
under investigation?
c) What is the role of relationships in achieving the objectives of the
universities under investigation?
d) What is the role of rewards in achieving the objectives of the universities
under investigation?
e) What is the role of leaderships in achieving the objectives of the universities
under investigation?
f) What is the role of helpful mechanisms in achieving the objectives of the
universities under investigation?
g) What is the role of attitude to change mechanisms in achieving the
objectives of the universities under investigation?

5
h) What is the role of gender in achieving the objectives of the universities
under investigation?
i) What is the role of qualification in achieving the objectives of the universities
under investigation?
j) What is the role of age in achieving the objectives of the universities under
investigation?
k) What is the role of type of position in achieving the objectives of the
universities under investigation?
l) What is the role of type of university in achieving the objectives of the
universities under investigation?
m) What is the role of years of experience in achieving the objectives of the
universities under investigation?
n) What recommendations can be offered to the researchers and decision makers
on how to improve organizational performance?
1.4 Research Variables
Diagnosis of universities by Weisbord six box model must therefore take into account a
variety of internal and external variables and how they influence each other, and this model,
also, pictures the balance of the weight of formal and informal elements of the organization. In
short, the model focuses on internal variables of the organization and reaches an agreement
between what the organizations ought to be and what it is.
The Independent
Variables
The dependent variables
Purposes
Structure
The Ability of organization
to achieve its objectives
Relationships
Rewards
Leadership
Helpful Mechanisms
Figure 1.1. Research Variables
6
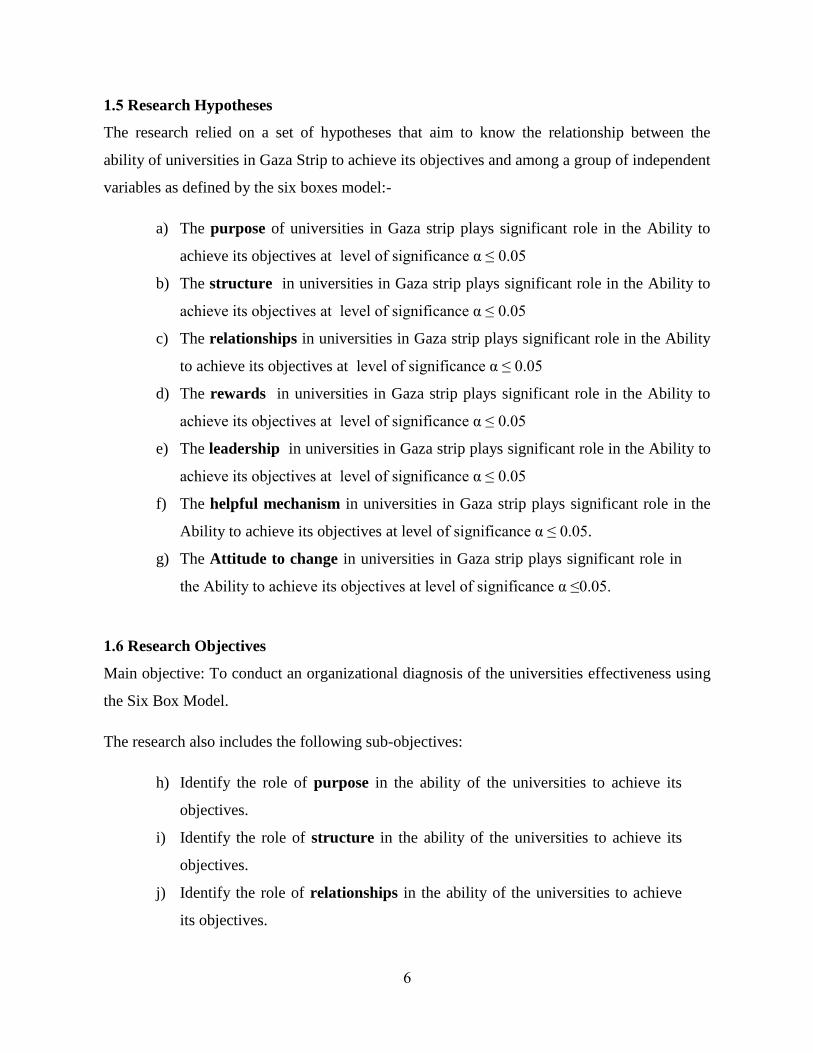
1.5 Research Hypotheses
The research relied on a set of hypotheses that aim to know the relationship between the
ability of universities in Gaza Strip to achieve its objectives and among a group of independent
variables as defined by the six boxes model:-
a) The purpose of universities in Gaza strip plays significant role in the Ability to
achieve its objectives at level of significance α ≤ 0.05
b) The structure in universities in Gaza strip plays significant role in the Ability to
achieve its objectives at level of significance α ≤ 0.05
c) The relationships in universities in Gaza strip plays significant role in the Ability
to achieve its objectives at level of significance α ≤ 0.05
d) The rewards in universities in Gaza strip plays significant role in the Ability to
achieve its objectives at level of significance α ≤ 0.05
e) The leadership in universities in Gaza strip plays significant role in the Ability to
achieve its objectives at level of significance α ≤ 0.05
f) The helpful mechanism in universities in Gaza strip plays significant role in the
Ability to achieve its objectives at level of significance α ≤ 0.05.
g) The Attitude to change in universities in Gaza strip plays significant role in
the Ability to achieve its objectives at level of significance α ≤0.05.
1.6 Research Objectives
Main objective: To conduct an organizational diagnosis of the universities effectiveness using
the Six Box Model.
The research also includes the following sub-objectives:
h) Identify the role of purpose in the ability of the universities to achieve its
objectives.
i) Identify the role of structure in the ability of the universities to achieve its
objectives.
j) Identify the role of relationships in the ability of the universities to achieve
its objectives.

7
k) Identify the role of rewards in the ability of the universities to achieve its
objectives.
l) Identify the role of leadership in the ability of the universities to achieve its
objectives.
m) Identify the role of helpful mechanism in the ability of the universities to
achieve its objectives.
n) Identify the role of Attitude to change in the ability of the universities to
achieve its objectives.
o) Identify the role of gender in the ability of the universities to achieve its
objectives.
p) Identify the role of qualification in the ability of the universities to achieve its
objectives.
q) Identify the role of age in the ability of the universities to achieve its
objectives.
r) Identify the role of type of position in the ability of the universities to achieve
its objectives.
s) Identify the role of type of university in the ability of the universities to
achieve its objectives.
t) Identify the role of years of experience in the ability of the universities to
achieve its objectives.
o) Provide researchers and decision makers with recommendations to improve
organizational performance?
1.7 Research Importance
The importance of this research stems through the following:
a) The importance of this research lies in the fact that it is dealing with an important
strategy where the contribution of this research is an attempt to avoid or cope with
the organizational problems in the universities, and provide the leadership and
managers of information which they need in planning, leads to enhance their
abilities and enable them in improving their strategies.

8
b) At the scientific and academic level, it is hoped that this research will contribute to
the development of scientific knowledge about organizational diagnosis and the
Models which used in it.
c) It is hoped that this research will benefit officials at universities and similar service
organizations and draw their attention to the organizational problems so that they
can solve it
d) The scarcity of researches who discussed the subject of organizational diagnosis
makes the research a new addition to the library of the Islamic University of Gaza.
e) This research could serve as a background for future research on the topic of
organizational diagnosis.
f) Through this research, the researcher will be able to obtain a Master's degree
in business administration which add a new knowledge and broad prospects
and is important for development in her field.
1.8 Previous Studies
1.8.1 Introduction
In this section, the research aimed to provide an overview of literature that studied the
organizational diagnosis, knowledge transfer, research utility & applicability topic. This is
very important step to assure understanding of the whole concept.
After searching through studies and researches in Palestine about organizational diagnosis by
six box model, it turns out that there aren’t any studies linked to the title completely or even
partially. While there are studies in many countries outside Palestine addressed the same
subject, in this chapter the most important Studies and researches on this topic are reviewed.
1.8.2 Previous Studies
Twenty studies were viewed in this chapter; which covered the reasons of research, foreign
studies are depended which published through online database between "2000-2015".
a) (Esmat and Poursoltanizarandi, 2014): “Internal environment diagnoses of
Iran states organization of exception education view of sport experts by
using Weisberd six-box model.
9
In this research internal environment diagnoses of Iran states organization of
exceptional education in view of sport experts is investigated by using Weisbord six-
box model. Purposes, structure, communications, rewards, leadership, helpful
mechanisms and attitude towards change of Iran states organization of exceptional
education are studied.
According to the results there are significant difference between assumptive mean
and observed means of elements of Weisbord’s model, and the means of these
elements which are include Purposes, structure, leadership, communications, rewards,
helpful mechanisms and attitude towards change, are 12.34, 11.78, 15.12, 11.25,
11.50, 12.28 and 11.67 respectively. These show that the organizations are in good
condition. The results also show there is significant relationship among elements of
Weisbord model and, are significant relationship between elements of Weisbord
model and age. Additionally, there isn’t significant difference between Weisbord
model elements according to gender, field of study and level of education.
b) (Darvish1, Kermani1 and Kolivand1, 2014): “Internal Environmental
Analysis of Khatam Anbia Hospital Based on Weisbord’s Organizational
Diagnosis Model”
This study was aimed to analyze the internal environment of Khatam Alanbia
Hospital based on Weisbord’s model for organizational diagnosis.
This cross-sectional and descriptive–practical research has been performed in
Khatam Alanbia Hospital in Tehran on 2014. The data were compiled from the
standard organizational diagnosis questionnaire and Weisbord’s six-dimensional
model. The investigation was conducted on 312 out of 1645 staff of Khatam Alanbia
Hospital.
The results showed that there was a positive significant relation between different
dimensions. Between the all internal dimensions, rewarding had the highest score and
organizational purposes had the lowest score.
Regarding the magnitude and complexity, no organization is like a hospital.
Therefore, conducting periodically investigation in order to have a better
understanding of the organization, to make appropriate decisions, and to improve the
10
performance and efficiency of the hospital is recommended. Without an appropriate
overview, it is impossible to adopt effective decisions.
c) (Nasiripour, Raeissi and Yazdani, 2013) “Analysis Internal Factors of
Hospitals Affiliated with Kurdistan University of Medical Science Based on
Weisberg’s Six-Box Model and Its Relation to Their Crisis Preparedness”.
This study is aimed to investigate the relationship between the statuses of hospitals
`internal factors and their level of preparedness in crisis.
This correlative, applied, and cross-sectional study was conducted in 21 hospitals of
Kurdistan University of Medical Science in 2008. The data were collected using the
standard Weisbord questionnaire and hospital preparedness checklist to measure the
status of internal factors and the hospitals` level of crisis preparedness, respectively.
The data were analyzed using descriptive and analytical statistical methods.
Changing internal factors would result in 74% of the changes in level of hospital.
Preparedness in crisis in all studied hospitals. The preparedness level and the
organizational structure of the hospital had strongest relationship and preparedness
level and personnel’s attitude to changes had the weakest respectively.
Hospitals should analyze their internal factors status in order to improve their
preparedness level in crisis. Concentrating on different aspects of internal factors,
reviewing objectives, improving increasing teamwork, involving personnel in
decision-making, using performance-based rewards, forming communication
committee, improving leadership styles, training organization `s managers and
leaders, and facilitating internal and external coordination could be effective.
d) (Hamid, Sayyed Ali, Reza, Arash, Hasan Ali, Azizollah , 2011): “The
Analysis of Organizational Diagnosis on Based Six Box Model in
Universities”
The purpose of this research is the analysis of organizational diagnosis on based six
box model at universities.
Research method was descriptive-survey. Statistical population consisted of 1544
faculty members of universities which through random strafed sampling method 218
persons were chosen as the sample. Research Instrument were organizational

11
diagnosis questionnaires with 77 items that by use of cronbach alpha coefficient,
reliability coefficients were obtained equal to 0.94. Out of 218 questionnaires we
received 200 completed questionnaires. This represents a response rate is quite
suitable for this type of study.
Analysis of the results indicated that mean the organizational diagnosis in dimensions
of leadership, relationships and motivation & reward was bigger than average and in
dimensions of purpose, structure and helpful mechanisms was smaller than average.
There was not a positive and significant difference between views of faculty members
about organizational diagnosis on based of gender, employment status and scientific
degree.
e) (Sanjay, Raja, 2011)”: Diagnosing organizational effectiveness in the
tourism sector of Zanzibar”
This research thus set out to explore and diagnose the organizational effectiveness of
the accommodation units of the tourism sector in Zanzibar. The research had specific
objectives of diagnosing and finding the gap between the current and the optimal
organizational performance in two particular units of accommodation as well as
determining the factors affecting organizational performance in these units. The study
furthermore set out to recommend implementation of suitable intervention activities
to improve organizational performance in the units analyzed.
In order to achieve the above objectives the research deployed an action research
strategy with the Weisbord’s six box model as a framework to diagnose two five star
grade accommodation units in Zanzibar. A qualitative method was used to collect
data.
f) (Foot, 2004)”: An exploration of factors that impact on levels of employee
satisfaction and organizational performance”
This research focused on a hotel that is part of an international chain of hotels, which
has recently undergone a rebranding process (a change from within). This research
aimed to assess and explore factors that impact on levels of employee satisfaction and
organizational hotel performance, in other words it aimed to 'diagnose' the hotel's
current status. The research was conducted in two phases. Phase one made use of a
widely used measure of job satisfaction, the job descriptive index (JDI) that looked at

12
five facets of job satisfaction namely: pay, opportunity for promotion, co-workers,
supervision and the nature of work. Phase two further explored the results of the JDI
(staff being very dissatisfied with pay and promotions opportunity) and further
explored other areas of the organizational hotel with the use of an organizational
development model, Weisbord's Six-Box Model (1990).
The 'boxes' included areas of purpose, structure, relationships, leadership, rewards
and helpful mechanisms. These areas were explored with staff using focus groups.
Heads of departments (management) and the deputy general manager of the hotel
were interviewed using a semi-structured interview format, exploring similar issues
to those researched with staff. Results indicated problems in the hotel with regard to
purpose, a severe lack of communication and staff feeling they have little chance for
promotion as well as pay structures being perceived as unfair. The overall leadership
at the hotel was described as erratic, and relationships between management revealed
high levels of mistrust.
Due to limited research in the South African hospitality industry, much of the
literature available is based on experiences in the United States of America or the
United Kingdom. For this research, the researcher had few previous published
findings and was unsure of the many issues that could possibly arise. However, the
intervention was enjoyable and recommendations have been provided for the hotel to
consider, so the hotel can go from "good to great".
g) (Yousefi, Sajadie, 2014): Examining the relationship between contextual
dimensions of organization and organizational climate according to
Weisberd six-box model.
This study investigates the relationship between contextual dimensions of
organization and organizational climate. In order to examine the association between
these two variables, library research as well as administering questionnaire was
utilized. The employed questionnaire enjoys Alpha Cronbach of 0.91, sufficiently
enough to support reliability. Descriptive statistics was used to analyze data obtained
from the questionnaire and the most important tests were KMO test and Spearman
correlation coefficient. This research is applied and concerning procedure, it is
correlational descriptive. The statistical population is 85 staffs of telecommunication

13
management of Borujerd that among them a sample of 70 staffs were selected
through simple random sampling based on Morgan's table for determining sample
size. Analysis of results demonstrated that there are significant relationships between
contextual dimensions of organization (goals, environment, size, technology and
organizational culture) and organizational climate.
h) (Verghese, 2007): OD Interventions for Sustainable Excellence in Higher
Education: Conference on Global Competition & Competitiveness of Indian
Corporate.
Some 25 years ago came the birth of another discipline, called organizational
development, the goal of which was to focus on the gap that exists between where a
group or organization is and where they would like to be. This paper tries to address
the role that organization development can play as an approach for sustainable
excellence in higher educational institutions. The first section of the paper addresses
the status of higher education in India, exploring the challenges faced by higher
education institutions, and suggestions that can improve the quality of higher
education. The second section suggests the use of Weisbords’ Six-box model as a
diagnostic tool for an educational institution. It illustrates how planned and focused
organization development interventions can help in understanding of the system and
guide the change process in today’s unsettled higher education environment.
i) (Casper-Curtis, 2002): Virtual team development in a college course setting.
The purpose of the study is to determine how an instructor can facilitate collaboration
among students during a virtual team project conducted within the framework of a
traditional college course. Much of the current research on virtual teams has been
conducted in business environments or controlled laboratory settings. Little is known
about designing authentic collaborative team projects within an educational setting.
Marvin Weisbord’s Six-Box Diagnostic Model (1976) was used as a framework for
this interpretive qualitative study. Questionnaires were administered to college
students who participated in a ten-week collaborative virtual team project. Open-
ended questions were designed to elicit feedback in three specific areas of the project:
the instructor’s role, project training, and the structure of the project.

14
Unlike the findings in many current research studies, the majority of students in this
study did not feel a need to meet virtual team members face-to-face. Research
findings showed students instead focused on finding online ways of developing
relationships, and requesting a longer project time frame to allow for virtual team
building.
j) (Stegerean, gavrea, Stegedean, Marin, 2010): The Application of a
Diagnostic Model: An Empirical Study.
The vast majority of managers and consultants use in conducting organizational
diagnosis specific models to identify the organizational aspects that proved to be
essential in the past. The object of this paper is to apply such a model within a
Romanian organization. More specifically we extended the well-known Six Box
Model to include, besides the six variables (purpose, structure, rewards, mechanisms,
relation and leadership), other interest variables such as external environment and
organizational performance in order to evaluate the organizational performance based
on employees’ perceptions. The results obtained show that three of the 8 variable
registered a significant and positive impact on organizational performance (purpose,
mechanisms and external environment, the latter was not considered as a distinct
variable in the Six Box Model).
k) (Philippe Rauffet, Catherine Da Cunha, Alain Bernard , 2010):
Organizational capabilities assessment: a dynamic methodology, methods
and a tool for supporting organizational diagnosis.
Many methods, like CMMI, ISO norms or 5 steps road mapping, are implemented in
organizations in order to develop collective competencies, called also organizational
capabilities, around organizational needs. They aim at providing new means to
controls resources of organization, and enabling an organizational diagnosis, it is to
say the evaluation of the strengths and the weaknesses of the organization.
Nevertheless, these methods are generally based on knowledge based models (they
are composed of good practices libraries) and on the experience of functional experts
who structure these models. So human and organizational errors can occur in these
models and noise the assessment of organizational capabilities, and therefore the
15
organizational diagnosis. This paper proposes a methodology, some methods and a
tool, to make these knowledge based models and the assessment of organizational
capabilities more reliable, so as to enable an accurate organizational diagnosis.
l) (Vitale, Armenakis, Field, 2008): Integrating Qualitative and Quantitative
Methods for Organizational Diagnosis Possible Priming Effects?
This study reviews considerations for integrating closed-ended items and open-ended
questions in a single survey instrument, focusing on contextual effects as a potential
pitfall in organizational diagnosis. A randomized posttest-only control group
experiment was conducted in a field setting with a small (92 employees) for-profit
firm wherein the experimental group received a mixed questionnaire (closed-ended,
followed by open-ended, questions) and the control group received only open-ended
questions. Individuals receiving the mixed survey responded with a lower response
rate and fewer comments than those receiving only the open-ended questions. A
thematic content analysis of responses revealed a practically significant difference
between groups in respondents' perceptions of the organization's strengths. However,
the reported weaknesses of the organization did not differ between groups.
m) (Postma, Kok, 2008): Organizational Diagnosis in Practice: A Cross-
Classification Analysis Using the DEL-Technique.
In this paper, an empirical research about organizational diagnosis in The Netherlands
is presented. Organizational diagnosis is seen as a strategic activity which is
determined by the idiosyncrasies of the decision maker. The main research question
is whether the usage of the kind of conceptual organizational diagnosis model and
computer support in diagnosing problem situations is contingent upon background
characteristics of management consultants and their agencies. The DEL-technique
was applied to test a number of propositions among 72 respondents of a random
sample of 300 Dutch consulting agencies. This cross-classification analysis technique
is especially suitable for dealing with small samples. The results indicate that size of
an agency, educational specialization, and work experience are important
characteristics with respect to the usage of conceptual organizational diagnosis

16
models. Computer support was not found to be dependent on management consultant
and agency characteristics in the specific hypothesized relationships.
n) (Bin Saeed, Wang, 2014): Sustainability Embedded Organizational
Diagnostic Model.
Organizational diagnosis is an exercise done to check an organization’s current
health. A complete diagnosis not only checks the current health, but also suggests
corrective measures. Diagnostic models suggested by others were evaluated in this
paper including some of the authors’ previous work and shortcoming i.e. lacking the
sustainable development focus in these models of organizational health diagnosis was
identified. The main focus of this paper is to incorporate sustainability dimension in
the organizational diagnostic model. They therefore propose in this paper an
alternative, sustainability embedded model for organizational diagnosis. This model
can be used by the organizational diagnosticians to perform a comprehensive
organizational diagnosis.
1.8.3 Commentary.
a) This topic of organizational diagnosis by Weisbord Six-Box Model is still
new in Palestine and Arab countries, and most of these studies took place in
foreign countries.
b) It seems there is no published paper or academic research dedicated in
Palestine, which deals with the organizational diagnosis by Weisbord Six-Box
Model.
c) Organizational diagnosis can be applied in higher educational institutions
using by Weisbord Six-Box Model.
d) There are a lot of benefits that will be available, when universities in Gaza
strip apply the organizational diagnosis.

17
CHAPTER 2 Literature Reviews
Chapter Outline:
2.1 Introduction
2.2 View of universities in Gaza strip
2.3 Definitions and concepts of organizational diagnosis.
2.4 The role and Purpose of organizational diagnosis
2.5 Organizational diagnosis and organizational analysis.
2.6 Organizational Diagnostic Models
2.7 The Weisbord Six-Box Model
18
2.1 Introduction
In today’s global environment, an accessible and high quality higher education system is
imperative for a nation’s economic progress. A sound higher education system supports and
enhances the process of economic and social development for a better future. Developing and
transition countries are particularly challenged in a highly competitive world economy because
their higher education systems are not adequately developed for the creation and use of
knowledge. Converting the challenges into opportunities depend on the rapidity with which
they adapt to the changing environment (Rani, 2005).
To be effective in the 21st century, an organization requires flexibility and the ability to
transform rapidly. Senior management’s understanding of their organization’s internal state is
a prerequisite to developing more effective strategies to meet the challenges of today’s
competitive environment. (See Armenakis & Bedeian, 1999; Beer & Spector, 1993;
Cummings & Worley, 2005, for a review).
In a world of increasing stakeholder expectations and decreasing resources, aggressive cost
cutting programs have run their course. Where do you turn next? Studies have shown that 85%
or more of the root causes of performance problems are in the organizational structures,
systems, and culture within which people work – put good people in bad systems and you get
poor performance. But trying to improve organizational performance by reorganizing,
changing leadership or instituting new training and development programs creates change, but
when done without a rigorous diagnosis of an organization’s structures, systems, and culture,
managers often solve one problem and unintentionally create others (Breckenridge Institute®,
2011).
There are identified a number of techniques aimed at improving organizational performance.
One of these techniques is organizational diagnosis, which presents the assessment of the
current situation of an organization in order to identify the most appropriate interventions for
its future development (Stegerean et al, 2010).
Diagnosis is crucial for organizations because of organizational problems and challenges such
as competition, turbulence of environment, change management, reorganizations, and
19
improvements in productivity, competitiveness, and quality, risk of imitation of fashionable
management techniques. (Harrison, 2015)
In order to better manage change from within, organizations have begun identifying their
current status as an organization and developed from there. A tool used in the diagnosis of
change management and development is for organizations to perform a diagnosis. An
organizational diagnosis is designed to generate data on the current state of the organization
and the relationship between how the organization IS functioning, and how it is performing
against desired goals (French & Bell, 1995).
In addition, all the systems within organizations are interrelated and responsive to each other.
Diagnosis of an organization from an open systems perspective must therefore take into
account a variety of internal and external variables and how they influence each other
(Howard, 1994).
The key to establishing an effective change and transformation in organizations lies in the
early stages of assessment and diagnosis. (Bolton and Heap, 2002)
Organizational diagnosis should provide the answer the following questions: Why should the
organization is changed? What should the content of change include, i.e. what should be
changed in the organization? Therefore, the diagnosis is given great importance in published
writings in the sphere of organizational change. (Nebojša, 2010)
This chapter aims to provide a general glimpse about the organizational diagnosis, its
definition, and its historical development. In addition to present for a used diagnosis models,
it’s benefits, and make comparison between them. Also to highlight the model of six boxes as
a diagnostic tools for this search.
2.2 View of universities in Gaza strip
Knowledge is the driving force in the rapidly changing globalized economy and society.
Emergence of knowledge as a driving factor results in both challenges and opportunities. The
growth of the global economy has increased opportunities for countries with good levels of
education (Carnoy, 1999).

20
The primary role of higher education is increasingly to transform students by enhancing their
knowledge, skills, attitudes and abilities while simultaneously empowering them as lifelong
critical, reflective learners. (Harvey, 2000).
Organizations are continually searching for innovative ways of enhancing competitiveness, as
evolving external forces, such as changing demographics, globalization and technology,
require managers to rapidly rethink and retool their organizational management strategies
(Whitfield and Landeros, 2006).
One of these organic organizations which have a dynamic interaction with the environment is
universities. The main task of universities is training and educating experts and professional
human resource for the society and at the same preparing the ground for stable developments.
The quality & development of knowledge greatly depends on the quality of work environment
in universities. Therefore, analyzing the quality of university working environment helps top
executives of higher education systems get the needed feedback for making decisions and their
future strategic planning on the one hand and universities themselves become aware of their
quality and take measures for its improvement on the other. One of such actions is paying
enough attention to the faculty members’ welfare and the quality of their knowledge and its
improvement because it highly affects the quality of higher education and university
environment. As universities have the major role of societies’ improvement power in
scientific, cultural and social dimensions and must technically and scientifically always be one
step ahead of other institutions, they must have the quality by which they can improve the
quality of other organizational environments. (Hamid, Sayyed Ali, Reza, Arash, Hasan Ali,
Azizollah, 2011)
According to the statistical book which published by the Ministry of Education and Higher
Education in Gaza strip 2014-2015. The number of the higher education approved institutions
which are in Gaza strip until 2015 are 28 organizations. Came as the follow:
- 5 traditional universities ( 1 governmental, 2 NGO, 2 private)
- 8 community college ( 4 governmental, 2 NGO, 2 private)
- 10 intermediate community college(1 governmental, 1 NGO, 6 private –
2 under the supervisor of UNRWA)
- 2 Open education universities ( 1 NGO, 1 private)
21
- 2 polytechnics ( 2 private )
- Higher education Academy (1 private)
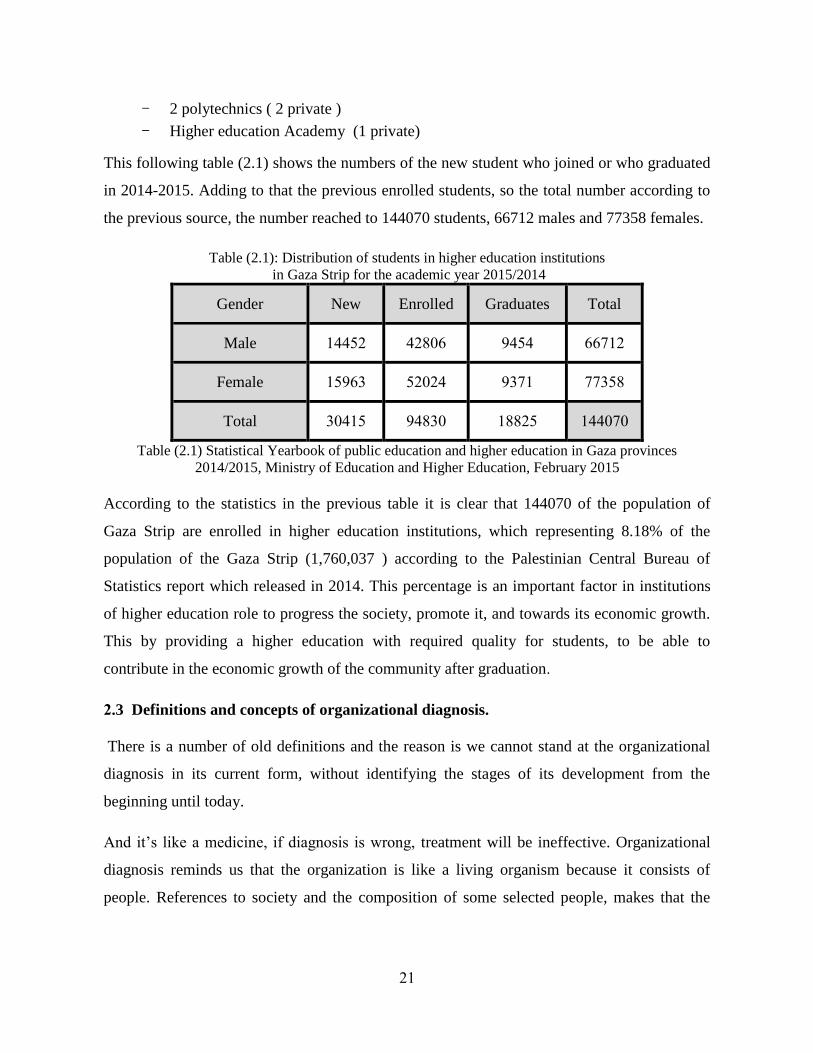
This following table (2.1) shows the numbers of the new student who joined or who graduated
in 2014-2015. Adding to that the previous enrolled students, so the total number according to
the previous source, the number reached to 144070 students, 66712 males and 77358 females.
Table (2.1): Distribution of students in higher education institutions
in Gaza Strip for the academic year 2015/2014
Total Graduates Enrolled New Gender
66712 9454 42806 14452 Male
77358 9371 52024 15963 Female
144070 18825 94830 30415 Total
Table (2.1) Statistical Yearbook of public education and higher education in Gaza provinces
2014/2015, Ministry of Education and Higher Education, February 2015
According to the statistics in the previous table it is clear that 144070 of the population of
Gaza Strip are enrolled in higher education institutions, which representing 8.18% of the
population of the Gaza Strip (1,760,037 ) according to the Palestinian Central Bureau of
Statistics report which released in 2014. This percentage is an important factor in institutions
of higher education role to progress the society, promote it, and towards its economic growth.
This by providing a higher education with required quality for students, to be able to
contribute in the economic growth of the community after graduation.
2.3 Definitions and concepts of organizational diagnosis.
There is a number of old definitions and the reason is we cannot stand at the organizational
diagnosis in its current form, without identifying the stages of its development from the
beginning until today.
And it’s like a medicine, if diagnosis is wrong, treatment will be ineffective. Organizational
diagnosis reminds us that the organization is like a living organism because it consists of
people. References to society and the composition of some selected people, makes that the
22
organization have the character or act a certain way based on its values and culture, which
include a unique language, symbols, practices, rites and myths (Schein, 1998).
According to Lowman's (2005) organizational diagnosis process is influenced by three basic
questions: What is diagnosed by the practitioner? For what purpose? And using that system?
Organizational diagnosis has two essential purposes.
Beer and Spector (1993) define organizational diagnosis as “a process that helps organizations
to enhance their capacity to assess and change dysfunctional aspects of their culture and
patterns of behavior as a basis for developing greater effectiveness and ensuring continuous
improvement”.
Lowman (1993) asserts that there are basically two types of diagnostic processes. One of these
concerns the assessment of organizational dysfunction and the other of organizational
wellbeing and intended optimization. Kontoghiorghes et al (2005) postulate that that a well-
executed organizational diagnostic process fosters and promotes a continuous learning
environment that not only impacts on the organization’s ability to rapidly adapt to change, but
which also positively affects its bottom-line organizational performance and overall
effectiveness.
After reviewing these definitions of the organizational diagnosis, organizational diagnosis is
an exercise attempted to make an analysis of the organization, its structure, subsystems and
processes in order to identify the strengths and weaknesses of its structural components and
processes and use it as a base for developing plans to improve and/or maximize the dynamism
and effectiveness of the organization.
Organizational diagnosis could be done as a periodic routine exercise like the case of periodic
medical checkup of an individual or may be undertaken whenever there is a cognizable
problem that is affecting the functioning of an organization. (Satish, 2009)
Further argue that diagnosis in organization development is also a much more collaborative
process than the medical diagnosis process since it involves both the organization’s members
and change agents in discovering the determinants of current organizational effectiveness as
well as developing appropriate interventions and implementing them. Secondly organizational

23
diagnosis is a more development oriented process which assesses the current functioning of
the organization to discover areas for future development. (Sanjay, 2011)
So that, the problem with this type of diagnosis is that, all too often, the problem keeps
reoccurring. Therefore, it is important to systematically examine the entire system when
conducting organizational diagnosis, rather than focusing on rapid diagnoses and “quick fixes”
(French & Bell, 1995).
Finally, within the organizational diagnostic process, the results of the data collection are fed
back to organizational members within the organization in order to begin the process of
organizational change (French & Bell, 1995).
- The major steps of a diagnostic cycle include
a) Orientation
b) Goal setting
c) Data gathering
d) Analysis/ Interpretation
e) Feedback
f) Action Planning
g) Implementation
h) Monitoring/ Measure
i) Evaluation
j) Forms of Diagnostic
Finally, Organizational diagnosis requires defining and using a pattern for understanding
organizational problems, data collection and analysis and drawing conclusions based on the
findings with the purpose of making necessary changes and probable modifications. This
organizational diagnosis is a group process meaning it requires the existence of common and
similar approaches and purposes. Individuals should seriously take active part in planning
interventions and their implementation. (Cummings, 2005).
2.4 The role and Purpose of organizational diagnosis
Most managers struggle against the flow of overly complex systems and are frustrated by an
invisible force that undermines their attempts to effect positive change. Their instincts tell

24
them that the organization’s structures, systems, and culture are preventing them from getting
the results they want, but “culture” has remained one of the least understood aspects of
organizational life. The day-to-day reality of Invisible Bureaucracy manifests itself in a
number of recurring and troubling questions:
a) Why is it so difficult for some organizations to make decisions, and why (once made)
do so many decisions go unimplemented?
b) Why do most organizations have a gap between the formal rules for how things get
done, and the informal rules for how things really get done?
c) Why does vital business information get filtered, altered, or stopped as it moves up
and down through the organizational structure?
d) Why do projects that seem to have the full support of top managers and key personnel
die a slow death and no one knows what happened to them?
e) Why are some organizations able to change in the face of forces and threats from the
external environment while others seem to have “Blind Spots” about these issues and
fall prey to them over and over again?
f) Why do the universal principles of organization development seem to work in some
organizations, but not in others?
g) Why do change initiatives so often show failed or marginal results?
h) Why do so many people find their work to be a substantial part of life’s problems,
rather than one of the solutions to life’s problems?
(Breckenridge Institute®, 2011).
Diagnosis helps managers avoid two types of risky reactions to the uncertain business
environment: the tendency to avoid change and improper action. Managers of organizations
that have been successful in the past have tended to show a certain resistance to change. The
results recorded in the past, creates a "race for success" by supporting the incorrect assumption
that the best way to meet future challenges is to rely on strategies and tactics that have had
good results in the past (Nadler and Shaw, 1995).
Despite extensive literature extolling the virtues of a proper diagnosis, research has found that
one reason for the high failure rate of change intervention efforts is the managers’ or
consultants’ failure to diagnose the needs of the organization (Harrison and Shirom, 1999).
25
Beer & Spector (1993) suggest that an organization diagnosis can be helpful to
organizations in the following ways:
a) Enhancing their capacity to assess and change the culture of the organization.
b) Providing an opportunity for organizational members to acquire new insights into
the dysfunctional aspects of their culture and patterns of behavior as a Basis for
developing a more effective organization.
c) Ensuring that the organization remains engaged in a process of continuous
improvement.
The context in which organizations work is very important in organizational diagnosis.
Organizations are open systems so that everything outside of the organization can affect their
daily activities. Organizations which work in a stable environment have generally a dynamic
nature and from an organizational diagnosis perspective need very little changes. Organic
organizations are really flexible. Those in charge of organizational diagnosis need to know the
type of organizations in order to make decisions as to the choice of appropriate patterns and
theories. Incorrect understanding can cause inappropriate problems (Smither, 1996).
2.5 Organizational diagnosis and organizational analysis
Organizational diagnosis is a very important issue in the field of Organizational Development
and Change. It is often the case in studies that organizational change management comes down
to answering three questions: why (the causes of change), how (the process of change) and
what (the content of change) (Pettigrew, 1987).
Organizational diagnosis is a method used for analyzing the organization in order to identify
organizational shortcomings so they would be neutralized through organizational change. In
itself, organizational diagnosis is a concept related to the concept of organizational analysis,
and it is necessary to make a distinction between them at the very beginning. Organizational
analysis is in many ways similar to organizational diagnosis, but there are some important
differences. The main resemblance between organizational analysis and organizational
diagnosis lies in the fact that both methods are focused on understanding the organizational
content, i.e. on identifying the elements of organization and their nature, as well as the
relations between them. (Nebojša, 2010)
26
Both methods start with certain organizational models and use very similar, or exactly the
same, techniques for data collection and processing. The key difference between
organizational analysis and organizational diagnosis is their aim: the aim of organizational
analysis understands the organization for the purpose of its exploration, while the aim of
organizational diagnosis understands the organization for the purpose of changing and
improving it (action). It could be said that organizational diagnosis is a specific form of
organizational analysis – a form focused on the performing of organizational change for the
purpose of improving organizational performance. (Nebojša, 2010)
When it comes to organizational diagnosis, studies in the area of Organizational Development
and Change are preoccupied with three main issues:
a) development of organizational diagnostic models;
b) the choice of procedures and methods for data collecting in diagnosis; and
c) Methods and techniques of data processing and making conclusions (Hayes,
2002).
Organizations can be analyzed with different perspectives in mind. The perspectives one takes
depends both on the purpose for which the analysis is being done and the professional
background of the people doing organizational analysis. The following perspectives could be
used for analyzing organizations: (Satish, 2009)
a) Economics Perspective
b) Political Science Perspective
c) Sociology and Social Psychology Perspective
d) Management Perspective
e) Applied Behavioral Science or OD Perspective.
2.6 Organizational Diagnostic Models
An Organizational diagnostic model is a representation, usually metaphorically, of an
organization (Howard, 1994). It is a conceptual framework that people use to understand
organizations (Cummings and Worley, 2005). They describe the relationships among different
features of the organization, as well as its context and effectiveness, hence point out what
27
areas to examine and what questions to ask in assessing how an organization is functioning.
According to Harrison and Shirom (1998), diagnostic models powerfully influence feedback
provided to clients, shape the choices about interventions for change, and help determine the
effectives of diagnosis and consultations.
Harrisom and Shirom (1998) state that good diagnosis models help clients increase their
understanding of the organizational gaps that require attention, and the required resources to
better focus change interventions. The authors consider a good diagnostic model specifies its
level of analysis, its limits, the interaction between variables, effectiveness criteria, and
evaluative standards. Additionally, the authors emphasize that diagnosis models must analyze
the internals and externals of the organization, reflecting macro contingencies and macro
processes to support the managing of change, and increase organizational effectiveness.
Burke (as cited in Howard, 1994) points to several uses of organizational models:
Models help to categories data about the organization. It is far easier to deal with
six or eight categories than to consider 100 bits of information all at once.
Models help to enhance our understanding. If we have a model with say seven
categories and we find that most of the organization’s problems cluster in two of
the seven, and then we have a better idea of where to begin to improve matters
than if we had 100 bits of information.
Models help to interpret data. Suppose in our model we have the two categories
of strategy and structure. Let us further assume that from our data we have found
problems with the organization’s structure. Since in order to achieve
organizational effectiveness, strategy and structure must be linked - in other
words, to fix the structure problems without consideration first of the
organization’s strategy would lead to ineffectiveness.
Models help to provide a common shorthand language. For example, the terms
culture, shared values, networks, helpful mechanisms, and transactional factors
all come from one model or the other. Greater efficiency in communication
among organization members can be realized from the use of a model.
28
The organizational diagnosis model represents the core of the diagnosis instrument because it
directs the managers or consultants activities in certain directions being composed of a number
of variables that interact with each other (Weisbord, 1978). And the lack of a comprehensive
diagnostic model may result in changes aimed at symptoms rather than causes. (Wyman,
2003).
The study of organizational diagnosis models is paramount for OD practitioners, because
diagnostic models help to reveal key organizational gaps, and critical areas to focus.
Moreover, this analysis emphasized the role of the OD practitioner as an advisor, helping
clients identify the most appropriate diagnostic model -given the intervention objectives, and
the organizational culture, and using feedback mechanisms to channel results in a non-
threatening mode to later focus targeted OD interventions at the effective management of
change, and the improvement of the organizational effectiveness. (Armando, 2009)
The models are presented in the chronological order in which they first appeared in the
literature is:
a) Force Field Analysis (1947-1951)
b) Leavitt’s Model (1965)
c) Open Systems Theory (1966)
d) Likert System Analysis (1967)
e) Weisbord’s Six-Box Model (1976)
f) Galbraith's STAR Model (1977).
g) Congruence Model for Organization Analysis (1977)
h) Nadler and Tushman's Congruence Model (1982)
i) McKinsey 7S Framework (1981-82)
j) Tichy’s Technical Political Cultural (TPC) Framework (1983)
k) High-Performance Programming (1984)
l) The "four quadrants" of Bolman and Deal (1984)
m) Diagnosing Individual and Group Behavior (1987)
n) The Burke-Litwin Model ( 1992)
o) Freedman’s SWAMP Model (2000).
29
These models explain what has been observed in the organization and indicate what action
should be taken. An organizational model is defined as ‘a representation, to show the
construction or appearance of an organization’ (Burke, 2002).
According to Harrison and Shimron (1999), diagnostic models reinforce the impact that comes
from the results of customers, form choices about interventions for change and help determine
the effectiveness of diagnosis.
Burke (1994) brings some uses of organizational models. Choosing a diagnostic model is a
critical judgment. According to Howard (1994) choice of model depends on two criteria:
First, the model chosen to work should be well understood by the user and the
latter feels better with it.
Secondly, the model chosen should fit as much as possible with the
organization's customers, should be inclusive enough to cover many aspects of
organization and clear enough for members to give the right answer.
And According to a study conducted in 1999, the most commonly used in practice proved to
be Weisbord's Six Box Model (25% of companies analyzed, used as a basis for organizational
diagnosis this model) followed by model 7 S (19 %) and third STAR Model and Nadler and
Tushman's congruence Model (10%) (Jones and Brazzel, 2006 by Samuels)
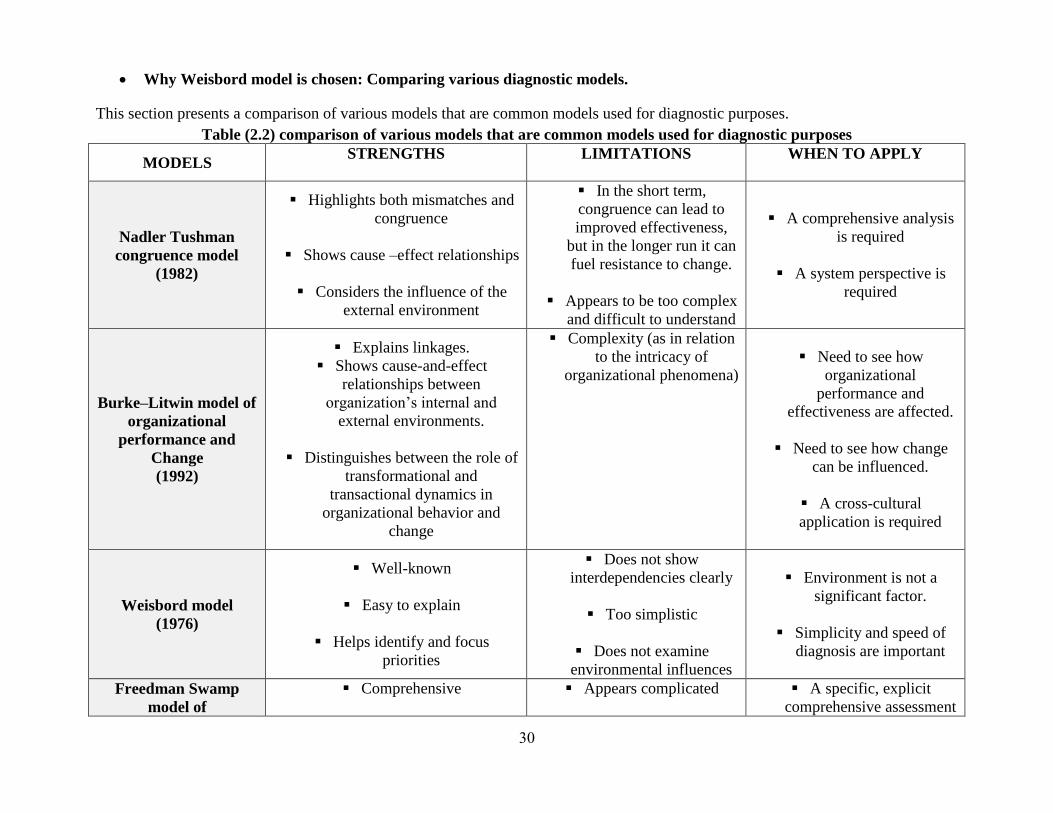
Each of the models has its own advantages and disadvantages. This research used the
Weisbord Six-Box model. This model was chosen because of the wide use in practice as well
as empirical studies, especially because of the lack of complexity and usefulness to a simple
goal of rapid diagnostic (Weisbord, 1978). One limitation is that Weisbord model does not
consider the impact of the external environment but only considers internal factors within an
organization (Harrison and Shimron 1999, Weisbord 1978).
30
Why Weisbord model is chosen: Comparing various diagnostic models.
This section presents a comparison of various models that are common models used for diagnostic purposes.
Table (2.2) comparison of various models that are common models used for diagnostic purposes
MODELS STRENGTHS
LIMITATIONS
WHEN TO APPLY
Nadler Tushman
congruence model
(1982)
Highlights both mismatches and
congruence
Shows cause –effect relationships
Considers the influence of the
external environment
In the short term,
congruence can lead to
improved effectiveness,
but in the longer run it can
fuel resistance to change.
Appears to be too complex
and difficult to understand
A comprehensive analysis
is required
A system perspective is
required
Burke–Litwin model of
organizational
performance and
Change
(1992)
Explains linkages.
Shows cause-and-effect
relationships between
organization’s internal and
external environments.
Distinguishes between the role of
transformational and
transactional dynamics in
organizational behavior and
change
Complexity (as in relation
to the intricacy of
organizational phenomena)
Need to see how
organizational
performance and
effectiveness are affected.
Need to see how change
can be influenced.
A cross-cultural
application is required
Weisbord model
(1976)
Well-known
Easy to explain
Helps identify and focus
priorities
Does not show
interdependencies clearly
Too simplistic
Does not examine
environmental influences
Environment is not a
significant factor.
Simplicity and speed of
diagnosis are important
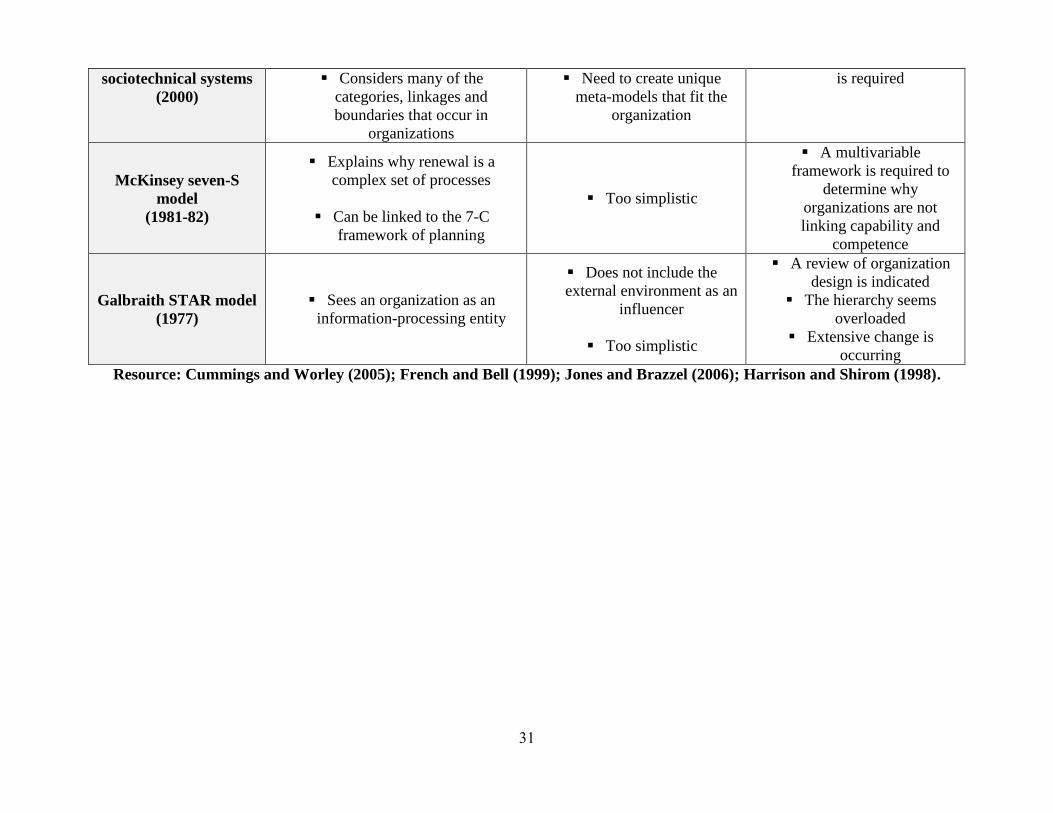
Freedman Swamp
model of
Comprehensive
Appears complicated
A specific, explicit
comprehensive assessment
31
sociotechnical systems
(2000)
Considers many of the
categories, linkages and
boundaries that occur in
organizations
Need to create unique
meta-models that fit the
organization
is required
McKinsey seven-S
model
(1981-82)
Explains why renewal is a
complex set of processes
Can be linked to the 7-C
framework of planning
Too simplistic
A multivariable
framework is required to
determine why
organizations are not
linking capability and
competence
Galbraith STAR model
(1977)
Sees an organization as an
information-processing entity
Does not include the
external environment as an
influencer
Too simplistic
A review of organization
design is indicated
The hierarchy seems
overloaded
Extensive change is
occurring
Resource: Cummings and Worley (2005); French and Bell (1999); Jones and Brazzel (2006); Harrison and Shirom (1998).

32
2.7 The Weisbord Six-Box Model
In the mid 1970's, Marvin Weisbord, an organizational design consultant, created his six boxes
model as a diagnostics tool of organizational effectiveness. He identified six key areas in
which 'things must go right' and be internally consistent for an organization to be successful.
The result of the diagnosis is a prioritized list of ready to be implemented interventions that
can drive a change process.
Weisbord’s (1976) ‘six box’ model is one of the most straight forward and easy to use system
models in the literature. In presenting it, Weisbord sought to distill years of consulting
experience and to provide users with “Six places to look for trouble with or without theory”
(Harrison and Shirom, 1998).
Weisbord proposes six broad categories in his model of organizational life, including
purposes, structures, relationships, leadership, rewards, and helpful mechanisms (Weisbord,
1976, Weisbord, 1978).
Figure 2.1. Six-box Model (Weisbord, 1976)
33
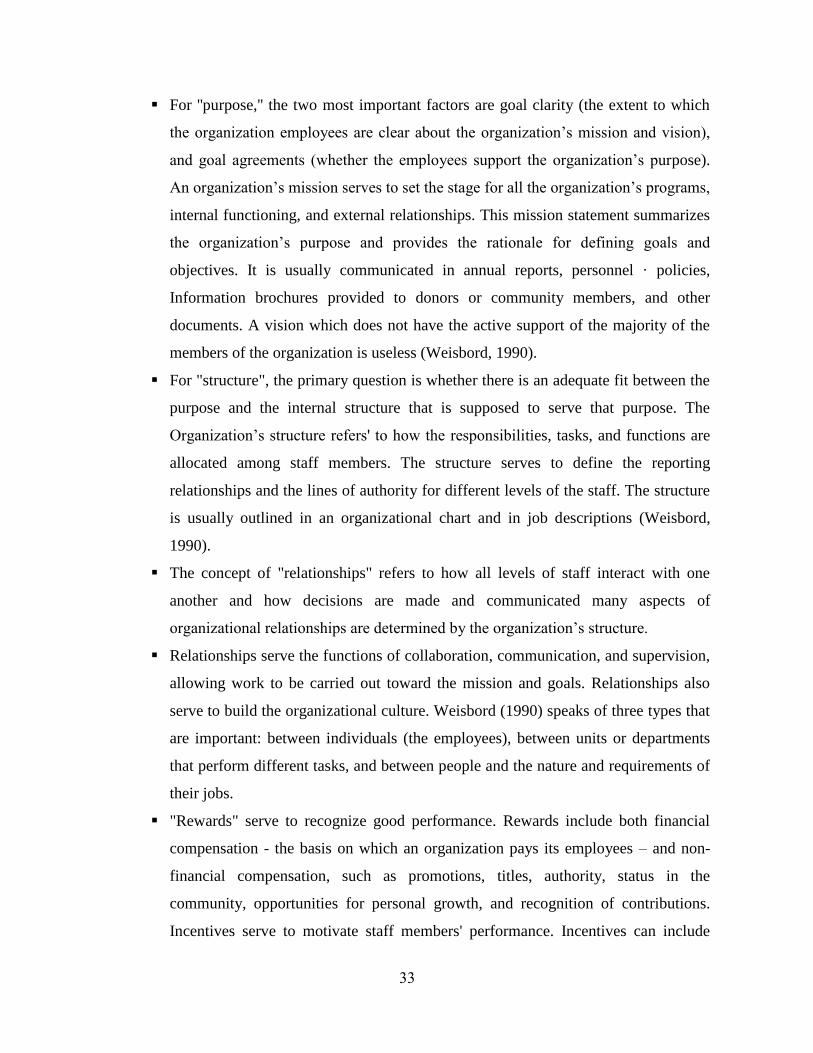
For ''purpose,'' the two most important factors are goal clarity (the extent to which
the organization employees are clear about the organization’s mission and vision),
and goal agreements (whether the employees support the organization’s purpose).
An organization’s mission serves to set the stage for all the organization’s programs,
internal functioning, and external relationships. This mission statement summarizes
the organization’s purpose and provides the rationale for defining goals and
objectives. It is usually communicated in annual reports, personnel · policies,
Information brochures provided to donors or community members, and other
documents. A vision which does not have the active support of the majority of the
members of the organization is useless (Weisbord, 1990).
For "structure", the primary question is whether there is an adequate fit between the
purpose and the internal structure that is supposed to serve that purpose. The
Organization’s structure refers' to how the responsibilities, tasks, and functions are
allocated among staff members. The structure serves to define the reporting
relationships and the lines of authority for different levels of the staff. The structure
is usually outlined in an organizational chart and in job descriptions (Weisbord,
1990).
The concept of "relationships" refers to how all levels of staff interact with one
another and how decisions are made and communicated many aspects of
organizational relationships are determined by the organization’s structure.
Relationships serve the functions of collaboration, communication, and supervision,
allowing work to be carried out toward the mission and goals. Relationships also
serve to build the organizational culture. Weisbord (1990) speaks of three types that
are important: between individuals (the employees), between units or departments
that perform different tasks, and between people and the nature and requirements of
their jobs.
"Rewards" serve to recognize good performance. Rewards include both financial
compensation - the basis on which an organization pays its employees – and non-
financial compensation, such as promotions, titles, authority, status in the
community, opportunities for personal growth, and recognition of contributions.
Incentives serve to motivate staff members' performance. Incentives can include

34
giving staff members time for consulting outside the organization, providing
training aimed at improving or developing skills, recognizing excellent
programming, and ensuring strong organizational support for any new initiative
(Weisbord, 1990).
"Helpful mechanisms" are those factors that bind an organization together. These
Include mechanisms such as planning, controlling, budgeting, and various
information systems.
For Weisbord (1990), "leadership" is the center of the framework and is the key
element that brings together the other organizational elements. The leadership
element IS also responsible for recognizing and managing influences stemming
from organizations, communities, or trends in the outside environment. Successful
leaders are those who:
a) Are committed to the organizational mission and goals;
b) Are able to develop and communicate the vision of what the
organization can and should accomplish as well as the strategic
approaches to achieve this vision.
c) Have skills in mobilizing financial and human resources;
d) Provide direction to facilitate staff members'" contribution 'toward the
stated goals;
e) Can expect and manage change;
f) Are passionate and emotionally intelligent (Goleman, 1996).
The job of the leader is to identify inconsistencies and problems within the other boxes and
maintain a balance between them. The organization’s leaders are responsible for integrating
the various elements
This model has proved to be helpful in organizational diagnosis. The Six-Box model is a
simple but powerful diagnostic tool, whereby each box has both formal and informal systems
which could form the root of organizational problems, i.e. there are formally appointed
leaders, leadership positions; and there are also informal leaders, with strong referent power
with whom employees identify and follow (Weisbord, 1990). These leadership roles can often
conflict. Often, if the formal system is dysfunctional, the informal system compensates.

35
One of the limitations of the Weisbord diagnostic model is that it does not take into
consideration the influence of the external environment and only takes into account the
intrinsic factors within an organization (Harrison and Shirom 1998, Weisbord 1978.
Weisbord (1990) suggests that the Six-Box Model is particularly useful in the following
situations:
a) When the researcher/consultant does not have as much time as would be desirable
for diagnosis;
b) When a relatively uncomplicated organizational map- is· required/needed for
diagnosis; or
c) When the client is unaccustomed to thinking in systems terms. This model then
helps the client to visualize the organization as a systemic whole without the use
of foreign and academic terminology.
It is essential to remember not to be confined to the six boxes; in reality organizations are far
more complicated. However, these six areas/boxes do provide the researcher/consultant with a
good overview of an organization. It is then the responsibility of the researcher to incorporate
other areas and issues that arise during the diagnosis into the model.
The external environment is also depicted in Weisbord’s model, although it is not represented
as a “box”. Weisbord identifies inputs as the money, people, ideas, and machinery which are
used to fulfill the organization’s mission. The outputs are products and services (Weisbord,
1976)
The model is based on two main premises. The first premise refers to formal versus informal
systems. Formal systems are those policies and procedures the organization claims to do. In
contrast, informal systems are those behaviors which actually occur. The larger the gap
between the formal and informal dimensions within the organization, the less effective the
organization is. The second premise concerns the fit between the organization and the
environment, that is, the discrepancy between the existing organization (what is) and the way
the organization should function to meet external demands (what ought to be). External
demands being defined as customers, government, and unions (Burke as cited in Howard,
1994).

36
Weisbord poses diagnostic questions for each box of his model. The questions are summarized
in the table below:
(Table 2.3); The Weisbord Diagnostic matrix
Formal System
(work to be done)
Informal System
(process of working)
Purpose Goal clarity Goal agreement
Structure Functional, program, or
matrix?
How is work actually done or
not done?
Relationships
Who should deal with
whom on what?
Which technologies should
be used?
How well do they do it?
Quality of relationships?
Modes of conflict
management?
Rewards Explicit system; what is it?
Implicit rewards
What do people feel about
payoffs?
Leadership
What do top people
manage?
What systems are in use?
How?
Normative “style” of
administration?
Helpful
mechanism’s
Budget system
Management information
(measures)?
Planning
Control
What are they actually used
for?
How do they function in
practice?
How are systems subverted?
Source: Weisbord (1976)
In summary, Weisbord's model is particularly useful when the consultant does not have as
much time as would be desirable for diagnosis, when a relatively uncomplicated
organizational map is needed for quick service, or when the client is unaccustomed to thinking
in systems terms. In the latter case, the model helps the client to visualize his or her
organization as a systemic whole without the use of strange terminology. (Burke, 2002)
Considering the importance of organizational diagnosis and its role in improving
organizational processes, the present research aims to investigate the organizational diagnosis
strategies of Gaza strip universities based on Wiesboard six boxes model.
37
Chapter 3
Research Methodology
Chapter Outline:
3.1 Introduction.
3.2. Research Methodology
3.3 Research Method
3.4 Data Sources
3.5. Research Population & Sample
3.6. Questionnaire Design and Content.
3.7 Data Measurement
3.8 Research Procedure
3.9 Test of Normality
3.10 Statistical analysis Tools
3.11 Validity of Questionnaire
3.12 Internal Validity
3.13 Structure Validity of the Questionnaire
3.14 Reliability of the Research
3.15 Cronbach’s Coefficient Alpha

38
3.1 Introduction
This chapter describes the methodology that was used in this research. The adopted
methodology to accomplish this research uses the following techniques: the information about
the research design, research population, questionnaire design, statistical data analysis, content
validity and pilot study.
3.2 Research Methodology
Under the methodology, the research method, period, place and data resources were identified.
3.3 Research Method
For the purpose of this research, the descriptive analytical approach was used. Needed data
was collected to describe the utility of organizational diagnosis using the Weisbord Six-Box
model. Then, it was analyzed to evaluate the relationship between the variables which was
formulated by the researcher.
3.4 Data Sources
3.4.1 Secondary Data
Different types of secondary data resources were used. These resources are to introduce the
theoretical part of the research topic and to situate it within the body of literature and to
provide context for the particular reader. Through access to books and references, scientific
journals and academic magazines, data bases, periodicals, articles, published papers, referred
previous related studies, published reports and internet sites.
3.4.2 Primary Data
Primary data are to analyze the quantitative characteristics of utility of organizational
diagnosis and use the Weisberg's Six-Box model. Quantitative data collected through designed
questionnaire which was distributed to research sample.
3.5 Research Population & Sample
Under the research population and sample, the population of the research and the research
sample were described.

39
3.5.1 Research Population
The population of the research consists of (2472) faculty members of (three selected
universities in Gaza Strip, distributed as the follow:
Table (3.1): Distribution of research population in universities according to the type of position
Population
university
Islamic
University
Al azhar
University
Al aqsa
University
Total
Academics 269 290 419 978
Academics with
administrative positions 120 74 98 292
administrators 484 382 336 1202
Total 2472
3.5.2 Research Sample
Through random stratified sampling method (302) persons were chosen as the sample. Like
that, distributors according to the following table:
Table (3.2): Distribution of research sample in universities according to the type of position
Population
university
Islamic
University
Al azhar
University
Al aqsa
University
Total
Academics 33 35 51 119
Academics with
administrative positions
15 9 12 36
administrators 59 47 41 147
Total 302

40
3.6 Questionnaire Design and Content.
After reviewing the literature and interviewing the specialists, the questionnaire is ،the most
appropriate tool for this research, been relying on this research on the Organizational
Diagnosis Questionnaire (ODQ) which based on Weisbord’s practitioner-oriented theory. The
ODQ generates data in each of Weisbord’s suggested six areas as well as in a seventh, attitude
toward change. This item was added as a helpful mechanism for the person involved in
organizational diagnosis. In attempting any planned-change effort in an organization it is wise
to know how changeable an organization is. Such knowledge helps the change agent
understand how to direct his efforts. (See Appendix A), and then it is translated into Arabic
(see Appendix C)
The questionnaire is provided with a cover letter which explains the purpose of this research,
the aim of the research and the privacy of the information in order to encourage high response.
Thirty-five items compose the ODQ, five in each of the seven variables. Respondents are
asked to indicate their current views of their organization on a scale of 1 to 7, with a score of 4
representing a neutral point.
3.7 Data Measurement
In order to be able to select the appropriate method of analysis, the level of measurement must
be understood. For each type of measurement, there is/are an appropriate method/s that can be
applied and not others. In this research, ordinal scales were used. Ordinal scale is a ranking or
a rating data that normally uses integers in ascending or descending order. The numbers
assigned to the important (1, 2, 3, 4, 5, 6, 7) do not indicate that the interval between scales are
equal, nor do they indicate absolute quantities. They are merely numerical labels. Based on
Likert scale the following is had:
Item Strongly
agree Agree
View
agree
Do not
Know
View
disagree Disagree
Strongly
disagree
Scale 7 6 5 4 3 2 1
41
3.8 Research Procedure:
a) First, Identify main fields of the questionnaire and items for each field, and
then prepare a preliminary questionnaire for use in the data and information
collection.
b) Then, take into account the rules of scientific research from objectivity and
comprehensiveness in the preparation of this questionnaire.
c) Then, show questionnaire to the supervisor, in order to test their suitability for
data collection, and then modify the questionnaire primarily according to the
vision of the supervisor.
d) Then, distribute the questionnaire to the referees, the population consists of
(10) referees working in management and Statistics fields inside and outside
the IUG. (see appendix B or D)
e) Then, prepare the final form of the questionnaire according to the vision of the
referees. See (Appendix A or C)
f) Then, obtain the formal book from the Islamic University of Gaza to facilitate
the task of the researcher in the distribution of questionnaires, and conduct the
research on the research population.
g) Then, distribute the questionnaire to (302) in the duration from 10 September
to 10 October 2015. Questionnaire was retrieved from (302).
h) Finally, enter the data of retrieved questionnaires from the respondents and
discharged in the computer using SPSS statistical software to analyze their
data statistically and get results.
3.9 Test of Normality
The One-Sample Kolmogorov-Smirnov test procedure compares the observed cumulative
distribution function for a variable with a specified theoretical distribution, which may be
normal, uniform, Poisson, or exponential. The Kolmogorov-Smirnov Z is computed from the
largest difference (in absolute value) between the observed and theoretical cumulative
distribution functions. This goodness-of-fit test tests whether the observations could
reasonably have come from the specified distribution. Many parametric tests require normally

42
distributed variables. The one-sample Kolmogorov-Smirnov test can be used to test that a
variable of interest is normally distributed (Henry, C. and Thode, Jr., 2002).
Table (3.3) shows the results for Kolmogorov-Smirnov test of normality. From Table (3.3), the
p-value for each variable is greater than 0.05 level of significance, and then the distributions
for these variables are normally distributed. Consequently, parametric tests should be used to
perform the statistical data analysis.
Table 3.3: Kolmogorov-Smirnov test
Field Kolmogorov-Smirnov
Statistic P-value
Purpose
Structure
Leadership, Kosovo-Albania
Relationships
Reward
Helpful Mechanisms
Attitude to change
All paragraphs of the questionnaire
3.10 Statistical analysis Tools
Data analysis was used both qualitative and quantitative data analysis methods. The Data
analysis made utilizing (SPSS 22). The following statistical tools are utilized:
a) Kolmogorov-Smirnov test of normality.
b) Pearson correlation coefficient for Validity.
c) Cronbach's Alpha for Reliability Statistics.
d) Frequency and Descriptive analysis.
e) One-sample T test.
f) Independent Samples T-test.
g) Analysis of Variance.
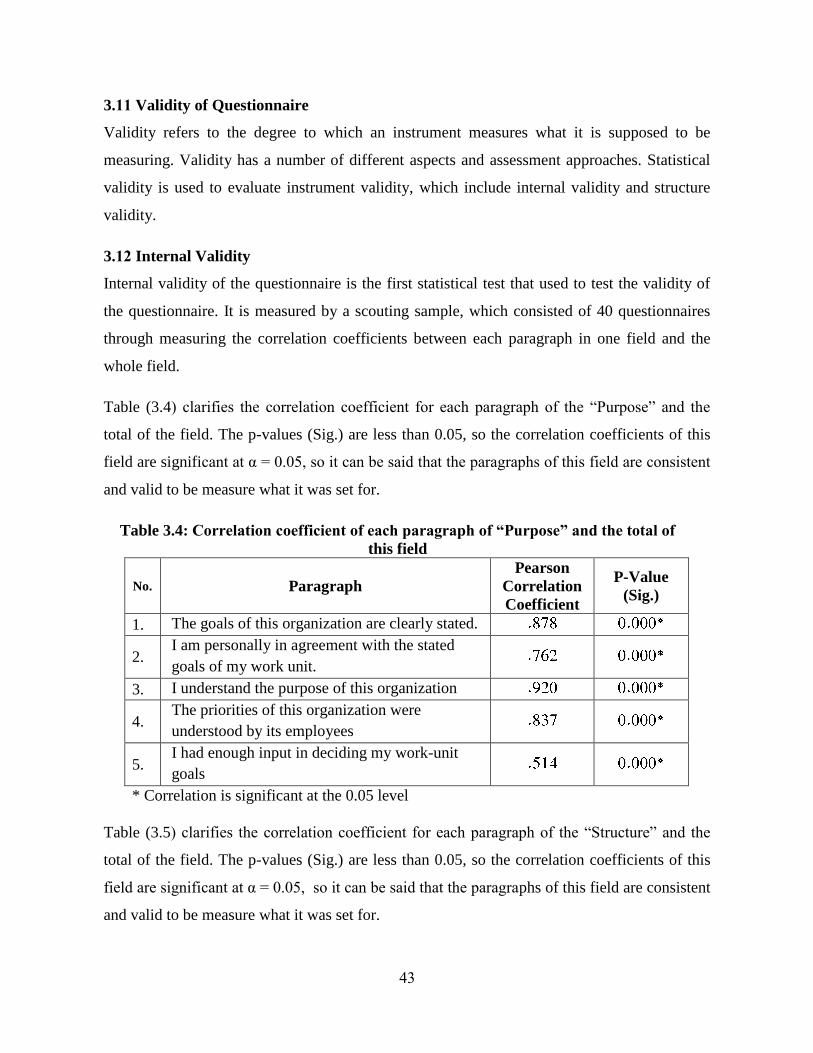
43
3.11 Validity of Questionnaire
Validity refers to the degree to which an instrument measures what it is supposed to be
measuring. Validity has a number of different aspects and assessment approaches. Statistical
validity is used to evaluate instrument validity, which include internal validity and structure
validity.
3.12 Internal Validity
Internal validity of the questionnaire is the first statistical test that used to test the validity of
the questionnaire. It is measured by a scouting sample, which consisted of 40 questionnaires
through measuring the correlation coefficients between each paragraph in one field and the
whole field.
Table (3.4) clarifies the correlation coefficient for each paragraph of the “Purpose” and the
total of the field. The p-values (Sig.) are less than 0.05, so the correlation coefficients of this
field are significant at α = 0.05, so it can be said that the paragraphs of this field are consistent
and valid to be measure what it was set for.
Table 3.4: Correlation coefficient of each paragraph of “Purpose” and the total of
this field
No. Paragraph
Pearson
Correlation
Coefficient
P-Value
(Sig.)
1. The goals of this organization are clearly stated.
2. I am personally in agreement with the stated
goals of my work unit.
3. I understand the purpose of this organization
4. The priorities of this organization were
understood by its employees
5. I had enough input in deciding my work-unit
goals
* Correlation is significant at the 0.05 level
Table (3.5) clarifies the correlation coefficient for each paragraph of the “Structure” and the
total of the field. The p-values (Sig.) are less than 0.05, so the correlation coefficients of this
field are significant at α = 0.05, so it can be said that the paragraphs of this field are consistent
and valid to be measure what it was set for.

44
Table 3.5: Correlation coefficient of each paragraph of “Structure” and the total of
this field
No. Paragraph
Pearson
Correlation
Coefficient
P-Value
(Sig.)
1. The division of labor of this organization is
flexible.
2. The division of labor in this organization is
intended to help it reach its goals
3. The manner in which work tasks are divided is
a logical one
4. The structure of my work unit is well designed
5. The division of labor in this organization
actually helps it to reach its goals
* Correlation is significant at the 0.05 level
Table (3.6) clarifies the correlation coefficient for each paragraph of the “Leadership" and the
total of the field. The p-values (Sig.) are less than 0.05, so the correlation coefficients of this
field are significant at α = 0.05, so it can be said that the paragraphs of this field are consistent
and valid to be measure what it was set for.
Table 3.6: Correlation coefficient of each paragraph of “Leadership" and the total
of this field
No. Paragraph
Pearson
Correlation
Coefficient
P-Value
(Sig.)
1. My immediate supervisor is supportive of my
efforts.
2. The leadership norms of this
organization help its progress.
3. This organization’s leadership efforts result in
the organization’s fulfillment of its purposes.
4. It is clear to me whenever my boss
is attempting to guide my work efforts
5. I understand my boss’s efforts to influence me
and the other members of the work unit
* Correlation is significant at the 0.05 level
Table (3.7) clarifies the correlation coefficient for each paragraph of the “Relationships” and
the total of the field. The p-values (Sig.) are less than 0.05, so the correlation coefficients of
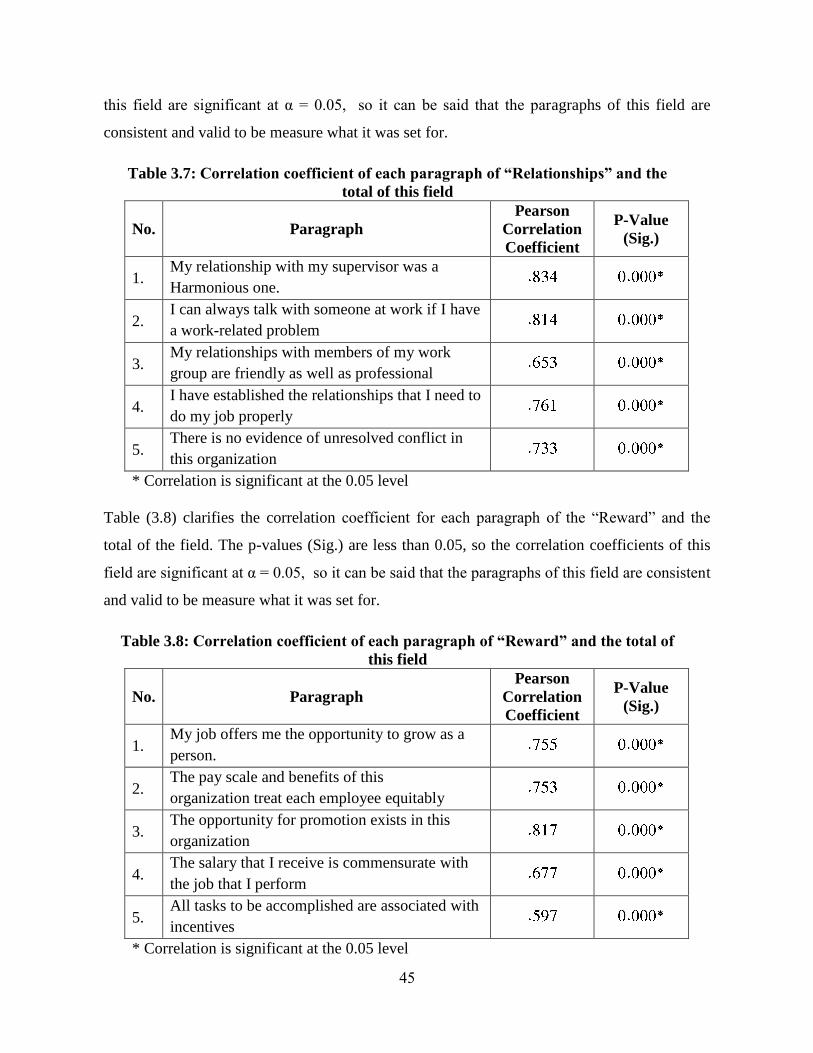
45
this field are significant at α = 0.05, so it can be said that the paragraphs of this field are
consistent and valid to be measure what it was set for.
Table 3.7: Correlation coefficient of each paragraph of “Relationships” and the
total of this field
No. Paragraph
Pearson
Correlation
Coefficient
P-Value
(Sig.)
1. My relationship with my supervisor was a
Harmonious one.
2. I can always talk with someone at work if I have
a work-related problem
3. My relationships with members of my work
group are friendly as well as professional
4. I have established the relationships that I need to
do my job properly
5. There is no evidence of unresolved conflict in
this organization
* Correlation is significant at the 0.05 level
Table (3.8) clarifies the correlation coefficient for each paragraph of the “Reward” and the
total of the field. The p-values (Sig.) are less than 0.05, so the correlation coefficients of this
field are significant at α = 0.05, so it can be said that the paragraphs of this field are consistent
and valid to be measure what it was set for.
Table 3.8: Correlation coefficient of each paragraph of “Reward” and the total of
this field
No. Paragraph
Pearson
Correlation
Coefficient
P-Value
(Sig.)
1. My job offers me the opportunity to grow as a
person.
2. The pay scale and benefits of this
organization treat each employee equitably
3. The opportunity for promotion exists in this
organization
4. The salary that I receive is commensurate with
the job that I perform
5. All tasks to be accomplished are associated with
incentives
* Correlation is significant at the 0.05 level
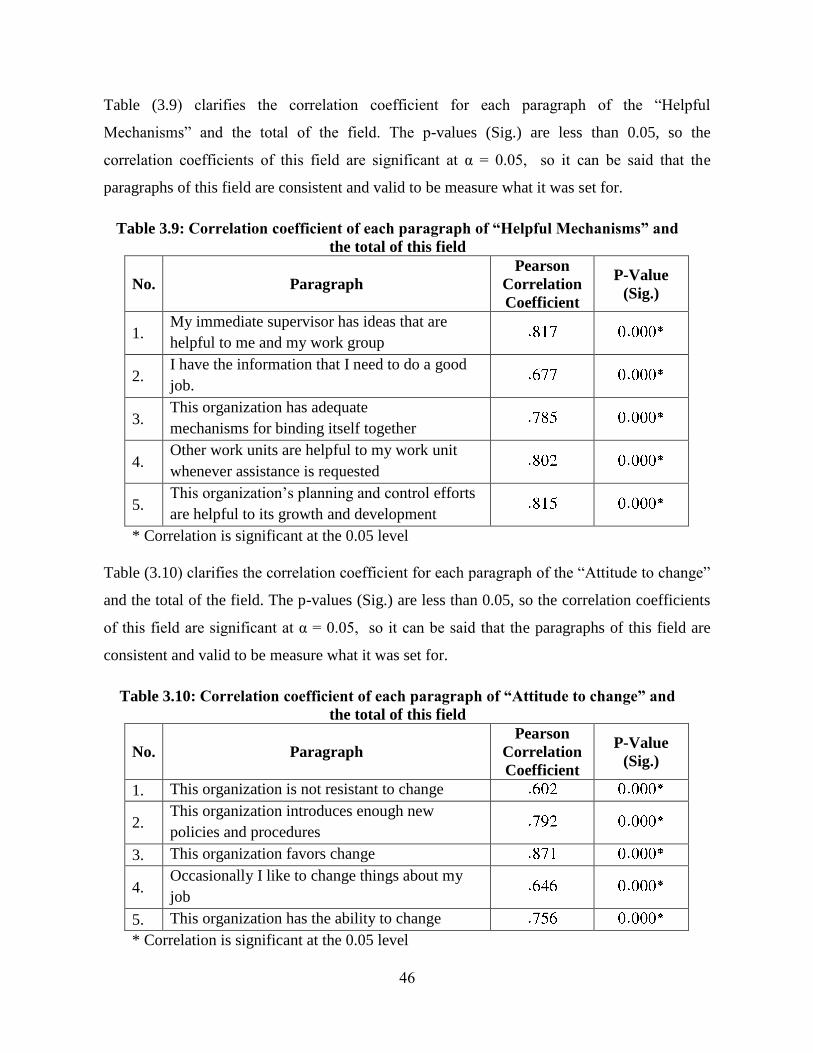
46
Table (3.9) clarifies the correlation coefficient for each paragraph of the “Helpful
Mechanisms” and the total of the field. The p-values (Sig.) are less than 0.05, so the
correlation coefficients of this field are significant at α = 0.05, so it can be said that the
paragraphs of this field are consistent and valid to be measure what it was set for.
Table 3.9: Correlation coefficient of each paragraph of “Helpful Mechanisms” and
the total of this field
No. Paragraph
Pearson
Correlation
Coefficient
P-Value
(Sig.)
1. My immediate supervisor has ideas that are
helpful to me and my work group
2. I have the information that I need to do a good
job.
3. This organization has adequate
mechanisms for binding itself together
4. Other work units are helpful to my work unit
whenever assistance is requested
5. This organization’s planning and control efforts
are helpful to its growth and development
* Correlation is significant at the 0.05 level
Table (3.10) clarifies the correlation coefficient for each paragraph of the “Attitude to change”
and the total of the field. The p-values (Sig.) are less than 0.05, so the correlation coefficients
of this field are significant at α = 0.05, so it can be said that the paragraphs of this field are
consistent and valid to be measure what it was set for.
Table 3.10: Correlation coefficient of each paragraph of “Attitude to change” and
the total of this field
No. Paragraph
Pearson
Correlation
Coefficient
P-Value
(Sig.)
1. This organization is not resistant to change
2. This organization introduces enough new
policies and procedures
3. This organization favors change
4. Occasionally I like to change things about my
job
5. This organization has the ability to change
* Correlation is significant at the 0.05 level

47
3.13 Structure Validity of the Questionnaire
Structure validity is the second statistical test that used to test the validity of the questionnaire
structure by testing the validity of each field and the validity of the whole questionnaire. It
measures the correlation coefficient between one field and all the fields of the questionnaire
that have the same level of liker scale.
Table (3.11) clarifies the correlation coefficient for each field and the whole questionnaire.
The p-values (Sig.) are less than 0.05, so the correlation coefficients of all the fields are
significant at α = 0.05, so it can be said that the fields are valid to be measured what it was set
for to achieve the main aim of the research.
Table 3.11: Correlation coefficient of each field and the whole of questionnaire
No. Field
Pearson
Correlation
Coefficient
P-Value
(Sig.)
1. Purpose
2. Structure
3. Leadership
4. Relationships
5. Reward
6. Helpful Mechanisms
7. Attitude to change
* Correlation is significant at the 0.05 level
3. 14 Reliability of the Research
The reliability of an instrument is the degree of consistency which measures the attribute; it is
supposed to be measuring (George and Mallery, 2006). The less variation an instrument
produces in repeated measurements of an attribute, the higher its reliability. Reliability can be
equated with the stability, consistency, or dependability of a measuring tool. The test is
repeated to the same sample of people on two occasions and then compares the scores
obtained by computing a reliability coefficient (George and Mallery, 2006). To insure the
reliability of the questionnaire, Cronbach’s Coefficient Alpha should be applied.
3. 15 Cronbach’s Coefficient Alpha
Cronbach’s alpha (George D. & Mallery P, 2006) is designed as a measure of internal
consistency, that is, do all items within the instrument measure the same thing? The normal

48
range of Cronbach’s coefficient alpha value between 0.0 and + 1.0, and the higher values
reflects a higher degree of internal consistency. The Cronbach’s coefficient alpha was
calculated for each field of the questionnaire.
Cronbach’s Coefficient Alpha
Table (3.12) shows the values of Cronbach's Alpha for each field of the questionnaire and the
entire questionnaire. For the fields, values of Cronbach's Alpha were in the range from 0.757
and 0.930. This range is considered high; the result ensures the reliability of each field of the
questionnaire. Cronbach's Alpha equals 0.965 for the entire questionnaire which indicates an
excellent reliability of the entire questionnaire.
Table 3.12: Cronbach's Alpha for each field of the questionnaire
No. Field Cronbach's Alpha
1. Purpose
2. Structure
3. Leadership,
4. Relationships
5. Reward
6. Helpful Mechanisms
7. Attitude to change
All paragraphs of the questionnaire 0.965
It can be said that the questionnaire was valid, reliable, and ready for distribution for the
population sample that was proved.

49
Chapter 4 Data Analysis and Discussion
Chapter Outline:-
4.1 Introduction
4.2 Personal Traits Respondents
4.3 Hypotheses Testing

50
4.1 Introduction
According to a general data which is collected from the respondents in the first section of the
questionnaire, and by using statistical repetitions, the population characteristics was
determined in order to identify the characteristics of the respondents in terms of the structure
of scientific, practical and social. The repeatability distributions of some of these variables are
presented to the following arrangement: University, Gender, Qualification, Age, Type of
Position, and Years of Experience.
4.2 Personal Traits Respondents
In this section the questionnaire personal traits are characterized as the following:
4.2.1 University
Table No. (4.1) shows that 35.4% of the sample work in Islamic university , 30.1% of the
sample work in Al Azhar university and 34.4% of the sample work in Al Aqsa university.
Table (4.1): University
University Frequency Percent
Islamic university
Al Azhar university
Al Aqsa university
Total
4.2.2 Gender
Table No. (4.2) shows that 80.5% of the sample are males and 19.5% of the sample are
females.
Table (4.2): Gender
Gender Frequency Percent
Male
Female
Total
4.2.3 Qualification
Table No.(4.3) shows that 36.8% of the sample are " Bachelor " holders, 28.1% of the sample
are " Master " holders and 35.1% of the sample are " P.H.D " holders .

51
Table (4.3): Qualification
Qualification Frequency Percent
Bachelor
Master
P.H.D
Total
4.2.4 Age
Table No.(4.4) shows that 17.9% of the sample are " 20 – less than 30 years ", 38.4% of the
sample are of "30 – less than 40 years ", 26.5% of the sample are of "40 – less than 50 years "
and 17.2% of the sample are of "50 years and Older".
Table (4.4): Age
Age Frequency Percent
20 – less than 30 years
30 – less than 40 years
40 – less than 50 years
50 years and older
Total
4.2.5 Type of Position
Table No. (4.5) shows that 48.7% of the sample are “Administrative ", 39.4% of the sample
are of” Academy “11.9 % of the sample are of “Academy with administrative position ".
Table (4.5): Type of Position
Work nature Frequency Percent
Administrative
Academy
Academy with administrative
position
Total
4.2.6 Years of Experience
Table No. (4.6) shows that 21.9% of the sample have experience " 1 –5 year ", 26.5% of the
sample have experience "6 –10 year ", 26.2% of the sample have experience "11- 15 years "
and 25.5% of the sample have experience " more than15 years ".

52
Table (4.6): Years of Experience
Years of Experience Frequency Percent
1 –5 year
6 –10 year
11- 15 years
more than15 years
Total
4.3 Hypotheses
4.3.1 The purpose in universities in Gaza strip plays significant role in the Ability
to achieve its objectives at level of significance α ≤0.05.
T-test to test the Hypothesis is used, it’s used to determine if the mean of a paragraph is
significantly different from a hypothesized value 4 (Middle value of Likert scale). If the P-
value (Sig.) is smaller than or equal to the level of significance, α ≤ 0.05 then the mean of a
paragraph is significantly different from a hypothesized value 4. The sign of the Test value
indicates whether the mean is significantly greater or smaller than hypothesized value 4. On
the other hand, if the P-value (Sig.) is greater than the level of significance α ≤ 0.05, then the
mean a paragraph is insignificantly different from a hypothesized value 4.
4.3.1.1 All university
Table (4.7) show the mean of the field “purpose” equals 5.96 (85.18%), Test-value = 40.97,
and P-value=0.000 which is smaller than the level of significance α ≤ 0.05. The sign of the test
is positive, so the mean of this field is significantly greater than the hypothesized value 4. So it
can be said that the respondents agreed to field of “purpose ".
The results of the universities are converged, and consistent to achieve this hypothesis as
follows:
a. Islamic University (87.86 %(
b. Al-Azhar University (85.71 %(
c. Al-Aqsa University (81.97 %(

53
Table (4.7): Means and Test values for “purpose” for all university
Item
Mea
n
S.D
Pro
port
ion
al
mea
n
(%)
Tes
t valu
e
P-v
alu
e (S
ig.)
Ran
k
1. The goals of this organization are clearly
stated. 1
2. I am personally in agreement with the
stated goals of my work unit. 3
3. I understand the purpose of this
organization 2
4. The priorities of this organization were
understood by its employees 5
5. I had enough input in deciding my work-
unit goals 4
All paragraphs of the field
* The mean is significantly different from 4
The reasons were attributed for this convergence between the three universities are they have
the same task, as all of them are institutions of high education in the same society and the
environment and targeted the same sample, this compatibility will be explained of each
university alone, as it will come later.
This research is Inconsistent with the findings of the research (Rahimi & Sayyed Ali & Reza &
Arash & Hasan Ali & Azizollah, 2011). Which results indicated that mean the organizational
diagnosis in dimension of purpose was smaller than average.
4.3.1.2 Islamic university
Table (4.8) show the mean of the field “purpose” equals 6.15 (87.86%), Test-value = 46.80,
and P-value=0.000 which is smaller than the level of significance α ≤ 0.05. The sign of the test
is positive, so the mean of this field is significantly greater than the hypothesized value 4. So it
can be said that the respondents agreed to field of “purpose ".

54
Table (4.8): Means and Test values for “purpose” for Islamic university
Item
Mea
n
S.D
Pro
port
ion
al
mea
n
(%)
Tes
t valu
e
P-v
alu
e (S
ig.)
Ran
k
1. The goals of this organization are clearly
stated. 1
2. I am personally in agreement with the stated
goals of my work unit. 3
3. I understand the purpose of this
organization 2
4. The priorities of this organization were
understood by its employees 5
5. I had enough input in deciding my work-
unit goals 4
All paragraphs of the field
* The mean is significantly different from 4
The reason behind such a high result is that the IUG since its establishment in 1979. Is
planning to establish a special unit for planning and quality. Its work is to set a strategic plan
and to set goals. This is clear in the last three strategic plans since 2005, until 2020. This is
characterized with clarity of vision, mission, and the involvement of all staff of employees in
the planning and construction.
4.3.1.3 Al Azhar university
Table (4.9) show the mean of the field “purpose” equals 6.00 (85.71%), Test-value = 22.28,
and P-value=0.000 which is smaller than the level of significance α ≤ 0.05. The sign of the test
is positive, so the mean of this field is significantly greater than the hypothesized value 4. So it
can be said that the respondents agreed to field of “purpose ".
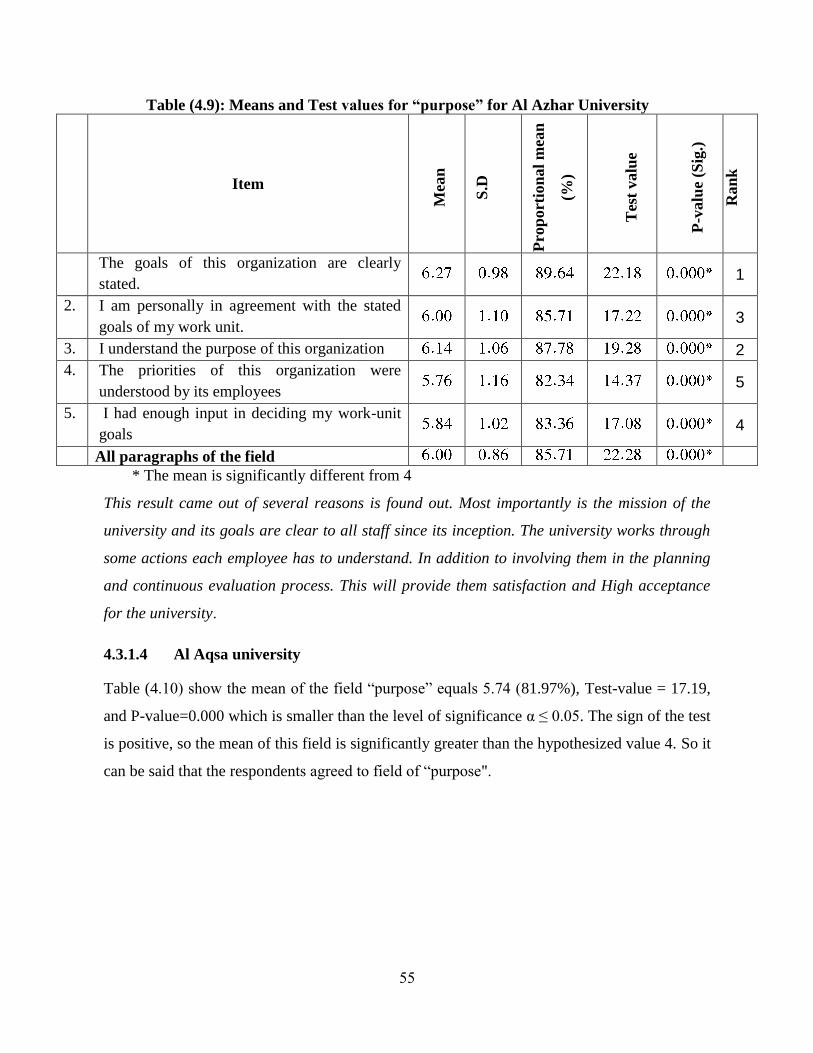
55
Table (4.9): Means and Test values for “purpose” for Al Azhar University
Item
Mea
n
S.D
Pro
port
ion
al
mea
n
(%)
Tes
t valu
e
P-v
alu
e (S
ig.)
Ran
k
1. The goals of this organization are clearly
stated. 1
2. I am personally in agreement with the stated
goals of my work unit. 3
3. I understand the purpose of this organization 2
4. The priorities of this organization were
understood by its employees 5
5. I had enough input in deciding my work-unit
goals 4
All paragraphs of the field
* The mean is significantly different from 4
This result came out of several reasons is found out. Most importantly is the mission of the
university and its goals are clear to all staff since its inception. The university works through
some actions each employee has to understand. In addition to involving them in the planning
and continuous evaluation process. This will provide them satisfaction and High acceptance
for the university.
4.3.1.4 Al Aqsa university
Table (4.10) show the mean of the field “purpose” equals 5.74 (81.97%), Test-value = 17.19,
and P-value=0.000 which is smaller than the level of significance α ≤ 0.05. The sign of the test
is positive, so the mean of this field is significantly greater than the hypothesized value 4. So it
can be said that the respondents agreed to field of “purpose".

56
Table (4.10): Means and Test values for “purpose” for Al Aqsa University
Item
Mea
n
S.D
Pro
port
ion
al
mea
n
(%)
Tes
t valu
e
P-v
alu
e (S
ig.)
Ran
k
1. The goals of this organization are clearly
stated.
2. I am personally in agreement with the stated
goals of my work unit.
3. I understand the purpose of this
organization
4. The priorities of this organization were
understood by its employees
5. I had enough input in deciding my work-
unit goals
All paragraphs of the field
* The mean is significantly different from 4
Although it had the third rank but having the percentage of (81.97 %( almost considered
positive. Even though it is a governmental University tracking the Ministry of Education and
Higher Education. The university had a clear and specific mission and objectives. Also a
strategic plans, operational and oversight plans. The university tries to apply this plan and to
evaluate the performance through accomplishment plans for all colleges and departments.
4.3.2 The structure in universities in Gaza strip plays significant role in the
Ability to achieve its objectives at level of significance α ≤0.05.
4.3.2.1 All university
Table (4.11) show the mean of the field “Structure” equals 5.30 (75.75%), Test-value = 19.12,
and P-value=0.000 which is smaller than the level of significance α ≤ 0.05. The sign of the test
is positive, so the mean of this field is significantly greater than the hypothesized value 4. So it
can be said that the respondents agreed to field of “Structure".
The results of the universities are converged, and consistent to achieve this hypothesis as
follows:
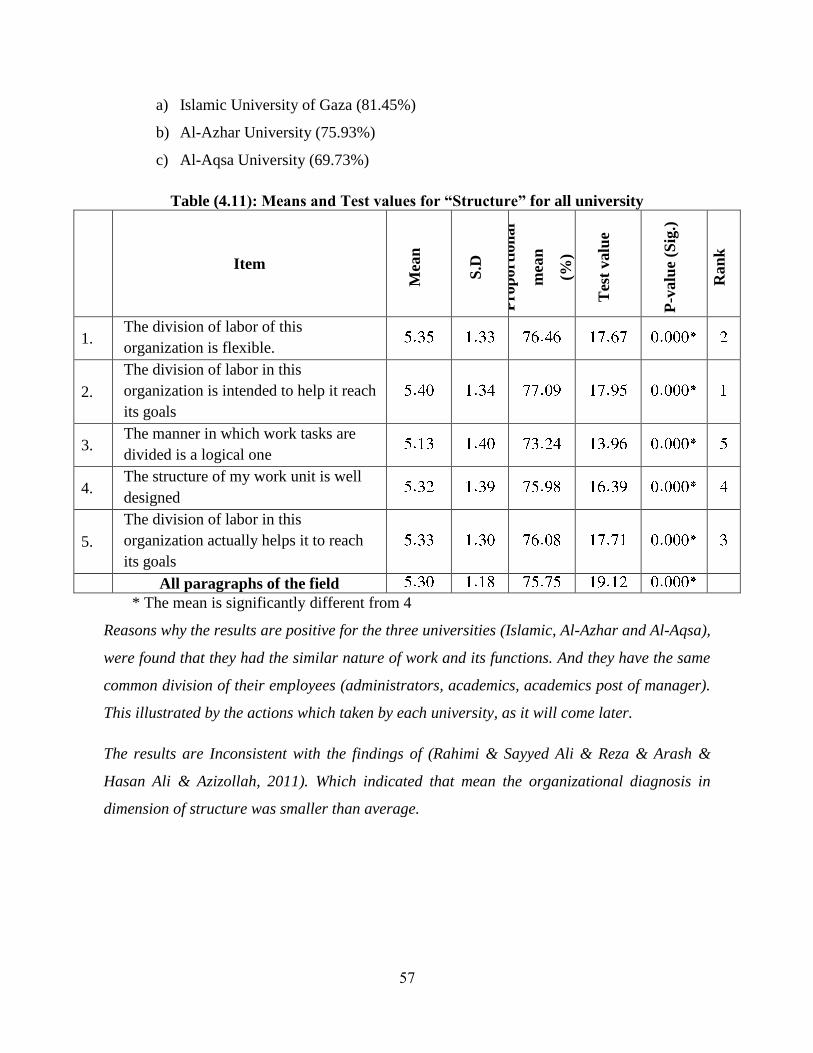
57
a) Islamic University of Gaza (81.45%)
b) Al-Azhar University (75.93%)
c) Al-Aqsa University (69.73%)
Table (4.11): Means and Test values for “Structure” for all university
Item
Mea
n
S.D
Pro
port
ion
al
mea
n
(%)
Tes
t valu
e
P-v
alu
e (S
ig.)
Ran
k
1. The division of labor of this
organization is flexible.
2.
The division of labor in this
organization is intended to help it reach
its goals
3. The manner in which work tasks are
divided is a logical one
4. The structure of my work unit is well
designed
5.
The division of labor in this
organization actually helps it to reach
its goals
All paragraphs of the field
* The mean is significantly different from 4
Reasons why the results are positive for the three universities (Islamic, Al-Azhar and Al-Aqsa),
were found that they had the similar nature of work and its functions. And they have the same
common division of their employees (administrators, academics, academics post of manager).
This illustrated by the actions which taken by each university, as it will come later.
The results are Inconsistent with the findings of (Rahimi & Sayyed Ali & Reza & Arash &
Hasan Ali & Azizollah, 2011). Which indicated that mean the organizational diagnosis in
dimension of structure was smaller than average.

58
4.3.2.2 Islamic university
Table (4.12) show the mean of the field “Structure” equals 5.70 (81.45%), Test-value = 21.75,
and P-value=0.000 which is smaller than the level of significance α ≤ 0.05. The sign of the test
is positive, so the mean of this field is significantly greater than the hypothesized value 4. So it
can be said that the respondents agreed to field of “Structure”
Table (4.12): Means and Test values for “Structure” for Islamic university
Item
Mea
n
S.D
Pro
port
ion
al
mea
n
(%
)
Tes
t valu
e
P-v
alu
e (S
ig.)
Ran
k
1. The division of labor of this organization is
flexible.
2. The division of labor in this organization is
intended to help it reach its goals
3. The manner in which work tasks are
divided is a logical one
4. The structure of my work unit is well
designed
5. The division of labor in this organization
actually helps it to reach its goals
All paragraphs of the field
* The mean is significantly different from 4
This ratio is found that came for several reasons. The most important one is since the
establishment of the university it has made great efforts in organizing its structure. Also
developing and modernizing its old legacy systems. In addition, applying Reengineering
project till having computing project. All this led them to have administrative and Academic
units which distributed with logical and systematic manner. There is an administrative
structural for each department in the university, in addition to the job description for each
employee.
4.3.2.3 Al Azhar university
Table (4.13) show the mean of the field “Structure” equals 5.31 (75.93%), Test-value = 10.72,
and P-value=0.000 which is smaller than the level of significance α ≤ 0.05. The sign of the test

59
is positive, so the mean of this field is significantly greater than the hypothesized value 4. So it
can be said that the respondents agreed to field of “Structure ".
Table (4.13): Means and Test values for “Structure” for Al Azhar University
Item
Mea
n
S.D
Pro
port
ion
al
mea
n
(%
)
Tes
t valu
e
P-v
alu
e (S
ig.)
Ran
k
1. The division of labor of this organization
is flexible.
2. The division of labor in this organization
is intended to help it reach its goals
3. The manner in which work tasks are
divided is a logical one
4. The structure of my work unit is well
designed
5. The division of labor in this organization
actually helps it to reach its goals
All paragraphs of the field
* The mean is significantly different from 4
These positive percentages were found out that came of several reasons. The most important is
the university had a clear organization structure depending on the administrative systems,
both horizontally and vertically. Work and employees tasks had only one fixed reference which
is the University administrative and the advisory committees have jurisdiction, in addition they
follow career recycling system periodically.
4.3.2.4 Al Aqsa university
Table (4.14) show the mean of the field “Structure” equals 4.88 (69.73%), Test-value = 6.55,
and P-value=0.000 which is smaller than the level of significance α ≤ 0.05. The sign of the test
is positive, so the mean of this field is significantly greater than the hypothesized value 4. So it
can be said that conclude that the respondents agreed to field of “Structure ".

60
Table (4.14): Means and Test values for “Structure” for Al Aqsa University
Item
Mea
n
S.D
Pro
port
ion
al
mea
n
(%
)
Tes
t valu
e
P-v
alu
e (S
ig.)
Ran
k
1. The division of labor of this organization
is flexible.
2. The division of labor in this organization is
intended to help it reach its goals
3. The manner in which work tasks are
divided is a logical one
4. The structure of my work unit is well
designed
5. The division of labor in this organization
actually helps it to reach its goals
All paragraphs of the field
* The mean is significantly different from 4
The rate of 70% almost is a positive that is found although there is a clear difference between
Alaqsa university and other two universities in the percentage, but. Perhaps the reasons that
led to it are Alaqsa University is governmental university. It keep track to the policies and
procedures of the government in employment. As well as it haven been affected by the internal
political factors between Gaza Strip and West Bank. For example: some staff university has
been appointed by Court of staff in Gaza Strip, others through Court of staff in West Bank.
4.3.3 The leadership in universities in Gaza strip plays significant role in the
Ability to achieve its objectives at level of significance α ≤0.05.
4.3.3.1 All university
Table (4.15) show the mean of the field “Leadership” equals 5.50 (78.59%), Test-value =
23.20, and P-value=0.000 which is smaller than the level of significance α ≤ 0.05. The sign of
the test is positive, so the mean of this field is significantly greater than the hypothesized value
4. So it can be said that the respondents agreed to field of “Leadership ".
The results are consistent universities to achieve this hypothesis as follows:

61
a) The Islamic University (83.51%),
b) Al-Azhar University (78.96%),
c) Al-Aqsa University (73.91%),
Table (4.15): Means and Test values for “Leadership” for all university
Item
Mea
n
S.D
Pro
port
ion
al
mea
n
(%
)
Tes
t valu
e
P-v
alu
e (S
ig.)
Ran
k
1. My immediate supervisor is supportive of
my efforts.
2. The leadership norms of this
Organization helps its progress.
3. This organization’s leadership efforts
result in the organization’s fulfillment of
its purposes.
4. It is clear to me whenever my boss
is attempting to guide my work efforts
5. I understand my boss’s efforts to influence
me and the other members of the work
unit
All paragraphs of the field
* The mean is significantly different from 4
There is a satisfaction in the three universities is found, on the role of leadership in different
percentage; the reasons will be reviewed for each university separately.
This research is consistent with the findings of the research (Rahimi & Sayyed Ali & Reza &
Arash & Hasan Ali & Azizollah, 2011). Which results indicated that mean the organizational
diagnosis in dimension of leadership was bigger than average.
4.3.3.2 Islamic university
Table (4.16) show the mean of the field “Leadership” equals 5.85 (83.51%), Test-value =
28.18, and P-value=0.000 which is smaller than the level of significance α ≤ 0.05. The sign of
the test is positive, so the mean of this field is significantly greater than the hypothesized value
4. So it can be said that the respondents agreed to field of “Leadership".

62
Table (4.16): Means and Test values for “Leadership” for Islamic university
Item
Mea
n
S.D
Pro
port
ion
al
mea
n
(%
)
Tes
t valu
e
P-v
alu
e (S
ig.)
Ran
k
1. My immediate supervisor is supportive of
my efforts.
2. The leadership norms of this
Organization helps its progress.
3. This organization’s leadership efforts result
in the organization’s fulfillment of its
purposes.
4. It is clear to me whenever my boss
is attempting to guide my work efforts
5. I understand my boss’s efforts to influence
me and the other members of the work unit
All paragraphs of the field
* The mean is significantly different from 4
The reasons are found that this result back to the support of the University for Continued
Development, through a number of policies. The most important policy is presenting a
scholarship abroad for scientific and career development. So students can provide new ideas
which may develop the university. In addition, the Council of the League changed every two
years. The period allowed for its survival is only four years, which increases productivity and
change for better. Also providing a new planning system, computerized system, and
supervisory procedures that followed in the university, lead to involve the employees at all
levels in planning and evaluation process.
4.3.3.3 Al Azhar university
Table (4.17) show the mean of the field “Leadership” equals 5.53 (78.96%), Test-value =
13.14, and P-value=0.000 which is smaller than the level of significance α ≤ 0.05. The sign of
the test is positive, so the mean of this field is significantly greater than the hypothesized value
4. So it can be said that the respondents agreed to field of “Leadership".

63
Table (4.17): Means and Test values for “Leadership” for Al Azhar University
Item
Mea
n
S.D
Pro
port
ion
al
mea
n
(%)
Tes
t valu
e
P-v
alu
e (S
ig.)
Ran
k
1. My immediate supervisor is supportive of
my efforts.
2. The leadership norms of this
Organization helps its progress.
3.
This organization’s leadership efforts result
in the organization’s fulfillment of its
purposes.
4. It is clear to me whenever my boss
is attempting to guide my work efforts
5. I understand my boss’s efforts to influence
me and the other members of the work unit
All paragraphs of the field
* The mean is significantly different from 4
The followed policy in the university is found regarding leadership led to this ratio. The most
important is leadership of the University Council variable periodically. This is an opportunity
to change and take the opportunities and renewal for ideas. In addition to the involvement of
employees in decision-making process and their views taken into consideration. Also the
reasons which led to this acceptance are the role of Leadership in providing a good university
environment. This can be showed by establishing new university buildings which qualified as a
branch of the south to Faculties of Arts, Education. The university work hard to open it soon
as they can. As well as some service-centers not only for students but also for society.
4.3.3.4 Al Aqsa university
Table (4.18) show the mean of the field “Leadership” equals 5.12 (73.19%), Test-value = 8.36,
and P-value=0.000 which is smaller than the level of significance α ≤ 0.05. The sign of the test
is positive, so the mean of this field is significantly greater than the hypothesized value 4. So it
can be said that the respondents agreed to field of “Leadership ".
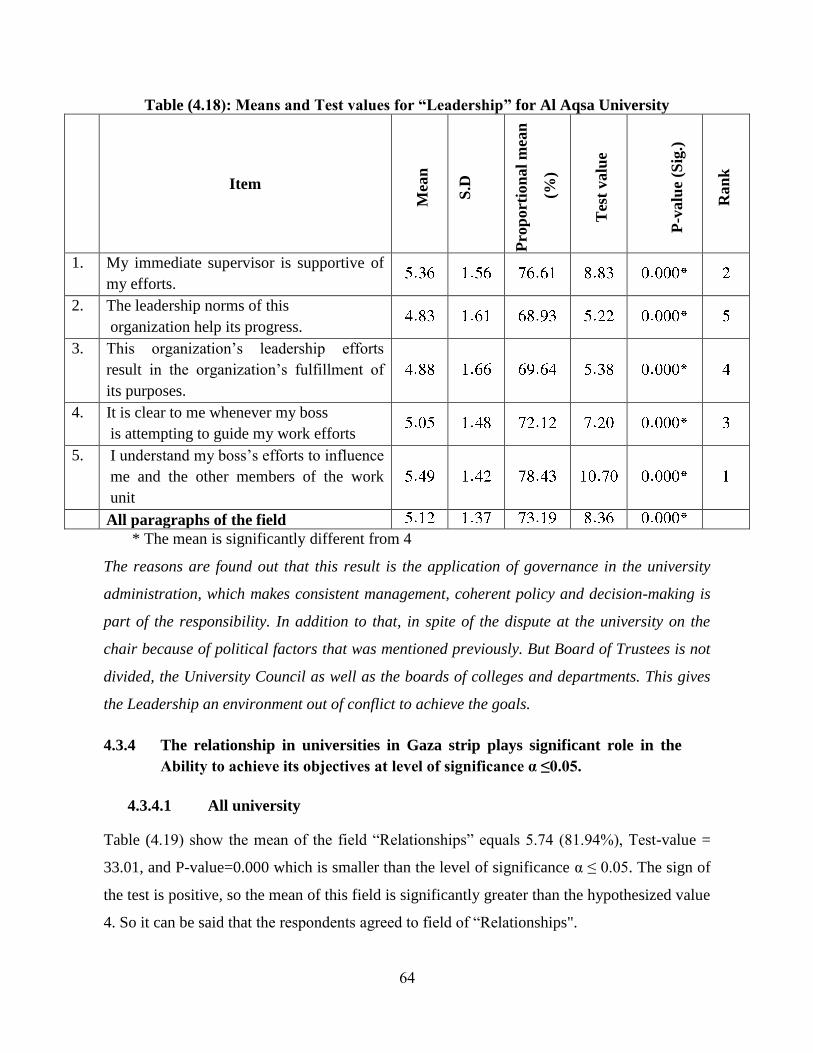
64
Table (4.18): Means and Test values for “Leadership” for Al Aqsa University
Item
Mea
n
S.D
Pro
port
ion
al
mea
n
(%
)
Tes
t valu
e
P-v
alu
e (S
ig.)
Ran
k
1. My immediate supervisor is supportive of
my efforts.
2. The leadership norms of this
organization help its progress.
3. This organization’s leadership efforts
result in the organization’s fulfillment of
its purposes.
4. It is clear to me whenever my boss
is attempting to guide my work efforts
5. I understand my boss’s efforts to influence
me and the other members of the work
unit
All paragraphs of the field
* The mean is significantly different from 4
The reasons are found out that this result is the application of governance in the university
administration, which makes consistent management, coherent policy and decision-making is
part of the responsibility. In addition to that, in spite of the dispute at the university on the
chair because of political factors that was mentioned previously. But Board of Trustees is not
divided, the University Council as well as the boards of colleges and departments. This gives
the Leadership an environment out of conflict to achieve the goals.
4.3.4 The relationship in universities in Gaza strip plays significant role in the
Ability to achieve its objectives at level of significance α ≤0.05.
4.3.4.1 All university
Table (4.19) show the mean of the field “Relationships” equals 5.74 (81.94%), Test-value =
33.01, and P-value=0.000 which is smaller than the level of significance α ≤ 0.05. The sign of
the test is positive, so the mean of this field is significantly greater than the hypothesized value
4. So it can be said that the respondents agreed to field of “Relationships".

65
The results are consistent universities to achieve this hypothesis as follows:
a) The Islamic University (85.53%),
b) Al-Azhar University (83.97%),
c) Al-Aqsa University (76.84%),
Table (4.19): Means and Test values for “Relationships” for all university
Item
Mea
n
S.D
Pro
port
ion
al
mea
n
(%
)
Tes
t valu
e
P-v
alu
e (S
ig.)
Ran
k
1. My relationship with my supervisor was a
Harmonious one.
2. I can always talk with someone at work if I
have a work-related problem
3. My relationships with members of my
work group are friendly as well as
professional
4. I have established the relationships that I
need to do my job properly
5. There is no evidence of unresolved conflict
in this organization
All paragraphs of the field
* The mean is significantly different from 4
The results were found out were positive because of that relationship as a variable depends on
other variables as the structure and leadership which sets the policies and procedure, which
governing the relations within the university. This will be clear during the next comments.
This research is consistent with the findings of the research (Rahimi & Sayyed Ali & Reza &
Arash & Hasan Ali & Azizollah, 2011). Which results indicated that mean the organizational
diagnosis in dimension of relationships was bigger than average.
4.3.4.2 Islamic university
Table (4.20) show the mean of the field “Relationships” equals 5.99 (85.53%), Test-value =
37.63, and P-value=0.000 which is smaller than the level of significance α ≤ 0.05. The sign of

66
the test is positive, so the mean of this field is significantly greater than the hypothesized value
4. So it can be said that the respondents agreed to field of “Relationships".
Table (4.20): Means and Test values for “Relationships” for Islamic university
Item
Mea
n
S.D
Pro
port
ion
al
mea
n
(%
)
Tes
t valu
e
P-v
alu
e (S
ig.)
Ran
k
1. My relationship with my supervisor was a
Harmonious one.
2. I can always talk with someone at work if I
have a work-related problem.
3. My relationships with members of my work
group are friendly as well as professional
4. I have established the relationships that I
need to do my job properly
5. There is no evidence of unresolved conflict
in this organization
All paragraphs of the field
* The mean is significantly different from 4
The reasons are found led to this result is that the relations Organized either between
individuals themselves or between faculties and departments. Each employee has a job
description. Each department has a clear structure. But what make the relationship internally
strong are the intellectual trends which are similar in the majority of workers at the university.
This facilitates communication between them, and strengthens social relations, as well as the
role of the Union of Workers and the Public Relations Department also.
4.3.4.3 Al Azhar University
Table (4.21) show the mean of the field “Relationships” equals 5.88 (83.97%), Test-value =
20.58, and P-value=0.000 which is smaller than the level of significance α ≤ 0.05. The sign of
the test is positive, so the mean of this field is significantly greater than the hypothesized value
4. So it can be said that the respondents agreed to field of “Relationships".

67
Table (4.21): Means and Test values for “Relationships” for Al Azhar University
Item
Mea
n
S.D
Pro
port
ion
al
mea
n
(%
)
Tes
t valu
e
P-v
alu
e (S
ig.)
Ran
k
1. My relationship with my supervisor was
a Harmonious one.
2. I can always talk with someone at work
if I have a work-related problem
3. My relationships with members of my
work group are friendly as well as
professional
4. I have established the relationships that I
need to do my job properly
5. There is no evidence of unresolved
conflict in this organization
All paragraphs of the field
* The mean is significantly different from 4
The university management procedures are found concerning the organizational structure and
the mechanism of distribution tasks led to create a coherent professional environment, and
harmonious relations. Where it governs by the university policy which organized the
relationship between the faculties, departments, and employees both horizontal and vertical.
4.3.4.4 Al Aqsa university
Table (4.22) show the mean of the field “Relationships” equals 5.35 (76.48%), Test-value =
12.40, and P-value=0.000 which is smaller than the level of significance α ≤ 0.05. The sign of
the test is positive, so the mean of this field is significantly greater than the hypothesized value
4. So it can be said that the respondents agreed to field of “Relationships".

68
Table (4.22): Means and Test values for “Relationships” for Al Aqsa University
Item
Mea
n
S.D
Pro
port
ion
al
mea
n
(%
)
Tes
t valu
e
P-v
alu
e (S
ig.)
Ran
k
1. My relationship with my supervisor was a
Harmonious one.
2. I can always talk with someone at work if I
have a work-related problem
3. My relationships with members of my work
group are friendly as well as professional
4. I have established the relationships that I
need to do my job properly
5. There is no evidence of unresolved conflict
in this organization
All paragraphs of the field
* The mean is significantly different from 4
After the search, a number of reasons were suggested that led to this result. The most
important that there is a Department of Cultural Affairs and Public Relations, this is
responsible for the consolidation of professional and social relations between the workers,
faculties and departments.
4.3.5 The reward in universities in Gaza strip plays significant role in the Ability
to achieve its objectives at level of significance α ≤0.05.
4.3.5.1 All university
Table (4.23) show the mean of the field “Reward” equals 5.26 (75.17%), Test-value = 18.37,
and P-value=0.000 which is smaller than the level of significance α ≤ 0.05. The sign of the test
is positive, so the mean of this field is significantly greater than the hypothesized value 4. So it
can be said that the respondents agreed to field of “Reward ".
The results of the universities agreed upon achieving this hypothesis; however, Al-Azhar
University precedes the Islamic University as follows:

69
a) Al-Azhar University (80.90 %),
b) The Islamic University (79.45 %),
c) Al-Aqsa University (65.76 %),
Table (4.23): Means and Test values for “Reward” for all university
Item
Mea
n
S.D
Pro
port
ion
al
mea
n
(%
)
Tes
t valu
e
P-v
alu
e (S
ig.)
Ran
k
1. My job offers me the opportunity to grow
as a person.
2. The pay scale and benefits of this
organization treat each employee
equitably
3. The opportunity for promotion exists in
this organization
4. The salary that I receive is commensurate
with the job that I perform
5. All tasks to be accomplished are
associated with incentives
All paragraphs of the field
* The mean is significantly different from 4
The results were found are positive because the relationships, as a variable, depends on other
variables such as structure and leadership that sets the policies and procedures that organize
the relations inside the university, which will be clear in the coming comments.
This research is consistent with the findings of the research (Rahimi & Sayyed Ali & Reza &
Arash & Hasan Ali & Azizollah, 2011). Which results indicated that mean the organizational
diagnosis in dimension of reward was bigger than average.
4.3.5.2 Islamic university
Table (4.24) show the mean of the field “Reward” equals 5.56 (79.45%), Test-value = 19.92,
and P-value=0.000 which is smaller than the level of significance α ≤ 0.05. The sign of the test

70
is positive, so the mean of this field is significantly greater than the hypothesized value 4. So it
can be said that the respondents agreed to field of “Reward ".
Table (4.24): Means and Test values for “Reward” for Islamic university
Item
Mea
n
S.D
Pro
po
rtio
na
l m
ean
(%
)
Tes
t valu
e
P-v
alu
e (S
ig.)
Ran
k
1. My job offers me the opportunity to grow as
a person.
2. The pay scale and benefits of this
organization treat each employee equitably
3. The opportunity for promotion exists in this
organization
4. The salary that I receive is commensurate
with the job that I perform
5. All tasks to be accomplished are associated
with incentives
All paragraphs of the field
* The mean is significantly different from 4
Although the Islamic University came in second rank after to Al-Azhar, but this ratio was
found is positive and advanced in light of the general conditions that affect the financial
position of the University. The higher education suspended its financial contribution to the
University since 2007 for political reasons, in addition the University exposed to bombing
during the aggression on Gaza in 2008, 2012 and 2014, which required the providing an
additional expenses on the budget. Also the three universities had the same reason which is
they cannot raise up hours prices since 1999 for example at the Islamic University. This led to
the stability of rate input with continuous increase in the rate of expenditure.
But all these reasons did not prevent the university to apply unified staff system by the
minimum. So this led to increase receivables, private insurance and employee’s pensions.

71
4.3.5.3 Al Azhar university
Table (4.25) show the mean of the field “Reward” equals 5.66 (80.90%), Test-value = 15.59,
and P-value=0.000 which is smaller than the level of significance α ≤ 0.05. The sign of the test
is positive, so the mean of this field is significantly greater than the hypothesized value 4. So it
can be said that the respondents agreed to field of “Reward ".
Table (4.25): Means and Test values for “Reward” for Al Azhar University
Item
Mea
n
S.D
Pro
port
ion
al
mea
n
(%
)
Tes
t valu
e
P-v
alu
e
(Sig
.)
Ran
k
1. My job offers me the opportunity to grow as
a person.
2. The pay scale and benefits of this
organization treat each employee equitably
3. The opportunity for promotion exists in this
organization
4. The salary that I receive is commensurate
with the job that I perform
5. All tasks to be accomplished are associated
with incentives
All paragraphs of the field
* The mean is significantly different from 4
As a result of the research, the reasons are found of this result lies behind the financial system
that Al-Azhar University follows which is fair and equitable for several reasons, mainly its
apply to the common cadre system, unlike the Islamic University , which approved it but still
on the list of entitlements.
Fixing the price of Jordanian Dinar to be 5 and a half, in addition to providing living
allowance each year, and for extra-time, but the university stopped the scholarship out
process because of the general economic situation.
The rate of the question is found here, which states that there are opportunities for promotion
at the university is the least compared to the rates of other questions, while they are in conflict
with the viewpoint of the university administration that there are opportunities for promotion,
this conflict is found because these opportunities closer to academics and far somewhat to

72
administrators. According the nature of progress and development in the job, and who were
the largest percentage in the sample was selected for testing.
4.3.5.4 Al Aqsa university
Table (4.26) show the mean of the field “Reward” equals 4.60 (65.76%), Test-value = 4.45,
and P-value=0.000 which is smaller than the level of significance α ≤ 0.05. The sign of the test
is positive, so the mean of this field is significantly greater than the hypothesized value 4. So it
can be said that the respondents agreed to field of “Reward "
Table (4.26): Means and Test values for “Reward” for Al Aqsa university
Item M
ean
S.D
Pro
port
ion
al
mea
n
(%
)
Tes
t valu
e
P-v
alu
e (S
ig.)
Ran
k
1. My job offers me the opportunity to grow as
a person.
2. The pay scale and benefits of this
organization treat each employee equitably
3. The opportunity for promotion exists in this
organization
4. The salary that I receive is commensurate
with the job that I perform
5. All tasks to be accomplished are associated
with incentives
All paragraphs of the field
* The mean is significantly different from 4
The ratio of the employees acceptance was found in Al-Aqsa University is low compared to
other universities, it was expected that because the university is governmental and follows the
Civil Service Law in its financial system and payment, where the university does not have the
decision about it; however, there is a special bonus related to Higher university education for
university staff.

73
4.3.6 The helpful mechanism in universities in Gaza strip plays significant role in
the Ability to achieve its objectives at level of significance α ≤0.05.
4.3.6.1 All university
Table (4.27) show the mean of the field “Helpful Mechanisms” equals 5.62 (80.28%), Test-
value = 29.43, and P-value=0.000 which is smaller than the level of significance α ≤ 0.05. The
sign of the test is positive, so the mean of this field is significantly greater than the
hypothesized value 4. So it can be said that the respondents agreed to field of “Helpful
Mechanisms ".
The results of the universities agreed upon achieving this hypothesis as follows:
a) The Islamic University (84.54%),
b) Al-Azhar University (80.60%),
c) Al-Aqsa University (75.63%),
Table (4.27): Means and Test values for “Helpful Mechanisms” for all university
Item
Mea
n
S.D
Pro
port
ion
al
mea
n
(%)
Tes
t valu
e
P-v
alu
e (S
ig.)
Ran
k
1. My immediate supervisor has ideas that are
helpful to me and my work group
2. I have the information that I need to do a
good job.
3. This organization has adequate
mechanisms for binding itself together
4. Other work units are helpful to my work
unit whenever assistance is requested
5.
This organization’s planning and control
efforts are helpful to its growth and
development
All paragraphs of the field
* The mean is significantly different from 4
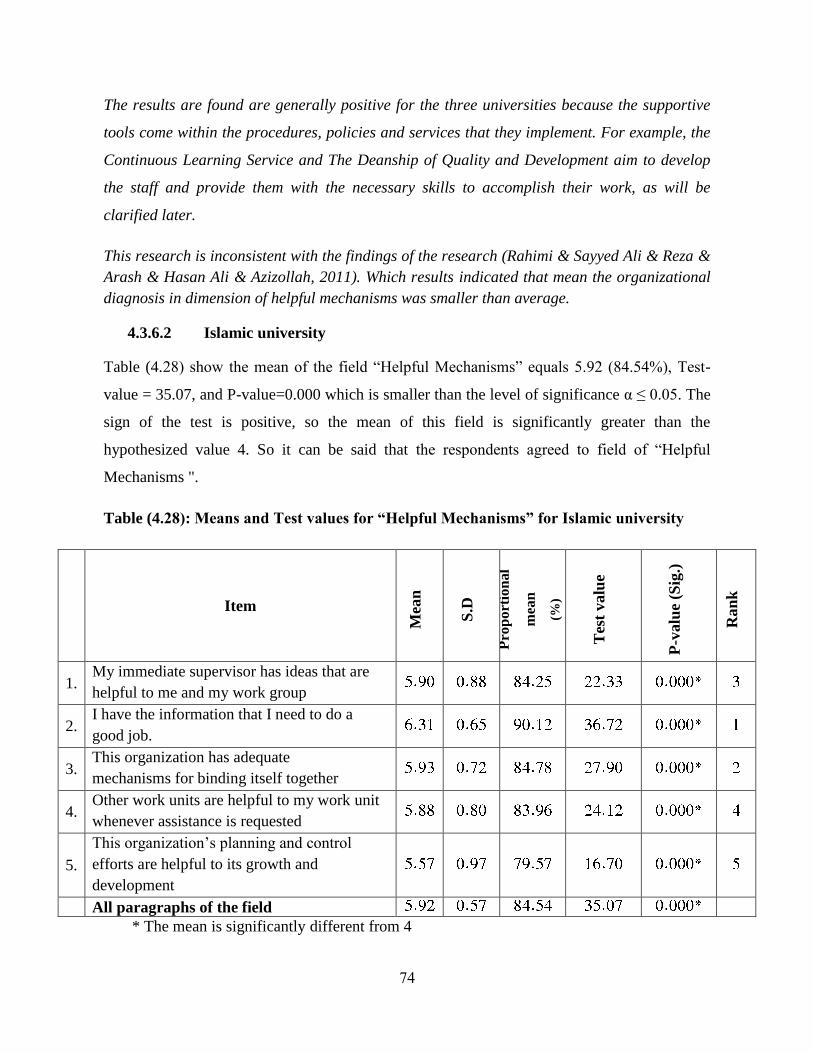
74
The results are found are generally positive for the three universities because the supportive
tools come within the procedures, policies and services that they implement. For example, the
Continuous Learning Service and The Deanship of Quality and Development aim to develop
the staff and provide them with the necessary skills to accomplish their work, as will be
clarified later.
This research is inconsistent with the findings of the research (Rahimi & Sayyed Ali & Reza &
Arash & Hasan Ali & Azizollah, 2011). Which results indicated that mean the organizational
diagnosis in dimension of helpful mechanisms was smaller than average.
4.3.6.2 Islamic university
Table (4.28) show the mean of the field “Helpful Mechanisms” equals 5.92 (84.54%), Test-
value = 35.07, and P-value=0.000 which is smaller than the level of significance α ≤ 0.05. The
sign of the test is positive, so the mean of this field is significantly greater than the
hypothesized value 4. So it can be said that the respondents agreed to field of “Helpful
Mechanisms ".
Table (4.28): Means and Test values for “Helpful Mechanisms” for Islamic university
Item
Mea
n
S.D
Pro
port
ion
al
mea
n
(%)
Tes
t valu
e
P-v
alu
e (S
ig.)
Ran
k
1. My immediate supervisor has ideas that are
helpful to me and my work group
2. I have the information that I need to do a
good job.
3. This organization has adequate
mechanisms for binding itself together
4. Other work units are helpful to my work unit
whenever assistance is requested
5.
This organization’s planning and control
efforts are helpful to its growth and
development
All paragraphs of the field
* The mean is significantly different from 4
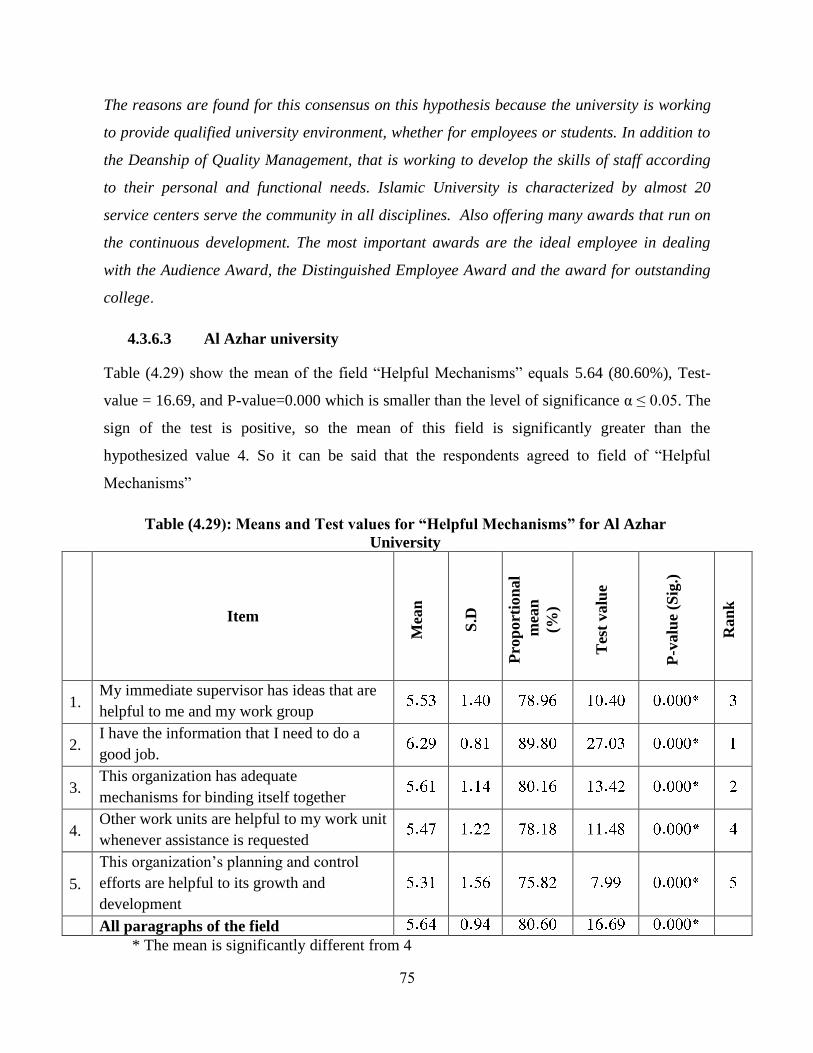
75
The reasons are found for this consensus on this hypothesis because the university is working
to provide qualified university environment, whether for employees or students. In addition to
the Deanship of Quality Management, that is working to develop the skills of staff according
to their personal and functional needs. Islamic University is characterized by almost 20
service centers serve the community in all disciplines. Also offering many awards that run on
the continuous development. The most important awards are the ideal employee in dealing
with the Audience Award, the Distinguished Employee Award and the award for outstanding
college.
4.3.6.3 Al Azhar university
Table (4.29) show the mean of the field “Helpful Mechanisms” equals 5.64 (80.60%), Test-
value = 16.69, and P-value=0.000 which is smaller than the level of significance α ≤ 0.05. The
sign of the test is positive, so the mean of this field is significantly greater than the
hypothesized value 4. So it can be said that the respondents agreed to field of “Helpful
Mechanisms”
Table (4.29): Means and Test values for “Helpful Mechanisms” for Al Azhar
University
Item
Mea
n
S.D
Pro
port
ion
al
mea
n
(%)
Tes
t valu
e
P-v
alu
e (S
ig.)
Ran
k
1. My immediate supervisor has ideas that are
helpful to me and my work group
2. I have the information that I need to do a
good job.
3. This organization has adequate
mechanisms for binding itself together
4. Other work units are helpful to my work unit
whenever assistance is requested
5.
This organization’s planning and control
efforts are helpful to its growth and
development
All paragraphs of the field
* The mean is significantly different from 4

76
The results are found that Al-Azhar University is working among a single administrative
system, and depends on specialized advisory committees in planning and monitoring, in
addition to its continuous work to develop and qualify the staff through implementing
workshops and training services provided by the Center of Continuous Learning.
4.3.6.4 Al Aqsa university
Table (4.30) show the mean of the field “Helpful Mechanisms” equals 5.29 (75.63%), Test-
value = 11.25, and P-value=0.000 which is smaller than the level of significance α ≤ 0.05. The
sign of the test is positive, so the mean of this field is significantly greater than the
hypothesized value 4. So it can be said that the respondents agreed to field of “Helpful
Mechanisms ".
Table (4.30): Means and Test values for “Helpful Mechanisms” for Al Aqsa
University
Item
Mea
n
S.D
Pro
port
ion
al
mea
n
(%)
Tes
t valu
e
P-v
alu
e (S
ig.)
Ran
k
1. My immediate supervisor has ideas that are
helpful to me and my work group
2. I have the information that I need to do a
good job.
3. This organization has adequate
mechanisms for binding itself together
4. Other work units are helpful to my work unit
whenever assistance is requested
5.
This organization’s planning and control
efforts are helpful to its growth and
development
All paragraphs of the field
* The mean is significantly different from 4
The results are found that there is no big difference between the supportive tools offered by the
university such as planning, monitoring and different information systems, and other
universities .Deanship of Continuous Learning is working to develop and motivate employees.
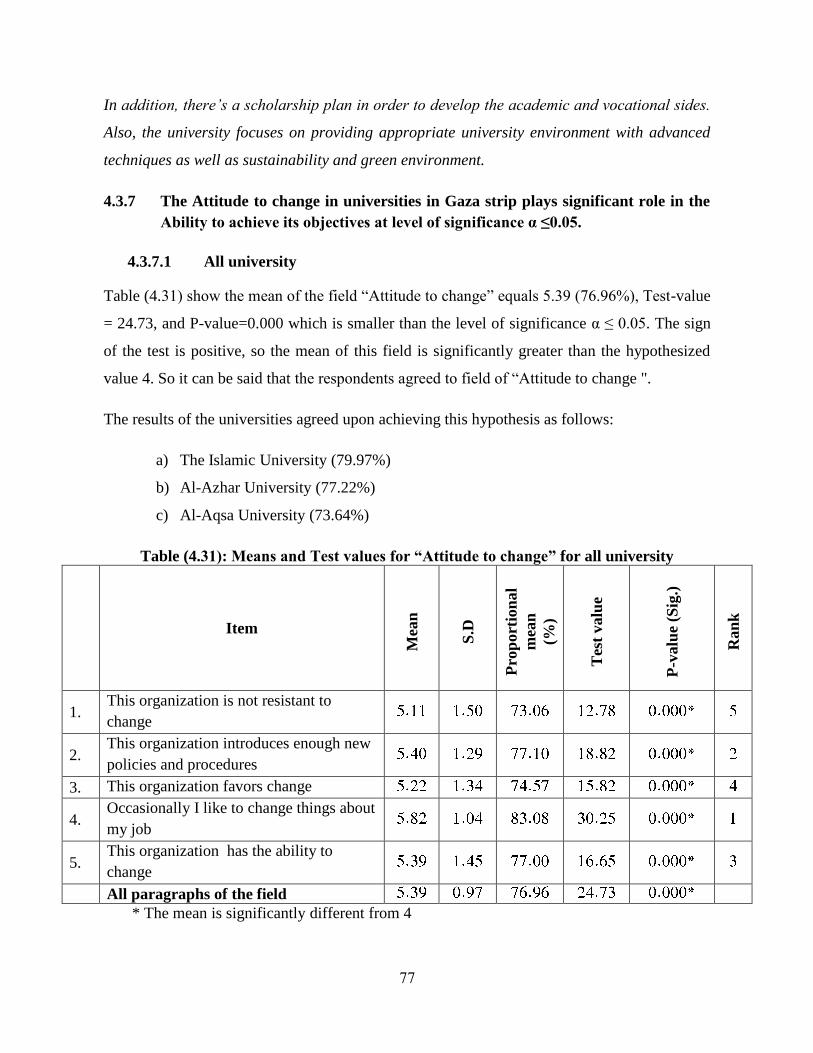
77
In addition, there’s a scholarship plan in order to develop the academic and vocational sides.
Also, the university focuses on providing appropriate university environment with advanced
techniques as well as sustainability and green environment.
4.3.7 The Attitude to change in universities in Gaza strip plays significant role in the
Ability to achieve its objectives at level of significance α ≤0.05.
4.3.7.1 All university
Table (4.31) show the mean of the field “Attitude to change” equals 5.39 (76.96%), Test-value
= 24.73, and P-value=0.000 which is smaller than the level of significance α ≤ 0.05. The sign
of the test is positive, so the mean of this field is significantly greater than the hypothesized
value 4. So it can be said that the respondents agreed to field of “Attitude to change ".
The results of the universities agreed upon achieving this hypothesis as follows:
a) The Islamic University (79.97%)
b) Al-Azhar University (77.22%)
c) Al-Aqsa University (73.64%)
Table (4.31): Means and Test values for “Attitude to change” for all university
Item
Mea
n
S.D
Pro
port
ion
al
mea
n
(%)
Tes
t valu
e
P-v
alu
e (S
ig.)
Ran
k
1. This organization is not resistant to
change
2. This organization introduces enough new
policies and procedures
3. This organization favors change
4. Occasionally I like to change things about
my job
5. This organization has the ability to
change
All paragraphs of the field
* The mean is significantly different from 4

78
The results were found were positive, and nearly close. Also, the question that received the
highest percentage of admission in three universities is "Occasionally I like to change things
about my job", perhaps because it reflects the desire of the person himself to change while
other questions expresses the desire of the university desire to change, and also because the
change is a result of existing policies that attached to other variables, as will be seen in the
next comments
4.3.7.2 Islamic university
Table (4.32) show the mean of the field “Attitude to change” equals 5.60 (79.97%), Test-value
= 22.29, and P-value=0.000 which is smaller than the level of significance α ≤ 0.05. The sign
of the test is positive, so the mean of this field is significantly greater than the hypothesized
value 4. So it can be said that the respondents agreed to field of “Attitude to change ".
Table (4.32): Means and Test values for “Attitude to change” for Islamic
university
Item
Mea
n
S.D
Pro
port
ion
al
mea
n
(%)
Tes
t valu
e
P-v
alu
e (S
ig.)
Ran
k
1. This organization is not resistant to change
2. This organization introduces enough new
policies and procedures
3. This organization favors change
4. Occasionally I like to change things about
my job
5. This organization has the ability to change
All paragraphs of the field
* The mean is significantly different from 4
The university's position towards change is expected as a result from other variables for both
have direct extrusive correlation. Causes that justify such result have been previously
mentioned mainly the leadership's position towards change, working on commissioning envoys
to develop and bring new ideas, laws of universities boards' terms and job rotation. All of
these reasons

79
4.3.7.3 Al Azhar University
Table (4.33) show the mean of the field “Attitude to change” equals 5.41 (77.22%), Test-value
= 13.52, and P-value=0.000 which is smaller than the level of significance α ≤ 0.05. The sign
of the test is positive, so the mean of this field is significantly greater than the hypothesized
value 4. So it can be said that the respondents agreed to field of “Attitude to change ".
Table (4.33): Means and Test values for “Attitude to change” for Al Azhar
university
Item
Mea
n
S.D
Pro
port
ion
al
mea
n
(%)
Tes
t valu
e
P-v
alu
e (S
ig.)
Ran
k
1. This organization is not resistant to change
2. This organization introduces enough new
policies and procedures
3. This organization favors change
4. Occasionally I like to change things about
my job
5. This organization has the ability to change
All paragraphs of the field
* The mean is significantly different from 4
The university position of change is found is positive, because many of the actions carried out
by the University that mentioned previously, such as changing the University Council
periodically, in addition to job recycling, and the search for lasting experiences and ideas that
work to develop the university.
4.3.7.4 Al Aqsa university
Table (4.34) show the mean of the field “Attitude to change” equals 5.15 (73.64%), Test-value
= 10.53, and P-value=0.000 which is smaller than the level of significance α ≤ 0.05. The sign
of the test is positive, so the mean of this field is significantly greater than the hypothesized
value 4. So it can be said that the respondents agreed to field of “Attitude to change".

80
Table (4.34): Means and Test values for “Attitude to change” for Al Aqsa
university
Item
Mea
n
S.D
Pro
port
ion
al
mea
n
(%)
Tes
t valu
e
P-v
alu
e (S
ig.)
Ran
k
1. This organization is not resistant to change
2. This organization introduces enough new
policies and procedures
3. This organization favors change
4. Occasionally I like to change things about my
job
5. This organization has the ability to change
All paragraphs of the field
* The mean is significantly different from 4
The university position of change is found is positive, because many of the actions carried out
by the University that mentioned previously, such as changing the University Council
periodically, in addition to job recycling, and the search for lasting experiences and ideas that
work to develop the university.
a) There is a statistically significant difference among the responses at significance
level (α ≤ 0.05) in regard to “The Organizational Diagnoses Based on Six Box
Model in Universities of Gaza Strip” due to Personal data.
This hypothesis can be divided into the following sub-hypotheses:
- There is a statistically significant difference among the responses at significance
level (α ≤ 0.05) in regard to “The Organizational Diagnoses Based on Six Box
Model in Universities of Gaza Strip” due to university.
Table (4.35) shows that the p-value (Sig.) is smaller than the level of significance α ≤ 0.05 for
each field, then there is significant difference among the respondents toward each field due to
university. So it can be said that the personal characteristics’ university has significant effect
on each field.
The university type is found effects the results, where each university has its own procedures
and policies, in most of the statistical indications are noted that the ratios are close between
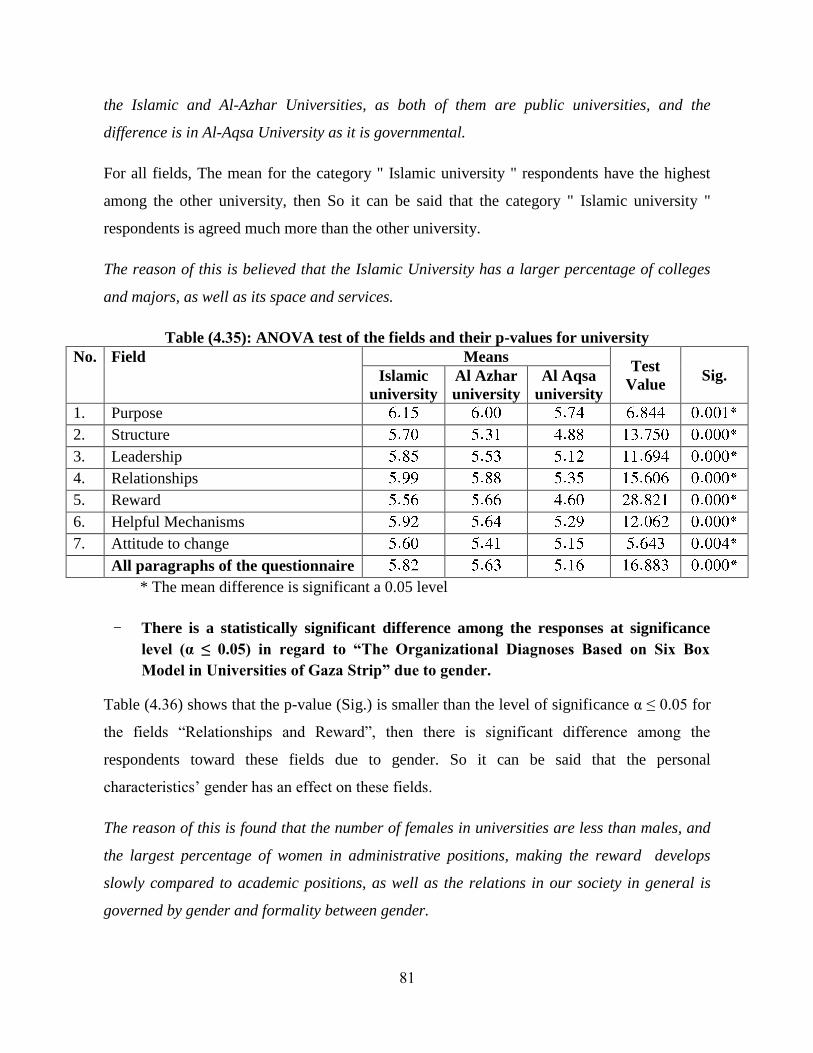
81
the Islamic and Al-Azhar Universities, as both of them are public universities, and the
difference is in Al-Aqsa University as it is governmental.
For all fields, The mean for the category " Islamic university " respondents have the highest
among the other university, then So it can be said that the category " Islamic university "
respondents is agreed much more than the other university.
The reason of this is believed that the Islamic University has a larger percentage of colleges
and majors, as well as its space and services.
Table (4.35): ANOVA test of the fields and their p-values for university
No. Field Means Test
Value Sig. Islamic
university
Al Azhar
university
Al Aqsa
university
1. Purpose
2. Structure
3. Leadership
4. Relationships
5. Reward
6. Helpful Mechanisms
7. Attitude to change
All paragraphs of the questionnaire
* The mean difference is significant a 0.05 level
- There is a statistically significant difference among the responses at significance
level (α ≤ 0.05) in regard to “The Organizational Diagnoses Based on Six Box
Model in Universities of Gaza Strip” due to gender.
Table (4.36) shows that the p-value (Sig.) is smaller than the level of significance α ≤ 0.05 for
the fields “Relationships and Reward”, then there is significant difference among the
respondents toward these fields due to gender. So it can be said that the personal
characteristics’ gender has an effect on these fields.
The reason of this is found that the number of females in universities are less than males, and
the largest percentage of women in administrative positions, making the reward develops
slowly compared to academic positions, as well as the relations in our society in general is
governed by gender and formality between gender.
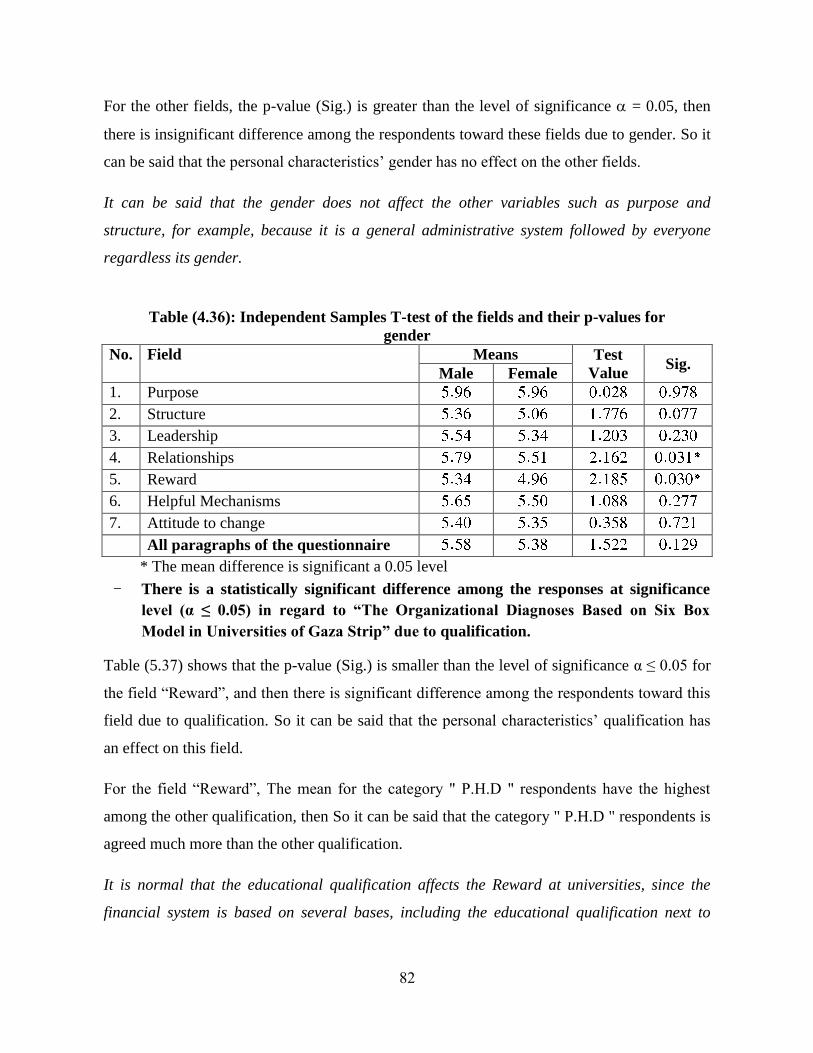
82
For the other fields, the p-value (Sig.) is greater than the level of significance = 0.05, then
there is insignificant difference among the respondents toward these fields due to gender. So it
can be said that the personal characteristics’ gender has no effect on the other fields.
It can be said that the gender does not affect the other variables such as purpose and
structure, for example, because it is a general administrative system followed by everyone
regardless its gender.
Table (4.36): Independent Samples T-test of the fields and their p-values for
gender
No. Field Means Test
Value Sig.
Male Female
1. Purpose
2. Structure
3. Leadership
4. Relationships
5. Reward
6. Helpful Mechanisms
7. Attitude to change
All paragraphs of the questionnaire
* The mean difference is significant a 0.05 level
- There is a statistically significant difference among the responses at significance
level (α ≤ 0.05) in regard to “The Organizational Diagnoses Based on Six Box
Model in Universities of Gaza Strip” due to qualification.
Table (5.37) shows that the p-value (Sig.) is smaller than the level of significance α ≤ 0.05 for
the field “Reward”, and then there is significant difference among the respondents toward this
field due to qualification. So it can be said that the personal characteristics’ qualification has
an effect on this field.
For the field “Reward”, The mean for the category " P.H.D " respondents have the highest
among the other qualification, then So it can be said that the category " P.H.D " respondents is
agreed much more than the other qualification.
It is normal that the educational qualification affects the Reward at universities, since the
financial system is based on several bases, including the educational qualification next to

83
other reasons, and there is a direct relation between higher educational qualification and
Reward.
For the other fields, the p-value (Sig.) is greater than the level of significance α ≤ 0.05, then
there is insignificant difference among the respondents toward these fields due to qualification.
So it can be said that the personal characteristics’ qualification has no effect on the other
fields.
The results are found that the lack of qualification does not effect of other variables, since it
includes all degrees and shared by everyone, such a purpose, and the administrative positions
that based on experience next to academic qualification.
Table (4.37): ANOVA test of the fields and their p-values for Qualification
No. Field Means Test
Value Sig.
Bachelor Master P.H.D
1. Purpose
2. Structure
3. Leadership
4. Relationships
5. Reward
6. Helpful Mechanisms
7. Attitude to change
All paragraphs of the questionnaire
* The mean difference is significant a 0.05 level
- There is a statistically significant difference among the responses at significance
level (α ≤ 0.05) in regard to “The Organizational Diagnoses Based on Six Box
Model in Universities of Gaza Strip” due to age.
Table (4.38) shows that the p-value (Sig.) is smaller than the level of significance α ≤ 0.05 for
the field “Reward”, and then there is significant difference among the respondents toward this
field due to age. So it can be said that the personal characteristics’ age has an effect on this
field.
For the field “Reward”, The mean for the category " 40 – less than 50 years " respondents
have the highest among the other age, then so it can be said that the category " 40 – less than
50 years " respondents is agreed much more than the other age.

84
As mentioned earlier, there are multiple causes affecting the reward, among them is age that
was seen, through year experience in work, the age group of 40-fewer than 50 are the most
affected, that was seen, because they have spent many years on work.
For the other fields, the p-value (Sig.) is greater than the level of significance = 0.05, then
there is insignificant difference among the respondents toward these fields due to age. So it
can be said that the personal characteristics’ age has no effect on the other fields.
Other variables are found depend on the administrative system ,purpose structure and
leaderships For example, which relates back to the competence and experience as well as
other reasons, and that age does not affect them since it is governed by administrative systems,
regardless the age
Table (4.38): ANOVA test of the fields and their p-values for age
No. Field
Means
Test
Value Sig.
20 – less
than 30
years
30 – less
than 40
years
40 – less
than 50
years
50 years
and
older
1. Purpose
2. Structure
3. Leadership
4. Relationships
5. Reward
6. Helpful Mechanisms
7. Attitude to change
All paragraphs of the questionnaire
* The mean difference is significant a 0.05 level
- There is a statistically significant difference among the responses at significance
level (α ≤ 0.05) in regard to “The Organizational Diagnoses Based on Six Box
Model in Universities of Gaza Strip” due to job title.
Table (4.39) shows that the p-value (Sig.) is smaller than the level of significance α ≤ 0.05 for
the field “Reward”, and then there is significant difference among the respondents toward this
field due to job title. So it can be said that the personal characteristics’ job title has an effect on
this field.

85
For the field “Reward”, The mean for the category " Academics and administrators "
respondents have the highest among the other job title, then So it can be said that the category
" Academics and administrators " respondents is agreed much more than the other job title.
The result is found here that job title affects the Reward because each job title has certain
tasks differ from another, and it has financial benefits related to it, and whenever the Job Title
is higher, the Reward will be larger, so that academics class that has management positions in
higher ratios, because their job tasks are academic and administrative together, that is found.
For the other fields, the p-value (Sig.) is greater than the level of significance = 0.05, then
there is insignificant difference among the respondents toward these fields due to job title. So
it can be said that the personal characteristics’ job title has no effect on the other fields.
Here the job title does not effect on other variables, structure and relationships for example,
because it is ruled by the General administrative system, and follow its all levels and governs
all relationships.
Table (4.39): ANOVA test of the fields and their p-values for job title
No. Field
Means Test
Value Sig.
administrators Academics Academics and
administrators
1. Purpose
2. Structure
3. Leadership
4. Relationships
5. Reward
6. Helpful Mechanisms
7. Attitude to change
All paragraphs of the
questionnaire
* The mean difference is significant a 0.05 level.
- There is a statistically significant difference among the responses at significance
level (α ≤ 0.05) in regard to “The Organizational Diagnoses Based on Six Box
Model in Universities of Gaza Strip” due to years of experience.
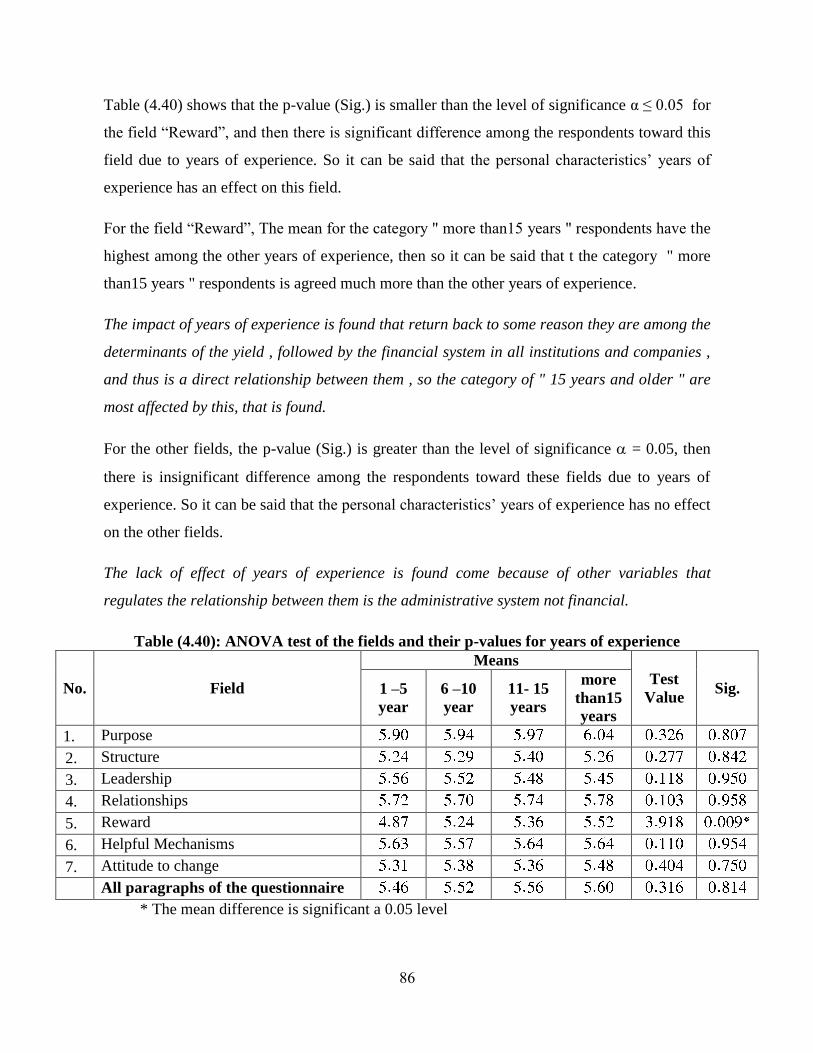
86
Table (4.40) shows that the p-value (Sig.) is smaller than the level of significance α ≤ 0.05 for
the field “Reward”, and then there is significant difference among the respondents toward this
field due to years of experience. So it can be said that the personal characteristics’ years of
experience has an effect on this field.
For the field “Reward”, The mean for the category " more than15 years " respondents have the
highest among the other years of experience, then so it can be said that t the category " more
than15 years " respondents is agreed much more than the other years of experience.
The impact of years of experience is found that return back to some reason they are among the
determinants of the yield , followed by the financial system in all institutions and companies ,
and thus is a direct relationship between them , so the category of " 15 years and older " are
most affected by this, that is found.
For the other fields, the p-value (Sig.) is greater than the level of significance = 0.05, then
there is insignificant difference among the respondents toward these fields due to years of
experience. So it can be said that the personal characteristics’ years of experience has no effect
on the other fields.
The lack of effect of years of experience is found come because of other variables that
regulates the relationship between them is the administrative system not financial.
Table (4.40): ANOVA test of the fields and their p-values for years of experience
No. Field
Means
Test
Value Sig. 1 –5
year
6 –10
year
11- 15
years
more
than15
years
1. Purpose
2. Structure
3. Leadership
4. Relationships
5. Reward
6. Helpful Mechanisms
7. Attitude to change
All paragraphs of the questionnaire
* The mean difference is significant a 0.05 level

87
This research is consistent with the findings of the research (Rahimi & Sayyed Ali & Reza &
Arash & Hasan Ali & Azizollah, 2011). Which results indicated That There was not a positive
and significant difference between views of faculty members about organizational diagnosis
on based of gender, employment status and scientific degree.

88
Chapter 5 Results, Recommendations, and
Future Studies.
Chapter Outline:-
5.1 Introduction
5.2 Research Results
5.3 Recommendations
5.4 Future Research
89
5.1 Introduction
The main objective of this research is the organizational diagnosis of the universities in the
Gaza Strip and identifies strengths and weaknesses and the extent of its ability to achieve its
goals, and diagnose and determine the factors affecting organizational performance in these
universities, and help organizational development practitioners categorize data about
universities in the Gaza Strip, As well as recommend implementation of suitable intervention
activities to improve organizational performance in the universities analyzed.
The findings of applied and field study were obtained through collected questionnaires field
study, unloading operations; conduct appropriate statistical hypothesis testing, and extraction
and presentation of results. Then make the necessary recommendations and suggestions that
would help us to take advantage of organizational diagnosis to improve and develop their
organizations. Finally, setting of proposals for future studies that could be conducted.
5.2 Research Results
Through the results of the statistical analysis of the respondents’ views, the most important
findings of this research could be summarized as following:
5.2.1 Research Variables
"Diagnosis of purpose in universities".
According to statistical analysis, the research reached the following conclusions:
a) (88.90%) of the respondents in all universities see that the goals of their
universities are clearly stated.
b) (87.19%) of the respondents in all universities see that they understand the
purpose of their universities.
c) (85.86%) of the respondents in all universities see that they are personally
in agreement with the stated goals of their work unit.
d) (82.96%) of the respondents in all universities see that they had enough
input in deciding their work-unit goals
e) (81.18%) of the respondents in all universities see that the priorities of their
universities were understood by its employees.
90
"Diagnosis of structure in universities".
According to statistical analysis, the research is reached to the following conclusions:
a) (77.09%) of the respondents in all universities see that the division of labor
in their university is intended to help it reach its goals.
b) (76.46%) of the respondents in all universities see that the division of labor
of their university is flexible.
c) (76.08%) of the respondents in all universities see that the division of labor
in their university actually helps it to reach its goals.
d) (75.98%) of the respondents in all universities see that the structure of their
work unit is well designed.
e) (73.24%) of the respondents in all universities see that the manner in which
work tasks are divided is a logical one.
"Diagnosis of leadership in universities".
According to statistical analysis, the research is reached to the following conclusions:
a) (81.98%) of the respondents in all universities see that they understand their
boss’s efforts to influence them and the other members of the work unit.
b) (81.76%) of the respondents in all universities see that their immediate
supervisor is supportive of their efforts.
c) (77.65%) of the respondents in all universities see that it is clear to them
whenever their boss is attempting to guide their work efforts.
d) (76.03%) of the respondents in all universities see that their universities
leadership efforts result in the universities fulfillment of its purposes.
e) (75.43%) of the respondents in all universities see that the leadership norms
of their universities helps its progress.
91
"Diagnosis of relationships in universities".
According to statistical analysis, the research is reached to the following conclusions:
a) (88.75%) of the respondents in all universities see that their relationships
with members of their work group are friendly as well as professional.
b) (87.28%) of the respondents in all universities see that their relationship
with their supervisors was a harmonious one.
c) (85.95%) of the respondents in all universities see that they can always talk
with someone at work if they have a work-related problem.
d) (83.77%) of the respondents in all universities see that they have established
the relationships that they need to do their job properly.
e) (63.90%) of the respondents in all universities see that there is no evidence
of unresolved conflict in these universities.
"Diagnosis of reward in universities".
According to statistical analysis, the research is reached to the following conclusions:
a) (78.43%) of the respondents in all universities see that their job offers them
the opportunity to grow as a person.
b) (76.70%) of the respondents in all universities see that all tasks to be
accomplished are associated with incentives.
c) (75.23%) of the respondents in all universities see that the opportunity for
promotion exists in these universities.
d) (74.14%) of the respondents in all universities see that the salary that they
received is commensurate with the job that they perform.
e) (71.62%) of the respondents in all universities see that the pay scale and
benefits of these universities treat each employee equitably.
"Diagnosis of helpful mechanism in universities".
According to statistical analysis, the research is reached to the following conclusions:
a) (88.10%) of the respondents in all universities see that they have the
information that they need to do a good job.
92
b) (79.85%) of the respondents in all universities see that there immediate
supervisors have ideas that are helpful to them and their work group.
c) (79.48%) of the respondents in all universities see that these universities
have adequate mechanisms for binding itself together.
d) (79.40%) of the respondents in all universities see that other work units are
helpful to them work unit whenever assistance is requested.
e) (74.66%) of the respondents in all universities see that these universities
planning and control efforts are helpful to its growth and development.
"Diagnosis of Attitude to change in universities".
According to statistical analysis, the research is reached to the following conclusions:
a) (83.08%) of the respondents in all universities see that occasionally they
like to change things about their job
b) (77.10%) of the respondents in all universities see that these universities
introduces enough new policies and procedures
c) (77.00%) of the respondents in all universities see that these universities
have the ability to change.
d) (74.57%) of the respondents in all universities see that these universities
favors change.
e) (73.06%) of the respondents in all universities see that these universities not
resistant to change.
5.2.2 Relation of Research Variables
There is a significant relationship between independent variables (purpose,
structure, leadership, relationship, reward, helpful mechanism, Attitude to
change), and the Ability of universities to achieve its objectives (at level of
significance α= 0.05).
According to statistical analysis, the research is reached to the following conclusions:
a) There is a statistical relation between purpose and the Ability of universities
to achieve its objectives (at the level of significance α= 0.05).
b) There is a statistical relation between structure and the Ability of

93
universities to achieve its objectives (at the level of significance α= 0.05).
c) There is a statistical relation between leadership and the Ability of
universities to achieve its objectives (at the level of significance α= 0.05).
d) There is a statistical relation between relationship and the Ability of
universities to achieve its objectives (at the level of significance α= 0.05).
e) There is a statistical relation between reward and the Ability of universities
to achieve its objectives (at the level of significance α= 0.05).
f) There is a statistical relation between helpful mechanism and the Ability of
universities to achieve its objectives (at the level of significance α= 0.05).
g) There is a statistical relation between attitude to change and the Ability of
universities to achieve its objectives (at the level of significance α= 0.05).
There are significant differences among respondents at (α= 0.05) Ability of
universities to achieve its objectives and challenges observed by universities
due to personal traits (Gender, Age, Qualifications, University, Position and
Years of Experience).
a) There is a statistically significant difference among the responses at
significance level (α ≤ 0.05) in regard to “The Organizational Diagnoses
Based on Six Box Model in Universities of Gaza Strip” due to university.
b) There is a statistically significant difference among the responses at
significance level (α ≤ 0.05) in regard to “The Organizational Diagnoses
Based on Six Box Model in Universities of Gaza Strip” due to gender.
c) There is a statistically significant difference among the responses at
significance level (α ≤ 0.05) in regard to “The Organizational Diagnoses
Based on Six Box Model in Universities of Gaza Strip” due to qualification.
d) There is a statistically significant difference among the responses at
significance level (α ≤ 0.05) in regard to “The Organizational Diagnoses
Based on Six Box Model in Universities of Gaza Strip” due to age.
e) There is a statistically significant difference among the responses at
significance level (α ≤ 0.05) in regard to “The Organizational Diagnoses
Based on Six Box Model in Universities of Gaza Strip” due to job title.

94
f) There is a statistically significant difference among the responses at
significance level (α ≤ 0.05) in regard to “The Organizational Diagnoses
Based on Six Box Model in Universities of Gaza Strip” due to years of
experience.
5.3 Recommendations
Based on previous results reached during the field research and statistical analysis, which
revealed that the importance of organizational diagnosis of the universities in Gaza strip so,
there are some of the recommendations can be formulated to adopt organizational diagnosis
periodically in these universities as the following:
a) Conduct objective studies, continuous and periodic surveys to measure the
Ability of universities to achieve its objectives and in view of the importance
of the subject in achieving better performance levels and thus achieve the
objectives of these universities.
b) The university of Gaza should adopt the organizational diagnosis strategic
periodically to see where organizational problems and solve them, in order to
reach their goals.
c) The top management should be informed of ongoing developments of
organizational diagnosis and the importance of its use.
d) It's necessary for top management to provide the support and the needed
requirements to implementation of organizational diagnosis.
e) The University should provide training programs, for employees aims to
develop their personal skills and functional.
f) The universities should hold meetings, lectures and materials to their staff
about the definition, the importance and the use of organizational diagnosis.
g) Necessity creating a kind of compatibility between the duties and
responsibilities assigned to the managers, and identify clear functional tasks in
work.
h) The need for the independence of universities and away from the Palestinian
political conflict.

95
i) Because this is the first research of this kind to be conducted in Palestine it is
strongly recommended that the research be repeated in order to establish the
external validity of the findings.
5.4 Future Research Directions
Organizational diagnosis is an important strategy that is worthy of further research to help
universities to achieve its objective.
In light of the above findings and recommendations, the following studies were suggested:
a) Future researchers may extend to study the impact of organizational diagnosis
in the public and private sector.
b) Future researchers may extend to study the impact of Palestinian divisions on
the Palestinian universities.
c) Future researchers may extend to study the Models used in the organizational
diagnosis.
d) Future researchers may extend to study the impact of Palestinian divisions on
the Palestinian universities.
e) Future researchers may extend to study the difference between NGO
universities and Government universities

96
References
97
References
Studies ewsPreviBooks and
Abbey, L. (2002). Virtual team development in a college course setting.
Annie, V. (2007). OD Interventions for Sustainable Excellence in Higher
Education: Conference on Global Competition & Competitiveness of Indian
Corporate.
Beckhard, R. and Pritchard. W. (1992). Changing the essence: The art of
creating and leading fundamental change in organizations. San Francisco:
Jossey-Bass.
Bilal, B. and Wenbin, W. (2014). Sustainability Embedded Organizational
Diagnostic Model.
Bolton, M. and Heap, J. (2002). "The myth of continuous improvement",
Work Study, Vol. 51 Iss: 6, pp. 309–313.
Burke, W. (2002). Organization Change: Theory and Practice. Sage
Publications, Thousand Oaks, Calif.
Carnoy, M. (1999). Globalization and educational reform: what planners need
to know? UNESCO
Cummings, T. and Worley, C. (2005). Organization development and change
(8th Ed.). Minneapolis/St. Paul, MN: South-Western Educational Publishing.
Dean, C., Achilles, A. and Hubert, S. (2008). Integrating Qualitative and
Quantitative Methods for Organizational Diagnosis Possible Priming Effects?
Esmat, T. and Hossein, Z. (2014). Internal environment diagnoses of Iran
organization of exception of ex in view of sport experts by weisbord six- box.
French, W. and Bell. C. (1999). Organizational development: Behavioral
science interventions for organizational improvement. (6e.). Englewood
Cliffs: Prentice-Hall.
Goleman D. (1996). Emotional Intelligence: why it can matter more than IQ.
London: Bloomsbury.
George, D. and Mallery, P. (2006). SPSS for Windows Step by Step. A
Simple Guide and Reference, page 231. Allyn and Bacon, Boston, MA, USA

98
Harrison, M. and Shirom, A. (1999). Organizational Diagnosis and
assessment: Bridging Theory and Practice. California. Sage Publications Inc.
Harvey, L. (2000). New realities: the relationship between higher education
and employment. Tertiary Education and Management.
Hassan D., Behnaz K. and Pirhossein, K. (2014). Internal Environmental
Analysis of Khatam Anbia Hospital Based on Weisbord’s Organizational
Diagnosis Model”
Hausser. D., Pecorella. P. and Wissler, A. (1977) Survey-guided development:
A manual for consultants. San Diego, CA: University Associates.
Hayes, J. (2002), The Theory and Practice of Change Management, New
York: Palgrave
Henry, C. and Thode, Jr. (2002). Testing for Normality. New York: Marcel
Dekker, Inc. p. 479. ISBN 0-8247-9613-6.
Howard, A. (1994). Diagnosis for organizational change: methods and
models. New York: Guilford.
Jinus, Y. and Hamid S., (2014). Examining the relationship between
contextual dimensions of organization and organizational climate according to
weisbord six-box model.
Jones, B. and Brazzel, M. (2006). The NTL handbook of organizational
development and change: Principles, practices and perspectives. San
Francisco: Pfeiffer.
Kirsten, F. (2004). An exploration of factors that impact on levels of
employee satisfaction and organizational performance: An organizational.
Kwangho, A. (2005). Organizational culture diagnosis development for
business organization improvement - Case of P Company.
Lippitt, C. and Lippitt, H. (1978). The consulting process in action. San
Diego. CA: University Associates.
Lowman, L. (1993). Counseling and psychotherapy of work dysfunctions
Washington, DC: American Psychological Association.
Michael, H. (2005). Diagnosis Organizations Methods, models, and processes
(3rd. ed.)

99
Janicijevic, N. (2010). Business processes in organizational diagnosis,
Management.
Nadler, D. and Tushman, L. (1982). A model for diagnosing organizational
behavior: Applying a congruence perspective, Managing Organizations:
readings and cases, Little, Brown and Company: Boston Toronto.
Nadler, A., Shaw, B. and Walton, E. (1995). Discontinuous change: Leading
organizational transformation. San Francisco: Jossey-Bass.
Nasiripour A., Raeissi P. and Yazdani N., (2013). Analysis Internal Factors of
Hospitals Affiliated with Kurdistan University of Medical Science Based on
Weisberg’s Six-Box Model and Its Relation to Their Crisis Preparedness.
Matthew, W. (2000). A model of change process and its use in self-
assessment.
Nisha, N. and Neharika, V. (2010). The case of OD in an NGO in India.
Pettigrew, A. (1987) Introduction: researching strategic change. In Pettigrew,
A. (Ed.), The Management of Strategic Change. London: Basil Blackwell.
Philippe, R., Catherine, D. and Alain, B. (2010). Organizational capabilities
assessment: a dynamic methodology, methods and a tool for supporting
organizational diagnosis.
Rahimi H., Siadat A., Hoveida, R., Shahin A., Nasrabadi A. and Arbabisarjou
A. (2011). The Analysis of Organizational Diagnosis on Based Six Box
Model in Universities.
Roxana, S., Corina G. and Anamaria, M. (2010). The Application of a
Diagnostic Model: An Empirical Study.
Sanjay, R. (2011). Diagnosing organizational effectiveness in the tourism
sector of Zanzibar”.
Shein, and Edgar, H. (1998). Process Consultation Revisited: Building the
Helping Relationship, Prentice Hall Organizational Development Series.
Smither, D. (1996). Organization development: strategies for changing
environments. New York: Harper Collins college publishing, (chapter 4).
Statistical Yearbook of public education and higher education in Gaza
provinces 2014/2015, Ministry of Education and Higher Education, February
2015

100
Stegerean R., Gavrea C., and Marin, A. (2010). Application of diagnostic
Model: An Empirical Study. Faculty of Economics and Business
Administration; Babes-Bolyai University; Romania.
Styhre, A., and Sundgren, M. (2005). Action research as experimentation.
Systemic Practice and Action Research, 18, 53-72.
Theo, M. and Robert, W. (2008). Organizational Diagnosis in Practice: A
Cross- Classification Analysis Using the DEL-Technique.
Tichy, M. (1983). Managing strategic change: Technical, political and cultural
dynamics. New York: Wiley.
Vasilika, K. and Etleva, L. (2015): Beyond Organizational Diagnosis,
Comparisons between Albania and Kosovo Case of Tax Directorate.
Weisbord, R. (1990). Organizational diagnosis: six places to look for trouble
with or without theory. In N. C Jackson and M. R. Manning (Eds).
Diagnosing Client Organizations. Addison-Wesley: Alexandria, Virginia.
Weisbord. M. (1976). Organizational Diagnosis: Six Places to Look for
Trouble with or without a Theory, Group & Organization Studies, 1, 430-447.
Wyman, O. (2003). The congruence model: A road map for understanding
organizational performance. Delta Organization and Leadership Report.
Journal
Armenakis, A. and Bedeian, G. (1999). Organizational change: A review of
theory and research in the 1990s. Journal of Management, 25, 293-315.
Beer, M. and Spector, (1993). Organizational Diagnosis: It’s Role in
Organizational Learning. Journal of Counseling & Development. July/August
1993. Volume 71.
Burke, W. and Litwin, G. (1992). A casual model of organizational
performance and change. Journal of Management, 18(3): 523-545.
Lok, P and Crawford, J. (2000). The application of a diagnostic model and
survey in organizational development, Journal of Managerial Psychology,
15(2): 108-125.
Lowman, R. (2005). Importance of diagnosis in organizational assessment,
The Psychologist Manager Journal, 8(1): 17-28.
101
Whitfield, G., and Landeros, R. (2006). Supplier diversity effectiveness: Does
organizational culture really matter? The Journal of Supply Chain
Management.
Website:-
Satish, P. (2009). What is organizational diagnosis? Describe the steps and
methods of organizational analysis: http://goo.gl/NYpbOM
Armando, J. (2009). Organizational Diagnostic Models:
http://goo.gl/UrM2X4
Organizational Diagnosis and Development (2007):
https://rapidbi.com/organizationaldiagnosisanddevelopment/#.VihjKYlTJdj
Breckenridge Institute®, (2011). Why Diagnosis Matters: :
http://goo.gl/8e90HL
Palestinian Central Bureau of Statistics website, state of Palestine:
www.pcbs.gov.ps
The Ministry of Education and Higher Education, PNA website:
www.mohe.ps
Islamic University – Gaza website: www.iugaza.edu.ps
Al Azhar University - Gaza website: www.alazhar.edu.ps
Al-Aqsa University – Gaza website: www.alaqsa.edu.ps
a
Appendices

b
Appendix A Questionnaire (English Version)

c
Islamic University of Gaza
Dean of Postgraduate Studies
Faculty of Commerce
Department of Business Administration
ــــــــــــــــــــــــــــــــــــــــــــــــــــــــــــــــــــــــــــــــــــــــــــــــــــــــــــــــــــــــــــــــــــــــــــــــــــــــــــــــــــــــــ
Questionnaire Dear All…...
The researcher puts in your hands this questionnaire prepared for the collection of
data about a study entitled:
Organizational diagnosis of the universities in Gaza Strip
Based on Six Box Model
)A comparative study (
Between Islamic University “IUG” and Al-Azhar University and Al-Aqsa University
Which this study be submitted in a partial fulfillment of the requirement for MBA
degree.
I hope you to cooperate and provide information to assist in the completion of this
study, which aims to diagnose universities organizationally in the Gaza Strip and
identifies strengths and weaknesses and the extent of its ability to achieve its goals.
As you have the experience and professional in your work field, and also your
currently position which related to the subject of the research, the researcher request
you to see all questionnaire items in carefully ,and answer all of them in Objectively
and high professional. Your feedback and comments would be a matter of interest
and they will have great impact regarding the enrichment of this study. Please note
that its use will be limited to scientific research
Please accept our best regards
Researcher
Saber M. Alian

d
First: Personal Functional Information Would you please put tick (√) beside the appropriate answer?
1. University
2. Gender:
3. Qualification:
4. Age (in years):
5. Type of Position
6. Years of experience
o Al aqsa o Al azhar o IUG
o Female o Male
o PHD and above o Master o Bachelor
o Above 50 years o From40 –below50 o From 30 – below40 o Below 30 years
o Academy with administrative position o Academy o Administrative
o Above 15 years o From10–less than 15 o From 5 – less than 10 o Less than 5
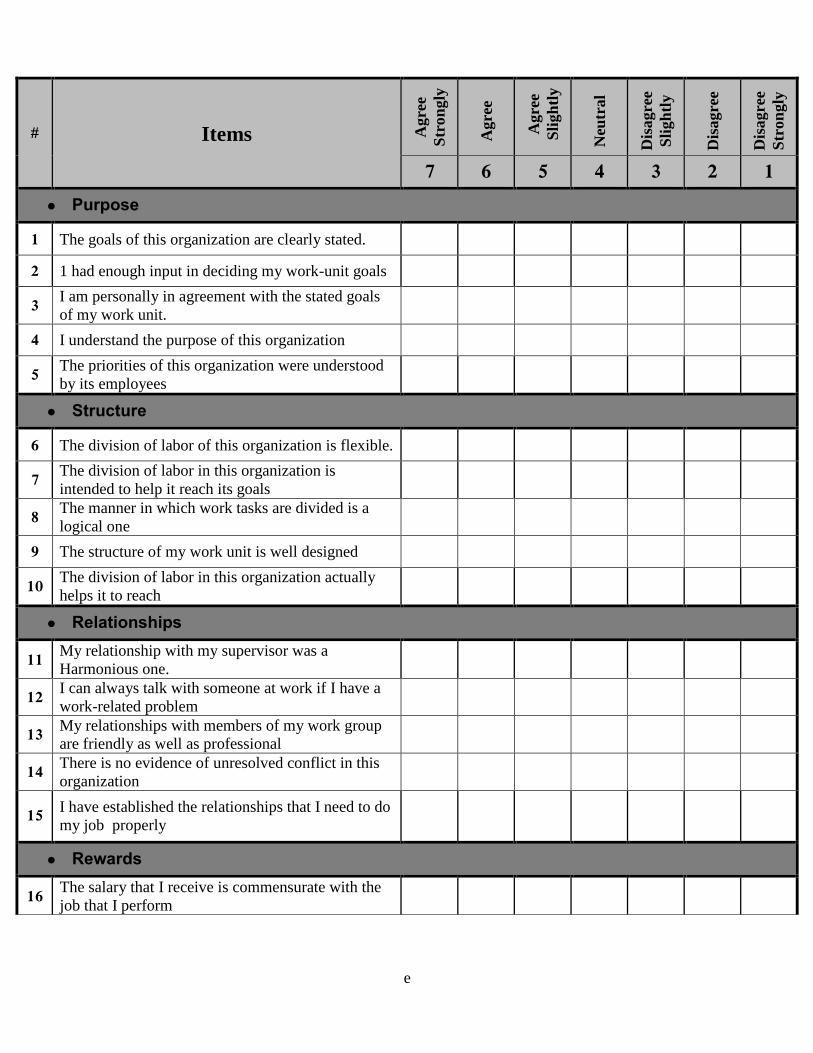
e
# Items Agre
e
Str
on
gly
Agre
e
Agre
e
Sli
gh
tly
Neu
tral
Dis
agre
e
Sli
gh
tly
Dis
agre
e
Dis
agre
e
Str
on
gly
7 6 5 4 3 2 1 Purpose
1 The goals of this organization are clearly stated. 2 1 had enough input in deciding my work-unit goals 3 I am personally in agreement with the stated goals
of my work unit.
4 I understand the purpose of this organization 5 The priorities of this organization were understood
by its employees
Structure 6 The division of labor of this organization is flexible. 7 The division of labor in this organization is
intended to help it reach its goals
8 The manner in which work tasks are divided is a
logical one
9 The structure of my work unit is well designed 10 The division of labor in this organization actually
helps it to reach
Relationships 11 My relationship with my supervisor was a
Harmonious one.
12 I can always talk with someone at work if I have a
work-related problem
13 My relationships with members of my work group
are friendly as well as professional
14 There is no evidence of unresolved conflict in this
organization
15 I have established the relationships that I need to do
my job properly
Rewards 16 The salary that I receive is commensurate with the
job that I perform

f
17 My job offers me the opportunity to grow as a
person.
18 The pay scale and benefits of this organization treat
each employee equitably
19 The opportunity for promotion exists in this
organization.
20 All tasks to be accomplished are associated with
incentives
Leaderships 21 My immediate supervisor is supportive of my
efforts.
22 The leadership norms of this organization help its
progress.
23 This organization’s leadership efforts result in the
organization’s fulfillment of its purposes.
24 It is clear to me whenever my boss is attempting to
guide my work efforts
25 I understand my boss’s efforts to influence me and
the other members of the work unit
Helpful Mechanisms 26 I have the information that I need to do a good job. 27 This organization has adequate mechanisms for
binding itself together
28 Other work units are helpful to my work unit
whenever assistance is requested
29 My immediate supervisor has ideas that are helpful
to me and my work group
30 This organization’s planning and control efforts are
helpful to its growth and development
Attitude to change 31 This organization is not resistant to change. 32 This organization introduces enough new policies
and procedures.
33 This organization favors change 34 This organization has the ability to change 35 Occasionally I like to change things about my job.
g
Appendix B List of Referees
(English)
List of Referees

h
Position Name #
Associate Professor in Business Administration Department
at Commerce College - IUG Dr. Sami Abu Al Ross 1
Professor Assistant in Business Administration Department at
Commerce College - IUG Dr. Khalid Dahleez 2
Associate Professor in Business Administration Department
at Commerce College - IUG Dr. Yousef Baher 3
Professor Assistant in Business Administration Department at
Commerce College - IUG Dr. Yaser AL shorafa 4
Professor Assistant in Business Administration Department at
Commerce College - IUG Dr. Akram samour 5
Associate Professor in Business Administration Department
at Commerce College - IUG Dr. Rushdi Wady 6
Professor Assistant in Business Administration Department at
Commerce College - IUG Dr. Wasim Al-Habil 7
Professor Assistant in Commerce College – IUG, Professor of
Statistics and Data Analysis Dr. Nafez barakat 8
Associate Professor in Human Resource Management and
Head of Management and Politics Academy in Gaza
Dr. Mohammed El
Madhoun 9
Professor Assistant in Business Administration at
Management and Politics Academy in Gaza Dr. Nabil Ellouh 10

i
Appendix C Questionnaire (Arabic Version)
j
........................ احملرتمون ......... ..........................................................السادة /
تحية طيبة وبعد: يضع الباحث بين أيديكم هذه االستبيان المعد لجمع البيانات حول دراسة بعنوان:
Organizational diagnosis of the universities in Gaza Strip
Based on Six Box Model
)A comparative study (
Between Islamic University “IUG” and Al-Azhar University and Al-Aqsa University
التشخيص التنظيمي للجامعات في قطاع غزة بواسطة نموذج الصناديق الستة
دراسة مقارنة
بين الجامعة اإلسالمية وجامعة األزهر وجامعة األقصى
وهذه الدراسة هي متطلب استكمااًل للحصور على درجة الماجستير في إدارة األعمال.
التي نهدف من خاللها إلى كلي أمل بكم في التعاون وتقديم المعلومات التي تساعد في إتمام هذه الدراسة، قياس مدى قدرة الجامعات في قطاع غزة على تحقيق أهدافها
ونظرًا لما تتمتعون به من خبرة ومهنية في مجال عملكم، وبحكم موقعكم الوظيفي واألكاديمي المتعلق جابة جميع بموضوع الرسالة، فإن الباحث يرجوكم بالتكرم واالطالع على فقرات هذا االستبيان بعناية وا
وف تستخدم ألغراض البحث أسئلته بموضوعية ومهنية عالية، علمًا أن المعلومات التي سوق تدلون بها س العلمي فقط.
وتفضلوا بقبول وافر االحرتام والتقدير الباحث
صابر موسى عليان
غزة –الجامعة اإلسالمية الدراسات العليا
كلية التجارة قسم إدارة األعمال

k
والوظيفية: القسم األول: البيانات الشخصية-
-( أمام اإلجابة المناسبة:يرجى التكرم بوضع إشارة ) -الجامعة: .1
-الجنس: .2
-العلمي:المؤهل .3
-:العمر .4
-طبيعة العمل: .5
-سنوات العمل في الجامعة: .6
o اإلسالمية o األزهر o األقصى
o ذكر o أنثى
o بكالوريوس o ماجستير o دكتوراة فما فوق
o 20 – سنة 30من أقل o 30- سنة 40أقل من o 40- سنة 50أقل من o 50 سنة فما فوق
o إداري o أكاديمي o االثنين معا
o 1-5 سنوات o 6-10 سنوات o 11-15 سنة o سنة 15أكثر من

l
غير موافق بشدة
غير موافق
غير موافق قليال
محايدأوافق قليال
أوافق أوافق ةبشد
م
1 2 3 4 5 6 7 الغرض : الغرض من الجامعة
1 الهدف الرئيسي للجامعة واضح 2 أملك المدخالت الكافية لتحديد أهداف قسمي في العمل 3 العمل في قسمي أهداف مع أتفق 4 الجامعة هذه من الغرض أفهم 5 فيها العاملين قبل من مفهومة الجامعة أولويات
الهيكل التنظيمي في الجامعة 6 قسيمة العاملين في الجامعة مرنةت 7 تقسيمة العمل في الجامعة تساعدها في تحقيق أهدافها 8 بطريقة منطقيةيتم تقسيم مهام العمل في الجامعة 9 جيد بشكل مصمم بي الخاصة العمل وحدة هيكل 10 أهدافها تحقيق في تساعد الجامعة في العاملين تقسيمة
العالقات في الجامعة 11 ع مديري المباشر م ة متناغمة ومنسجمةعالقتربطني
لدي كان إذا العمل في ما شخص مع دائما التحدث أستطيع بالعمل تتعلق مشكلة
12
13 العمل فريق في زمالئي مع ومهنية ودية عالقة تربطني 14 فيها محلول غير داخلي صراع تخلو الجامعة من أي 15 صحيح بشكل ألوديه عملي في أحتاجها التي للعالقات أسست لقد
التحفيز والمكافآت 16 يتناسب مع العمل الذي أقوم به راتباً أتقاضى 17 الفرصة لتطوير نفسي تمنحني وظيفتي

m
18 الموظفين ةقانون األجور والفوائد المتبع في الجامعة عادل مع كاف 19 هناك فرص للترقية في الجامعة 20 كي ت نجز كل المهام البد أن ترتبط بالحوافز
القيادة في الجامعة 21 المباشر جهدي ويقدره يدعم مديري 22 تساعدها على التقدم قواعد القيادة في الجامعة 23 تتضح جهود قيادة الجامعة في تحقيق الجامعة لمقاصدها 24 يكون واضحا بالنسبة لي متى يحاول مديري توجيه جهود عملي
25 أتفهم جهود مديري في التأثير علي وعلى العاملين معي في القسم جراءات مساعدة تقنيات وا
26 يوجد لدي المعلومات الكافية من أجل القيام بعملي بشكل جيد 27 تمتلك الجامعة األليات الكافية لتكون متماسكة ومترابطة
لها أنتمي التي العمل لوحدة المساعدة األخرى العمل وحداتتقدم األمر تتطلب كلما
28
29 العمل في ومجموعتي أنا تساعدني التي األفكار لديه المباشر مديري
30 جهود الرقابة والتخطيط في الجامعة في نموها وتطورهاتساهم موقف الجامعة من التغيير
31 للتغيير مقاومة غير الجامعة هذه
جراءات سياساتتقوم الجامعة بتقديم 32 كافية جديدة وا
33 التغيير تفضل الجامعة
34 هذه الجامعة لديها القدرة على التغيير
35 وظيفتي فيأحيانًا،، أحب تغيير األشياء

n
Appendix D List of Referees
(Arabic)

o
قائمة بأسماء المحكمين المسمى الوظيفي االسم م األستاذ المشارك في قسم إدارة األعمال في كلية التجارة في الجامعة اإلسالمية د. سامي أبو الروس 1 قسم إدارة األعمال في كلية التجارة في الجامعة اإلسالمية األستاذ المساعد في د. خالد دهليز 2 األستاذ المشارك في قسم إدارة األعمال في كلية التجارة في الجامعة اإلسالمية بحرد. يوسف 3 قسم إدارة األعمال في كلية التجارة في الجامعة اإلسالمية األستاذ المساعد في د. ياسر الشرفا 4 اإلسالميةقسم إدارة األعمال في كلية التجارة في الجامعة األستاذ المساعد في د. أكرم سمور 5 األستاذ المشارك في قسم إدارة األعمال في كلية التجارة في الجامعة اإلسالمية د. رشدي وادي 6 قسم إدارة األعمال في كلية التجارة في الجامعة اإلسالمية األستاذ المساعد في د. وسيم الهابيل 7 األستاذ المساعد في كلية التجارة / أستاذ اإلحصاء وتحليل البيانات د. نافذ بركات 8د. محمد إبراهيم 9
المدهون األستاذ المشارك في إدارة الموارد البشرية ورئيس أكاديمية اإلدارة والسياسة
للدراسات العليا ياسة للدراسات العليااألستاذ المساعد في إدارة األعمال في أكاديمية اإلدارة والس د. نبيل اللوح 10