Embed Size (px)
Citation preview
82 Annual Report 2003 – Bank Supervision Department
South African Reserve Bank
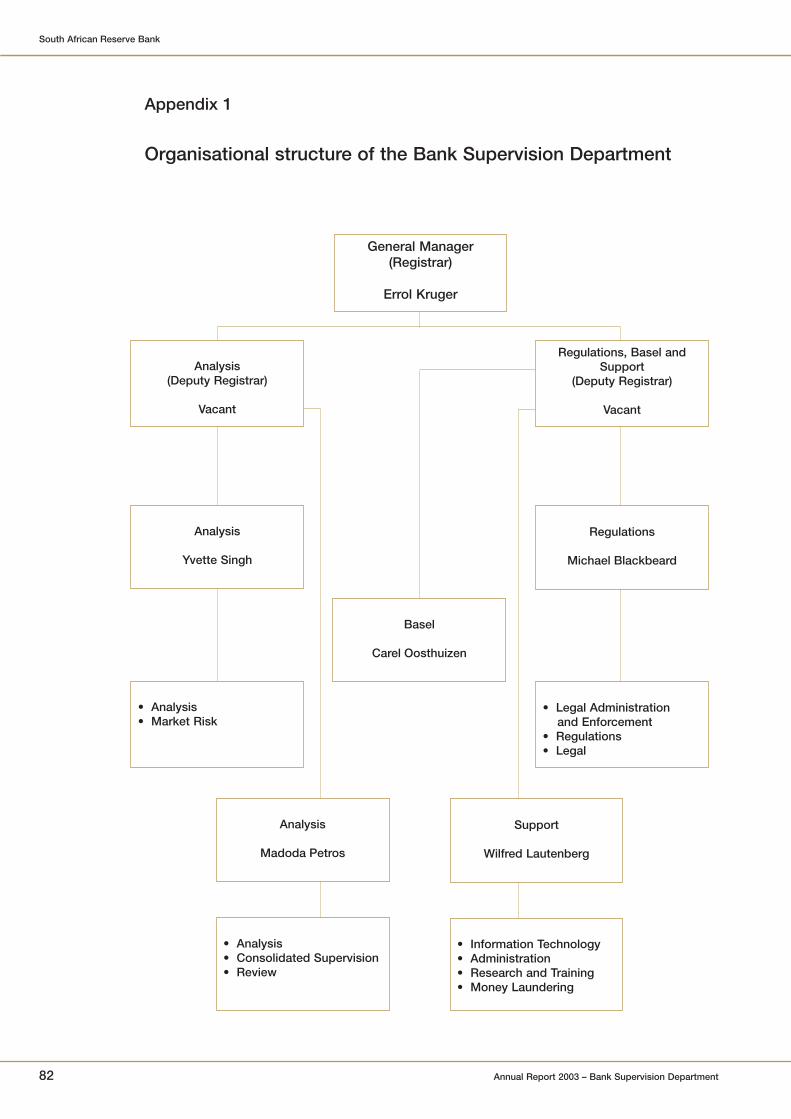
Appendix 1
Organisational structure of the Bank Supervision Department
General Manager(Registrar)
Errol Kruger
Analysis(Deputy Registrar)
Vacant
Basel
Carel Oosthuizen
Regulations, Basel andSupport
(Deputy Registrar)
Vacant
Analysis
Yvette Singh
Regulations
Michael Blackbeard
• Analysis• Market Risk
• Legal Administrationand Enforcement
• Regulations• Legal
Analysis
Madoda Petros
Support
Wilfred Lautenberg
• Analysis• Consolidated Supervision• Review
• Information Technology• Administration• Research and Training• Money Laundering

Annual Report 2003 – Bank Supervision Department 83
Total assets at
Institution Address 31 December Percentage
annual
2002 2003 growth
R million R million
1. ABSA Bank Limited P O Box 7735,Johannesburg, 2000 227 685 260 686 14,5
2. African Bank Limited Private Bag X170,Halfway House, 1685 6 417 6 033 -6,0
3. Albaraka Bank Limited P O Box 4395,Durban, 4000 643 867 35,0
4. Capitec Bank Limited P O Box 12451,Die Boord, Stellenbosch, 7613 368 410 11,5
5. FirstRand Bank Limited P O Box 786273,Sandton, 2146 212 536 255 533 20,2
6. Gensec Bank Limited P O Box 411420,Craighall, 2024 12 678 16 691 31,7
7. Habib Overseas Bank Limited P O Box 62369,Marshalltown, 2107 262 290 10,8
8. HBZ Bank Limited P O Box 48449,Qualbert, 4078 486 650 33,9
9. Imperial Bank Limited P O Box 3567,Edenvale, 1610 9 417 13 003 38,1
10. Investec Bank Limited P O Box 785700,Sandton, 2146 63 964 83 837 31,1
11. Marriott Merchant Bank Limited P O Box 3211,Durban, 4000 525 688 31,1
12. Mercantile Bank Limited P O Box 782699,Sandton, 2146 2 225 2 191 -1,6
13. MLS Bank Limited P O Box 87175,Houghton, 2041 4 124 4 075 -1,2
14. Nedbank Limited P O Box 1144,Johannesburg, 2000 161 090 280 541 74,2
15. Peoples Bank Limited P O Box 1144,Johannesburg, 2000 7 906 13 638 72,5
16. Rennies Bank Limited P O Box 185,Johannesburg, 2000 257 317 22,9
17. Sasfin Bank Limited P O Box 95104,Grant Park, 2051 566 536 -5,3
18. TEBA Bank Limited Private Bag X174,Halfway House, 1685 1 578 1 891 19,9
19. The South African Bank of Athens Limited P O Box 7781,Johannesburg, 2000 480 518 7,9
20. The Standard Bank of South Africa Limited P O Box 7725,Johannesburg, 2000 215 717 318 306 47,6
Registered banks
Appendix 2
Registered banks and mutual banks as at 31 December 2003
South African Reserve Bank

South African Reserve Bank
84 Annual Report 2003 – Bank Supervision Department
Bank (with effect from 1 July 1996) in terms of the Supervision of Financial Institutions Rationalisation Act, 1996 (Act No. 32 of 1996)
Appendix 2
Registered banks and mutual banks as at 31 December 2003 – continued
Total assets at
Institution Address 31 December Percentage
annual growth
2002 2003
R million R million
1. MEEG Bank Limited P O Box 332,Umtata, 5100 729 767 5,2
Registered mutual banks
Total assets as at31 December Percentage
annual growthInstitution Type of registration Address 2002 2003
R million R million
1. GBS Mutual Bank Final P O Box 114,Grahamstown, 6140 295 351 19,0
2. VBS Mutual Bank Provisional P O Box 3618,Louis Trichardt, 0920 178 199 11,8
Bank under curatorship
Institution Curator Date of order
1. Regal Treasury Private Bank Limited Mr R K Store of Deloitte & Touche 26 June 2001
Banks in receivership in terms of a scheme of arrangement in terms of section 311 of the Companies Act, 1973
Institution Receiver
1. New Republic Bank Limited Mr C C Allan of Ernst & Young(registration cancelled on 30 January 2004)
2. Saambou Bank Limited Mr T J Louw of KPMG
Bank in final liquidation
Institution Liquidator Date of order
1. Islamic Bank Limited Mr A D Wilkins of Deloitte & Touche 13 January 1998
Annual Report 2003 – Bank Supervision Department 85
South African Reserve Bank
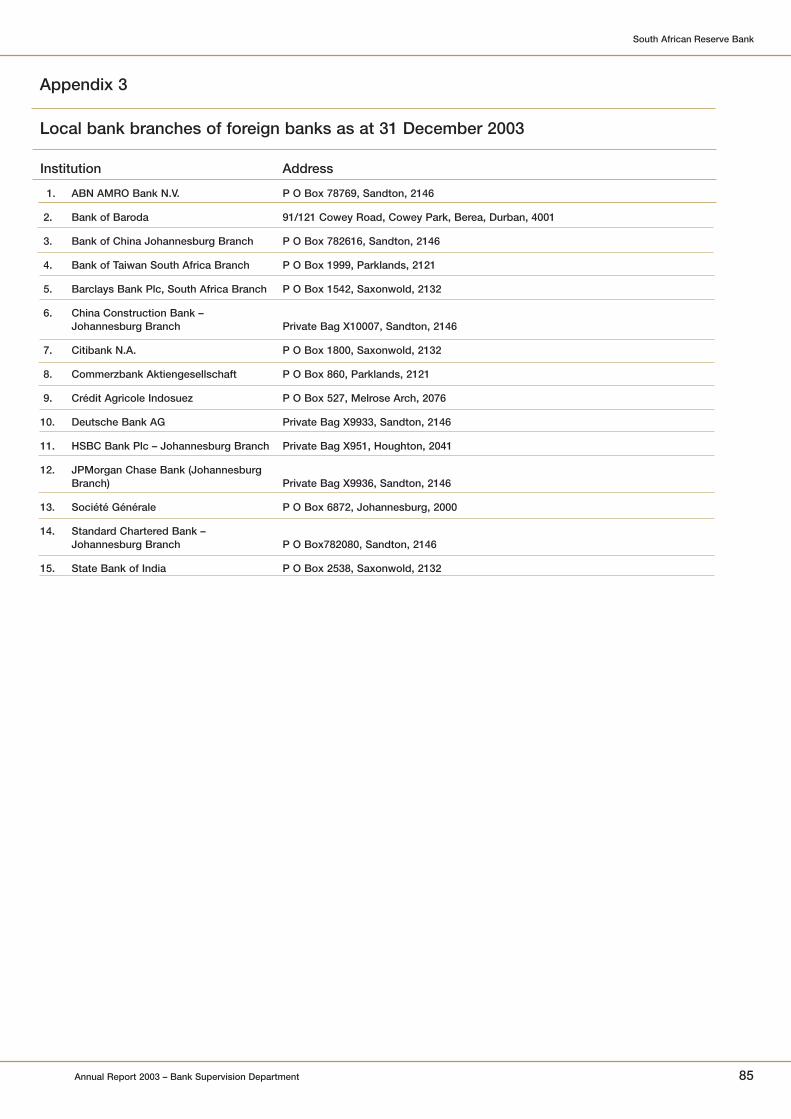
Institution Address
1. ABN AMRO Bank N.V. P O Box 78769, Sandton, 2146
2. Bank of Baroda 91/121 Cowey Road, Cowey Park, Berea, Durban, 4001
3. Bank of China Johannesburg Branch P O Box 782616, Sandton, 2146
4. Bank of Taiwan South Africa Branch P O Box 1999, Parklands, 2121
5. Barclays Bank Plc, South Africa Branch P O Box 1542, Saxonwold, 2132
6. China Construction Bank – Johannesburg Branch Private Bag X10007, Sandton, 2146
7. Citibank N.A. P O Box 1800, Saxonwold, 2132
8. Commerzbank Aktiengesellschaft P O Box 860, Parklands, 2121
9. Crédit Agricole Indosuez P O Box 527, Melrose Arch, 2076
10. Deutsche Bank AG Private Bag X9933, Sandton, 2146
11. HSBC Bank Plc – Johannesburg Branch Private Bag X951, Houghton, 2041
12. JPMorgan Chase Bank (JohannesburgBranch) Private Bag X9936, Sandton, 2146
13. Société Générale P O Box 6872, Johannesburg, 2000
14. Standard Chartered Bank – Johannesburg Branch P O Box782080, Sandton, 2146
15. State Bank of India P O Box 2538, Saxonwold, 2132
Appendix 3
Local bank branches of foreign banks as at 31 December 2003

South African Reserve Bank
86 Annual Report 2003 – Bank Supervision Department
Name changes
Previous name New name Date of change
1. Rand Merchant Bank Limited RMB Asset Finance Bank Limited 4 July 2003
Cancellation of registration
Institution Date of cancellation
1. African Merchant Bank Limited 30 September 2003
2. BOE Bank Limited 21 February 2003
3. Cape of Good Hope Bank Limited 21 February 2003
4. ING Bank N.V. South Africa Branch 7 July 2003
5. Nedcor Investment Bank Limited 21 February 2003
6. PSG Investment Bank Limited 30 May 2003
7. RMB Asset Finance Bank Limited 28 July 2003
8. Securities Investment Bank Limited 18 February 2003
9. Unibank Limited 31 March 2003
Appendix 4
Name changes and cancellation of registration of banks andbranches of foreign banks during the period from 1 January 2003 to31 December 2003

Annual Report 2003 – Bank Supervision Department 87
South African Reserve Bank
Institution Address
1. ABSA Group Limited P O Box 7735, Johannesburg, 2000
2. African Bank Investments Limited P O Box X170 Halfway House, 1685
3. Capitec Bank Holdings Limited P O Box 12451, Die Boord, Stellenbosch, 7613
4. FirstRand Bank Holdings Limited P O Box786273, Sandton, 2146
5. Genbel Securities Limited P O Box 411420, Craighall, 2006
6. Investec Limited P O Box 785700, Sandton, 2146
7. Marriott Holdings Limited P O Box 3211, Durban, 4000
8. Mercantile Lisbon Bank Holdings Limited P O Box 782699, Sandton, 2146
9. Nedcor Limited P O Box 1144, Johannesburg, 2000
10. NRB Holdings Limited P O Box 4928, Durban, 4000
11. Regal Treasury Bank Holdings Limited P O Box 3215, Rivonia, 2128
12. Rennies Bank Holdings Limited P O Box 87274, Houghton, 2041
13. Saambou Holdings Limited P O Box 74127, Lynnwood Ridge, 0040
14. Sasfin Holdings Limited P O Box 95104, Grant Park, 2051
15. Standard Bank Group Limited P O Box 7725, Johannesburg, 2000
16. TEBA Bank Controlling Company Limited Private Bag X174, Halfway House, 1685
The following institutions are deemed to be controlling companies in terms of section 42 of the BanksAct, 1990:
1. Albaraka Investment and Development Company P O Box 6854, Jeddah, 21452, Saudi Arabia
2. National Bank of Greece 86 Eolou Street, Athens TT 121, Greece
3. Pitcairns Finance 121, Avenue de la Faiencerie, L-1511Luxemburg, RCS Luxemburg, B nr 33-106
Appendix 5
Registered controlling companies as at 31 December 2003

South African Reserve Bank
88 Annual Report 2003 – Bank Supervision Department
Institution Address
1. American Express Bank Limited P O Box 651, Parklands, 2121
2. Banca di Roma P O Box 787018, Sandton, 2146
3. Banco BPI, SA P O Box 303, Bruma, 2026
4. Banco Comercial Português P O Box 273, Bruma, 2026
5. Banco Espirito Santo e Comercial de Lisboa P O Box 749, Bruma, 2026
6. Banco Privado Português, SA P O Box 78407, Sandton, 2146
7. Banco Totta & Açores SA P O Box 309, Bruma, 2026
8. Bank Leumi Le-Israel BM P O Box 8373, Johannesburg, 2000
9. Bank of America, National Association CEEMA, Bank of America House, 1 Allie Str, London E1 8DE, England
10. Bank of Cyprus Group P O Box 652176, Benmore, 2010
11. BNP Paribas Johannesburg P O Box 653002, Benmore, 2010
12. Barclays Private Bank Limited P O Box 1542, Saxonwold, 2132
13. Bayerische Hypo- und Vereinsbank AG P O Box 1483, Parklands, 2121
14. Belgolaise Bank P O Box 652065, Benmore, 2010
15. China Everbright Bank, South AfricanRepresentative Office P O Box 78345, Sandton, 2146
16. Commerzbank AG P O Box 860, Parklands, 2121
17. Crédit Industriel et Commercial 302 Portofino, 30 9th Street, Killarney, 2193
18. Credit Suisse (South Africa) (Pty) Limited Private Bag X9911, Sandton, 2146
19. Credit Suisse First Boston (Europe) Limited Private Bag X9911, Sandton, 2146
20. Dresdner Bank AG P O Box 413355, Craighall, 2024
21. Dresdner Kleinwort Wasserstein Limited P O Box 413355, Craighall, 2146
22. Export-Import Bank of India P O Box 2018, Saxonwold, 2132
23. First Bank of Nigeria P O Box 78192, Sandton, 2146
24. Fortis Bank (Nederland) N.V. P O Box 652065, Benmore, 2010
25. Gerrard Private Bank (Isle of Man) Limited P O Box 787549, Sandton, 2146
26. Gerrard Private Bank (Jersey) Limited P O Box 787549, Sandton, 2146
27. Hellenic Bank Limited P O Box 783392, Sandton, 2146
28. ING Bank (Switzerland) Limited P O Box 65660, Benmore, 2010
29. Kredietbank SA Luxembourgeoise P O Box 1163, Stellenbosch, 7599
30. Laiki Banking Group Suite #199, Private Bag X9916, Village Walk, Sandton, 2146
31. Natexis Banques Populaires P O Box 1414, Morningside, 2057
32. National Bank of Egypt P O Box 55402, Northlands, 2116
33. National Bank of Malawi P O Box 412723, Craighall, 2024
34. Royal Bank of Canada Europe Limited P O Box 784568, Sandton, 2146
35. Société Générale Representative Office for P O Box 2805, Saxonwold, 2121Southern Africa
36. Sumitomo Mitsui Banking Corporation Private Bag X134, Bryanston, 2021
37. The Bank of New York, Johannesburg Postnet Suite 100, Private Bag X43, Representative Office Sunninghill, 2157
38. The Bank of Tokyo-Mitsubishi, Ltd P O Box 78519, Sandton, 2146
39. The Representative Office for Southern and 5th Floor, FedsureTowers, 13 Fredman Drive,Eastern Africa of the Export-Import Bank of China Sandown, 2196
Appendix 6
Foreign banks with approved local representative offices

Annual Report 2003 – Bank Supervision Department 89
South African Reserve Bank
Institution Address
40. UBS AG P O Box 652863, Benmore, 2010
41. Union Bank of Nigeria Plc P O Box 653125, Benmore, 2010
42. Vnesheconombank P O Box 413742, Craighall, 2024
43. Wachovia Bank, NA P O Box 3009, Parklands, 2121
44. WestLB AG P O Box 786126, Sandton, 2146
Appendix 6
Foreign banks with approved local representative offices(continued)

South African Reserve Bank
90 Annual Report 2003 – Bank Supervision Department
The following tables have been selected for publication because they disclose:- The most important industry trends.- Industry statistics that facilitate banks' evaluation of their own positions.Note: Certain of the comparative figures in respect of 2001 and 2002 may differ
from those reported in the 2001 and 2002 Annual Reports owing to thesubmission of amended returns by banks after publication of thosereports.
TABLE PAGE
1. Composition of balance sheet – liabilities 91
2. Composition of balance sheet – assets 92
3. Composition of selected liabilities 93
4. Composition of loans and advances to non-banks 94
5. Funding maturity structure 95
6. Analysis of capital and reserves 96
7. Risk profile of assets 97
8. Risk profile of off-balance-sheet items 98
9. Risk profile of loans and advances 99
10. Capital adequacy 101
11. Composition of income statement 102
12. Profitability: operating ratios 103
13. Profitability ratios 104
14. Percentage composition of interest income 105
15. Percentage composition of interest expense 106
16. Calculation of liquid-asset requirement 107
17. Analysis of overdue accounts 108
18. Analysis of overdue accounts: selected ratios 109
19. Large credit exposures 110
20. Profitability of assets 111
21. Open position in foreign currency 112
Appendix 7
Trends in South African banks
Annual Report 2003 – Bank Supervision Department 91
South African Reserve Bank
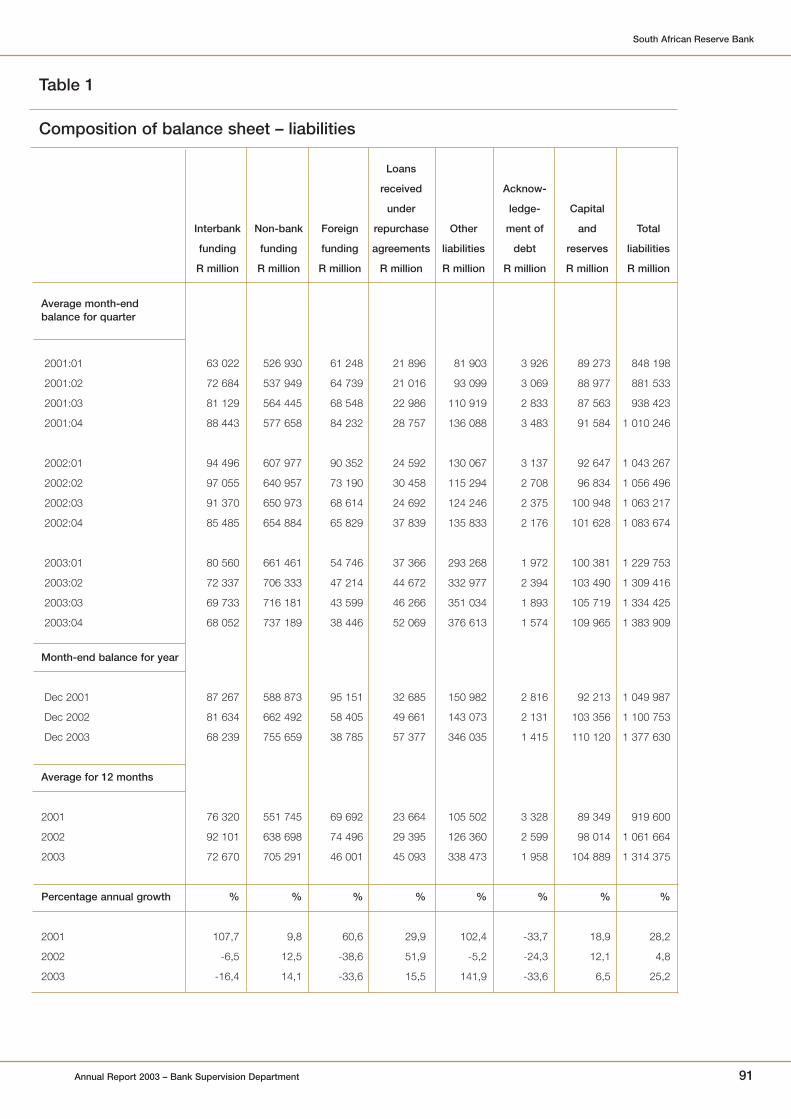
Average month-endbalance for quarter
2001:01 63 022 526 930 61 248 21 896 81 903 3 926 89 273 848 198
2001:02 72 684 537 949 64 739 21 016 93 099 3 069 88 977 881 533
2001:03 81 129 564 445 68 548 22 986 110 919 2 833 87 563 938 423
2001:04 88 443 577 658 84 232 28 757 136 088 3 483 91 584 1 010 246
2002:01 94 496 607 977 90 352 24 592 130 067 3 137 92 647 1 043 267
2002:02 97 055 640 957 73 190 30 458 115 294 2 708 96 834 1 056 496
2002:03 91 370 650 973 68 614 24 692 124 246 2 375 100 948 1 063 217
2002:04 85 485 654 884 65 829 37 839 135 833 2 176 101 628 1 083 674
2003:01 80 560 661 461 54 746 37 366 293 268 1 972 100 381 1 229 753
2003:02 72 337 706 333 47 214 44 672 332 977 2 394 103 490 1 309 416
2003:03 69 733 716 181 43 599 46 266 351 034 1 893 105 719 1 334 425
2003:04 68 052 737 189 38 446 52 069 376 613 1 574 109 965 1 383 909
Month-end balance for year
Dec 2001 87 267 588 873 95 151 32 685 150 982 2 816 92 213 1 049 987
Dec 2002 81 634 662 492 58 405 49 661 143 073 2 131 103 356 1 100 753
Dec 2003 68 239 755 659 38 785 57 377 346 035 1 415 110 120 1 377 630
Average for 12 months
2001 76 320 551 745 69 692 23 664 105 502 3 328 89 349 919 600
2002 92 101 638 698 74 496 29 395 126 360 2 599 98 014 1 061 664
2003 72 670 705 291 46 001 45 093 338 473 1 958 104 889 1 314 375
Percentage annual growth % % % % % % % %
2001 107,7 9,8 60,6 29,9 102,4 -33,7 18,9 28,2
2002 -6,5 12,5 -38,6 51,9 -5,2 -24,3 12,1 4,8
2003 -16,4 14,1 -33,6 15,5 141,9 -33,6 6,5 25,2
Loans
received Acknow-
under ledge- Capital
Interbank Non-bank Foreign repurchase Other ment of and Total
funding funding funding agreements liabilities debt reserves liabilities
R million R million R million R million R million R million R million R million
Table 1
Composition of balance sheet – liabilities

South African Reserve Bank
92 Annual Report 2003 – Bank Supervision Department
Average month-endbalance for quarter
2001:01 15 965 33 962 627 817 11 649 111 261 12 280 3 926 31 339 848 198
2001:02 16 711 42 472 646 705 14 678 103 706 11 518 3 070 42 674 881 533
2001:03 17 709 49 453 686 140 14 337 116 612 11 605 2 834 39 734 938 423
2001:04 21 362 49 626 717 525 19 162 148 797 11 695 3 573 38 505 1 010 246
2002:01 21 007 53 452 756 703 18 981 133 853 11 476 3 137 44 657 1 043 267
2002:02 21 768 58 181 776 943 22 187 121 584 12 015 2 708 41 110 1 056 496
2002:03 22 135 46 248 802 755 19 038 120 817 12 382 2 375 37 468 1 063 217
2002:04 24 774 46 117 802 543 28 291 124 684 12 357 2 176 42 732 1 083 674
2003:01 22 868 50 086 802 871 32 286 256 087 12 543 1 972 51 038 1 229 753
2003:02 23 332 54 203 835 216 34 781 311 374 12 188 2 394 35 927 1 309 416
2003:03 24 244 55 849 847 574 34 155 325 325 12 363 1 539 33 374 1 334 425
2003:04 26 371 59 983 861 113 40 033 351 943 12 311 1 217 30 938 1 383 909
Month-end balance for year
Dec 2001 24 046 51 529 732 811 20 652 168 098 11 851 2 817 38 183 1 049 988
Dec 2002 26 537 47 293 799 787 36 814 132 934 12 523 2 131 42 734 1 100 754
Dec 2003 28 846 60 666 876 551 46 780 324 317 12 271 1 207 26 991 1 377 630
Average for 12 months
2001 17 937 43 878 669 547 14 957 120 094 11 774 3 351 38 063 919 600
2002 22 421 50 999 784 736 22 124 125 234 12 058 2 599 41 492 1 061 664
2003 24 204 55 031 836 694 35 314 311 182 12 351 1 780 37 819 1 314 375
Percentage annual growth % % % % % % % % %
2001 21,1 54,6 19,6 140,2 59,3 5,7 -33,7 59,3 28,2
2002 10,4 -8,2 9,1 78,3 -20,9 5,7 -24,4 11,9 4,8
2003 8,7 28,3 9,6 27,1 144,0 -2,0 -43,3 -36,8 25,2
Loans
granted Acknow-
under Invest- Non- ledgement
Interbank Non-bank resale ment financial of debt Other Total
Money advances advances agreements portfolio assets outstanding assets assets
R million R million R million R million R million R million R million R million R million
Table 2
Composition of balance sheet – assets

Annual Report 2003 – Bank Supervision Department 93
South African Reserve Bank
Average month-endbalance for quarter
2001:01 260 355 31 395 177 138 58 041 526 930 6 021 6 137 12 158 42 772 18 476 61 248
2001:02 270 767 32 261 180 485 54 436 537 949 5 760 5 461 11 221 45 888 18 851 64 739
2001:03 281 278 33 653 189 491 60 023 564 445 5 480 7 117 12 597 47 939 20 609 68 548
2001:04 292 925 34 969 186 638 63 126 577 658 8 906 8 389 17 295 55 509 28 723 84 232
2002:01 319 058 34 906 195 500 58 513 607 977 8 097 5 145 13 242 53 543 36 810 90 352
2002:02 338 398 36 357 214 003 52 199 640 957 10 267 6 777 17 044 40 759 32 431 73 190
2002:03 336 317 37 573 225 440 51 643 650 973 7 415 6 063 13 478 41 563 27 051 68 614
2002:04 325 308 37 435 237 346 54 794 654 884 16 383 9 822 26 205 37 521 28 309 65 829
2003:01 328 751 37 095 248 879 46 735 661 461 13 745 12 134 25 879 28 098 26 647 54 746
2003:02 328 936 39 803 280 977 56 617 706 333 20 734 12 368 33 102 22 877 24 337 47 214
2003:03 340 181 42 493 297 238 36 269 716 181 19 308 14 873 34 182 20 592 23 006 43 599
2003:04 368 760 44 953 299 233 24 243 737 189 24 682 14 197 38 880 18 713 19 733 38 446
Month-end balance for year
Dec 2001 303 390 35 123 187 759 62 600 588 873 11 663 8 681 20 344 59 406 35 745 95 151
Dec 2002 334 143 37 083 234 674 56 592 662 492 20 924 16 706 37 630 33 105 25 301 58 405
Dec 2003 392 168 45 573 295 182 22 736 755 659 27 780 16 591 44 372 21 077 17 708 38 785
Average for 12 months
2001 276 331 33 069 183 438 58 907 551 745 6 542 6 776 13 318 48 027 21 665 69 692
2002 329 770 36 568 218 072 54 288 638 698 10 540 6 952 17 492 43 346 31 150 74 496
2003 341 657 41 086 281 582 40 966 705 291 19 617 13 393 33 011 22 570 23 431 46 001
Percentage annual growth % % % % % % % % % % %
2001 16,4 9,6 13,2 -19,8 9,8 -15,4 -23,7 -19,1 42,0 105,3 60,6
2002 10,1 5,6 25,0 -9,6 12,5 79,4 92,4 85,0 -44,3 -29,2 -38,6
2003 17,4 22,9 25,8 -59,8 14,1 32,8 -0,7 17,9 -36,3 -30,0 -33,6
Loans under
Deposits repurchase agreement Foreign funding
Fixed Negotiable
and certificates Non- Non-
Demand Savings notice of deposit Total Banks banks Total Banks banks Total
R million R million R million R million R million R million R million R million R million R million R million
Table 3
Composition of selected liabilities

South African Reserve Bank
94 Annual Report 2003 – Bank Supervision Department
Average month-endbalance for quarter
2001:01 16 784 83 101 228 027 12 279 15 349 11 149 213 489 60 945 13 306 627 817
2001:02 17 021 86 955 234 430 12 367 14 826 11 487 213 192 70 202 13 775 646 705
2001:03 19 453 90 603 241 304 12 747 15 696 12 194 218 442 89 313 13 612 686 140
2001:04 18 196 93 758 249 142 13 233 15 750 13 231 226 886 101 312 13 984 717 525
2002:01 13 797 96 900 257 159 13 835 15 591 15 912 230 978 128 196 15 666 756 703
2002:02 10 999 100 602 264 684 14 156 19 135 14 398 236 950 132 297 16 278 776 943
2002:03 9 267 103 535 272 226 13 588 21 587 15 114 240 770 143 678 17 010 802 755
2002:04 12 766 106 979 277 261 14 391 20 242 16 323 244 762 127 237 17 417 802 543
2003:01 15 051 110 218 285 209 15 119 18 906 16 575 252 573 106 718 17 498 802 871
2003:02 16 878 115 337 296 032 15 716 22 334 15 639 266 806 105 324 18 849 835 216
2003:03 15 737 120 091 307 008 16 173 19 988 16 168 260 891 110 260 18 742 847 574
2003:04 10 530 124 390 319 679 16 722 23 951 16 239 264 055 104 161 18 614 861 113
Month-end balance for year
Dec 2001 16 507 95 126 251 948 13 522 15 177 14 149 230 595 109 915 14 130 732 811
Dec 2002 13 408 107 900 279 281 14 640 19 404 16 881 247 689 117 726 17 143 799 787
Dec 2003 9 081 126 237 323 445 16 950 24 914 15 280 264 754 114 414 18 524 876 551
Average for 12 months
2001 17 864 88 604 238 226 12 657 15 405 12 015 218 002 80 443 13 669 669 547
2002 11 707 102 004 267 832 13 992 19 138 15 437 238 365 132 852 16 593 784 736
2003 14 549 117 509 301 982 15 932 21 295 16 155 261 081 106 616 18 426 836 694
Percentage annual growth % % % % % % % % % %
2001 9,9 17,4 15,3 11,2 7,2 36,3 5,6 96,6 8,8 19,6
2002 -18,8 13,4 10,8 8,3 27,8 19,3 7,4 7,1 21,3 9,1
2003 -32,3 17,0 15,8 15,8 28,4 -9,5 6,9 -2,8 8,1 9,6
Acknow- Redeem- Foreign-
Negotiable ledgement able Overdrafts currency Less:
certificates Instalment Mortgage Credit of debt preference and loans and Specific
of deposit debtors loans cards discounted shares loans advances provisions Total
R million R million R million R million R million R million R million R million R million R million
Table 4
Composition of loans and advances to non-banks

Annual Report 2003 – Bank Supervision Department 95
South African Reserve Bank
Quarter
2001:01 66,4 20,9 12,7
2001:02 66,8 19,9 13,3
2001:03 64,3 21,4 14,3
2001:04 64,0 21,6 14,4
2002:01 67,2 19,6 13,2
2002:02 67,8 17,3 14,9
2002:03 67,9 16,9 15,1
2002:04 64,6 20,2 15,2
2003:01 62,2 22,6 15,2
2003:02 63,5 22,8 13,7
2003:03 64,8 21,8 13,3
2003:04 66,1 21,3 12,7
Month-end for year
Dec 2001 66,1 20,4 13,5
Dec 2002 65,9 19,3 14,8
Dec 2003 68,4 19,4 12,1
Average 12 months
2001 65,3 21,0 13,7
2002 66,9 18,5 14,7
2003 64,2 22,1 13,7
Short-term Medium-term Long-term
% % %
Table 5
Funding maturity structure

South African Reserve Bank
96 Annual Report 2003 – Bank Supervision Department
Quarter
2001:01 64 009 25 697 89 706 12 408 77 298 10,3 2,0 4,1
2001:02 65 315 22 962 88 276 10 896 77 380 10,9 1,8 3,8
2001:03 64 291 23 702 87 993 12 815 75 178 10,8 2,2 4,0
2001:04 66 875 26 455 93 330 12 456 80 874 10,7 2,0 4,2
2002:01 68 499 27 130 95 629 13 826 81 803 10,5 2,1 4,1
2002:02 67 429 28 075 95 504 11 970 83 533 10,4 1,9 4,3
2002:03 68 108 31 660 99 768 12 388 87 380 10,6 1,9 4,9
2002:04 69 982 32 367 102 349 15 454 86 895 10,8 2,4 5,0
2003:01 66 771 32 598 99 370 13 336 86 034 10,0 2,0 4,9
2003:02 70 517 32 341 102 857 9 783 93 074 10,3 1,4 4,7
2003:03 73 865 32 088 105 953 9 498 96 455 10,7 1,4 4,6
2003:04 75 625 32 198 107 823 10 574 97 250 10,7 1,5 4,5
Average for year
2001 65 123 24 704 89 826 12 144 77 682 10,7 2,0 4,1
2002 68 505 29 808 98 313 13 410 84 903 10,6 2,1 4,6
2003 71 694 32 306 104 001 10 798 93 203 10,4 1,6 4,7
Percentageannual growth % % % % %
2001 16,2 21,3 17,5 28,8 16,0
2002 5,2 20,7 9,4 10,4 9,3
2003 4,7 8,4 5,8 -19,5 9,8
As percentage of
total risk exposure
Qualifying Total Net
Primary secondary qualifying Less: qualifying Primary Secondary
capital capital capital Impairments capital capital Impairments capital
R million R million R million R million R million % % %
Table 6
Analysis of capital and reserves

Annual Report 2003 – Bank Supervision Department 97
South African Reserve Bank
Average month-endbalance for quarter
2001:01 113 586 17 090 53 985 156 846 433 790 775 297 524 719 67,7
2001:02 132 612 11 789 60 603 160 823 446 365 812 193 540 076 66,5
2001:03 152 012 11 434 68 193 165 066 458 779 855 485 556 094 65,0
2001:04 167 113 12 237 73 299 168 908 480 037 901 595 580 375 64,4
2002:01 199 861 11 143 75 403 174 497 499 030 959 935 602 474 62,8
2002:02 221 504 10 579 73 365 179 249 492 132 976 828 597 487 61,2
2002:03 241 326 9 247 65 150 185 047 496 765 997 535 603 244 60,5
2002:04 239 319 9 961 65 277 187 832 503 822 1 006 211 611 789 60,8
2003:01 235 719 11 263 65 271 192 272 522 889 1 027 415 633 206 61,6
2003:02 239 928 10 897 82 593 202 440 534 037 1 069 894 652 865 61,0
2003:03 248 076 9 700 84 025 211 404 535 853 1 089 059 659 330 60,5
2003:04 239 327 11 483 89 254 223 285 554 072 1 117 420 684 713 61,3
Month-end balancefor year
Dec 2001 179 735 13 391 72 952 169 680 492 310 928 067 593 079 63,9
Dec 2002 231 487 10 099 66 250 190 070 509 710 1 007 616 619 005 61,4
Dec 2003 236 092 12 521 92 723 226 308 559 403 1 127 048 692 354 61,4
Average for12 months
2001 141 331 13 138 64 020 162 911 454 743 836 142 550 316 65,8
2002 225 503 10 233 69 799 181 656 497 937 985 127 603 749 61,3
2003 240 763 10 836 80 286 207 350 536 713 1 075 947 657 529 61,1
Percentageannual growth % % % % % % %
2001 42,4 -2,3 -2,8 4,2 13,2 13,3 -3,3
2002 28,8 -24,6 -9,2 12,0 3,5 8,6 4,4
2003 2,0 24,0 40,0 19,1 9,7 11,9 11,8
Risk-
weighted
assets as
Risk category percentage
Risk- of total
weighted average
0% 10% 20% 50% 100% Total assets assets
R million R million R million R million R million R million R million %
Table 7
Risk profile of assets

South African Reserve Bank
98 Annual Report 2003 – Bank Supervision Department
Average month-endbalance for quarter
2001:01 20 859 3 461 3 626 5 907 54 462 14 341 102 656 43 289 42,2
2001:02 27 636 4 464 1 926 5 133 50 013 15 614 104 785 42 063 40,1
2001:03 79 638 15 680 2 503 4 511 47 559 18 139 168 031 43 855 26,1
2001:04 390 143 501 2 940 7 091 48 242 17 051 465 968 42 909 9,2
2002:01 846 816 353 3 137 7 194 54 238 13 615 925 352 42 504 4,6
2002:02 1 265 945 481 3 269 6 668 57 838 15 016 1 349 217 45 620 3,4
2002:03 1 167 099 451 2 879 7 331 55 149 16 705 1 249 613 46 056 3,7
2002:04 1 210 526 344 2 003 6 467 57 370 17 265 1 293 975 47 461 3,7
2003:01 1 183 842 489 1 521 6 048 57 264 16 792 1 265 956 46 810 3,7
2003:02 1 136 111 283 1 890 6 035 58 309 17 498 1 220 125 48 062 3,9
2003:03 1 239 829 387 2 332 11 036 56 210 15 191 1 324 984 45 755 3,5
2003:04 1 273 801 1 030 5 580 11 717 55 895 10 330 1 358 353 41 231 3,0
Month-end balancefor year
Dec 2001 615 550 278 3 437 8 870 50 194 18 252 696 580 45 481 6,5
Dec 2002 1 224 511 234 1 716 6 240 57 346 17 301 1 307 347 47 405 3,6
Dec 2003 1 314 456 677 11 682 5 879 57 939 9 777 1 400 411 41 125 2,9
Average for year
2001 129 569 6 026 2 749 5 661 50 069 16 286 210 360 43 029 20,5
2002 1 122 596 407 2 822 6 915 56 149 15 650 1 204 540 45 410 3,8
2003 1 208 396 547 2 830 8 709 56 920 14 953 1 292 355 45 465 3,5
Percentageannual growth % % % % % % % %
2001 - -88,2 22,2 42,8 -18,8 42,8 586,5 0,4
2002 98,9 -15,6 -50,1 -29,7 14,2 -5,2 87,7 4,2
2003 7,3 189,3 580,8 -5,8 1,0 -43,5 7,1 -13,2
Risk-
weighted
items as
Risk category percentage
Risk- of total
weighted average
off-balance- off-balance-
0% 5% 10% 20% 50% 100% Total sheet items sheet items
R million R million R million R million R million R million R million R million %
Table 8
Risk profile of off-balance-sheet items

Annual Report 2003 – Bank Supervision Department 99
South African Reserve Bank
26 860 0 40 0 1 486 28 385 1 494 5,3144 0 17 998 0 22 18 164 3 622 19,9251 0 9 144 0 89 9 485 1 918 20,230 175 3 25 106 022 106 255 106 052 99,80 37 25 185 686 92 248 277 996 185 100 66,60 0 0 0 14 570 14 570 14 570 100,0
9 761 875 1 934 0 6 448 19 019 6 922 36,4928 0 125 564 14 654 16 270 14 961 92,0
2 617 7 309 4 021 0 223 327 237 274 224 862 94,8
82 405 205 28 901 4 9 062 120 577 14 864 12,3
14 414 0 895 0 250 15 560 429 2,8
3 087 0 0 0 0 3 087 0 0,06 873 0 893 0 13 7 780 192 2,54 454 0 2 0 237 4 693 237 5,1
137 412 8 601 63 087 186 279 468 177 863 556 574 794 66,60 0 0 35 17 274 17 309 17 292 99,9
Month-end balance for year 2002
Intragroup bank advancesInterbank advancesNegotiable certificates of depositsInstalment debtorsMortgage loansCredit-card debtorsAcknowledgements of debt discounted Redeemable preference shares Overdrafts and loansForeign-currency loans and advancesLoans granted under resaleagreements S A Reserve Bank and Corporationfor Public Deposits
BanksNon-banks
Total loans and advancesLess: Specific provisions
Risk-weightedloans and
advances asRisk- percentage
weighted of total loans and loans and
10% 20% 50% 100% 1250% Total advances advancesR million R million R million R million R million R million R million %
Month-end balance for year 2001
Intragroup bank advancesInterbank advancesNegotiable certificates of depositsInstalment debtorsMortgage loansCredit-card debtorsAcknowledgements of debt discounted Redeemable preference shares Overdrafts and loansForeign-currency loans and advancesLoans granted under resale agreements S A Reserve Bank and Corporationfor Public Deposits
BanksNon-banks
Total loans and advancesLess: Specific provisions
22 892 0 61 0 0 22 952 12 0,119 2 255 22 042 7 0 24 322 4 637 19,1
493 0 10 486 0 287 11 267 2 384 21,224 80 19 0 93 555 93 678 93 567 99,96 26 32 166 892 83 503 250 459 166 958 66,70 0 0 0 13 293 13 293 13 293 100,0
6 043 917 1 589 1 6 758 15 308 7 168 46,81 000 0 591 424 11 759 13 773 12 089 87,84 316 7 029 406 0 209 971 221 722 210 755 95,1
50 833 535 33 455 0 18 109 102 932 24 854 24,1
2 309 0 1 455 0 52 3 816 343 9,0
68 0 0 0 0 68 0 0,02 241 0 1 455 0 0 3 696 291 7,9
0 0 0 0 52 52 52 100,087 934 10 842 70 136 167 324 437 288 773 523 536 061 69,312
12 0 0 129 13 741 13 881 13 805 99,5
Table 9(a)
Risk profile and loans and advances
Risk-weightedloans and
advances asRisk- percentage
weighted of total loans and loans and
0% 10% 20% 50% 100% Total advances advancesR million R million R million R million R million R million R million %
Table 9(b)
Risk profile of loans and advances

South African Reserve Bank
100 Annual Report 2003 – Bank Supervision Department
26 277 38 0 0 3 569 29 884 3 573 12,00 0 26 660 0 0 26 660 5 332 20,00 0 3 484 0 2 3 486 699 20,0
27 384 131 0 122 027 122 569 122 091 99,60 0 25 222 255 99 723 322 003 210 855 65,50 0 0 0 16 868 16 868 16 868 100,0
12 169 61 7 996 12 5 746 25 984 7 357 28,3679 0 325 0 13 982 14 985 14 047 93,7
4 520 6 285 1 805 0 243 842 256 453 244 832 95,5
58 613 925 37 696 0 6 528 103 761 14 159 13,6
1 000 2 333 6 371 0 8 154 17 859 9 662 54,1
259 0 0 0 0 259 0 0,0741 0 6 371 0 0 7 113 1 274 17,9
0 2 333 0 0 8 154 10 487 8 388 80,0103 286 10 027 84 493 222 267 520 440 940 512 649 475 69,1
0 57 0 32 18 423 18 511 18 444 99,6
Month-end balancefor year 2003
Intragroup bank advancesInterbank advancesNegotiable certificates of depositsInstalment debtorsMortgage loansCredit-cards debtorsAcknowledgements of debtdiscounted Redeemable preference shares Overdrafts and loansForeign-currency loans andadvancesLoans granted under resaleagreements S A Reserve Bank and Corporation for Public Deposits
BanksNon-banks
Total loans and advancesLess: Specific provisions
Risk-weightedloans and
advances asRisk- percentage
weighted of total loans and loans and
0% 10% 20% 50% 100% Total advances advancesR million R million R million R million R million R million R million %
Table 9(c)
Risk profile and loans and advances

Annual Report 2003 – Bank Supervision Department 101
South African Reserve Bank
Quarter
2001:01 616 988 7 755 609 232 49 964 54 226 8,8
2001:02 597 752 8 176 589 576 48 189 52 919 8,9
2001:03 605 179 7 078 598 102 48 906 52 266 8,6
2001:04 644 439 22 358 622 081 72 687 55 808 8,7
2002:01 656 582 23 089 633 493 65 970 56 753 8,6
2002:02 648 393 16 989 631 404 65 139 57 640 8,9
2002:03 641 302 14 703 626 599 64 436 55 831 8,7
2002:04 653 978 17 113 636 865 65 524 57 061 8,7
2003:01 668 973 17 541 651 432 67 009 56 529 8,5
2003:02 691 279 17 035 674 244 69 191 63 822 9,2
2003:03 690 548 16 066 674 482 69 112 68 070 9,9
2003:04 712 347 17 078 695 269 77 569 63 437 8,9
Average for year
2001 616 089 11 342 604 748 54 936 53 805 8,7
2002 650 064 17 974 632 090 65 267 56 821 8,7
2003 690 787 16 930 673 857 70 720 62 964 9,1
Percentage annual growth % % % % %
2001 19,0 325,5 13,7 65,9 -22,8
2002 1,5 -23,5 2,4 -9,9 2,2
2003 8,9 -0,2 9,2 18,4 11,2
Risk-weighted
assets and off-
balance-sheet Counterparty- Total risk Required Net qualifying capital
items risk exposure exposure capital
R million R million R million R million R million Percentage
Table 10
Capital adequacy

South African Reserve Bank
102 Annual Report 2003 – Bank Supervision Department
7 436 7 715 7 735 7 627 7 973 8 748 10 362 11 315
4 707 4 968 5 313 5 275 5 765 6 416 8 021 8 118
2 729 2 748 2 422 2 352 2 209 2 332 2 341 3 197
469 773 831 723 1 634 548 445 776
84 95 71 225 103 -79 79 80
15 4 22 74 -3 5 16 -29
2 161 1 876 1 497 1 329 474 1 858 1 800 2 370
1 344 1 112 1 424 1 559 1 462 1 589 1 654 1 840
3 505 2 988 2 921 2 889 1 936 3 447 3 455 4 211
2 795 3 036 3 014 3 213 3 134 3 379 3 312 3 396
710 -48 -93 -324 -1 198 68 142 814
889 254 906 1 253 -1 427 957 905 -515
100 -54 0 14 -10 0 4 -5
183 218 414 273 215 293 206 283
1 406 14 754 1 313 -281 883 1 174 1 196
270 244 294 376 291 251 257 556
1 136 -230 460 937 -573 632 917 641
Interest income
Interest expense
Interest margin
Less: Specific provisions on loans andadvances
Less: General debt provisions
Other
Adjusted interest margin
Add: Transaction-based fee income
Income from management of funds
Less: Operational expenses
Net income from management of funds
Add: Investment and trading income
Less: Specific provisions - investment
Add: Knowledge-based fee income
Net income before tax
Taxation
Net income after tax
11 215 11 744 10 992 8 494 91 539 115 196 127 336 7 628 9 600 10 611
8 198 8 681 7 940 5 881 60 788 84 959 92 100 5 066 7 080 7 675
3 017 3 063 3 053 2 613 30 751 30 237 35 236 2 563 2 520 2 936
722 770 564 494 8 388 10 209 7 649 699 851 637
20 26 -66 37 1 427 551 51 119 46 4
12 13 1 7 347 -31 98 29 -3 8
2 262 2 254 2 554 2 075 20 589 19 509 27 438 1 716 1 626 2 286
1 738 1 838 1 885 2 011 16 319 19 635 22 417 1 360 1 636 1 868
4 000 4 093 4 439 4 086 36 909 39 144 49 854 3 076 3 262 4 155
3 404 3 989 3 593 3 995 36 177 39 665 44 942 3 015 3 305 3 745
596 103 846 92 731 -521 4 912 61 -43 409
393 -420 96 945 9 905 -239 3 039 825 -20 253
0 9 2 4 177 -30 45 15 -3 4
167 177 178 230 3 263 2 991 2 252 272 249 188
1 169 1 424 1 883 798 10 459 8 917 15 826 872 743 1 319
228 516 439 648 3 552 4 066 5 495 296 339 458
941 908 1 444 151 6 908 4 851 10 332 576 404 861
Interest income
Interest expense
Interest margin
Less: Specific provisions on loans andadvances
Less: General debt provisions
Other
Adjusted interest margin
Add: Transaction-based fee income
Income from management of funds
Less: Operational expenses
Net income from management of funds
Add: Investment and trading income
Less: Specific provisions - investment
Add: Knowledge-based fee income
Net income before tax
Taxation
Net income after tax
Average monthly balance for quarter Average monthly balance for quarter
2001 2002
March June September December March June September December
R million R million R million R million R million R million R million R million
Average monthly balance for
quarter 2003 Results for 12 months Average for year
March June September December 2001 2002 2003 2001 2002 2003
R million R million R million R million R million R million R million R million R million R million
Table 11(a)
Composition of income statement
Table 11(b)
Composition of income statement

Annual Report 2003 – Bank Supervision Department 103
South African Reserve Bank
Average monthly balance for quarter
2001:01 12,6 8,0 4,6 1,1
2001:02 12,7 8,5 4,2 0,9
2001:03 11,5 8,4 3,1 1,1
2001:04 11,1 7,9 3,3 1,3
2002:01 10,8 7,9 2,9 2,2
2002:02 11,7 8,7 3,0 0,7
2002:03 13,9 10,8 3,1 0,7
2002:04 14,6 10,6 4,0 0,9
2003:01 14,2 10,5 3,6 0,9
2003:02 14,2 10,9 3,3 0,9
2003:03 13,7 9,9 3,7 0,5
2003:04 10,5 7,2 3,3 0,5
Results for the 12 months ended
December 2001 10,8 7,3 3,5 1,1
December 2002 12,5 9,1 3,4 1,1
December 2003 12,3 8,9 3,4 0,7
Interest income Interest Provisions
to loans and expense to Interest to loans and
advances funding margin advances
% % % %
Table 12
Profitability: operating ratios

South African Reserve Bank
104 Annual Report 2003 – Bank Supervision Department
Avreage month-end balance for quarter
2001:01 1,6 18,1 10,5 6,7 3,9 4,1 2,2 1,2
2001:02 -0,3 -3,7 10,5 6,8 3,7 4,1 1,8 0,3
2001:03 0,6 7,3 9,9 6,8 3,1 3,9 2,4 1,2
2001:04 1,4 13,8 9,1 6,3 2,8 3,8 2,2 1,5
2002:01 -0,7 -8,3 9,2 6,6 2,5 3,6 1,9 -1,6
2002:02 0,7 8,9 9,9 7,3 2,6 3,8 2,1 1,1
2002:03 1,0 12,3 11,7 9,1 2,6 3,7 2,1 1,0
2002:04 0,7 8,7 12,5 9,0 3,5 3,8 2,4 -0,6
2003:01 0,9 13,0 10,9 8,0 2,9 3,3 1,9 0,4
2003:02 0,8 11,5 10,8 8,0 2,8 3,7 1,8 -0,4
2003:03 1,3 17,7 9,9 7,1 2,7 3,2 1,9 0,1
2003:04 0,1 1,8 7,4 5,1 2,3 3,5 1,9 0,8
Results for the 12 months ended
December 2001 0,7 9,2 8,8 5,9 2,9 3,5 1,9 0,9
December 2002 0,4 5,4 10,5 7,7 2,8 3,6 2,1 0,0
December 2003 0,7 10,5 9,2 6,7 2,6 3,3 1,8 0,2
Stated as percentage of total assets
Net income Investment
Net income after tax to and
after tax to owners’ Interest Interest Interest Operating Fee trading
total assets equity income expense margin expenses income income
% % % % % % % %
Table 13
Profitability ratios

Annual Report 2003 – Bank Supervision Department 105
South African Reserve Bank
Average month-end balance for quarter
2001:01 7,1 1,7 33,6 34,3 2,2 2,4 1,6 28,1 3,8 0,5 4,1
2001:02 8,0 1,7 13,2 34,0 2,2 1,8 1,6 28,5 3,8 0,8 4,4
2001:03 3,9 2,0 13,0 32,9 2,2 2,0 1,5 31,2 4,6 0,6 6,5
2001:04 4,5 1,7 13,3 31,9 2,3 3,0 1,4 32,3 4,0 0,9 4,7
2002:01 4,9 1,4 13,7 32,6 2,3 2,0 1,5 32,3 3,9 0,8 4,7
2002:02 5,7 1,1 13,8 33,5 2,1 2,2 1,5 30,9 4,1 0,8 4,3
2002:03 9,9 0,8 12,5 32,1 1,9 2,1 2,8 30,0 4,5 0,8 2,5
2002:04 12,4 1,0 12,7 31,4 1,9 2,1 -0,1 28,7 3,8 1,1 5,2
2003:01 10,1 1,4 12,9 32,5 2,1 2,0 1,2 29,3 2,4 1,2 4,9
2003:02 8,6 1,6 12,7 33,2 2,1 2,3 1,4 26,9 2,1 1,5 7,7
2003:03 10,9 1,5 12,9 32,3 2,2 2,5 1,3 28,0 1,9 1,9 4,7
2003:04 2,9 1,2 15,4 36,1 2,6 2,9 1,5 29,9 2,0 2,5 2,9
Results for the 12 months ended
December 2001 6,0 1,8 13,2 33,3 2,2 2,3 1,5 30,1 4,1 0,7 4,9
December 2002 8,6 1,0 13,1 32,3 2,0 2,1 1,4 30,3 4,1 0,9 4,2
December 2003 8,5 1,4 13,4 33,3 2,2 2,4 1,4 28,4 2,1 1,7 5,2
Acknow- Foreign- Loans Negoti- Interest
ledge- Redeem- Over- currency under able certi- income
Instal- ment of able pref- drafts loans resale ficates from
Interbank ment Mortgage Credit debt dis- erence and and agree- of invest-
loans debtors loans cards counted shares loans advances ments deposit ments
% % % % % % % % % % %
Table 14
Percentage composition of interest income

South African Reserve Bank
106 Annual Report 2003 – Bank Supervision Department
Average month-end balance for quarter
2001:01 2,0 7,0 36,8 2,4 30,6 9,8 2,2 -1,5 6,5 -0,8 4,9
2001:02 3,0 8,2 37,1 2,4 30,7 8,4 1,9 -1,7 5,8 -0,6 4,9
2001:03 3,8 7,8 32,6 2,1 28,4 8,7 1,6 6,1 5,3 -1,2 4,7
2001:04 3,6 8,3 31,7 2,0 27,3 10,0 1,8 7,7 5,1 -2,9 5,5
2002:01 4,4 7,6 34,9 2,2 26,6 7,8 1,7 8,4 4,2 -2,4 4,8
2002:02 3,8 7,5 37,0 2,5 28,5 6,3 2,4 6,5 3,7 -2,9 4,5
2002:03 6,7 9,4 34,1 2,2 26,7 5,5 1,8 9,8 2,7 -3,2 4,2
2002:04 8,5 4,2 35,1 2,6 29,1 6,0 2,4 8,6 2,8 -3,4 4,2
2003:01 9,7 6,9 33,3 2,5 29,5 5,2 2,5 8,8 1,1 -3,4 4,0
2003:02 10,2 5,1 29,7 2,5 31,1 6,1 3,5 10,4 0,7 -3,3 4,1
2003:03 9,1 5,2 29,5 2,3 34,2 4,4 3,4 10,4 0,6 -2,9 3,9
2003:04 -1,7 5,3 31,5 2,2 35,7 3,8 3,7 12,7 0,7 0,5 5,6
Results for the 12 months ended
December 2001 3,1 7,9 34,4 2,2 29,2 9,2 1,8 2,8 5,6 -1,4 5,0
December 2002 6,1 7,1 35,2 2,4 27,7 6,3 2,1 8,4 3,2 -3,0 4,4
December 2003 7,5 5,6 31,0 2,4 32,3 5,0 3,2 10,4 0,8 -2,5 4,3
Nego- Loans
Fixed tiable under re- Transfer
Intra- and certifi- purchase cost of Debt
group Interbank Demand Savings notice cates of agree- Other Foreign trading instru-
funding funding deposits deposits deposits deposit ments funding funding activities ments
% % % % % % % % % % %
Table 15
Percentage composition of interest expense

Annual Report 2003 – Bank Supervision Department 107
South African Reserve Bank
1 215 145 1 288 005 1 314 484 1 375 441 1 006 335 1 093 356 1 381 927 22,8 8,6 26,4100 979 104 214 105 900 109 256 94 373 101 766 109 417 21,7 7,8 7,5
12 307 8 459 6 927 7 508 16 979 16 144 9 087 - -4,9 -43,7
117 484 128 821 131 511 140 416 92 585 90 624 144 175 - -2,1 59,1984 375 1 046 511 1 070 147 1 118 365 802 397 884 822 1119 396 8,2 10,3 26,549 219 52 326 53 507 55 918 40 120 44 241 55 970 8,2 10,3 26,553 391 59 067 60 926 63 207 44 339 51 172 64 626 15,2 15,4 26,34 114 3 960 4 632 5 985 1 969 3 581 6 204 - 81,8 73,3
8 7 4 5 11 10 6 -6,4 -44,82 140 0 0 1 6 0 1 -79,3 -98,7 1591,9
15 212 17 288 15 790 17 382 10 962 16 031 18 082 -34,4 46,2 12,8- - - -
26 808 26 589 33 255 36 333 29 292 26 440 36 981 - -9,7 39,94 527 10 523 6 589 2 812 1 033 4 184 2 656 22,4 305,0 -36,5
583 700 657 689 1 067 927 696 -47,1 -13,1 -24,9
47 952 50 269 50 971 54 162 45 205 48 697 57 111 20,5 7,7 17,359 355 66 214 67 329 74 334 79 531 59 594 76 044 9,7 -25,1 27,6
% % % % % % %
108,5 112,9 113,9 113,0 110,5 115,7 115,5
Liabilities including capital and reservesLess: Capital and reserves- average daily amount of funding from
head office or branches- average daily amount owing by banks,
branches and mutual banksLiabilities as adjustedLiquid-asset requirementLiquid assets heldSARB notes and coins Gold coin and bullionClearing-account balancesTreasury bills of the RepublicStock issued - Exchequer Act, 1975Securities issued - Public FinanceManagement Act, 1999Securities of the SARBLand Bank billsMemorandum itemsCash-management schemesSet-offRatios
Liquid assets held to liquid assetsrequired
835 398 872 360 918056 975 445 1 036 042 1 044 362 1 050 960 1 076 73988 360 89 047 87251 91 909 92 765 97 167 101 895 101 849
7 408 7 918 10645 15 672 14 800 9 375 10 088 16 560
62 872 73 680 89983 87 171 98 741 90 603 80 663 86 314676 757 701 715 730177 780 695 829 737 847 217 858 314 872 01533 838 35 086 36509 39 109 41 487 42 361 42 916 43 60139 042 39 088 42460 42 989 42 676 42 241 50 299 50 047
90 95 873 1 841 1 970 1 722 2 332 3 6855 6 5 6 11 11 7 61 22 4 5 9 11 1 0
16 086 13 867 14361 12 021 10 916 13 568 14 959 15 299
20 274 22 168 24247 27 224 26 892 23 179 27 985 25 792630 967 1071 761 1 738 2 540 4 090 4 368
1 984 1 964 1899 1 131 1 139 1 210 926 896
39 883 41 150 41713 42 679 42 716 42 732 42 817 45 62579 198 83 014 67867 76 240 78 870 81 238 81 256 67 199
% % % % % % % %
115,4 111,4 116,3 109,9 102,9 99,7 117,2 114,8
Liabilities including capital and reservesLess: Capital and reserves- average daily amount of funding from
head office or branches- average daily amount owing by banks,
branches and mutual banksLiabilities as adjustedLiquid-asset requirementLiquid assets heldSARB notes and coins Gold coin and bullionClearing-account balancesTreasury bills of the RepublicStock issued - Exchequer Act, 1975Securities issued - Public FinanceManagement Act, 1999Securities of the SARBLand Bank billsMemorandum itemsCash-management schemesSet-offRatios
Liquid assets held to liquid assetsrequired
Average month-end balance for quarter Average month-end balance for quarter
2001 2002
March June September December March June September December
R million R million R million R million R million R million R million R million
Average month-end balance for quarter 2003 Month-end for year Percentage annual growth
March June September December 2001 2002 2003 2001 2002 2003R million R million R million R million R million R million R million % % %
Table 16(a)
Calculation of liquid-asset requirement
Table 16(b)
Calculation of liquid-asset requirement

South African Reserve Bank
108 Annual Report 2003 – Bank Supervision Department
Quarter
2001:01 9 168 3 048 13 975 26 191 11 498 13 160
2001:02 9 279 2 859 13 617 25 755 11 796 12 441
2001:03 9 229 2 965 13 720 25 914 11 483 12 620
2001:04 8 782 2 866 14 546 26 194 12 047 11 985
2002:01 8 879 2 878 14 413 26 170 12 659 11 693
2002:02 8 364 2 743 15 208 26 315 14 024 11 153
2002:03 8 156 2 399 16 483 27 037 14 647 10 379
2002:04 8 405 2 073 15 655 26 133 14 254 10 411
2003:01 8 887 2 228 15 815 26 930 14 606 10 613
2003:02 9 038 2 223 13 576 24 837 15 409 9 747
2003:03 9 098 2 079 13 362 24 538 16 038 9 839
2003:04 8 190 2 188 13 392 23 769 15 446 8 426
Average for year
2001 9 115 2 935 13 965 26 014 11 706 12 552
2002 8 451 2 523 15 440 26414 13 896 10 909
2003 8 803 2 180 14 036 25 019 15 375 9 656
Percentage annual growth % % % % % %
2001 - - - - - -
2002 -4,3 -27,7 7,6 -0,2 18,3 -13,1
2003 -2,6 5,5 -14,5 -9,0 8,4 -19,1
Market value
Mortgage Instalment Other Specific of security
loans finance loans Total provisions held
R million R million R million R million R million R million
Table 17
Analysis of overdue accounts

Annual Report 2003 – Bank Supervision Department 109
South African Reserve Bank
End of quarter
2001:01 43,9 94,2 3,7 1,6 19,3
2001:02 45,8 94,1 3,5 1,6 18,6
2001:03 44,3 93,0 3,4 1,5 18,8
2001:04 45,9 91,7 3,2 1,5 17,3
2002:01 48,4 93,1 3,0 1,5 15,7
2002:02 53,3 95,7 3,0 1,6 14,2
2002:03 54,2 92,6 3,0 1,6 14,3
2002:04 54,5 94,4 2,9 1,6 13,2
2003:01 54,2 93,6 3,0 1,6 13,8
2003:02 62,0 101,3 2,6 1,6 9,8
2003:03 65,4 105,5 2,6 1,7 8,4
2003:04 65,0 100,4 2,4 1,5 8,5
Average for year
2001 45,0 93,3 3,5 1,6 18,5
2002 52,6 93,9 3,0 1,6 14,4
2003 61,7 100,2 2,7 1,6 10,1
Specific Net overdues1
Specific provisions and Specific as percentage
provisions as a securities held Overdues as provisions as a of net qualifying
percentage of as percentage of percentage of percentage of capital and
total overdues total overdues advances advances reserves
% % % % %
Table 18
Analysis of overdue accounts: selected ratios
1. Net overdues = gross overdues less specific provisions.

South African Reserve Bank
110 Annual Report 2003 – Bank Supervision Department
Quarter
2001:01 1 287 057 125 791 18,0 165,7 1694,9
2001:02 1 396 418 139 732 19,1 186,5 1864,1
2001:03 1 393 886 160 084 20,8 208,7 1816,8
2001:04 1 424 052 178 866 21,8 218,8 1742,3
2002:01 1 474 886 193 166 22,5 225,1 1718,5
2002:02 551 985 188 501 21,2 217,5 636,9
2002:03 522 116 157 145 17,6 180,8 600,7
2002:04 514 160 147 133 16,3 163,2 570,2
2003:01 439 848 157 027 17,4 176 492,9
2003:02 397 579 171 909 17,7 178,5 412,8
2003:03 408 862 161 629 16,8 160,1 405
2003:04 367 618 154 180 15,4 156,9 374,2
Average for year
2001 1 375 353 151 118 19,9 194,9 1779,5
2002 765 787 171 486 19,4 196,6 881,6
2003 403 477 161 186 16,8 167,9 421,2
Percentage annual growth % %
2001 106,4 -7,8
2002 -63,9 -17,7
2003 -28,5 4,8
Utilised Granted
as a percentage as a percentage
Utilised as a of net qualifying of net qualifying
percentage of capital and capital and
Granted Utilised advances reserves reserves
R million R million % % %
Table 19
Large credit exposures

Annual Report 2003 – Bank Supervision Department 111
South African Reserve Bank
Quarter
2001:01 15 702 659 638 54 373 20 903 37 921 11 324 54 222 854 084
2001:02 16 274 688 005 69 850 20 250 34 010 8 517 57 351 894 257
2001:03 18 121 736 120 66 542 22 134 40 855 11 393 52 316 947 480
2001:04 24 014 800 904 60 023 20 901 83 738 4 374 52 789 1 046 744
2002:01 22 407 808 149 76219 26 311 48 781 7 381 57 747 1 046 996
2002:02 21 811 847 513 67 370 25 968 31 481 14 170 55 241 1 063 552
2002:03 23 606 838 350 83 450 29 412 29 206 13 674 52 330 1 070 028
2002:04 26 537 844 033 90 453 35 900 37 835 7 635 57 329 1 099 722
2003:01 23 820 882 842 44799 33 964 160 677 12 875 62 284 1 221 262
2003:02 23 507 981 702 39 887 32 707 208 474 11 008 48 456 1 345 741
2003:03 26 281 976 183 39 682 32 568 232 941 11 897 44 751 1 364 302
2003:04 28 845 1 024 217 33 054 32 619 207 105 11 310 40 470 1 377 620
Average for year
2001 18 528 721 167 62 697 21 047 49 131 8 902 54 169 935 641
2002 23 590 834 511 79 373 29 398 36 342 10 715 55 662 1 070 075
2003 25 613 966 236 39 355 32 964 202 299 11 773 48 990 1 327 231
Percentage annual growth % % % % % % % %
2001 21,0 20,9 38,8 33,9 197,1 -55,9 34,8 27,9
2002 10,5 5,4 50,7 71,8 -54,8 74,6 8,6 5,1
2003 8,7 21,3 -63,5 -9,1 447,4 48,1 -29,4 25,3
Advances Investments
Reasonable Small No Not Infra-
Money margin margin yield Profitable profitable structure Total
R million R million R million R million R million R million R million R million
Table 20
Profitability of assets

South African Reserve Bank
112 Annual Report 2003 – Bank Supervision Department
Average month-end balance for quarter
2001:01 7 183 6 903 280 148 034 148 233 -199 44
2001:02 8 113 7 328 785 152 026 152 739 -713 36
2001:03 9 779 7 335 2 445 171 444 173 867 -2 423 30
2001:04 8 746 7 331 1 416 161 089 162 532 -1 444 40
2002:01 10 282 7 140 3 142 140 597 143 796 -3 200 39
2002:02 11 870 6 290 5 580 125 180 130 877 -5 697 39
2002:03 12 809 5 853 6 956 112 322 119 351 -7 030 38
2002:04 12 612 6 181 6 431 123 758 130 285 -6 527 44
2003:01 12 716 5 747 6 969 130 505 137 611 -7 106 39
2003:02 13 411 5 464 7 947 152 492 160 604 -8 112 72
2003:03 14 989 5 638 9 351 164 472 173 885 -9 413 72
2003:04 15 039 4 817 10 221 152 259 162 859 -10 599 57
Month-end balance for year
Dec 2001 8 231 7 284 947 151 073 152 095 -1 022 42
Dec 2002 12 570 5 884 6 685 116 779 123 563 -6 785 44
Dec 2003 16 667 5 064 11 603 141 197 153 344 -12 147 61
Average for year
2001 8 455 7 224 1 231 158 148 159 343 -1 195 37
2002 11 893 6 366 5 527 125 464 131 077 -5 613 40
2003 14 039 5 417 8 622 149 932 158 740 -8 807 60
Percentage annual growth
2001 22,9 2,9 - 16,8 17,6 -553,4 25,0
2002 44,2 -15,7 354,2 -23,2 -19,8 -352,0 10,0
2003 19,2 -22,1 58,9 23,0 25,0 -62,4 29,5
Commit- Commit-
Total Total ments to ments Mismatched
foreign- foreign- purchase to sell forward
exchange exchange Net spot foreign foreign commit- Foreign
assets liabilities position currency currency ments branches
USA$ million USA$ million USA$ million USA$ million USA$ million USA$ million USA$ million
Table 21
Open position in foreign currency

Annual Report 2003 – Bank Supervision Department 113
South African Reserve Bank
Banks Act Circular 1/2003 Annual withdrawal and retention of circulars
Banks Act Circular 2/2003 Ministerial Panel for the review of the DraftAccounting Profession’s Bill
Banks Act Circular 3/2003 Positions denominated in foreign currency held bybanks
Banks Act Circular 4/2003 Composition of board-appointed committee toapprove large exposures
Banks Act Circular 5/2003 Proposed amended legislation: Designation of anactivity not falling within the meaning of "thebusiness of a bank" – Securitisation schemes,including traditional securitisation schemes andsynthetic securitisation schemes
Banks Act Circular 6/2003 Warning against infiltration of West Africanorganised crime cells into banks in the UnitedStates of America and Europe
Banks Act Circular 7/2003 Amendment to the procedure for the electronicsumission of DI returns to this Office by controllingcompanies, banks, mutual banks, branches offoreign banks and offshore branches of SouthAfrican banks
Banks Act Circular 8/2003 Issue of certain capital instruments
Banks Act Circular 9/2003 Proposed amendments to legislation: Designationof an activity not falling within the meaning of "thebusiness of a bank" – Securitisation schemes,including traditional securitisation schemes andsynthetic securitisation schemes
Banks Act Circular 10/2003 Proposed amendments to legislation: Conditions forthe Conducting of the Business of a Bank by aForeign Institution by means of a Branch in theRepublic
Banks Act Circular 11/2003 Risk weighting of the International FinanceCorporation
Banks Act Circular 12/2003 Proposed amendments to legislation: Designationof an activity not falling within the meaning of "thebusiness of a bank" – Securitisation schemes,including traditional securitisation schemes andsynthetic securitisation schemes, as well asConditions for the Conducting of the Business of aBank by a Foreign Institution by means of a Branchin the Republic
Banks Act Circular 13/2003 Section 44 of the Long-term Insurance Act, 1998(Act No. 52 of 1998)
Banks Act Circular 14/2003 Update on the implementation of the New BaselCapital Accord and request for further information
Banks Act Circular 15/2003 Amendments to form DI 425
Appendix 8
Circulars sent to banking institutions during 2003

South African Reserve Bank
114 Annual Report 2003 – Bank Supervision Department
Section 1(cc): Exemptions by the Registrar of Banks
Government Gazette Topic Expiry
Date Number
1994/12/14 16167 A group of persons between which a common bond exists Indefinite
1994/12/14 16167 Commercial paper Indefinite
1994/12/14 16167 Mining houses Indefinite
1994/12/14 16167 Trade in securities and financial instruments Indefinite
2001/12/13 22948 Securitisation schemes Indefinite
Section 1(dd): Exemptions by the Minister of Finance
Government Gazette Topic Subparagrph Expiry
Date Number
2000/12/28 21941 Financial service co-operative (dd)(i) 2005/12/31
2004/03/19 26143 The National Housing Finance Corporation Limited (dd)(i) 2005/12/31
2003/04/17 24731 Ithala Development Finance Corporation Limited (dd)(i) 2005/12/31
1991/01/31 13003 Participation bond schemes (dd)(ii) Indefinite
1991/01/31 13003 Unit trust schemes (dd)(ii) Indefinite
Section 1(gg): Exemptions by the Registrar of Banks
Government Gazette Topic Expiry
Date Number
1998/09/22 19283 Members of the Johannesburg Stock Exchange as persons authorised to accept money as mandataries and to deposit such money into banking accounts maintained by them Indefinite
Section 2(vii): Exclusions by the Minister of Finance
Government Gazette Topic Expiry
Date Number
1992/01/24 13744 Post Office Savings Bank Indefinite
1994/12/14 16167 Industrial Development Corporation of SA Limited Indefinite
SECTION 78(1)(d)(iii): Exemptions by the Registrar of Banks
Government Gazette Topic Expiry
Date Number
1997/05/02 17949 Category of assets of a bank held in the name of a person other than the bank concerned Indefinite
Appendix 9
Exemptions and exclusions from the application of the BanksAct, 1990

Annual Report 2003 – Bank Supervision Department 115
South African Reserve Bank
Name of bank/ Date of Name of interest (and percentage Countrycontrolling company approval interest held, if not 100 per cent)
ABSA Group Limited 2003-04-14 ABSA Life Limited – Jersey Branch Jersey
FirstRand Bank Holdings Limited 2003-01-14 Austral Refrigeration (Pty) Limited and subsidiaries Australia
FirstRand Bank Holdings Limited 2003-01-29 LN Metals International Limited United Kingdom(30 per cent)
FirstRand Bank Holdings Limited 2003-04-22 Ansbacher Wealth (Caribbean) Limited Cayman Islands
FirstRand Bank Holdings Limited 2003-07-10 Ausenco Limited (16,67 per cent) Australia
FirstRand Bank Holdings Limited 2003-07-28 Tradestream Limited GuernseyUtrade Limited
FirstRand Bank Holdings Limited 2003-12-05 Osprey Oil and Gas Limited United Kingdom(15 per cent)
Genbel Securities Limited 2003-03-07 Axes Holdings Incorporated United States of(100 000 preference shares) America
Genbel Securities Limited 2003-03-07 Botswana Choice Limited(50 per cent) Botswana
Investec Limited 2003-10-23 Investec Insurance Services (Pty) Limited Botswana
Investec Limited 2003-10-28 Investec Assurance Limited (branch office in Guernsey) Guernsey
Investec Plc* 2003-06-24 Investec Wentworth Private Equity (Pty) LimitedIWPE Nominees (Pty) LimitedInvestec Australia Direct Investments (Pty) Limited Australia
Investec Plc* 2003-06-25 Investec Nominees (Pty) Limited Australia
Investec Plc* 2003-06-26 Investec Property General Partner Limited Guernsey
Investec Plc* 2003-06-26 Investrack Limited United Kingdom(50 per cent)
Investec Plc* 2003-06-26 Datong Electronics Incorporated United States of America
Investec Plc* 2003-06-26 Innorate Profits Limited Hong Kong(25 per cent)
Investec Plc* 2003-06-26 Hero Nominees Limited Guernsey
Investec Plc* 2003-06-26 Investec Asset Management Solutions Limited GuernseyFiscus Fund Administration Services LimitedFiscus Software Limited
Investec Plc* 2003-10-10 Investec Financial Management Limited Ireland
Investec Plc* 2003-10-13 Enterprise Business Centers Dover Street Limited United Kingdom
Investec Plc* 2003-12-30 Lombard Corporate Finance (2) Limited United Kingdom
* Note: Applications in respect of Investec Plc to establish or acquire foreign interests or subsidiaries were noted in terms of theconditions of approval of the Investec dually listed company structure.
Appendix 10
Approval of acquisition or establishment of foreign banking interests in terms of section 52 of the Banks Act, 1990, from 1 January 2003 to31 December 2003

Name of bank/ Date of Name of interest (and percentage interest Countrycontrolling company approval held, if not 100 per cent)
Standard Bank Group Limited 2003-05-14 Stanbic Investment Management Services BotswanaLimited – Botswana (50 per cent)
Standard Bank Group Limited 2003-06-20 Stanbic Investment Management Services Uganda(East Africa) Limited – Uganda Branch
Standard Bank Group Limited 2003-06-20 Stanbic Insurance Services Botswana(Botswana) (Pty) Limited
Standard Bank Group Limited 2003-06-20 Stanbic Investment Management Services NigeriaLimited – Nigeria (50 per cent)
Standard Bank Group Limited 2003-08-07 Standard Resources (China) Limited Peoples Republic of China
Standard Bank Group Limited 2003-10-30 Triskelion Trust Company Limited and Isle of Mansubsidiaries
Standard Bank Group Limited 2003-12-04 - Osprey Oil and Gas Limited United Kingdom(12,5 per cent)
- Sino Gold Limited (10,28 per cent) Australia
Standard Bank Group Limited 2003-12-17 GCC Energy Fund LP and associated Cayman Islandscompanies (50 per cent) and United
Arab Emirates
Standard Bank Group Limited 2003-12-24 Banco Standard Totta de Mocambique MozambiqueSARL (to be renamed Standard Bank SARL, Mozambique) (96,0058 per cent)
Appendix 10
Approval of acquisition or establishment of foreign banking interests in terms of section 52 of the Banks Act, 1990, from 1 January 2003 to31 December 2003 (continued)
116 Annual Report 2003 – Bank Supervision Department
South African Reserve Bank