Embed Size (px)
Citation preview

C E N T R A L B A N K O F K E N Y ABANK SUPERVISION ANNUAL REPORT 2020
1

C E N T R A L B A N K O F K E N Y ABANK SUPERVISION ANNUAL REPORT 2020
I
TABLE OF CONTENTS
VISION STATEMENT VTHE BANK’S MISSION VMISSION OF BANK SUPERVISION DEPARTMENT VTHE BANK’S CORE VALUES VGOVERNOR’S MESSAGE VIFOREWORD BY DIRECTOR, BANK SUPERVISION VIIEXECUTIVE SUMMARY IXCHAPTER ONESTRUCTURE OF THE BANKING SECTOR1.1 The Banking Sector 21.2 Ownership and Asset Base of Commercial Banks 41.3 Distribution of Commercial Banks Branches 51.4 Commercial Banks Market Share Analysis 51.5 Automated Teller Machines (ATMs) 71.6 Asset Base of Microfinance Banks 71.7 Microfinance Banks Market Share Analysis 81.8 Distribution of Foreign Exchange Bureaus 10CHAPTER TWODEVELOPMENTS IN THE BANKING SECTOR2.1 Introduction 122.2 Banking Sector Charter 122.3 Legal and Regulatory framework 122.4 Consolidation, Mergers and Acquisitions, New Entrants 122.5 Medium, Small and Micro-Enterprises (MSME) Support 132.6 Coronavirus (COVID-19) pandemic: 13
• Measures to Mitigate the Impact of COVID-19 Pandemic 14• Impact and Outcomes of COVID-19 Mitigation Measures 15
2.7 Developments in Information and Communication Technology 152.8 Mobile Phone Financial Services 222.9 New Products 232.10 Operations of Representative Offices of Authorized Foreign Financial Institutions 242.11 Surveys 2020: 25
• Residential Mortgage Market Survey 2020• Micro, Small and Medium Enterprises (MSME) Survey 2020• Innovations Survey 2020
252730
2.12 Innovative MSME Products by Banks 322.13 Employment Trends in the Banking Sector 322.14 Future Outlook 32

C E N T R A L B A N K O F K E N Y ABANK SUPERVISION ANNUAL REPORT 2020
II
TABLE OF CONTENTS
CHAPTER THREEMACRO-ECONOMIC CONDITIONS AND BANKING SECTOR PERFORMANCE 3.1 Global Economy 343.2 Regional Economy 343.3 Domestic Economy 353.4 Inflation 373.5 Exchange Rates 383.6 Interest Rates 383.7 Balance of Payments 393.8 Fiscal Developments 393.9 Performance of the Banking Sector 403.10 Commercial Banks Balance Sheet Analysis 403.11 Sectoral Distribution of Gross Loans, Loan Accounts and Gross Non-Performing Loans 413.12 Asset Quality 433.13 Capital Adequacy 443.14 Liquidity 443.15 Profit and Loss 443.16 Performance Rating 453.17 Compliance with Supervisory and Regulatory Requirements 463.18 Performance of Microfinance Banks 473.19 Agency Banking 483.20 Credit Reference Bureaus 503.21 Money Remittance Providers 51CHAPTER FOURDEVELOPMENTS IN SUPERVISORY FRAMEWORK4.1 Introduction 554.2 Proposed Amendments to the CBK Act 554.3 Host Country Assessments 554.4 Developments in Anti-Money Laundering and Combating Financing of Terrorism 564.5 International Financial Reporting Standards 574.6 Developments in Digital Lending/Credit 58CHAPTER FIVEREGIONAL AND INTERNATIONAL DEVELOPMENTS AND INITIATIVES5.1 Introduction 615.2 Regional and International Initiatives 615.3 Kenyan Banks Regional Footprint 69

C E N T R A L B A N K O F K E N Y ABANK SUPERVISION ANNUAL REPORT 2020
III
TABLE OF CONTENTS
TABLES 1 Ownership and Asset Base of Commercial Banks 42 Commercial Banks Market Share Analysis 53 ATM Networks 74 Microfinance Banks Balance Sheet Analysis 85 Microfinance Banks Market Share Analysis 96 Distribution of Foreign Exchange Bureaus 107 Growth of Deposit Account Holders Compared to Number of Staff 228 Mobile Transactions Data 239 Business Activities Facilitated by Representative Offices 2410 Residential Mortgage Market Survey 2020 2611(a) MSME Lending Compared to Total Banking Sector Loan Portfolio 2811(b) MSMEs Deposits Held in Commercial Banks 2811(c) MSMEs Deposits Held in Microfinance Banks 2911(d) Income from MSMEs Lending as a proportion of Total Banking Sector Income 2911(e) MSME Credit Facilities – Asset Quality 2019 – 20 (Ksh. Billion) 2912 Employment in the Banking Sector 3213 World Economic Outlook Projections 3514 Real GDP Growth 3615 Exchange Rate Developments 3816 Fiscal Developments 4017 Global Balance Sheet Analysis 4118 Sectoral Distribution of Loans, Loan Accounts and Non-Performing Loans (NPLs) 4219 Risk Classification of Loans and Advances 4320 Asset Quality and Provisions 4421 Capital Adequacy Ratios 4422 Income and Expenditure Items as a Percentage of Total Income/Total Expenses 4523 Banking Sector Performance Rating 4624 Performance of Microfinance Banks 4825a Agency Banking Data for Banks – Number of Transactions 4925b Agency Banking Data for Banks – Value of Transactions 4926 Number of Credit Reports Requested Since August 2015 5127 Distribution of Outlets and Agents of MRPs 5228 Total Remittance Inflows and Outflows of MRPs in 2019 and 2020 5329 Branches of Kenyan Banks Subsidiaries in the Region 6930 Regional Employee Count 7031 Total Assets of Subsidiaries in Host Country 7032 Deposit Distribution across Host Countries 71

TABLE OF CONTENTS
C E N T R A L B A N K O F K E N Y ABANK SUPERVISION ANNUAL REPORT 2020
IV
CHARTS 1 Structure of the Banking Sector 22 Bank Supervision Organogram 43 Ownership and Asset Base of Commercial Banks 54 Commercial Banks Market Share 65a Microfinance Banks Functional Areas of Innovation 315b Commercial Banks Functional Areas of Innovation 316 Developments in Inflation 377 Interest Rates 388 Developments in Current Accounts 399 Risk Classification of Loans and advances 4310 Total Monthly Credit Reports requested by Banks 5111 Percent of Gross Loans per Host Country 7112 Regional Profitability 72APPENDICES i Banking Sector Balance Sheet 73ii Banking Sector Profit and Loss Account 74iii Banking Sector Other Disclosures 75iv Banking Sector Market Share 76v Banking Sector Profitability 77vi Banking Sector Gross Loans and Non-Performing Loans (NPLs) 78vii Banking Sector Capital and Risk-Weighted Assets 79viii Banking Sector Access to Financial Services 80ix Banking Sector Protected Deposits 81x Microfinance Banks Balance Sheet 82xi Microfinance Banks Profit and Loss Account 83xii Microfinance Banks Other Disclosures 84xiii Residential Mortgages Market Development Survey, December 2020 85xiv Banking Circulars Issued in 2020 86xv A Summary of Signed MOUs 87xvi Banks Branch Network by County 88xvii Directory of Commercial Banks and Non-Banks 89xviii Directory of the Microfinance Banks 98xix Directory of Credit Reference Bureaus 100xx Directory of Foreign Exchange Bureaus 101xxi Directory of Money Remittance Providers 105

C E N T R A L B A N K O F K E N Y ABANK SUPERVISION ANNUAL REPORT 2020
V

C E N T R A L B A N K O F K E N Y ABANK SUPERVISION ANNUAL REPORT 2020
VI
GOVERNOR’S MESSAGE
Dr. Patrick NjorogeGovernor, Central Bank of Kenya
The banking sector entered 2020 on a strong footing poised to rebound after interest rate caps were repealed in 2019. At that point, the coronavirus (COVID-19) pandemic that was to define 2020 did not feature in global discourse. At the Central Bank of Kenya (CBK), we had keenly followed the onset of the virus in China in early 2020 and its devastating spread to Europe and the United States. It was just a matter of time before it landed on our shores.
We therefore moved quickly in tandem with the government, the banking sector and other players to institute measures to mitigate the adverse impact of the pandemic when it landed in Kenya in March. The measures were intended to facilitate Kenyans to use digital financial services to mitigate the COVID-19 infection risks, ensure continued operations of the banking sector while safeguarding the health and safety of bank staff, customers and the public. Further, the measures were intended to provide relief to borrowers adversely impacted by the effects of the pandemic.
Building on business continuity and pandemic response guidance from CBK, the banking sector during the pandemic ‘kept the lights on.’ While ensuring the health and safety of customers and staff, over 90 percent of the approximately 1,500 bank branches across the country remained open. The over 30,000 bank staff have been in the frontline serving Kenyans even in areas locked down to contain the pandemic.
To minimize the health risk and support Ministry of Health ‘stay at home’ protocols, banks have enhanced the use of digital channels. Before the pandemic, on average, close to 90 percent of bank transactions were conducted outside branches. During the pandemic, this has accelerated to over 94 percent of transactions. Most notably, over 67 percent of transactions are conducted on mobile phones up from 55 percent before the pandemic.
To support borrowers in these difficult times, CBK announced emergency measures by banks to restructure personal, Micro, Small and Medium Enterprises (MSMEs) and corporate loans. This was intended to provide relief to borrowers with up to date loans who through no fault of their own were adversely impacted by the pandemic. As at the end of December 2020, banks had restructured loans worth Ksh.1.6 trillion or 54 percent of the total
banking sector loans. The over 400,000 loan accounts restructured range from your neighborhood hair salon, individuals, MSMEs, large flower farms, airlines, hotel chains to shopping malls and transport companies.
As a testament to its resilience in a year dominated by COVID-19, the sector closed the year with a total capital adequacy ratio of 19.0 percent above the statutory minimum capital adequacy ratio of 14.5 percent. The sector’s liquidity ratio of 54.5 percent was above the statutory minimum of 20 percent. Total net assets grew by 12.4 percent from Ksh.4.8 trillion in December 2019 to Ksh.5.4 trillion in December 2020. Customer deposits increased by 13.6 percent from Ksh.3.5 trillion in December 2019 to Ksh.4.0 trillion in December 2020.
On the economic front, the onset of the pandemic was delayed in Sub-Saharan Africa, but by year end, the region was battling an unprecedented health and economic crisis. This was underpinned by stringent containment measures instituted to control the pandemic. On the domestic front, the Kenyan economy contracted in the first three quarters of 2020 following the devastating impact of COVID-19. The contraction was mainly driven by significant declines in the Services sector that bore the brunt of the COVID-19 containment measures.
As we build back from COVID-19, CBK’s vision remains one of a banking sector that is responsible, disciplined and aligned to customers’ needs. Accordingly, banks continue to operationalize the four pillars of the vision: customer centricity, risk-based credit pricing, transparency and doing the right thing. The pandemic has only served to underscore the relevance and importance of the vision and the pillars.
With accelerated digitization, customer centricity remains paramount as customers demand a fast and efficient service experience. At the same time, digital platforms must be secure, protecting customer’s funds and importantly their personal data. Banks must therefore calibrate the right balance, as they move to, and orchestrate a ‘digital first’ strategy.

C E N T R A L B A N K O F K E N Y ABANK SUPERVISION ANNUAL REPORT 2020
VII
FOREWORD BY DIRECTOR, BANK SUPERVISION
The Kenyan banking sector remained stable and agile in 2020 despite the COVID-19 pandemic, whose first Kenyan case was reported in early March 2020. The year was characterised by restrictions on movement through lockdowns and curfew hours. The sector ramped up their online/mobile platforms to continue offering banking services in the midst of the pandemic and at the same time ensured that the channels remained secure and available.
Despite the effect of COVID-19 pandemic, the sector’s gross loans and advances increased by 7.2 percent from Ksh.2.7 trillion in December 2019 to Ksh.2.9 trillion in December 2020. All the economic sectors registered growth in loans other than Mining and Quarrying that had a slight decline. The highest proportion of the banking industry gross loans and advances was channelled to the Personal/Household, Trade, Real Estate and Manufacturing sectors.
The key highlights of the sector’s financial performance were:-
• Total net assets grew by 12.4 percent from Ksh.4.8 trillion in December 2019 to Ksh.5.4 trillion in December 2020.
• Customer deposits increased by 13.6 percent from Ksh.3.5 trillion in December 2019 to Ksh.4.0 trillion in December 2020.
• The pre-tax profit for the sector decreased by 29.3 percent from Ksh.159.1 billion in December 2019 to Ksh.112.1 billion in December 2020. The decrease in profitability in 2020 is attributed to a higher growth in total expenses by 22.6 percent as compared to the increase in total income by 7.6 percent.
• The banking sector average liquidity ratio as at December 2020 stood at 54.5 percent as compared to 49.7 percent registered in December 2019. The increase in the ratio is mainly attributed to higher growth in total liquid assets compared to the growth in total short-term liabilities. Total liquid assets grew by 23.7 percent while total short-term liabilities grew by 13.2 percent. The banking sector’s liquidity ratio of 54.5 as at December 2020 percent was above the statutory minimum requirement of 20 percent.
• The ratio of gross non-performing loans to gross loans deteriorated from 12.5 percent in December 2019 to 14.5 percent in December 2020. The increase
in gross non-performing loans to gross loans ratio in 2020 was mainly attributable to the higher growth in non-performing loans compared to the growth in gross loans. Non-performing loans grew by 29.6 percent as compared to the increase in gross loans by 11.7 percent.
Licence Approvals
• The Kenya Mortgage Refinance Company (KMRC) Plc was granted a license to conduct mortgage refinance business in Kenya on September 3, 2020.The establishment of mortgage refinance companies in Kenya is aimed at developing an active secondary mortgage market in Kenya for provision of long-term funding to primary mortgage lenders including commercial banks, microfinance banks and Savings and Credit Co-operatives (SACCOs).
Consolidations, Mergers and Acquisitions
The following institutional changes in the banking industry took place during the year:
• Access Bank Plc (of Nigeria) completed its acquisition of Transnational Bank Plc effective February 1, 2020.
• Commercial International Bank (Egypt) S.A.E (CIB) acquired 51 percent shareholding of Mayfair Bank Ltd effective May 1, 2020. Following the acquisition, Mayfair Bank Ltd was renamed Mayfair CIB Bank Limited.
• KCB Bank Kenya Limited (KCB Bank) acquired certain assets of Imperial Bank (Kenya) Limited (In Receivership) (IBLIR) valued at Ksh.3.2 billion and assumed liabilities of the same value with effect from June 2, 2020.
• The Co-operative Bank of Kenya Ltd acquired 90 percent of the issued share capital of Jamii Bora Bank Ltd effective August 21, 2020. Subsequently, Jamii Bora Bank Ltd was renamed Kingdom Bank Limited in August 2020.
The banking sector is projected to remain stable and to sustain its growth momentum in 2021 as the outcomes of various reform initiatives in the banking sector continue

C E N T R A L B A N K O F K E N Y ABANK SUPERVISION ANNUAL REPORT 2020
VIII
FOREWORD BY DIRECTOR, BANK SUPERVISION
to manifest. Some of the reforms and initiatives planned include;
• Focus on post COVID-19 agility of the banking sector by enhancing banks’ compliance with the Kenya banking sector charter. This will include strengthening risk-based credit pricing through review of banks’ risk-based pricing models, enhancing customer centricity through undertaking customer satisfaction surveys and entrenching ethical banking.
• Strengthening banking sector liquidity by issuance of guidance on Internal Liquidity Adequacy Assessment Process (ILAAP). ILAAP is an effective framework for liquidity risk management. It will strengthen the liquidity resilience of banks and enable them ride through periodic liquidity shocks.
• Moving towards ‘near real-time’ supervision through Enterprise Data Warehouse (EDW) Integration between CBK and supervised financial institutions. This will be pursued through closer linkage between CBK’s EDW and financial institutions’ ICT systems. This will enable capturing of data on a near real-time basis to facilitate enhanced monitoring by CBK and deployment of prompt corrective actions as needed.
• Reskilling/Upskilling staff competencies in data science and analytics relevant to supervisory technologies1. This will enhance organization-wide data fluency skills on emerging technologies for data management and analyses, at the same time facilitate the gathering of insights to aid decision making.
1 Supervisory technologies (suptech) is the use of innovative technologies by supervisory agencies to support supervision. They help supervisory agencies to digitise reporting and regulatory processes, resulting in more efficient and proactive monitoring of risk and compliance at financial institutions.
Gerald NyaomaDirector, Bank Supervision Department

C E N T R A L B A N K O F K E N Y ABANK SUPERVISION ANNUAL REPORT 2020
IX
EXECUTIVE SUMMARY
“A year like no other”. The year 2020, was a year like no other. It was dominated by a “once in a hundred years” pandemic. The COVID-19 pandemic upended lives and livelihoods globally. The resolve of the global populace, corporate and public entities was tested like never before. The silver lining of the pandemic was the agility of individuals and entities in responding to the “new normal” defined by the pandemic.
The global and regional economies. Global economic growth is estimated to have contracted by 3.5 percent in 2020 from a growth of 2.6 percent in 2019. This was mainly as result of the COVID-19 pandemic which affected business activities and livelihoods worldwide. Similarly, the regional economy (Sub-Saharan Africa (SSA)) is estimated to have contracted by 2.6 percent in 2020 from a growth of 3.1 percent in 2019.
The domestic economy contracted in the first three quarters of 2020 following the devastating impacts of the COVID-19 pandemic which disrupted global as well as domestic economic activities. Real GDP contracted by 0.4 percent in the first three quarters of 2020 from a growth of 5.4 percent in 2019 mainly underpinned by a significant decline in the services sector. Overall inflation remained within the Government target band. As measured by the Consumer Price Index (CPI), it decreased from 5.2 percent in 2019 to 4.9 percent in 2020 mainly on account of lower food inflation following reduced prices of key food items. Non-Food-Non-Fuel inflation remained low and stable in 2020, reflecting muted demand pressures in the economy.
Performance of the banking sector. The sector’s asset base grew by 12.4 percent in 2020, an increase from 10.1 percent growth in 2019. The increase in total assets was mainly attributed to growth in investment in government securities and loans and advances. The sector recorded strong capitalization levels as a result of retention of profits and additional capital injections. The sector’s capital adequacy ratio stood at 19.0 percent in 2020, an increase from 18.8 percent registered in 2019. However, the sector recorded a 29.5 percent decline in profitability as a result of a higher increase in expenses by 22.8 percent as compared to an increase in income of 7.3 percent. This report highlights the structure of the Kenyan banking sector, supervisory developments, macroeconomic conditions, banking sector performance, regional and international development initiatives. The banking sector is projected to remain resilient in 2021 as banks position themselves for the post COVID-19 recovery. Banks will review their business models for agility in the era of “anytime anywhere” financial services.

C E N T R A L B A N K O F K E N Y ABANK SUPERVISION ANNUAL REPORT 2020
1
STRUCTURE OF THE BANKING SECTOR
C E N T R A L B A N K O F K E N Y ABANK SUPERVISION ANNUAL 2020
1
CHAPTER 1

C E N T R A L B A N K O F K E N Y ABANK SUPERVISION ANNUAL REPORT 2020
2
STRUCTURE OF THE BANKING SECTOR
Chart 1: Structure of the Banking Sector - December 2020
1.1 The Banking Sector
As at December 31, 2020, the Kenyan banking sector comprised of the Central Bank of Kenya (CBK), as the regulatory authority, 42 banking institutions (412
commercial banks and 1 mortgage finance company), 9 representative offices of foreign banks, 14 Microfinance Banks (MFBs), 3 Credit Reference Bureaus (CRBs), 17 Money Remittance Providers (MRPs), 8 non-operating bank holding companies, 1 Mortgage Refinance Company and 66 foreign exchange (forex) bureaus. Out of the 42 banking institutions, 40 were privately owned while the Kenya Government3
2 Includes Charterhouse Bank Limited and Chase Bank (K) Ltd which are In Liquidation and Imperial Bank Ltd, which is In Receivership.
³ GOK shareholding includes shares held by state corporations.
had majority ownership in 2 institutions. Of the 40 privately owned banks, 23 were locally owned (the controlling shareholders are domiciled in Kenya) while 17 were foreign-owned. The 23 locally owned institutions comprised 22 commercial banks and 1 mortgage finance company. Of the 17 foreign-owned institutions, all are commercial banks with 14 being local subsidiaries of foreign banks and 3 are branches of foreign banks. All licensed forex bureaus, microfinance banks, credit reference bureaus, money remittance providers, non-operating bank holding companies and mortgage refinance company were privately owned. Chart 1 below depicts the structure of the banking sector as at December 31, 2020.
LocalForeign
(Over 50%)
PublicInstitutions
(2)
PrivateInstitutions
(40)
Non-operating bank holding companies (8)
Forex Bureaus (66)
MFBs (14) CRBs (3) MRPs (17)
Mortgage Refinance
Company (1)
Representative
Commercial Banks - 22Mortgage Finance Company - 1
Commercial Banks - 17
Central Bank of Kenya

C E N T R A L B A N K O F K E N Y ABANK SUPERVISION ANNUAL REPORT 2020
3
STRUCTURE OF THE BANKING SECTOR
Bank Supervision Department
The Bank Supervision Department (BSD)’s mandate as stipulated under section 4(2) of the Central Bank of Kenya Act is to foster liquidity, solvency and proper functioning of a stable market-based financial system. The following are the main functions of BSD: -
i. Development of legal and regulatory frameworks to foster stability, efficiency and access to financial services. The Department achieves this objective through: -
• Continuous review of the Banking Act, Microfinance Act, Building Societies Act, Regulations and Guidelines issued thereunder which lay the legal foundation for banking institutions, non-bank financial institutions, deposit taking microfinance institutions and building societies.
• Continuous review of Regulations and Guidelines for Foreign Exchange Bureaus licensed under the Central Bank of Kenya Act.
• Continuous review of Regulations for Credit Reference Bureaus licensed under the Banking Act.
ii. Processing licenses of Commercial Banks, Non-Bank Financial Institutions, Mortgage Finance Institutions, Building Societies, Foreign Exchange Bureaus, Microfinance Banks, Credit Reference Bureaus, Mortgage Refinance Company and Money Remittance Providers.
iii. Conducting onsite evaluation of the financial condition and compliance with statutory and prudential requirements of institutions licensed under the Banking Act, Microfinance Act; and Foreign Exchange Bureaus, Mortgage Refinance Company and Money Remittance Providers licensed under the Central Bank of Kenya Act.
iv. Conducting offsite surveillance of institutions licensed under the Banking Act, Microfinance Act, and Foreign Exchange Bureaus, Mortgage Refinance
Company and Money Remittance Providers licensed under the Central Bank of Kenya Act through the receipt and analysis of returns received periodically. The Department also processes corporate approvals for banking institutions in regard to opening and closing of places of business, the appointment of directors and senior managers, appointment of external auditors, the introduction of new products/services, increase of bank charges and review of annual license renewal applications in accordance with statutory and prudential requirements.
v. Hosting of the Secretariat for the National Task Force on Money Laundering (NTF) whose mandate is to develop a legal and regulatory framework to counter and prevent the use of the Kenyan financial system for money laundering. The NTF is chaired by the National Treasury. Through the NTF, BSD participates in initiatives by the Eastern and Southern Africa Anti-Money Laundering Group (ESAAMLG). ESAAMLG brings together 14 Eastern and Southern Africa countries with a principal mandate of developing a legal and regulatory Anti Money Laundering (AML) framework.
vi. Participation in regional activities organized by regional and international bodies or associations such as the World Bank, International Monetary Fund (IMF), East African Community (EAC), and Common Market for Eastern and Southern Africa (COMESA), the Alliance for Financial Inclusion (AFI) and African Rural and Agricultural Credit Association (AFRACA).
vii. Facilitation of the signing of Memoranda of Understanding (MOUs) between the Central Bank of Kenya and other local or foreign supervisory authorities.
viii. As at December 31, 2020, the Bank Supervision Department had a staff complement of eighty seven (87) comprising eighty (80) technical staff and seven (7) support staff. The department is divided into three divisions as shown in Chart 2.

C E N T R A L B A N K O F K E N Y ABANK SUPERVISION ANNUAL REPORT 2020
4
Chart 2: Bank Supervision Organogram
STRUCTURE OF THE BANKING SECTOR
1.2 Ownership and Asset Base of Commercial BanksThe total net assets in the banking sector stood at Ksh.5.4 trillion as at December 31, 2020, compared to Ksh.4.8 trillion as at December 2019, recording a growth of 12.4 percent. There were 20 operating local private commercial banks and 2 operating local public commercial banks, which accounted for 66.8 percent and 0.6 percent of total net assets respectively. A total of 17 operating commercial banks were foreign owned and accounted for 32.6 percent of the sector’s assets as indicated in Table 1 and Chart 3.
Table 1: Ownership and Asset Base of Commercial Banks Ownership Number of operating
banks% of Total Total Net Assets,
Ksh.M% of Total
Local Public Commercial Banks 2 5.1 30,108 0.6
Local Private Commercial Banks* 20 51.3 3,613,451 66.8
Foreign Commercial Banks 17 43.6 1,762,188 32.6
Total 39 100.0 5,405,746 100.0* Charterhouse Bank Limited and Chase Bank (K) Limited, which were in Liquidation and Imperial Bank Ltd which was in Receivership
have been excluded.
Source: CBK
Assistant Director,Surveillance Banks
Assistant Director,Surveillance Non -
Banks
Portfolio Managers, Microfinance Banks
and CRBs
Portfolio Managers, Forex Bureaus and Money Remittance
Providers
Director, BSD
Assistant Director,Policy
Portfolio ManagersBanks
Portfolio Managers, Policy Research, Legal and AML,
Finacial Inclusion, Databank and Administration
Policy Research, AML and Compliance, Finacial
Inclusion, Databank and Administration Teams
Surveillance Teams Banks
Surveillance Teams Microfinance Banks
and CRBs
Surveillance Teams - FXBs, MRPs
Source: CBK

C E N T R A L B A N K O F K E N Y ABANK SUPERVISION ANNUAL REPORT 2020
5
Ownership Asset Base of Commercial Banks
STRUCTURE OF THE BANKING SECTOR
Chart 3: Ownership and Asset Base of Commercial Banks December 2020
Distribution of Commercial Banks BranchesThe number of bank branches increased marginally from 1,490 in 2019 to 1,502 in 2020, which translated to an increase of 12 branches. Nairobi County registered the highest increase in the number of branches by 4 branches (Appendix XV). A total of 15 counties registered an increase of 23 bank branches while 9 counties registered a decrease of 11 bank branches. In 23 counties, there was no change in bank branches.
Branches remain an important delivery channel increasingly used for high value transactions and advisory services for MSMEs, Corporates and high networth individuals.
Commercial Banks Market Share AnalysisThe Kenyan commercial banks are classified into three peer groups using a weighted composite index. The index comprises net assets, customer deposits, capital and reserves, number of deposit accounts and number of loan accounts. A bank with a weighted composite index of 5 percent and above is classified as a large bank. A medium bank has a weighted composite index of between 1 percent and 5 percent while a small bank has a weighted composite index of less than 1 percent.
For the year ended December 31, 2020, there were 9 large banks with a combined market share of 74.55 percent, 9 medium banks with a combined market share of 17.21 percent and 21 small banks with a combined market share of 8.24 percent as shown in Table 2, Chart 4 and Appendix IV.
Table 2: Commercial Banks Market Share Analysis
Peer Group
Combined Weighted Market Share (%)
No. of Institutions
Total Net Assets, (Ksh. B)
Total Deposits, (Ksh. B)
Capital and Reserves (Ksh. B)
Profit Before Tax (Ksh.B)
Dec-19 Dec-20 Dec-19 Dec-20 Dec-19 Dec-20 Dec-19 Dec-20 Dec-19 Dec-20 Dec-19 Dec-20Large 74.68 74.55 9 9 3,607 4,033 2,710 3,061 538 599 143 97Medium 17.10 17.21 9 9 805 910 623 732 130 141 18 17Small 8.22 8.24 21 21 398 463 299 330 61 68 -2 -3Total* 100 100 39 39 4,809 5,406 3,632 4,123 729 807 159 112* Charterhouse Bank Limited and Chase Bank (K) Limited, which were in Liquidation and Imperial Bank Ltd, which were was in Receivership
have been excluded.Source: CBK
Total Assets Ksh.5,405.7 B

C E N T R A L B A N K O F K E N Y ABANK SUPERVISION ANNUAL REPORT 2020
6
STRUCTURE OF THE BANKING SECTOR
There were shifts in market share positions for the banks in the three peer groups: -
• Banks in large peer group decreased their combined market share from 74.68 percent in December 2019 to 74.55 percent in December 2020.
• The combined market share of banks in the medium peer group increased from 17.10 percent in December 2019 to 17.21 percent in December 2020.
• Banks in Small Peer group had a combined market share of 8.2 percent in December 2020 which was the same as in December 2019.
Chart 4: Commercial Banks Market Share (%) December 2020
Capital and Reserves Size
Asset Size
Pre-Tax Profits
Total Deposits
Source: CBK

C E N T R A L B A N K O F K E N Y ABANK SUPERVISION ANNUAL REPORT 2020
7
STRUCTURE OF THE BANKING SECTOR
In 2020, the banking sector capital and reserves increased by 10.8 percent from Ksh.728.82 billion in December 2019 to Ksh.807.46 billion in December 2020. All the peer groups registered increased capital and reserves. The increase in capital and reserves is attributable to additional capital injections by commercial banks as well as retained earnings from the profits realized in the year.
The banking sector registered decline in performance in 2020 with profit before tax decreasing by 29.5 percent to Ksh.112.2 billion in December 2020 from Ksh.159.1 billion in December 2019. The decrease in profitability is attributed to a higher increase in expenses (Ksh.77.47 billion) compared to increase in income (Ksh.30.54 billion).
The large peer group accounted for 89.94 percent of the total pre-tax profit, an increase from 89.79 percent recorded in 2019. The small peer group proportion of total pre-tax profit decreased from negative 1.03 percent in 2019 to negative 2.23 percent in 2020. This was attributable to 8 banks making losses at a higher magnitude in 2020 compared to 7 banks, which made losses at a lower magnitude in 2019. The medium peer group proportion of total pre-tax profit increased to 15.29 percent in 2020 from 11.24 percent in 2019.
Total deposits increased by 13.9 percent from Ksh.3.60 trillion in December 2019 to Ksh.4.1 trillion in December 2020. The growth was supported by mobilization of deposits through agency banking and mobile phones platforms.
1.5 Automated Teller Machines (ATMs)The number of Automated Teller Machines (ATMs) decreased by 47 (1.4 percent) to 2,412 in December 2020 from 2,459 in December 2019 as indicated in Table 3. The general decrease in ATMs in 2020 is as a result of adoption of mobile and digital banking in the banking industry.
The rate of digitization of financial services in the banking sector was propelled by the emergency measures to encourage use of digital platforms. This included waiver of charges on mobile money transactions below Ksh.1,000, transfers between mobile money wallets and
bank accounts and increase of mobile money wallets limits from Ksh.150,000 to Ksh.300,000.
Table 3: ATM NetworkMonth No. of ATMs Monthly
Increase/ (Decrease)
Percentage Growth (%)
Dec-19 2,459 (4) (0.16)
Jan-20 2,459 35 1.44
Feb-20 2,433 (26) (1.06)
Mar-20 2,431 (2) (0.08)
Apr-20 2,435 4 0.16
May-20 2,423 (12) (0.49)
Jun-20 2,425 2 0.08
July-20 2,424 (1) (0.04)
Aug-20 2,410 (14) (0.58)
Sep-20 2,409 (1) (0.04)
Oct-20 2,409 0 0.00
Nov-20 2,400 (9) (0.37)
Dec-20 2,412 12 0.50
Source: CBK
1.6 Asset Base of Microfinance BanksThe number of licensed microfinance banks remained at fourteen (14), as at December 31, 2020. Out of fourteen microfinance banks, three (3) held community microfinance bank licences, while eleven (11) held nationwide microfinance bank licences.
The microfinance sector registered a 2 percent decline in total assets in the year 2020. The total assets as at December 31, 2020 stood at Ksh.74.9 billion, in comparison to Ksh.76.4 billion reported in the year ended 2019. Net advances decreased by 5 percent from Ksh.46.7 billion in 2019 to Ksh.44.2 billion in December 2020. The decline in loans was attributed to the negative effects of the COVID-19 pandemic which affected the MFB’s customers and their businesses due to the containment measures to control the spread of the pandemic. As highlighted in Table 4, lending remained the single largest activity undertaken by microfinance banks, as the net loan portfolio accounted for 59 percent of the microfinance bank’s total assets.

C E N T R A L B A N K O F K E N Y ABANK SUPERVISION ANNUAL REPORT 2020
8
STRUCTURE OF THE BANKING SECTORSTRUCTURE OF THE BANKING SECTOR
Customer deposits increased by 12.5 percent from Ksh.43.9 billion in 2019 to Ksh. 49.4 billion in 2020. The growth in deposits was due to deposit mobilization through agency banking and mobile phone platforms, as well as Muungano MFB which was licenced in November 2019 but begun its full operations in 2020. Customer deposits and borrowings were the main sources of funding, accounting for 66 percent and 15 percent of the microfinance banks’ total funding sources.
Table 4: Microfinance Banks Balance Sheet Analysis (Ksh.M)ASSETS 2019 % of Total 2020 % of Total
Cash Balance (Local and Foreign notes and coins 3,494 4.6 1,280 1.7
Deposit balances at banks and financial institutions 9,587 12.5 10,935 14.6
Government securities 3,484 4.6 4,309 5.8
Net Advances 46,652 61.1 44,179 59.0
Accounts Receivables 1,601 2.1 1,797 2.4
Net Fixed Assets 6,589 8.6 9,622 12.8
Other Assets 4,946 6.5 2,757 3.7
TOTAL NET ASSETS 76,353 100.0 74,879 100.0
LIABILITIES & EQUITY FUNDSDeposits 43,941 57.5 49,356 66.0
Borrowings 14,934 19.6 11,340 15.1
Other Liabilities 6,301 8.3 6,070 8.1
Capital and Shareholders Funds 11,177 14.6 8,113 10.8
TOTAL LIABILITIES AND EQUITY FUNDS 76,353 100.0 74,879 100.0
Source: CBK
1.7 Microfinance Banks Market Share Analysis
The microfinance banks market share is based on a weighted composite index comprising of assets, deposits, capital, number of active deposit accounts and active loan accounts. Microfinance banks are classified into three peer groups namely large, medium and small. A microfinance bank is classified as large if it has a market share of 5 percent and above; medium if it has a market share of between 1 percent and 5 percent and small if its market share is less than 1 percent.
As at December 31, 2020, there were three (3) large microfinance banks with an aggregate market share of 81.0 percent, five (5) medium microfinance banks with a combined market share of 17.6 percent and six (6) small microfinance banks with an aggregate market share of 1.4 percent as shown in Table 5.

C E N T R A L B A N K O F K E N Y ABANK SUPERVISION ANNUAL REPORT 2020
9
STRUCTURE OF THE BANKING SECTORSTRUCTURE OF THE BANKING SECTOR
Table 5: Microfinance Banks Market Share Analysis - December 31, 2019 and December 31, 20202019 2020
Market Size Index (%)
Market Size Index (%)
Gross Assets
Total Deposits
Total Capital
Number of Active Deposit Accounts
Number of active Loan Accounts
Weighting 2019 Weighting 2020 0.33 0.33 0.33 0.005 0.005Large Large
Faulu MFB 39.2 Faulu MFB 40.2 29,279 22,931 2,907 99 35
Kenya Women MFB
36.9 Kenya Women MFB 33.5 28,038 16,335 2,361 437 144
Rafiki MFB 8.5 Rafiki MFB 7.2 6,005 3,027 619 20 8
84.6 81.0 63,322 42,293 5,887 556 187Medium MediumSMEP MFB 4.6 SMEP MFB 4.9 3,446 2,398 434 32 14
Maisha MFB 3.4 Maisha MFB 4.8 1,665 781 864 29 11
Caritas MFB 2.5 Caritas MFB 3.4 2,284 1,943 256 27 3
Sumac MFB 2.3 Sumac MFB 3.1 2,310 978 351 11 3
U & I MFB 1.1 U & I MFB 1.4 805 368 197 5 0.5
13.9 17.6 10,510 6,468 2,102 104 31.5
Small SmallKey MFB 0.7 Key MFB 0.6 307 74 108 5 0.4
Uwezo MFB 0.4 Uwezo MFB 0.5 134 10 100 0.4 0.04
Century MFB 0.4 Muungano
MFB 0.4 131 47 69 1 0.2
Daraja MFB 0.1 Century MFB 0.2 296 270 (37) 2 0.1
Choice MFB 0.0 Daraja MFB (0.1) 124 96 (48) 0.6 0.1
1.6 Choice MFB (0.2) 54 98 (65) 5 0.03
1.4 1,046 595 127 14 0.9
Grand Total 100.0 100.0 74,878 49,356 8,116 674 219.4
Source: CBK
The large and small peer groups registered a decline of 3.7 percent and 0.2 percent respectively from the 2019 market share, whereas the medium peer group experienced a growth of 3.7 percent. The rankings in the large and medium peer categories remained unchanged from those in 2019. In the small peer category, Muungano MFB which was licensed in 2019 and commenced operations in 2020 had a market share of 0.4
percent. There were 14 institutions in the 2020 market share analysis compared to 13 institutions in 2019. The movement of the individual institution’s market share is as follows:
• In the large peer category, Faulu MFB’s market share grew by 1 percent while Kenya Women MFB’s and Rafiki MFB’s market share declined by 3.4 percent and 1.3 percent respectively.

C E N T R A L B A N K O F K E N Y ABANK SUPERVISION ANNUAL REPORT 2020
10
STRUCTURE OF THE BANKING SECTOR
• In the medium peer group, all the institutions registered a growth of market share of less than 1 percent each, except Maisha MFB whose market share grew by 1.4 percent.
• In the small peer category, only Muungano MFB and Uwezo MFB had marginal growths of 0.4 percent and 0.1 percent respectively whereas the market share of all other institutions declined marginally. Daraja MFB and Choice MFB had negative market share of 0.1 percent and 0.2 percent respectively as a result of having negative total shareholders’ funds.
1.8 Distribution of Foreign Exchange Bureaus
As of December 31, 2020, the number of licensed forex bureaus were sixty-six (66), having declined from sixty-nine (69) in December 2019. The decline is attributed to the closure of two (3) forex bureaus during the year mainly due to operational challenges attributed to the adverse impact of the COVID-19 pandemic.
The forex bureaus operated a total of 106 outlets countrywide as of December 31, 2020 with most of the outlets located in Nairobi as shown in Table 6:
Table 6: Distribution of Forex Bureau OutletsCity/Town No. of Outlets % of TotalNairobi 88 83
Mombasa 10 9
Kisumu 2 2
Eldoret 1 1
Nakuru 1 1
Garissa 1 1
Busia 1 1
Namanga 1 1
Watamu 1 1
Total 106 100Source: CBK
One outlet in Mombasa was closed in 2020 thus the decline from 107 outlets in 2019 to 106 outlets in 2020.

C E N T R A L B A N K O F K E N Y ABANK SUPERVISION ANNUAL REPORT 2020
11
DEVELOPMENTS IN THE BANKING SECTORSTRUCTURE OF THE BANKING SECTOR
DEVELOPMENTS IN THE BANKING SECTOR
C E N T R A L B A N K O F K E N Y ABANK SUPERVISION ANNUAL 2020
11
CHAPTER 2

C E N T R A L B A N K O F K E N Y ABANK SUPERVISION ANNUAL REPORT 2020
12
DEVELOPMENTS IN THE BANKING SECTOR
2.1 Introduction 2020 commenced on a positive note with the banking industry primed to focus on longer-term issues such as climate-change, environmental sustainability, diversity, and integrating them in business decisions. At that point, the COVID-19 pandemic was not in the sector’s radar.
The COVID-19 pandemic took a toll on economies including banking systems across the world. In the Kenyan banking sector, the most impact was on the banks’ loan portfolios where many borrowers, across different sectors, faced challenges in repaying their obligations due to reduced income and business turnover. Similarly, the strategic and operating environments of banks were affected necessitating proactive guidelines and measures from CBK. To this end, CBK and the banks swiftly focused on the banking sector’s critical needs which included ensuring business continuity, supporting health and safety and implementing measures to uphold financial stability.
Other significant developments that took place during the year included increased mergers and acquisitions and leveraging on technology which is of strategic significance for the sector.
2.2 Banking Sector Charter
It has been two years since the Kenya Banking Sector Charter (KBSC) was rolled out, to set a vision of a banking sector that works for and with Kenyans. The KBSC has continued to shape the recent banking sector reforms following the repeal of the interest rate law in November 2019, which had capped lending rates at four percentage points above the prevailing Central Bank Rate.
In 2019, all institutions submitted their plans as required and also engaged closely with CBK on their implementation of the Charter. Based on the engagements between CBK and financial institutions, it was evident that three out of the four pillars anchored in the Charter, namely; customer centricity, transparency and ethical banking, have been to a large extent integrated in the institutions’ strategy and operations.
During the year, Central Bank engaged all the financial institutions to establish the status of the implementation of the fourth pillar on Credit Risk-Based Pricing Model. From these engagements, banks embarked on developing and sharpening their credit risk-based pricing models. Going forward, banks should continue refining their credit risk-based pricing models. Robust credit-risk pricing models will deliver on the overall objective of implementing differential credit pricing, based on a customer's credit rating.
2.3 Legal and Regulatory Framework
The Banking (Credit Reference Bureau) Regulations, 2020 became effective on April 8, 2020 and replaced the framework that had been in place since 2013. The revised CRB Regulations supported the risk-based pricing pillar of the banking sector charter issued in February 2015 and provided for temporary suspension of listing negative credit information in exceptional circumstances. Accordingly, and in light of the adverse impact of COVID-19 on April 14, CBK communicated the suspension of sharing of negative credit information on credit facilities that became non-performing from April 1, 2020 for six months to September 30, 2020.
2.4 Consolidations, Mergers and Acquisitions, and New Entrants
The following institutional changes in the banking industry took place during the year:
• Access Bank Plc (of Nigeria) completed its acquisition of Transnational Bank Plc effective February 1, 2020 per Section 9 and 13(4) of the Banking Act.
• Commercial International Bank (Egypt) S.A.E (CIB) acquired 51 percent shareholding of Mayfair Bank Ltd effective May 1, 2020. Following the acquisition, Mayfair Bank Ltd was renamed Mayfair CIB Bank Limited.
• KCB Bank Kenya Limited (KCB Bank) acquired certain assets of Imperial Bank (Kenya) Limited (In Receivership) (IBLIR) valued at Ksh.3.2 billion and assumed liabilities of the same value with effect from June 2, 2020. The acquisition followed

C E N T R A L B A N K O F K E N Y ABANK SUPERVISION ANNUAL REPORT 2020
13
DEVELOPMENTS IN THE BANKING SECTOR
approval by CBK and the Cabinet Secretary for the National Treasury and Planning.
• The Co-operative Bank of Kenya Ltd acquired 90 percent of the issued share capital of Jamii Bora Bank Ltd effective August 21, 2020 per Section 9 and 13(4) of the Banking Act. Subsequently Jamii Bora Bank Ltd was renamed Kingdom Bank Ltd in August 2020.
2.5 Medium, Small and Micro-Enterprises (MSME) Support
MSMEs have been recognized across the world as key enablers to economic growth and development. In Kenya, MSMEs form a fundamental segment of the economy and provide employment to millions of people. The resilience of these businesses was put to test by the COVID-19 pandemic in 2020.
MSMEs were among the most affected businesses with the youth, women and vulnerable people bearing the greatest burden owing to reduced employment opportunities, loss of jobs and even closure of these businesses. Such an unprecedented crisis called for extraordinary support from the Government and financial institutions. The Kenyan Government and the financial sector, led by CBK, provided support in the following ways;
Support by Government of Kenya;
• Reduction of the MSME turnover tax from 3 percent to 1 percent, as well as an increase in the cap for those liable to pay the turnover tax from Ksh.5 million to Ksh.50 million per year.
• Reduction of Resident Corporate tax to 25 percent from 30 percent.
• Reduction of Value Added Tax (VAT) from 16 percent to 14 percent.
Support by the Central Bank of Kenya and the financial sector;
• CBK provided guidance on restructuring of loans (personal/business/MSMEs) which were
performing by March 2, 2020, with the commercial banks bearing the cost of restructuring. This relief was to be granted on a case to case basis depending on an assessment of the circumstances facing the borrowers.
• Six months suspension of listing of negative credit information for customers whose loans were previously performing and had become non-performing after April 1, 2020.
• Elimination of charges for transfers between the bank accounts and mobile wallets.
Support through the Credit Guarantee Scheme;
The Government of Kenya, through the Public Finance Management Regulations (2020), set up a Ksh.3 billion Credit Guarantee Scheme (CGS). The objective of the CGS is to cushion participating commercial banks, providing them with confidence to extend loans to high-risk borrowers more efficiently and at flexible terms. The CGS is expected to support MSMEs’ working capital, acquisition of assets and recovery from the COVID-19 pandemic impacts. The participating commercial banks are tasked with ensuring that the MSMEs meet certain requirements to access the CGS including being compliant with tax obligations, business permits and good credit scoring. These measures are key in measuring the risk of the participating MSMEs. The CGS was operationalized on October 13, 2020 and the following activities kicked off;
• Establishment of the Secretariat which will be ran by interim staff from the National Treasury.
• Finalisation of budgets and work plans.• CBK tasked with coming up with the reporting
template.
So far, seven commercial banks have signed agreements with the National Treasury to participate in the scheme, with more expected to join in due course.
2.6 Coronavirus (COVID-19) pandemicThe COVID-19 virus was declared a global pandemic in March 2020 by the World Health Organization. The pandemic precipitated an unprecedented global health

C E N T R A L B A N K O F K E N Y ABANK SUPERVISION ANNUAL REPORT 2020
14
DEVELOPMENTS IN THE BANKING SECTOR
and economic crisis. In Kenya, the first COVID-19 case was announced on March 13, 2020 and CBK immediately took a frontline position in ensuring that the Kenyan financial sector remained resilient despite the threats posed by the pandemic. CBK immediately instituted a series of emergency measures to mitigate the health and economic effects of the pandemic.
• Measures to Mitigate the Impact of COVID-19 Pandemic
The measures were informed by:
• The need to reduce cash transactions and facilitate digital transactions, primarily to abate the risk of COVID-19 contact transmission.
• The need to cushion borrowers from the likely adverse economic effects arising from the COVID-19 pandemic while safeguarding banking system soundness.
• Supporting operations of the financial institutions by ensuring there was adequate liquidity to support both banks and borrowers as a result of the pandemic.
• Ensuring business continuity for both the financial institutions as well as for CBK to ensure that institutions have resilient frameworks to effectively address emerging pandemic risks in the banking sector.
• Ensuring health and safety of bank customers and staff.
i. Digital platforms. This was the first set of emergency measures announced on March 16, 2020 by CBK in conjunction with commercial banks and Payment Services Providers (PSPs). The immediate objective was to reduce the risk of transmission of COVID-19 by handling banknotes and coins. The measures included;
• Removal of charges for low value mobile money transactions for up to Ksh.1,000.
• The transaction limit for mobile money was increased to Ksh.150,000 from Ksh.70,000.
• The daily limit of transactions for mobile
money was increased to Ksh.300,000 from Ksh.140,000.
• The mobile money wallet limit was increased to Ksh.300,000 from Ksh.140,000.
• The monthly total limit for mobile money transactions was eliminated.
• The tariff for mobile money transactions for Ksh.70,000 was applied for transactions up to Ksh.150,000.
• PSPs and commercial banks were to eliminate charges for transfers between mobile money wallets and bank accounts.
The emergency measures applied from March 16, 2020 to June 30, 2020, and were extended to December 31, 2020. Thereafter, the measures were allowed to expire by end of December 2020.
ii. Affordable credit. On March 23 and April 29, the Monetary Policy Committee lowered the Central Bank Rate to 7.25 percent from 8.25 percent and to 7.00 percent from 7.25 respectively to signal the banking sector to lower lending and deposit rates to support the provision of affordable credit to Kenyans. Similarly, on March 23, the Monetary Policy Committee reduced the Cash Reserve Ratio (CRR) to 4.25 percent from 5.25 percent, releasing Ksh.35.2 billion as additional liquidity availed to banks to directly support borrowers that are distressed as a result of COVID-19.
iii. Restructuring personal/household and other loans by banks. On March 18, 2020, CBK announced the measure to cushion borrowers on the adverse effects of the pandemic as follows.
• Banks to provide relief to personal and household borrowers on their loans based on their circumstances arising from the pandemic.
• Micro, Small and Medium-sized Enterprises (MSMEs) and corporate borrowers to contact their banks for assessment and restructuring of their loans based on their respective circumstances arising from the pandemic.

C E N T R A L B A N K O F K E N Y ABANK SUPERVISION ANNUAL REPORT 2020
15
DEVELOPMENTS IN THE BANKING SECTOR
The relief granted under the emergency measures would only apply to borrowers whose loan repayments were up to date as at March 2, 2020 and classified under the normal category per the CBK Prudential Guideline on Risk Classification of Assets, Provisioning and Limitation of Interest on Non-Performing Loans (CBK/PG/04).
iv. Business Continuity. On March 25, 2020, CBK instructed banks to activate their precautionary measures to ensure continuity of operations.
v. Guidance note on Pandemic Planning for the banking sector. On March 27, 2020, CBK issued a Guidance Note on Pandemic Planning for the banking sector. The Note set out the minimum standards that institutions should develop to establish sound and effective business continuity management practices to address pandemics. The key requirement was for banks to report pandemic incidences to CBK within 24 hours.
• Impact and Outcomes of COVID-19 Mitigation Measures
i. Digital Platforms - The measures to incentivize mobile money facilitated low value mobile money transactions and expanded usage of mobile money with higher limits.
• The monthly volume of person-to-person transactions increased by 87 percent between February and December 2020.
• Over the same period, the volume of transactions below Ksh.1,000 increased by 114 percent, while 2.8 million additional customers are using mobile money.
• Business-related transactions also recorded significant growth over the same period.
• The measures lapsed on December 31, 2020.
ii. Reduction of Cash Reserve Ratio (CRR)
• Ksh.32.62 billion (92.7 percent) of the Ksh.35.2 billion freed from the reduction in CRR had been disbursed by CBK to the banks as at December 31, 2020.
• Disbursements to banks were approved based on justification for lending to deserving borrowers affected by the COVID-19 pandemic.
iii. Restructuring of loans
• A total of 401,498 loan accounts valued at Ksh.1.63 trillion were restructured in all economic sectors between March and December 2020. This accounted for 54.2 percent of banking sector gross loans of Ksh.3.0 trillion as at December 2020.
• The tenor of 202,373 Personal/Household loans valued at Ksh.333.0 billion had been extended between March and December 2020.This accounted for 39.6 percent of the total Personal/Household loans as at December 2020 (Ksh.841.86 billion). Cumulatively, 199,125 loans valued at Ksh.1.29 trillion in the other ten sectors had been restructured between March and December 2020.
iv. Pandemic planning – Banks continued offering services across the country in branches and through digital channels during the pandemic. Over 90 percent of bank branches remained open.
2.7 Developments in Information and Communication Technology
2.7.1 SummaryThe proliferation of technology products and the ubiquitous reliance on technology in supporting businesses was a key phenomenon in 2020, driven by COVID-19 pandemic across the world. The banking sector was not left behind when it came to the adoption of technology innovations and solutions to bolster the sector and its services to customers. The ICT Developments section seeks to contextualise the impact of technology across the following areas:

C E N T R A L B A N K O F K E N Y ABANK SUPERVISION ANNUAL REPORT 2020
16
DEVELOPMENTS IN THE BANKING SECTOR
• Digitization of businesses; • Cloud security; • Data Governance; • Banking and fintech; • Highlights of the National Payments Strategy; and • Future developments in the ICT Sector.
2.7.2 Digitization of business processes and products.
The lives and livelihoods of citizens continue to be adversely affected by the ongoing COVID-19 pandemic. However, digitization has proven itself vividly as a silver lining in facilitating businesses to counter the effects of the pandemic on their activities. It is in this attempt to salvage businesses and to ensure business sustenance, that digitization has been harnessed with ripple effects not only affecting banking, financial services, and regulatory policy, but also the direction of the economy and its capacity for continued growth amid the pandemic. Among the key financial sector areas that this has been most evident are:
2.7.2.1 Remote Working/LearningOne of the ground-breaking responses to COVID-19 was the transition to the Work-From-Home (WFH) approach by many progressive employers and other applicable forms of alternative work arrangements. Many people are thus spending more time than ever inside their homes as teleworking, distance learning and social distancing shape the workweeks of many families. Given the new normal, the banking sector has sought digital methods of services offering to their customers - Cloud Computing, Mobile and Internet Banking, and Digital Customer Relationship Management Tools such as chatbots.
Whilst there are key concerns on efficiency and productivity that employers are grappling with regarding teleworking, it is evident that with proper structures, work can be productive away from the office with a degree of flexibility. From a technological perspective, teleworking has raised security concerns over information confidentiality and the heightened risk
of security breaches, due to inadequate security controls around access to corporate networks from home.2.7.3 Cloud SecurityIncreased digitalization has led to a rise in the uptake of cloud services by most banks. This has led to banks having robust disaster recovery plans, saving cost on storage as well as increased collaboration where team members can view and share information easily and securely across a cloud-based platform. However, use of cloud services has led to cyber-privacy issues such as data infiltration which has affected data integrity, confidentiality and availability.
The National Institute of Standards and Technology (NIST) defines cloud security as a model for enabling ubiquitous, convenient, on-demand network access to a shared pool of configurable computing resources (e.g., networks, servers, storage, applications, and services) that can be rapidly provisioned and released with minimal management effort or service provider interaction.
For proper context, it is imperative to factor in cloud security as:
• “Security of the Cloud”: Security of cloud infrastructure i.e. the hardware, software, networking, and facilities that run all cloud services.
• “Security in the Cloud”: Security of applications and data deployed by financial institutions in the cloud.4
Banks need to assess cloud usage related risks and ensure that appropriate mitigation measures are put in place to avoid or minimise the risk. They need to invest more in security preparedness to enhance their cyber resilience programs in order to mitigate cloud-based cyber-attacks.
4https://aws.amazon.com/compliance/shared-responsibili-
ty-model/.

C E N T R A L B A N K O F K E N Y ABANK SUPERVISION ANNUAL REPORT 2020
17
DEVELOPMENTS IN THE BANKING SECTOR
2.7.4 Banking and Fintech
Globally, there has been a heightened need for collaboration between financial institutions and Fintechs granted that the two entities are no longer mutually exclusive. These collaborations are essential for the future of the financial services industry and the technology sector as well. Aside from allowing banks to run complex operations virtually, Fintech innovations offer more features and functions, reduced cost and the ability for banks to scale up quickly. Fintech has largely been customer-centric, aimed at increasing the ease of use for customers by ensuring improvement of front-end interfaces through better customer care and pricing.
The COVID-19 pandemic in 2020 resulted in developments within the Fintech industry that were aimed at ensuring economic sustenance during the pandemic and economic growth afterwards. There was a notably high adoption of digital financial services by consumers to provide a channel for financial transactions with minimal physical contact, which was necessary to mitigate the spread of the virus. This was evidenced by an increase in the number of transactions performed over digital platforms across multiple financial institutions.
2.7.4.1 Virtual Africa Hackathon and Afro-Asia FinTech Festival Nairobi Online City
In August 2020, CBK held the Virtual Africa Hackathon (VAH). The hackathon, whose theme was ‘Harnessing Fintech in addressing COVID-19 effects on healthcare, digital payments and economic recovery’, had 15 finalists from 7 African countries. These finalists were shortlisted from 74 submissions from 14 countries in Africa, Europe and the Middle East and presented innovative solutions aimed at addressing the theme of the hackathon. 8 of the Fintechs that participated in this event were later featured in the Afro-Asia FinTech Festival (AAFF) Nairobi Online City, where they were granted an opportunity to pitch their solutions to potential investors and partners, thus gaining much-needed exposure.
VAH was followed by AAFF Nairobi Online City, which was hosted in December 2020 by CBK in collaboration with the Monetary Authority of Singapore (MAS), and in partnership with Huawei, Safaricom, KCB Bank
and Standard Chartered Bank Kenya. The event was attended by more than 1,000 registered participants and the sessions uploaded on YouTube and Twitter have received over 2,900 and 1,700 views. Further, the AAFF sessions showcased a total of 54 speakers from 15 countries with diverse expertise. The event was held as part of the global Singapore Fintech Festival and was organised to boost collaboration between financial institutions and FinTech. The theme of the event was “People and Talent: Harnessing Collaboration in Pursuit of Resilience and Growth Post COVID-19”.
Some of the key aspects addressed during the event included cashless and digital payments, next-generation digital platforms and the relationship between Fintechs and banks. It was noted that Kenya has seen a significant shift from traditional modes of payment to the use of digital payments through mobile money services, digital wallets and mobile banking apps. Cashless systems will go a long way in streamlining processes across various industries, acknowledging that the future will be a digital society. It was also pointed out that digital platforms will continue to accelerate change in existing business models due to their capability of providing more diversified services.
AAFF discussions revolved around collaboration across various economic sectors, emphasising on SMEs, to foster economic recovery. There is a need to accelerate digital ecosystems that will enable SMEs to reconnect with their customers and markets and gain access to the much-needed finance to recover. To ensure inclusion, it is imperative to provide access to affordable broadband, which is the foundation of civilization, and digital finance. Transition into cashless operations by SMEs has the potential to increase access to cashflow lending and advances from financial institutions as opposed to the more rigid conventional microcredit financing.
One of the key thematic areas of the festival was “Fintech People and Ecosystem”. The discussions around this theme focused on bouncing back from the COVID-19 pandemic, given its adverse effects that have hindered efforts geared towards prosperity. There is a need for governments, regulators and other authorities to provide sandbox-like environments and innovation houses to cater for research and innovation of solutions

C E N T R A L B A N K O F K E N Y ABANK SUPERVISION ANNUAL REPORT 2020
18
DEVELOPMENTS IN THE BANKING SECTORDEVELOPMENTS IN THE BANKING SECTOR
to present and unforeseen challenges. Authorities also need to be aware of trends within the sector such as the increased reliance of banks on artificial intelligence to make decisions on access to credit, particularly for SMEs.
Deliberations within this area also highlighted the need for government policies to encourage public-private partnerships and collaborations to foster cooperation in technology, especially in capacity building and endeavours towards sustainable development goals. There is a need for capacity building to ensure that the common citizen understands the benefits and negative impact of technology to understand how it operates. Governments and regulators also need to keep in view effective digital governance frameworks as they build their digital ecosystems.
Even with the positive effects of Fintech, experienced and foreseen, digitisation and reliance on technology have resulted in a rise in cyber risk. Steps have been taken to ensure secure development of Fintech solutions provided as well as proper integration into financial institutions, but there has been an increase in cyber-attacks relying on weaknesses in the human element within the digital space. Financial institutions were advised to adopt measures such as enhanced cybersecurity awareness through employee training programs, improved risk management and updated business continuity and incident response plans. Fintech companies need to understand proper data handling, protection and privacy. The Zero-trust approach, a security model that ensures only authenticated and authorised users and devices are granted access to application and data, may also be considered.
AAFF provided an opportunity for thought leadership on sustainability through the Sustainable Finance Summit on December 9, 2020. There was a call for action for financial institutions and all stakeholders to work together for sustainable finance. This includes efforts towards the adoption of Sustainable Development Goals (SDGs) into their strategies. It was noted that data is a game-changer in sustainable finance, therefore institutions should also accurately capture sustainability-related data. This data may be harnessed for predictability on the performance of sustainability bonds while providing transparency and accountability.
2.7.5 Data Governance
The financial sector continues to undergo significant transformation in its delivery of financial services and products, largely driven by the adoption of financial technologies and changing consumer behaviour. The adoption of fintech has drove financial innovation within the financial sector. As aforementioned, this influx in innovation has been accelerated by the on-set of the COVID-19 Pandemic in 2020. At the heart of this digitization and facilitating financial innovation and emergence of customer-centric products is data. How the thousands of quintillion bytes of data being collected, transmitted, processed, shared, stored and archived is managed continues to raise debates around the world on data privacy laws and policies.
It is on the backdrop of these data management concerns that the National Assembly enacted the Data Protection Act of 20195 which was assented to law by the President of the Republic of Kenya on November 8, 2019 and came into force on November 25, 2019. The Act is aimed at regulating the processing of personal data and protecting the privacy of individuals. Subsequently, Kenya’s first-ever Data Protection Commissioner was sworn-in on November 16, 2020, to actualize the Data Protection Act. The appointment affirmed Kenya’s commitment to ensuring that the collection, processing and use of personal data are properly regulated. The Data Protection Commissioner shall serve for a single term of six years. Some of the notable functions of this office are to:
• Oversee the implementation of and be responsible for the enforcement of the Act.
• Establish and maintain a register of data controllers and data processors.
• Exercise oversight on data processing operations per the Act.
• Conduct an assessment on a public or private body to ascertain whether the information is processed according to the provisions of this Act or any other relevant law.
5http://kenyalaw.org/kl/fileadmin/pdfdownloads/Acts/2019/TheDataProtectionAct__No24of2019.pdf

C E N T R A L B A N K O F K E N Y ABANK SUPERVISION ANNUAL REPORT 2020
19
DEVELOPMENTS IN THE BANKING SECTOR
• Promote international cooperation in matters relating to data protection and ensure the country’s compliance with data protection obligations under international conventions and agreements.
CBK is liaising with the Ministry of ICT to ensure coordinated implementation of the Data Protection Act within the financial sector. Given that Kenya’s Data Protection Act, 2019 finds its genesis and borrows heavily from the principles contained in the European Union’s General Data Protection Regulation (GDPR)6, its adoption by our institutions provides consumers with international levels of data protection standards.
2.7.6 Highlights of the Kenya National Payments System Vision and Strategy
Kenya’s National Payments System (NPS) has undergone rapid change over the last fifteen years. Starting with the modernisation programme that led to the establishment of the Kenya Electronic Payment and Settlement System (KEPSS) in 2005, and the enactment of the NPS Act, 2011 and the NPS Regulations in 2014, CBK has facilitated major improvements in payment services over the years. In 2007, through CBK’s facilitation, mobile money was introduced, heralding a new chapter of payments services in Kenya and beyond. Today, CBK regulated “payment rails” are used to launch innovations in sectors such as education, health and agriculture.
The use of mobile money systems to enable contact-free payments during the COVID-19 pandemic is testimony to Kenya’s strong payment system foundation. The payments ecosystem continues to evolve through nascent technologies that work in tandem with existing payment systems. CBK champions the transformation of Kenya’s NPS as the payments ecosystem evolves. Against this backdrop, CBK, in consultation with stakeholders, developed the draft Kenya NPS Vision and Strategy, 2021-2025. The vision is based on CBK’s priority to ensure people are at the centre of Kenya’s NPS. In this regard, the proposed Kenya NPS Vision is “To enhance Kenya’s global leadership in digital payments by building
6 GDPR is a regulation that requires businesses to protect the personal data and privacy of European Union (EU) citizens for transactions that occur within EU member states.
a world-class, secure, resilient and collaborative payments system that powers Kenya’s economy and its journey towards cash-lite.”
The Kenya NPS Vision and Strategy, 2021-2025 will focus on increasing customer-centricity, digitization and inclusiveness through prioritising policy and regulation, payments infrastructure and security. The key strategic objectives to be achieved through the Kenya NPS Strategy, 2021-2025 are:
• To facilitate payments systems that meet the diverse needs of users and support the country’s development agenda.
• To ensure payments systems are secure through influencing industry and global standards and adopting safe technologies.
• To power an ecosystem based on collaboration leading to the launch of premier and globally competitive innovations.
• To implement a supportive policy and regulatory framework that is firmly enforced across all existing and emerging players.
To implement the Kenya NPS Strategy while addressing risks in the payment ecosystem such as cyber security and AML/CFT risks, the Kenya NPS Vision and Strategy will be supported by 5 principles:
• Trust: a system which guarantees that payments will be made and received in a timely and reliable manner.
• Security: a resilient system that safeguards all payments and channels in an increasingly digital world.
• Usefulness: a system that meets the payment needs of individuals, businesses and government in a cost-effective manner.
• Choice: availability of feasible options resulting from collaboration among different service providers.
• Innovation: an ecosystem that produces value-adding solutions which also compete at the global stage.

C E N T R A L B A N K O F K E N Y ABANK SUPERVISION ANNUAL REPORT 2020
20
DEVELOPMENTS IN THE BANKING SECTOR
The draft Kenya NPS Vision and Strategy, 2021-2025 was published in December 2020 for public consultation. CBK is in the process of addressing feedback from the public and updating the draft Vision and Strategy to pave way for its finalisation.
2.7.7 Future developments
Innovation in the financial sector will continue to morph and scale driven by the technological advancements, changing customer preferences and contribution from investment in Research and Development (R&D). The section below highlights the progress of key areas in technology and their potential impact on banking..2.7.7.1 Quantum Computing The increased reliance and use of information systems to support business processes have resulted in increased data around the world. As this data grows in size and complexity, there is a need for more processing power than can be handled by today’s computers. Consequently, the introduction of quantum computers provides a significant possibility to analyse data and spot patterns much more quickly and robustly than what is possible today. To utilise the power of quantum computing, banks can leverage algorithms and models that calculate statistical probabilities7. This approach is fairly effective but not infallible, as was witnessed during the financial crisis a decade ago when low-probability events occurred more frequently than expected.
Further, despite the positive potential of quantum computing, with enough qubits8, quantum computers will have enough power to overcome many of the most powerfully encrypted banking security systems around. As observed by the World Economic Forum, “Without quantum-safe cryptography and security, all information that is transmitted on public channels now—or in the future—is vulnerable to eavesdropping. Even encrypted data that is safe today can be stored for later decryption once a working quantum computer of sufficient capacity becomes available.”
7https://www.mckinsey.com/industries/financial-services/our-insights/how-quantum-computing-could-change-financial-services#
8 A qubit or quantum bit is the basic unit of quantum information – the quantum version of the classic binary bit.
2.7.7.2 Cryptocurrency and Blockchain (Digital Ledger Technologies)
The budding interest in cryptocurrencies has been driven by the potential use of cryptocurrencies as a medium of exchange. Cryptocurrencies, also known as virtual currencies, have garnered significant attention over the last seven to nine years9 resulting in growing debates and concerns over the efficacy and economic use of cryptocurrencies. Research to demystify cryptocurrencies has been conducted by organisations such as the Financial Stability Board (FSB)10, Bank for International Settlements (BIS) – Committee on Payments and Market Infrastructures (CPMI) and the Basel Committee on Bank Supervision (BCBS), the European Union and the G-20.
Based on the aforementioned research, there is no clear evidence that cryptocurrencies present material risks to financial stability and monetary policy at this stage. However, continuous monitoring of the size and growth of cryptocurrencies is prudent to ensure that their material risks are identified as well as their transmission channels to financial stability risk. The CBK, in tandem with other financial sector regulators, will continue to sensitize the public on the potential risks posed by cryptocurrencies.
9 It is common misperception that all digital tokens/assets that are created, managed or operated on a blockchain are cryptocurrencies. This is erroneous. Digital tokens are largely divided into three main categories: • Currency/payment tokens – these tokens are intended to be
used, now or in the future, as a means of payment for acquiring goods or services or as a means of money or value transfer. For example, Bitcoin, Bitcoin Cash, Monero, Litecoin and ZCash. Such tokens are the subject of this brief and are synonymously referred to as cryptocurrencies due to their use of cryptographic techniques.
• Utility tokens – these tokens confer digital access rights to an application or service by means of a blockchain-based infrastruc-ture. For example, Ether, Storjcoin and Golem coin.
• Asset tokens – these provide digital representation of re-al-world assets such as a real estate, debt and equity. The tokens represent a claim on the issuer. A good example of asset tokens is initial coin offerings (ICOs) which confer a claim to acquire an entity’s token in the future. (Source: https://www.finma.ch/en/news/2018/02/20180216-mm-ico-wegleitung/ ).
10 Financial Stability Board (July 2018) – Crypto-assets: Report to the G-20 on work by the Financial Stability Board and Standard-Setting Bodies.

C E N T R A L B A N K O F K E N Y ABANK SUPERVISION ANNUAL REPORT 2020
21
DEVELOPMENTS IN THE BANKING SECTOR
2.7.8 ICT/Fintech/Internet Enabled Products Launched by Supervised Financial Institutions (SFIs) during the year 2020
The financial sector witnessed a proliferation of Fintech solutions to ensure customer convenience and business continuity while seeking to comply with the COVID-19 safety protocols. Below are the technologies behind the products and solutions that Kenyan banks engaged CBK on for approval.
a. Mobile and Internet Banking Platforms
The digital banking space has grown at an accelerating pace in recent years. Since the launch of the M-Shwari platform in 2012, a vast number of platforms offering similar services have emerged. With the pervasive nature of the Internet and the ready availability of smartphone devices to customers, banks have rolled out digital banking platforms that would limit visits to branches to access various services. Service offerings such as account opening, balance enquiry, cross-platform transactions and the payment of bills, are provided to customers through the web and mobile application platforms. This has drastically reduced the need for customers to visit their respective branches to initiate such processes.
b. Contactless Card Payments
Contactless card payment systems are credit cards and debit cards that use radio-frequency identification (RFID) or other short-range wireless technology whereby a tiny antenna is embedded into the card, which securely transmits payment information to and from the contactless card to a point-of-sale terminal. The embedded integrated circuit chip and antenna enable consumers to wave their card over a reader at the point-of-sale terminal. Contactless cards have become widely adopted within the payment arena, the success of which is associated with several benefits:
• Speed: Contactless card payments work twice as fast as normal cards. With less processing and handling of cash occurring, transactions are completed at a faster rate, turnover is likely to improve and queues are less likely to build up.
• Secure: A customer who loses the card can freeze the account.
• Overall Customer Experience: Faster, more secure and effortless transactions translate to an increase in throughput at the payment counters. A reduction in abandoned sales as the average transaction value (ATV) increases when a customer is not constrained by the amount of cash they are carrying and the payment process is efficient.
• Brand Positioning and Increased Revenues for Banks: By offering contactless options to their customers, banks not only promote a much-improved customer experience; they can also offer added-value services and therefore differentiate from their competitors. Contactless payments also mean more revenue for issuing banks because customers tend to carry out more low-value transactions by card than cash.
c. Cloud Computing Solutions
Cloud computing is an emerging technology that delivers computing services such as online business applications, online data storage, and webmail over the internet. Some institutions even migrate their core banking platforms to the cloud, to ensure business continuity management and optimal teleworking, supported by best practices in data redundancy. Cloud services can be deployed as:
• Public cloud: provisioned for open use by the public.
• Private cloud: cloud infrastructure provisioned for exclusive use by a single organisation.
• Hybrid cloud: cloud infrastructure that blends the above two options. The need for cybersecurity standards and best practices that address interoperability, usability, and privacy is critical.
CBK recognises that cloud services are increasingly becoming an important option for financial institutions’ technical infrastructure and budget management. It is important that financial institutions innovate responsibly and thus CBK expects that any implementation of cloud

C E N T R A L B A N K O F K E N Y ABANK SUPERVISION ANNUAL REPORT 2020
22
DEVELOPMENTS IN THE BANKING SECTOR
services is undertaken with appropriate due care and attention. Correspondingly, financial institutions need to approach cloud services with a high degree of sensitivity to ensure compliance with regulatory and data protection requirements, often across multiple jurisdictions.
2.7.9 Technology and Employees Efficiency
On average, in 2020, one employee was serving 2,211 customers whereas in 2019 an employee was serving 1,956 customers (Table 7). This shows increased efficiency in customer service as a result of banks embracing technology.
Table 7: Growth of Deposit Account Holders Compared to Number of Staff
Year No. of Deposit Account Holders
Number of Staff
Efficiency Score
2002 1,682,916 10,884 155
2006 3,329,616 15,507 215
2007 4,123,432 21,657 190
2008 6,428,509 25,491 252
2009 8,481,137 26,132 325
2010 11,881,114 28,846 412
2011 14,250,503 30,056 474
2012 15,861,417 31,636 501
2013 21,880,556 34,059 642
2014 28,438,292 36,923 770
2015 35,194,496 36,212 972
2016 41,203,518 33,695 1,222
2017 47,714,527 30,903 1,544
2018 55,279,473 31,889 1,733
2019 62,652,613 32,025 1,956
2020 69,881,847 31,605 2,211
Source: CBK
2.8 Mobile Phone Financial Services
Kenya continues to register growth in the adoption of Mobile-Phone Financial Services (MFS), which is largely propelled by the ease of access and existence of
convenient delivery channels. With the emergence and spread of the COVID-19 pandemic, the potential of MFS in supporting financial service provision came to the fore. This is attributed to the fact that MFS provides a channel for financial transactions with minimal physical contact, which was necessary to mitigate the spread of the virus. To tap into this potential, CBK came up with various measures to facilitate digital transactions during this period including eliminating charges for mobile money transactions up to Ksh.1000, increasing daily mobile money transaction limits from Ksh.70,000 to Ksh.150,000 and eliminating charges for transfers between mobile money wallets and bank accounts.
Additionally, while digital financial inclusion remains a development priority within the financial sector, MFS has become a gateway for people in urban as well as less developed areas to access services such as savings and credit, and even pay bills and carry out business activities. The development of MFS has driven the financial sector towards the inclusion of Micro, Small and Medium Enterprises (MSMEs). For businesses in this pool, MFS provides efficiency through improved transaction speeds and overall payment collection. The businesses are also able to reduce administrative costs and increase their productivity and revenue. Proper use of MFS would allow MSMEs to obtain a good credit score and consequently facilitate increased access to finance11.
Summary of MFS Transactions Data
With more people embracing technology and the use of mobile phones for day-to-day activities, and a continuously growing demand for convenient financial services, fuelled by the COVID-19 pandemic, the number of active mobile subscriptions has grown from 54.5 million in 2019 to 61.4 million in 2020. As a result, mobile penetration increased by 14 percent, from 114.8 percent to 129.1 percent. The number of active mobile money agents increased by 26 percent from 224,108 to 282,929. Consequently, this resulted in a 58 percent increase in the value of transactions from Ksh.382.9 billion in 2019 to Ksh.605.7 billion in 2020. These figures are captured in Table 8.
11https://www.gsma.com/mobilefordevelopment/programme/mobile-money/mobile-financial-services-msmes-part-1/

C E N T R A L B A N K O F K E N Y ABANK SUPERVISION ANNUAL REPORT 2020
23
DEVELOPMENTS IN THE BANKING SECTOR
Table 8: Mobile Transaction DataDigital Financial Inclusion 2007 – 2020
2007 2008 2012 2017 2018 2019 2020
Mobile Subscribers (million) 11.3 16.2 30.7 42.8 49.5 54.5 61.4
Mobile Penetration (percent) 30.5 43.6 78.0 94.3 106.2 114.8 129.1
Total Registered Mobile Money Subscriptions (million) 1.4 5.1 21.1 37.4 47.6 58.4 66.0
Number of Transactions (Million) 1.3 10.2 56.0 139.9 155.8 155.0 181.3
Value of Transactions (Ksh. Billion) 3.8 27.0 150.2 332.6 367.8 382.9 605.7
Active Mobile Money Agents 1,582 6,104 76,912 182,472 223,931 224,108 282,929
Source: CA Sector Statistics12, CBK Mobile Money Payments Statistics13
2.9 New Products
CBK continued to approve new banking products and related charges as provided for under Section 44 of the Banking Act which provides that no banking institution can increase its rate of banking or other charges except with the prior approval of the Minister. The Cabinet Secretary, the National Treasury delegated this role to the Governor of the Central Bank of Kenya via Legal Notice 34 of May 2006 on the Banking (increase of Rate of Banking and other Charges) Regulations, 2006.
While processing such applications, the Central Bank of Kenya considers:
• Whether the proposed increase conforms with the Government’s policy of establishing a market-oriented economy in Kenya.
• The average underlying inflation rate prevailing over twelve months preceding the application.
• For new charges whether the proposed charges are justifiable and are comparable to the industrial average.
12 https://ca.go.ke/consumers/industry-research-statistics/ statistics/
13https://www.centralbank.go.ke/national-payments-systems/mobile-payments/
The financial services industry is being transformed by the ever-changing consumer needs, innovative financial products, technological advancement and the use of multiple delivery channels. To remain competitive in the new landscape, banks have continued to introduce new products, expand the existing ones, and add new delivery channels. Banks strive to enhance access to customers as well as differentiating their products and services by the use of alternative delivery channels such as e-banking and m-banking.
The year 2020 presented a unique challenge due to the global outbreak of the COVID 19 pandemic. To curb the spread of the virus, people were required to reduce physical contact to the barest minimum. This meant cash transactions were discouraged leading to the need for digital and contactless products. Many banks, therefore, introduced new ICT products that enabled cashless/online transactions.
In 2020, CBK noted the introduction of 44 new products in the market and approved the related charges. Most of the applications sought to introduce and enhance digital banking services.

C E N T R A L B A N K O F K E N Y ABANK SUPERVISION ANNUAL REPORT 2020
24
DEVELOPMENTS IN THE BANKING SECTOR
2.10 Operations of Representative Offices of Foreign Financial Institutions in Kenya
Foreign banks open representative offices in Kenya for purposes of marketing their products and services in the country. Representative offices act as a liaison between their parent institutions and their clients in Kenya.
The establishment of Representative Offices in foreign jurisdictions is mainly due to the significant growth in cross-border commerce witnessed so far. Financial institutions today are skewed towards customer-centricity. That is, they strive to ensure that their banking products and services are tailored to customer needs and that they are availed wherever and whenever these are required. This is aimed at ensuring that financial institutions maintain long-standing business relationships with their customers.
CBK may under section 43 of the Banking Act (Cap 488) authorize and supervise Representative Offices
of foreign banks that wish to establish a presence in Kenya. Representative Offices are expressly prohibited to undertake primary banking business14 as defined in the Banking Act. They are permitted to undertake marketing or liaison roles on behalf of their parent and affiliated entities.
During 2020, there was no change in the number of Representative Offices operating in Kenya, which remained at 9 as at the end of 2019. These Representative Offices facilitated business worth an estimated Ksh.373.77 billion (USD3.42 billion) in 2020. The value of business activities facilitated in 2020 decreased by 21.1 percent when compared to Ksh.473.76 billion (USD4.67 billion) facilitated in 2019. The decrease is largely due to a slowdown in economic activity coupled with the effects of the COVID –19 pandemic. This is indicated in Table 9. The activities facilitated largely comprised trade finance, term loans, working capital, bilateral receivable discounting, syndicated finance and correspondent banking.
Table 9: Business activities facilitated by Representative OfficesYear 2020 2019
Ksh.Billions USD15 Billions Ksh.Billions USD BillionsCorporate finance 10.23 0.09 13.15 0.13
Syndicated Finance 49.11 0.45 86.45 0.85
Correspondent Banking 37.37 0.34 36.68 0.36
Project Financing 20.56 0.19 14.22 0.14
Specialized finance 22.95 0.21 11.89 0.12
Property Finance 10.61 0.10 13.91 0.14
Trade finance 141.12 1.29 155.65 1.54
Others (term loans, borrowing base, working capital and bilateral receivable discounting)
81.83 0.75 141.82 1.40
Total value of business facilitated 373.77 3.42 473.76 4.67Source: CBK
14Banking business means accepting from members of the public; money on deposit repayable on demand or at the expiry of a fixed period or after notice; money on current account and payment on and acceptance of cheques; and the employing of money held on deposit or on current account, or any part of the money, by lending, investment or in any other manner for the account and at
the risk of the person so employing the money.15Exchange rate: 1 USD = 109.17 Ksh

C E N T R A L B A N K O F K E N Y ABANK SUPERVISION ANNUAL REPORT 2020
25
DEVELOPMENTS IN THE BANKING SECTOR
2.11 Surveys 2020
2.11.1 Residential Mortgage Market Survey 2020
CBK conducts an annual mortgage survey to monitor developments and challenges in the mortgage market for residential housing. A detailed questionnaire was distributed to all commercial banks to collect data for the year ending 2020. The information collected comprised: -
a) Size of Mortgage Portfolio.b) Mortgage Risk Characteristics.c) Mortgage Loan Characteristics. d) Obstacles to Mortgage Market Development. e) Suggested measures to support the mortgage
market.f) Impact of COVID-19 on the demand for mortgages.g) Mortgage outlook for 2021.
Below are the highlights of the Residential Mortgage Survey as at December 31, 2020.
a) Size of Mortgage Portfolio
i) The value of mortgage loans outstanding was Ksh.232.7 billion in December 2020 as compared to Ksh.237.7 billion in December 2019 (Appendix XIII). This represents a decrease of Ksh.5.0 billion or 2.1 percent. The decrease was mainly due to repayments and decreased mortgage facilities advanced by banks due to effects of COVID-19.
ii) About 74.5 percent of lending to the mortgage market was by 6 institutions that is, one medium sized bank (11.2 percent) and five banks from the large peer group (63.3 percent) in December 2020 as compared to 76.1 percent of lending by 6 institutions in 2019, one medium sized bank (16.9 percent) and five banks from the large peer group (59.2 percent).
iii) The outstanding value of non-performing mortgage loans decreased from Ksh.31.0 billion in December 2019 to Ksh.27.8 billion in December 2020 due to repayments. The non-performing mortgage loans
to gross mortgage loans ratio was 12.0 percent in December 2020 as compared to 13.0 percent in December 2019. The ratios were below the industry gross NPLs to gross loans ratio of 12.5 percent in December 2019 and 14.5 percent in December 2020.
iv) There were 26,971 mortgage loans in the market in December 2020 down from 27,993 in December 2019. This was a decrease of 1,022 mortgages or 3.7 percent. The decrease was mainly due to repayments and fewer mortgage loans advanced due to the effects of the COVID-19 pandemic.
v) The average mortgage loan size increased from Ksh.8.5 million in 2019 to Ksh.8.6 million in 2020.This was mainly due to fewer mortgage loans advanced due to the COVID-19 Pandemic.
b) Mortgage Risk Characteristics
Institutions indicated the following as main risk factors examined more closely before a mortgage loan to a household is approved: -
• Borrower’s repayment ability.• The credit history of the borrower. • Age of the borrower. • The source and sustainability of income for loan
servicing. • Ratio of monthly loan instalment to disposable
income. • Character of the borrower.• The property must be easily disposable in the
event of default. • The collateral/security must be free from any
encumbrances. • Value of security/property.
The main risk factors examined more closely by institutions before a mortgage loan to a business is approved are: -
• The current turnovers/cash flows of the business.• Ability to pay from the available cash flows from
the business operations.

C E N T R A L B A N K O F K E N Y ABANK SUPERVISION ANNUAL REPORT 2020
26
DEVELOPMENTS IN THE BANKING SECTOR
• The future projections of the business income.• Duration which the business has been in operation. • Business organizational structure and corporate
governance. • The experience of the business proprietor in the
respective field and the competency level of the management.
• The succession plan of the business.• The property must be free from any encumbrances
and other caveats and the location must be of ease realisation in the event of loan default.
• Industry performance.
c) Mortgage Loan Characteristics
• The interest rate charged on mortgages on average was 10.9 percent and it ranged between 7.0 percent to 15.0 percent in 2020 as compared to an average of 11.3 percent with a range of 7.0 percent to 13.0 percent in 2019. The decrease in average interest rates was consistent with decrease in interest rates in the year.
• About 80.2 percent of mortgage loans were on variable interest rates in 2020 as compared to 86.3 percent in 2019. The decrease in variable rates was due to uncertainty brought about by the COVID-19 pandemic.
• Loan to value (maximum loan as a percentage of property value) was pegged below 90 percent by majority of the banks in 2020 and 2019.
• The average loan maturity was 11.0 years with minimum of 4 years and a maximum of 20 years in 2020 as compared to average loan maturity of 11.2 years with a minimum of 5 years and a maximum of 20 years in 2019. This is an indication that banks reduced the period of mortgage facilities.
d) Obstacles to Mortgage Market Development
The survey identified a number of the impediments to mortgage market development as indicated in Table 10.
Table 10: Residential Mortgages Market Survey – December 2020Mortgage Market Obstacles Frequency of responses December 2019 December 2020Impact of the COVID-19 Pandemic N/A 39
High cost of housing units 30 24
High cost of land for construction 29 24
Low level of income 21 23
Limited access to affordable long-term finance 26 23
Difficulties with property registration/titling 23 22
Stringent land laws 20 21
High incidental costs (legal fee, valuation fee, stamp duty) 25 19
Lengthy charge process timelines 19 18
Lengthy process of security realization by banks in case of default 16 17
Credit risk 9 6
Source: Commercial Banks and Mortgage Finance Companies
Based on the above ranking of mortgage market constraints, banks identified; Impact of COVID-19 Pandemic, high cost of housing units, high cost of land for construction, low level of income and limited access to affordable long-term finance, as the major impediments to the growth of their mortgage portfolios.

C E N T R A L B A N K O F K E N Y ABANK SUPERVISION ANNUAL REPORT 2020
27
DEVELOPMENTS IN THE BANKING SECTOR
e) Suggested measures to support the mortgage market
Institutions suggested a number of measures to be put in place to support the residential mortgage market in Kenya. Some of the suggested measures include: -
• Digitizing the Land Registry for efficiency.• Government incentives for low cost housing
solutions. • Operationalization of Kenya Mortgage Refinance
Company (KMRC) to avail affordable long-term funds.• Implementation of the affordable housing
program by the government.• Removal of bottle necks in relation to building
approvals. • Establishment of a one-stop-shop for all the
statutory approvals for construction project.• Provision of basic infrastructure services to
developers by national and county governments.• Sensitizing the public on mortgage financing.
• Streamlining and simplifying the legal and regulatory process governing the mortgage sector, for transparency, efficiency and certainty.
f) Impact of COVID-19 Pandemic on the demand for residential mortgage loans
Based on the responses to the Survey questionnaire, it was noted that:
• Demand for residential mortgages declined significantly due to the decline of disposable income and uncertainty brought about by the COVID-19 pandemic.
• Active/running mortgages experienced delays in repayments and there were requests for moratoriums and mortgage loan restructuring.
• Some banks shied away from issuing mortgage loans due to the uncertainty brought about by the COVID-19 Pandemic.
g) Mortgage Outlook for 2021
Mortgage uptake is expected to be subdued due to the effects of COVID-19 pandemic. The mortgage market will however be supported by the operationalization of the affordable housing program and Kenya Mortgage Refinance Company by the government.
2.11.2 Micro, Small and Medium Enterprises (MSME) Survey 2020
2.11.2.1 Background
Pursuant to its strategic objective of promoting a sound and inclusive banking sector, CBK conducts a bi-annual FinAccess Business Supply-Side Survey (FinAccess Business Survey) on the state of financing for Micro, Small and Medium Enterprises (MSMEs) in the banking industry. The objective of the survey is to identify the main barriers to MSME financing with the aim of addressing them through appropriate policy interventions.
The first survey was conducted in 2014 and assessed the position as at mid-2013, while the second, carried out in 2018, assessed the position as at December 2017. The third survey, conducted in February 2021, sought to assess the status of MSME financing in the banking sector as at December 2020.
2.11.2.2 The 2020 MSME Survey
In the wake of the COVID-19 pandemic, the 2020 MSME FinAccess Business Survey sought not only to update the data collected from the two previous rounds, but also to assess the impact of the pandemic on bank credit to MSMEs as at December 2020. The survey also sought to assess supply-side changes in MSMEs’ level of access to bank credit, how these have been impacted by the pandemic, and the outlook for MSME credit access. The findings will inform CBK’s policy responses to address the constraints facing MSMEs in accessing bank credit.
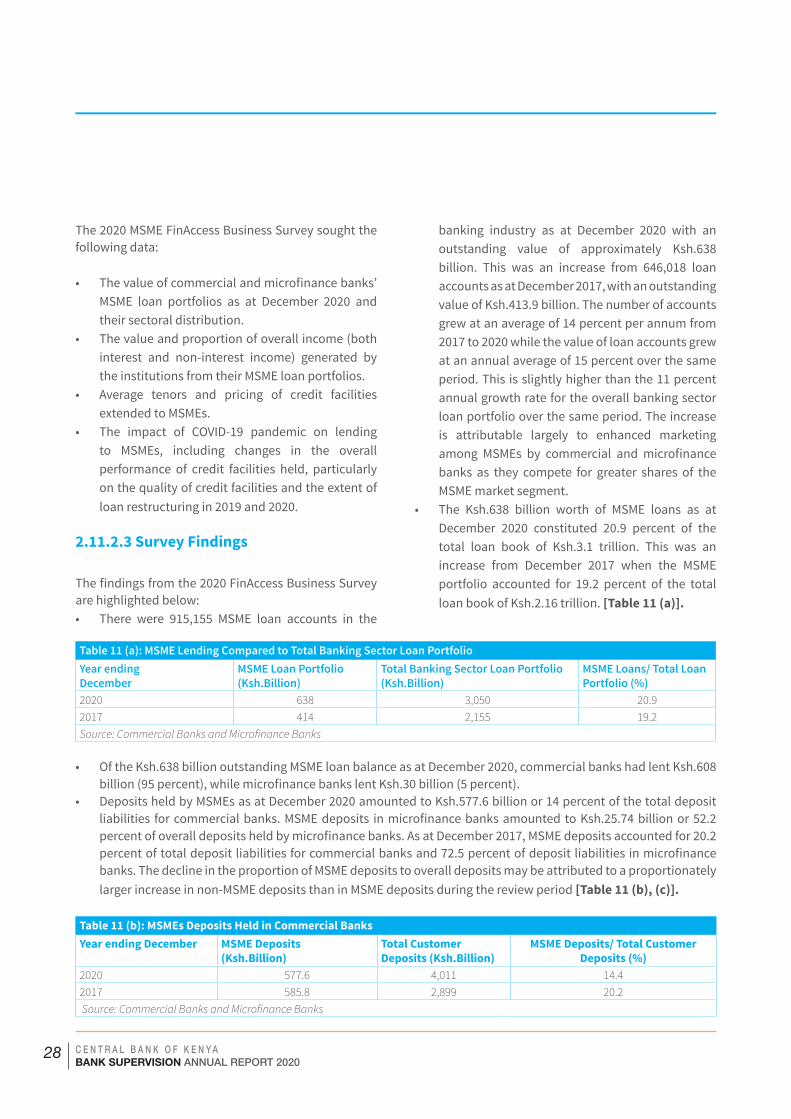
C E N T R A L B A N K O F K E N Y ABANK SUPERVISION ANNUAL REPORT 2020
28
The 2020 MSME FinAccess Business Survey sought the following data:
• The value of commercial and microfinance banks’ MSME loan portfolios as at December 2020 and their sectoral distribution.
• The value and proportion of overall income (both interest and non-interest income) generated by the institutions from their MSME loan portfolios.
• Average tenors and pricing of credit facilities extended to MSMEs.
• The impact of COVID-19 pandemic on lending to MSMEs, including changes in the overall performance of credit facilities held, particularly on the quality of credit facilities and the extent of loan restructuring in 2019 and 2020.
2.11.2.3 Survey Findings
The findings from the 2020 FinAccess Business Survey are highlighted below:• There were 915,155 MSME loan accounts in the
banking industry as at December 2020 with an outstanding value of approximately Ksh.638 billion. This was an increase from 646,018 loan accounts as at December 2017, with an outstanding value of Ksh.413.9 billion. The number of accounts grew at an average of 14 percent per annum from 2017 to 2020 while the value of loan accounts grew at an annual average of 15 percent over the same period. This is slightly higher than the 11 percent annual growth rate for the overall banking sector loan portfolio over the same period. The increase is attributable largely to enhanced marketing among MSMEs by commercial and microfinance banks as they compete for greater shares of the MSME market segment.
• The Ksh.638 billion worth of MSME loans as at December 2020 constituted 20.9 percent of the total loan book of Ksh.3.1 trillion. This was an increase from December 2017 when the MSME portfolio accounted for 19.2 percent of the total loan book of Ksh.2.16 trillion. [Table 11 (a)].
Table 11 (a): MSME Lending Compared to Total Banking Sector Loan Portfolio Year ending December
MSME Loan Portfolio(Ksh.Billion)
Total Banking Sector Loan Portfolio(Ksh.Billion)
MSME Loans/ Total Loan Portfolio (%)
2020 638 3,050 20.92017 414 2,155 19.2Source: Commercial Banks and Microfinance Banks
• Of the Ksh.638 billion outstanding MSME loan balance as at December 2020, commercial banks had lent Ksh.608
billion (95 percent), while microfinance banks lent Ksh.30 billion (5 percent). • Deposits held by MSMEs as at December 2020 amounted to Ksh.577.6 billion or 14 percent of the total deposit
liabilities for commercial banks. MSME deposits in microfinance banks amounted to Ksh.25.74 billion or 52.2 percent of overall deposits held by microfinance banks. As at December 2017, MSME deposits accounted for 20.2 percent of total deposit liabilities for commercial banks and 72.5 percent of deposit liabilities in microfinance banks. The decline in the proportion of MSME deposits to overall deposits may be attributed to a proportionately larger increase in non-MSME deposits than in MSME deposits during the review period [Table 11 (b), (c)].
Table 11 (b): MSMEs Deposits Held in Commercial BanksYear ending December MSME Deposits
(Ksh.Billion)Total Customer Deposits (Ksh.Billion)
MSME Deposits/ Total Customer Deposits (%)
2020 577.6 4,011 14.42017 585.8 2,899 20.2 Source: Commercial Banks and Microfinance Banks

C E N T R A L B A N K O F K E N Y ABANK SUPERVISION ANNUAL REPORT 2020
29
Table 11 (c): MSMEs Deposits Held in Microfinance BanksYear ending December MSME Deposits
(Ksh.Billion)Total Customer Deposits (Ksh.Billion)
MSME Deposits/ Total Customer Deposits (%)
2020 25.7 49.3 52.22017 27.5 38.9 70.7Source: Commercial Banks and Microfinance Banks
• Overall income (including both interest and non-interest income) generated by the commercial and microfinance banks from lending to MSMEs in 2020 stood at Ksh.67 billion or 11.3 percent of the banking sector’s total income. This was a decline from 2017 when overall income from MSME facilities stood at Ksh.74.1 billion or 20.7 percent of the banking sector’s total income as at December 2017. The decline in incomes from MSME facilities is partially attributable to the subdued business environment that resulted from the COVID-19 pandemic in 2020, and its adverse impact on MSME’s income generation and debt servicing capacity [Table 11(d)].
Table 11 (d): Income from MSMEs Lending as a proportion of Total Banking Sector IncomeYear ending December Income from MSME Loan
Portfolio (Ksh.Billion)Total Income from Banking Sec-tor Loan Portfolio (Ksh.Billion)
MSME Income/Total Income %
2020 66.8 589.44 11.3
2017 74.1 357.89 20.7
Source: Commercial Banks and Microfinance Banks
• In 2019, commercial and microfinance banks restructured a total of 4,291 loan facilities valued at Ksh.20.5 billion. These constituted approximately 0.05 percent of total loan accounts and 0.8 percent of the total value of the gross loan portfolio as at December 2019. In 2020, a total of 71,837 loan facilities valued at Ksh 238.8 billion were restructured, which constituted 0.6 percent of total loan accounts and 7.9 percent of the total value of the gross loan portfolio as at December 2020. The restructuring was largely aimed at providing relief to borrowers to better manage their credit performance. In 2020, restructuring was largely aimed at cushioning borrowers that were adversely affected by the COVID-19 pandemic.
• 204,802 of the 915,115 MSME loan accounts as at December 2020 valued at Ksh.98.7 billion were classified as non-performing. This amounted to 22.4 percent of total MSME loan accounts, 15.5 percent of the total value of outstanding MSME loans, and 3.2 percent of the overall banking sector loan book. In value terms, the level of MSME NPLs in December 2017 amounted to Ksh.56.4 billion or 13.6 percent of the overall MSME loan portfolio of 413.9 billion. [Table 11(e)].
Table 11 (e): MSME Credit Facilities – Asset QualityYear ending December
No. of NPLs Value of MSME NPLs (Ksh.Billion)
Total Value of MSME Loan Portfolio (Ksh.Billion)
Value of MSME NPLs/Total NPLs %
2020 204,567 98.7 638.0 15.5
2017 101,424 56.4 413.9 13.6
Source: Commercial Banks and Microfinance Banks

C E N T R A L B A N K O F K E N Y ABANK SUPERVISION ANNUAL REPORT 2020
30
2.11.3 Innovation Survey 2020In February 2021, CBK conducted an Innovation Survey, which was aimed at collecting present and forward-looking information on Fintech developments in the Kenyan financial sector as at December 31, 2020. The survey collected data on the state of innovation from 39 commercial banks and 14 Micro Finance Banks (MFBs).
One of the key pillars of the Kenya Banking Sector Charter issued in 2019 by CBK was a keen focus on customer centricity.16 The Kenyan banking sector is renowned for its uptake of technology to meet customer expectations for “anytime anywhere” financial services, and to drive efficiency gains. As part of aligning to the Charter, the sector has witnessed the diversification of products tailor-made to meet the ever-changing customer needs while improving the competitive edge of the institutions. Relatively all institutions noted a positive impact of the Kenya Banking Sector Charter on their business strategy focus on innovation.
While institutions have been successful in leveraging technology to achieve their objectives, primarily as a cost reduction strategy, there is a change in focus towards an alternative strategic coin, where technology is no longer perceived as a cost saver but as a revenue generator. Furthermore, with the onset of the COVID-19 pandemic in 2020, and the resultant disruptions to the lives and livelihoods of individuals, and the impact to businesses, including banks, it is evident that innovation will be a critical point in adapting to the new “business as usual”.
The COVID-19 pandemic saw banks accelerate their digital strategies. 56 percent of the institutions identified the drive for uptake and utilization of digital channels especially mobile and internet banking as a key strategy in the COVID-19 era. Digital financing innovations were critical in responding to the COVID-19 pandemic. Fintech enabled business continuity and rapid scaling up of support to vulnerable groups.
16 https://www.centralbank.go.ke/wp-content/up-loads/2020/03/Kenya-Banking-Sector-Charter-2019.pdf
56 percent of the banks and 29 percent of the MFBs innovated a product specialized to curb the effects of COVID-19. Further, 79 percent of the banks and 72 percent of MFBs introduced a new Fintech product between January 1, 2020 and December 31, 2020. Products implemented by 77 percent of the institutions attained their objectives while 23 percent did not. Chart 5 (a) and (b) below highlights the percentage of institutions that developed new Fintech products within five functional areas of innovation.

C E N T R A L B A N K O F K E N Y ABANK SUPERVISION ANNUAL REPORT 2020
31
The top 3 challenges faced by institutions regarding product innovation in 2020 were: • Increased risk associated with Cyber Security.• Inadequate resources. • Fast paced changes in demographic and client
behaviours.
The COVID-19 pandemic impacted pre-existing innovations in 56 percent of banks and 43 percent of MFBs. 54 percent of the institutions whose pre-existing innovation was impacted by COVID-19 identified accelerated uptake of their innovative products by customers as the key impact especially increased
transactions through digital channels. Key effects of COVID-19 on innovation activities as highlighted by most institutions were:
• Re-prioritization of ongoing innovation projects with more focus placed on business resilience during the COVID-19 pandemic.
• Reduced uptake and utilization of card products due to reduced physical movement.
• Delayed implementation of some on-going projects especially due to difficulties in coordinating vendors.
• Renewed and increased focus on uptime and availability of digital channels.
Chart 5 (a): Microfinance Banks Functional Areas of Innovation
Chart 5 (b): Commercial Banks Functional Areas of Innovation
Source: CBK 2020 Innovation Survey

C E N T R A L B A N K O F K E N Y ABANK SUPERVISION ANNUAL REPORT 2020
32
Cyber risk (Data Privacy and Data Security risk) and Strategic risk turned out to be the key risk areas for institutions in their innovation endeavor with 35 percent and 33 percent responses respectively. Operational risk was third at 19 percent.
Application Programming Interfaces (APIs), Big Data and Data Analytics, and Cloud Computing continue to be the major innovations whose developments are considered important by financial institutions.
Fiscal incentives remained the most preferred form of public support at 64 percent, a similar ranking to the 2019 survey. 19 percent of the financial institutions identified Fintech incentives and funding of research and development as a high priority public policy area to drive innovation.
The Sustainable Development Goal (SDG) 1: “End poverty in all its form everywhere”, was named the SDG with the most potential for innovation-related activities tied to digitalization of finance, with 92 percent of institutions concurring. This was a rise in ranking from third with 51 percent in the 2019 survey.
The innovation survey report informs the impact of Fintech on the current operating models, including the emergence of new business models and evolving and emerging risks. It also provides an informed basis for evidence-based public policy decisions on Fintech going forward.
2.12 Innovative MSME Products by Banks
Technological advancement has given consumers power to choose what kind of financial products they want. The need to meet customers’ expectations has therefore redefined the way commercial banks innovate products. It is critical that commercial banks come up with products that meet specific needs of their consumers. In addition, commercial banks have realised that venturing into the markets they deem risky is made much easier through providing customer centric products. MSMEs have been deemed risky and were locked out of the financial system for a long time. With this new realisation, MSMEs can now enjoy financial products which meet their specific needs.
In 2020, commercial banks came up with various innovative products to serve the MSME sector. These products were created for various market segments such as women, farmers, suppliers among others. The key attributes of these products is that they were all designed with the target market in mind; what their needs are, what drives them, what value they are likely to acquire from these products among others. CBK continues to encourage the banking sector to innovate and ensure that the products meet the specific needs of all their customers and especially the MSMEs in Kenya.
2.13 Employment Trends in the Banking Sector
The banking sector staff levels marginally decreased by 420 (1.31 percent) from 32,025 in December 2019 to 31,605 in December 2020 (Table 12). Management and Clerical staff cadres decreased by 327 and 827 respectively. The decreases were mainly due to staff rationalization by some banks as they aligned their business models to the acceleration in digitalization.
Table 12: Employment in the Banking Sector 2019 2020 Change Percentage
Change (%)Management 10,717 10,390 -327 -3.05
Supervisory 7,270 7,582 312 4.29
Clerical 11,965 11,138 -827 -6.91
Secretarial and other Staff
2,073 2,495 422 20.36
Total 32,025 31,605 -420 -1.31Source: CBK
2.14 Future OutlookAs the world builds back from the COVID-19 pandemic, the banking sector is poised to play a pivotal role. Agility will be the name of the game as banks respond to the “new normal”. Customer demands for “anytime anywhere” services will increase. Legacy ICT systems will come under pressure and the flight to the “cloud” will increase in pace and intensity. Partnerships between Financial Institutions and Fintechs will increase as banks move to orchestrate financial ecosystems to meet the demands of the “new world”.

C E N T R A L B A N K O F K E N Y ABANK SUPERVISION ANNUAL REPORT 2020
33
DEVELOPMENTS IN THE BANKING SECTOR
MACROECONOMIC CONDITIONS AND BANKING SECTOR PERFORMANCE
C E N T R A L B A N K O F K E N Y ABANK SUPERVISION ANNUAL 2020
33
CHAPTER 3

C E N T R A L B A N K O F K E N Y ABANK SUPERVISION ANNUAL REPORT 2020
34
MACROECONOMIC CONDITIONS AND BANKING SECTOR PERFORMANCE
3.1 Global Economy
Global growth is estimated to have contracted by 3.5 percent in 2020, compared to an increase of 2.8 percent in 2019. The significant global contraction estimates in 2020 were mainly due to strict containment measures that disrupted trade, travel and economic activity. In particular, it reduced labour supply due to the spread of infections mostly in sectors that rely heavily on social interactions such as travel, hospitality, tourism and entertainment; disruptions of supply chain and; lowered productivity; worsened financial markets conditions; led to a sharp drop in commodity prices and; occasioned debt crisis mostly in emerging and developing economies. However, the 2020 estimates reflect better-than-anticipated second-quarter GDP outturns in advanced economies where activity began to improve sooner than expected after the easing of pandemic induced lockdowns in May and June. The IMF World Economic Outlook (WEO) project the global output growth for 2021 at 5.5 percent, and is expected to moderate to 4.2 percent in 2022 (Table 13).
Growth in the advanced economies group, where several countries experienced widespread outbreaks and deployed strict containment measures, is estimated to contract by 4.9 percent in 2020 compared to a growth of 1.6 percent in 2019. In the emerging market and developing economies, growth is projected to contract by 2.4 percent in 2020 compared to a growth of 3.6 percent in the previous year, reflecting largely domestic disruptions of economic activity from the COVID-19 pandemic.
The IMF projects a significant growth recovery for advanced economies in 2021 of 4.3 percent, which will moderate in 2022 to 3.1 percent. However, the recovery paths vary across the countries, with the US and Japan
projected to regain end-2019 activity levels in the second half of 2021, due to the carryover from additional fiscal support, while in the Euro Area and the United Kingdom activity is expected to remain below end-2019 levels into 2022. All economies in this group are expected to expand considerably in 2021 (Table 13).
Economic activity in the emerging market and developing economies is expected to expand by 6.3 percent in 2021 and moderate to 5.0 percent in 2022. China and India will rebound strongly in 2021 to expand by 8.1 percent and 11.8 percent, respectively, reflecting considerable differentiation expected between China and other economies, and India’s carryover from a stronger-than-expected recovery in 2020 after lockdowns was eased (Table 13).
3.2 Regional economy
The onset of the pandemic was delayed in Sub-Saharan Africa (SSA), and infection rates have been relatively low compared with other parts of the world. However, the SSA region is contending with unprecedented health and economic crisis due to the resurgence of new cases in many advanced economies and the threat of repeated outbreaks across the other regions. Overall, the region is estimated to contract by –2.6 percent in 2020 compared with an expansion of 3.2 percent in 2019, with Nigeria and South Africa contracting by 3.2 percent and 7.5 percent, respectively (Table 13). Economies in the SSA region are expected to expand by 3.2 percent in 2021 and 3.9 percent in 2022, respectively. The largest impact of the crisis on growth has been in the tourism-dependent economies, while commodity-exporting countries have also been hit hard. Growth in more diversified economies will slow significantly, but in many cases will still be positive in 2020.

C E N T R A L B A N K O F K E N Y ABANK SUPERVISION ANNUAL REPORT 2020
35
MACROECONOMIC CONDITIONS AND BANKING SECTOR PERFORMANCE
Risks to the Outlook and Policy Direction
The 2021 growth projections are largely supported by favourable news on vaccine development, distribution, and effectiveness of therapeutics that are expected to boost confidence among firms and households and; additional policy support. However, the pace of economic growth across the regions underscores the vulnerabilities, economic structure, pre-crisis growth trends, severity of the COVID-19 pandemic, and the size of the policy response to combat the fallout. Similarly, slower-than-anticipated progress on medical interventions could dampen hopes of a relatively quick exit from the pandemic and weaken confidence; vaccine rollout could suffer delays, deliver shorter-lived immunity than anticipated, and advances on therapeutics could be limited. The ensuing tighter
financial conditions could increase rollover risks for vulnerable borrowers, add to the already large number of economies in debt distress and increase insolvencies among corporates and households.
3.3 Domestic Economy17
For the first time in recent memory, the economy contracted in the first three quarters of 2020 following the devastating impact of the COVID-19 pandemic which disrupted global as well as a domestic economic activity since March 2020. Real GDP contracted by -0.4 percent compared to a growth of 5.3 percent in the first three quarters of 2019. The slowdown in economic activity was driven by significant declines in the Services
17Growth numbers for the fourth quarter of 2020 will be released by KNBS in May 2021.
Table 13: World Economic Outlook ProjectionsReal GDP Growth (% change)
Year over Year Difference from June 2020 WEO Projections Actual Estimate Projections
2019 2020 2021 2022 2021 2022World Output 2.8 –3.5 5.5 4.2 0.3 0.0
Advanced Economies 1.6 –4.9 4.3 3.1 0.4 0.2United States 2.2 –3.4 5.1 2.5 2.0 –0.4Euro Area 1.3 –7.2 4.2 3.6 –1.0 0.5
Germany 0.6 –5.4 3.5 3.1 –0.7 0.0France 1.5 –9.0 5.5 4.1 –0.5 1.2Italy 0.3 –9.2 3.0 3.6 –2.2 1.0Spain 2.0 –11.1 5.9 4.7 –1.3 0.2
Japan 0.3 –5.1 3.1 2.4 0.8 0.7United Kingdom 1.4 –10.0 4.5 5.0 –1.4 1.8Canada 1.9 –5.5 3.6 4.1 –1.6 0.7Emerging Market and Developing Economies 3.6 –2.4 6.3 5.0 0.3 –0.1
China 6.0 2.3 8.1 5.6 –0.1 –0.2India 4.2 –8.0 11.5 6.8 2.7 –1.2Russia 1.3 –3.6 3.0 3.9 0.2 1.6Brazil 1.4 –4.5 3.6 2.6 0.8 0.3Mexico –0.1 –8.5 4.3 2.5 0.8 0.2Saudi Arabia 0.3 –3.9 2.6 4.0 –0.5 0.6
Sub-Saharan Africa 3.2 –2.6 3.2 3.9 0.1 –0.1Nigeria 2.2 –3.2 1.5 2.5 –0.2 0.0South Africa 0.2 –7.5 2.8 1.4 –0.2 –0.1
Source: IMF World Economic Outlook (WEO) January 2021 Update

C E N T R A L B A N K O F K E N Y ABANK SUPERVISION ANNUAL REPORT 2020
36
MACROECONOMIC CONDITIONS AND BANKING SECTOR PERFORMANCE
sector, which were adversely affected by the COVID-19 pandemic in the second and third quarters of 2020. The Services sector contracted by -3.9 percent in the first three quarters of 2020 compared to a growth of 6.6 percent in a similar period of 2019 largely attributed to the domestic and international containment measures enforced to prevent the spread of COVID-19, which led to a drastic slump in Accommodation and Restaurants; Education; Wholesale and Retail Trade; Transport and Storage; and, Professional, Administration and Support Services sectors (Table 14).
The Industry sector recorded modest growth in the first three quarters of 2020. It grew by 2.9 percent compared to 4.9 percent in a similar period of 2019. The slowdown was mainly attributed to a contraction of activity in the manufacturing sector. The contraction was due
to reduced activity in food and non-food processing subsectors owing to the various COVID-19 containment measures enforced in the second and third quarters of 2020. However, the Construction sector supported growth in the industry. It grew by 8.6 percent driven by increased activity in the public investment on roads and, water and sewerage work.
Agriculture sector growth was strong, supported by favourable weather conditions experienced in the country. It grew by 6.4 percent in the first three quarters of 2020 compared to 3.6 percent in a similar period of 2019. Production of key crops such as tea, sugarcane and horticultural crops for export increased during the period under review.
Source: KNBS and CBK
Table 14: Real GDP Growth Rates (Percent)2019 Q1
2019 Q2
2019 Q3
2019 Q4
2020 Q1
2020 Q2
2020 Q3
2019 Q1-Q3
2020 Q1-Q3
Agriculture 4.0 2.0 5.0 3.6 5.8 7.3 6.3 3.6 6.42. Non-Agriculture (o/w) 5.6 6.0 6.0 5.8 4.9 -9.2 -2.7 5.9 -2.4 2.1 Industry 4.1 5.5 5.0 4.0 4.4 -0.5 4.9 4.9 2.9 Mining & Quarrying 1.4 5.0 3.4 0.3 9.5 10.0 18.2 3.2 12.6 Manufacturing 2.3 4.1 3.9 2.6 2.9 -3.9 -3.2 3.5 -1.4 Electricity & water supply 7.8 7.3 6.4 6.4 6.3 -0.6 4.7 7.2 3.3 Construction 6.1 7.2 6.6 5.7 5.3 3.9 16.2 6.6 8.6 2.2 Services 6.4 6.7 6.7 6.8 5.5 -11.6 -5.3 6.6 -3.9 Wholesale & Retail Trade 6.3 7.8 6.1 6.4 6.4 -7.0 -2.5 6.7 -1.3 Accommodation & restaurant 11.0 12.1 9.9 9.0 -9.3 -83.2 -57.9 10.9 -45.1 Transport & Storage 6.4 7.6 7.6 9.2 6.1 -11.4 2.9 7.2 -0.9 Information & Communication 10.0 7.5 8.0 9.1 9.8 4.6 7.3 8.6 7.5 Financial & Insurance 6.3 5.2 8.1 6.6 6.2 4.2 5.3 6.5 5.3 Public administration 8.9 8.7 8.4 6.2 6.7 5.7 9.6 8.7 7.3 Professional, Administration & Support Services 5.5 4.2 4.8 4.9 4.4 -15.3 -12.3 4.8 -7.9 Real estate 4.7 6.0 5.5 5.1 4.4 2.3 5.3 5.4 4.0 Education 4.3 6.0 6.0 5.5 5.3 -56.2 -41.9 5.4 -31.2 Health 5.4 6.2 5.5 6.2 5.8 10.3 5.6 5.7 7.3 Other services 5.6 5.6 5.3 3.8 2.2 -8.5 -4.5 5.5 -3.6 FISIM 4.6 7.3 6.8 5.7 5.0 3.7 7.7 6.2 5.5 2.3 Taxes on products 4.7 4.0 4.2 4.5 3.4 -14.2 -4.2 4.3 -5.2Real GDP Growth 5.2 5.1 5.8 5.4 5.2 -5.5 -1.1 5.3 -0.4

C E N T R A L B A N K O F K E N Y ABANK SUPERVISION ANNUAL REPORT 2020
37
MACROECONOMIC CONDITIONS AND BANKING SECTOR PERFORMANCE
Economic Outlook for 2021
Economic growth is expected to rebound in 2021, supported by the normalization of the domestic and global economy as well as supportive fiscal and monetary policies. However, there are significant downside risks to this outlook, mainly attributed to uncertainties surrounding the COVID-19 pandemic. New waves of infections and COVID-19 strains could lead to renewed enforcement of containment measures, thus slowing the momentum of global recovery. Prolonged supply chain disruptions in some regions, uneven recovery of the global economy, and rising international oil prices could also slow down domestic and international growth.
3.4 Inflation
Overall inflation18 remained well anchored within the Government medium-term target band in 2020. Annual average inflation declined to 4.9 percent in December 2020 compared to 5.2 percent in 2019. The decline was largely driven by lower food inflation following reduced prices of key food items. Fuel inflation continued to rise during the year, occasioned by increased transport costs associated with social distancing measures in public transport to prevent the spread of COVID-19. Meanwhile, Non-Food-Non-Fuel (NFNF) inflation remained low and stable, averaging 2.1 percent in 2020, reflective of muted demand pressures in the economy. Inflation is projected to remain stable, within the medium-term target band of 5±2.5 percent in 2021, on account of low food prices as weather conditions remain favourable.
18The Kenya National Bureau of Statistics (KNBS) revised the inflation basket in February 2020. The previous CPI basket of 234 items was revised to 330 items, and an additional category known as ‘Financial and Insurance services’ was added in the basket. ‘Miscellaneous goods and services’ cat-egory were revised to ‘Personal Care, Social Protection and Miscellaneous Goods and Services’ category. Food inflation comprise “food and non-alcoholic beverages” categories of the CPI basket; and fuel inflation comprise “transport” and “housing, water, electricity, gas and other fuels” categories of the CPI basket; NFNF inflation excludes food and fuel inflation.
Chart 6: Developments in inflation
Source: KNBS and CBK
18The Kenya National Bureau of Statistics (KNBS) revised the inflation basket in February 2020. The previous CPI basket of 234 items was revised to 330 items, and an additional category known as ‘Financial and Insurance services’ was added in the basket. ‘Mis-cellaneous goods and services’ category were revised to ‘Personal Care, Social Protection and Miscellaneous Goods and Services’ category. Food inflation comprise “food and non-alcoholic beverages” categories of the CPI basket; and fuel inflation comprise “transport” and “housing, water, electricity, gas and other fuels” categories of the CPI basket; NFNF inflation excludes food and fuel inflation.

C E N T R A L B A N K O F K E N Y ABANK SUPERVISION ANNUAL REPORT 2020
38
MACROECONOMIC CONDITIONS AND BANKING SECTOR PERFORMANCE
3.5 Exchange rateThe foreign exchange market weakened against major international currencies in 2020. The Kenya shilling weakened against the US dollar to exchange at an average rate of 106.5 in 2020 from an average of 102.0 in 2019 (Table 15).
3.6 Interest ratesAll interest rates generally declined in 2020, largely reflecting an accommodative monetary policy stance and improved liquidity conditions geared towards mitigating the adverse effects of the pandemic and supporting economic activities. The Monetary Policy Committee (MPC) reduced the Central Bank Policy Rate (CBR) by cumulative 150 basis points to 7.00 percent, with the bulk of the reduction (125 basis points) occurring following the COVID-19 pandemic shock in March 2020. Improved liquidity conditions partly reflected increased government payments including COVID-19 related expenditure as well as the reduction of the Cash Reserve Ratio (CRR) from 5.25 percent to 4.25 percent in March 2020, which released KSh.35.2 billion in liquidity to banks for supporting customers who were distressed by COVID-19.
Interest rates on 91-day and 182-day Treasury bills declined to 6.85 percent and 7.51 percent in 2020 from 6.92 percent and 7.87 percent in 2019, respectively. Similarly, the weighted average interbank interest rate declined to 3.73 percent from 4.32 percent in 2020, largely reflecting improved liquidity conditions in the money market.
Commercial banks’ average lending rates declined to an average of 12.00 percent in 2020 from 12.44 percent in 2019, with the lending rate reaching a historical low of 11.75 percent in September 2020. The deposit rates declined to an annual average of 6.73 percent in 2020 from 7.07 percent in 2019. As a result, the interest rate spread narrowed to an average of 5.27 percent in 2020 from 5.37 percent in 2019 (Chart 7).
Chart 7: Interest Rates (percent)
Table 15: Exchange rate developmentsUSD Dollar Sterling Pound EURO SA RAND USHS TSHS RWF BIF
2017 103.2 138.8 123.3 8.4 35.2 21.7 8.3 17.12018 101.8 129.0 116.4 7.1 36.5 22.6 8.8 17.62019 101.3 132.9 113.4 7.2 36.2 22.7 9.4 18.52020 106.5 136.6 121.5 6.5 35.0 21.8 9.0 18.0
Source: CBK
Source: CBK

C E N T R A L B A N K O F K E N Y ABANK SUPERVISION ANNUAL REPORT 2020
39
MACROECONOMIC CONDITIONS AND BANKING SECTOR PERFORMANCE
3.7 Balance of Payments
The current account deficit remained stable at 4.8 percent of GDP in 2020, supported by savings from lower oil import bill, the strong performance of agricultural exports, and resilient remittances (Chart 8).
Chart 8: Developments in Current Account
Source: KNBS and CBK
3.8 Fiscal Developments
Total government revenues and grants amounted to Ksh.808.6 billion in the period July-December 2020, representing a 14.0 percent decrease from Ksh.940.5 billion collected in a similar period in FY 2019/2020 (Table 16). Tax revenue fell below its set target in the first half FY 2020/21, owing to the impact of tax relief measures taken by the Kenya Government to cushion Kenyans against the impact of COVID-19 which adversely affected revenue collection. Total expenditure and net lending also decreased by 2.2 percent during the first half of FY 2020/21 to Ksh.1,191 billion compared to Ksh.1,218.1 billion over a similar period in 2019. Consequently, Government budgetary operations during the period under review resulted in a deficit of Ksh.382.4 billion (3.4 percent of GDP) on a cash basis compared to a deficit of Ksh.259.5 billion (2.5 percent of GDP) incurred over the same period in 2019. The deficit was above the target of 3.3 percent of GDP.
K e n ya ’s p u b l i c a n d p u b l i c l y guaranteed debt increased by 20.4 percent from KSh.6,048.9 billion in December 2019 to KSh.7,281.8 billion in December 2020, with both domestic and external debt increasing at 18.6 percent and 22.1 percent, respectively. Public debt profile comprised 47.9 percent and 52.1 percent of domestic and external debt respectively. The ratio of public debt to GDP rose to 67.8 percent in December 2020 from 62.1 percent in December 2019.

C E N T R A L B A N K O F K E N Y ABANK SUPERVISION ANNUAL REPORT 2020
40
MACROECONOMIC CONDITIONS AND BANKING SECTOR PERFORMANCE
3.9 Performance of the Banking Sector
The banking sector recorded a declined performance in the year ended December 2020 as a result of the COVID-19 pandemic. The sector’s profit before tax decreased by 29.3 percent to Ksh.112.4 billion in the year ended December 2020 from Ksh.159.1 billion in the year ended December 2019. The decline in profitability was mainly driven by a lower increase in total income (7.3 percent) compared to the increase in total expenses (22.6 percent). The higher increase in total expenses was mainly attributed to a 177.2 percent increase in loan loss provisions.
3.10 Commercial Banks Balance Sheet Analysis
The banking sector registered improved financial strength in 2020, with total net assets recording an increase of 12.4 percent from Ksh.4,809.4 billion in December 2019 to Ksh.5,405.8 billion in December 2020 (Table 17). This is attributable to increased investment in Government securities and loans and advances. Government securities increased by 23.0 percent from Ksh.1,302.0 billion in December 2019 to Ksh.1,601.0 billion in December 2020. Net loans and advances registered an increase of 6.6 percent from Ksh.2,494.0
Table 16: Fiscal DevelopmentsFY 2019/20 Over (+) / %
Q2 Cumulative Q1 Q2 Cumulative Target Below (-) Variance
Ksh Bn to Dec-2019 to Dec-2020 Target
1. TOTAL REVENUE & GRANTS 516.6 940.5 382.9 425.7 808.6 827.8 (19.2) (2.3)
Ordinary Revenue 473.5 857.9 342.6 383.8 726.4 726.4 -
Tax Revenue 385.2 756.6 316.8 351.9 668.7 683.3 (14.6)
Non Tax Revenue 88.3 101.2 25.8 31.9 57.7 43.1 14.6
Appropriations-in-Aid 35.7 72.5 36.1 37.5 73.6 88.3 (14.7)
External Grants 7.3 10.1 4.2 4.3 8.5 13.1 (4.6)
2. TOTAL EXPENSES & NET LENDING 673.5 1,218.1 510.4 675.4 1,191.0 1,195.1 (4.1) (0.3)
Recurrent Expenses 436.6 827.7 359.5 424.5 798.7 788.6 10.1
Development Expenses 172.2 268.1 122.1 150.3 262.8 256.9 5.9
County Transfers 64.7 122.2 28.8 100.6 129.5 149.6 (20.2)
Others - - - - - - -
3. DEFICIT (INCL. GRANTS) (1-2) (156.9) (277.6) (127.5) (249.8) (382.4) (371.8) (10.6) 2.9
As percent of GDP (1.5) (2.7) (1.1) (2.2) (3.4) (3.3) (0.1)
4. ADJUSTMENT TO CASH BASIS 18.1 18.1 - - - - -
5. DEFICIT INCL . GRANTS ON A CASH BASIS (138.8) (259.5) (127.5) (249.8) (382.4) (371.8) (10.6) 2.9
As percent of GDP (1.3) (2.5) (1.1) (2.2) (3.4) (3.3) (0.1)
6. DISCREPANCY: Expenditure (+) / Revenue (-) 20.4 (6.3) 2.4 (21.5) (19.7) - (19.7)
7. FINANCING 159.2 253.2 129.9 228.3 362.7 371.8 (9.1) (2.4)
Domestic (Net) 90.1 170.9 152.4 188.5 345.5 340.9 4.5
External (Net) 67.5 80.7 (22.5) 39.7 17.2 30.8 (13.7)
Other Dom. Financing (domestic loan receipts) 1.6 1.6 0.0 0.0 0.1 0.1 -
Others - - - - - -
Source: The National Treasury-Dec 2020 Provisional BOT

C E N T R A L B A N K O F K E N Y ABANK SUPERVISION ANNUAL REPORT 2020
41
MACROECONOMIC CONDITIONS AND BANKING SECTOR PERFORMANCE
billion in December 2019 to Ksh.2,658.7 billion in December 2020. Net loans and advances, government securities and placements accounted for 49.2 percent, 29.6 percent and 6.0 percent of the total net assets, respectively and remained the main components of the banks’ balance sheet.
Table 17: GLOBAL BALANCE SHEET ANALYSIS (Ksh.M)Dec-19 Dec-20 % of Total
Assets/Total Liabilities
Cash 72,013 72,107 1.3
Balances at Central bank 257,786 214,820 4.0
Placements 214,854 323,485 6.0
Government Securities 1,301,979 1,601,044 29.6
Investments 46,396 68,466 1.3
Loans and Advances (Net) 2,494,006 2,658,712 49.2
Other assets 422,376 467,112 8.6
Total Assets 4,809,410 5,405,746 100.0Liabilities and Shareholders’ FundsCustomer Deposits 3,531,373 4,011,316 74.2
Other liabilities 549,215 586,966 10.9
Capital and Reserves 728,822 807,464 14.9
Total liabilities and Shareholders’ Funds
4,809,410 5,405,746 100.0
Source: CBK
Customer deposits, which are the main source of funding for the banks grew by 13.6 percent from Ksh.3,531.4 billion in December 2019 to Ksh.4,011.3 billion in December 2020. The growth was supported by mobilization of deposits through agency banking and mobile phone platforms.
In 2020, the banking sector capital and reserves increased by 9.8 percent from Ksh.728.8 billion in December 2019 to Ksh.807.5 billion in December 2020. The increase in capital and reserves is attributable to increase in retained earnings and share premium. Retained earnings increased by Ksh.55.9 billion from Ksh.357.5 billion in December 2019 to Ksh.413.4 billion in December 2020. Share premium increased by Ksh.2.69 billion from Ksh.109.9 billion in December 2019 to Ksh112.6 billion in December 2020.
3.11 Sectoral Distribution of Gross loans, Loan Accounts and Gross Non-Performing Loans
The largest proportion of the banking industry gross loans and advances were channelled to the Personal and Household, Trade, Real Estate and Manufacturing Sectors. In total, these four economic sectors accounted
for 74.0 percent of gross loans in December 2020 as indicated in Table 18. Personal and Household, Trade and Agriculture sectors accounted for the highest number of loan accounts with a total of 98.8 percent. Trade, Personal and Household, Real Estate and Manufacturing sectors accounted for the highest value of non-performing loans by registering 70.4 percent. This was mainly due to delayed payments from public and private sectors, slow uptake of housing units and challenges brought about by the COVID-19 pandemic.
The concentration of non-performing loans was mainly in Trade, Personal and Household, Manufacturing and Real Estate sectors in December 2020. CBK will closely monitor the four economic sectors to ensure that commercial banks make adequate provisions for the loans in the four economic sectors to mitigate risk of default.

C E N T R A L B A N K O F K E N Y ABANK SUPERVISION ANNUAL REPORT 2020
42
MACROECONOMIC CONDITIONS AND BANKING SECTOR PERFORMANCE
Table 18: Sectoral Distribution of Loan Accounts, Gross Loans and NPLs-December 2020
No. of Loan A/Cs
% of Total Gross Loans, Ksh. Million
% of Total
Gross NPLs, Ksh. Million
% of Total
Agriculture 119,453 1.05 108,053 3.59 23,286 5.34
Manufacturing 21,778 0.19 416,845 13.87 66,626 15.28
Building and construction 13,154 0.12 117,426 3.91 28,492 6.53
Mining and Quarrying 1,612 0.01 21,902 0.73 2,993 0.69
Energy and water 3,062 0.03 112,172 3.73 12,876 2.95
Trade 280,267 2.45 517,729 17.23 101,884 23.36
Tourism, restaurant and Hotels 7,300 0.06 103,181 3.43 16,079 3.68
Transport and Communication 44,028 0.39 223,884 7.45 38,178 8.76
Real Estate 29,873 0.26 444,705 14.79 68,448 15.70
Financial Services 11,725 0.10 96,608 3.21 7,007 1.61
Personal and Household 10,892,342 95.34 843,599 28.06 70,198 16.10
Total 11,424,594 100.00 3,006,104 100.00 436,067 100.00Source: CBK
3.11.1 Risk Classification of Loans and Advances
The CBK’s Prudential Guideline on Risk Classification of Assets and Provisioning requires commercial banks to classify loans and advances extended to their customers based on performance. The performance criteria are based on repayment capability of the borrower. The loans are classified as either normal, watch, substandard, doubtful or loss.
• Normal: loans performing in accordance with the contractual terms and which are up to date on repayments, and expected to continue in this condition.
• Watch: Loans which are generally past due by between 30 and 90 days.
• Substandard: Loans which are generally past due for more than 90 but less than 180 days.
• Doubtful: Loans which are generally past due for more than 180 but less than 360 days.
• Loss: Loans which are generally past due for 360 days or more.
The loans and advances in the normal category increased by 10.7 percent from Ksh.2,036.9 billion and in December 2019 to Ksh.2,254.0 billion in December 2020. The normal category accounted for 75.0 percent of the total loans in 2020 compared to 75.7 percent in 2019 whereas, the watch category accounted for 10.5 percent of the total loans in 2020 compared to 11.8 percent in 2019.
The loans and advances in the substandard, doubtful and loss categories increased by 81.6 percent, 16.0 percent and 32.1 percent respectively (Table 19). This is also reflected by the increased levels of these categories to the entire loan book. The substandard, doubtful and loss categories accounted for 3.2 percent, 8.3 percent and 3.1 percent of the loan book in 2020 compared to 2.0 percent, 8.0 percent and 2.6 percent in 2019. The increase in the non-performing loans’ categories were occasioned by deteriorating asset quality as a result of COVID-19 pandemic, enhanced reclassification and provisioning of loans, challenges in the business environment and increased default of digital loans since they are unsecured.

C E N T R A L B A N K O F K E N Y ABANK SUPERVISION ANNUAL REPORT 2020
43
MACROECONOMIC CONDITIONS AND BANKING SECTOR PERFORMANCE
The proportions of loans in all categories increased in 2020 with exception of watch and substandard categories as shown in Table 19 and Chart 9.
Table 19: Risk Classification of Loans and Advances2019 2020
Change Ksh.Million % ChangeAmount Ksh.
Million% of Total
Amount Ksh Million % of Total
Normal 2,036,903 75.6 2,254,006 75.0 217,103 10.7
Watch 317,419 11.8 316,031 10.5 -1,388 -0.4
Substandard 52,712 2.0 95,721 3.2 43,009 81.6
Doubtful 214,478 8.0 248,689 8.3 34,211 16.0
Loss 69,397 2.6 91,657 3.0 22,260 32.1
Total 2,690,910 100.0 3,006,104 100.0 315,194 11.7Source: CBK
Chart 9: Risk Classification of Loans and Advances in Ksh.Millions
3.12 Asset Quality
The stock of non-performing loans (NPLs) increased by 29.6 percent to Ksh.436.1 billion in December 2020 from Ksh.336.6 billion in December 2019. Asset quality, which is measured by the ratio of gross NPLs to gross loans deteriorated to 14.5 percent in December 2020 from 12.5 percent in December 2019 as shown in Table 20 and Appendix III mainly due to a lower increase in gross loans of 11.7 percent as compared to increase in gross non-performing loans of 29.6 percent. The deterioration in asset quality was mainly due to:
i. Worsening households’ livelihoods and business closures due to COVID-19 pandemic.
ii. Staff lay-offs due to disruptions in supply chains as result of COVID-19 pandemic.
iii. Slowdown in business activities due to COVID-19 pandemic.
Risk Classification Of Loans As At December 2019
Risk Classification Of Loans As At December 2020
Source: CBK

C E N T R A L B A N K O F K E N Y ABANK SUPERVISION ANNUAL REPORT 2020
44
MACROECONOMIC CONDITIONS AND BANKING SECTOR PERFORMANCE
Table 20: Asset Quality and Provisions (Ksh.M)
December 2019 December 2020 % ChangeNet Assets 4,809,410 5,405,746 12.4Gross Loans and Advances 2,690,910 3,006,104 11.7
Total Loans 2,628,302 2,934,294 11.6
Net Loans 2,494,006 2,736,226 9.7
Gross Non-Performing Loans 336,588 436,067 29.6
Interest in Suspense 62,607 71,810 14.7
Total Non-Performing Loans 273,322 364,256 33.3
Total Provisions 134,296 198,067 47.5
Net Non- Performing Loans 139,026 166,189 19.5
Gross Loans/Net Assets (%) 56.0 55.6 - 0.4
Gross NPLs/Gross Loans (%) 12.5 14.5 2.0
Net NPLs/Gross Loans (%) 5.2 5.5 0.3
Source: CBK
3.13 Capital Adequacy
The CBK Prudential Guideline on Capital Adequacy (CBK/PG/04) requires banks to adhere to the prescribed capital adequacy ratios. The current minimum regulatory capital adequacy ratios for Core Capital to Total Deposits, Core Capital and Total Capital to Total Risk Weighted Assets are 8.0 percent, 10.5 percent and 14.5 percent respectively. Core Capital to Total Risk Weighted Assets ratio remained the same at 16.6 percent in December 2020 and December 2019. The Total Capital to Total Risk Weighted Assets ratio increased from 18.8 percent in December 2019 to 19.0 percent in December 2020. However, the core capital to total deposits ratio decreased from 17.9 percent in December 2019 to 17.1 percent in December 2020. The Kenyan banking industry was therefore fully compliant with the capital adequacy ratios in 2020. Table 21 presents the Kenyan banking sector capital adequacy trend from 2017 to 2020.
Table 21: Capital Adequacy Ratios 2017 2018 2019 2020 Minimum Capital
Adequacy Ratios (%)
Core Capital/TRWA (%) 16.5 16.6 16.6 16.6 10.5
Total Capital/TRWA (%) 18.8 19.5 18.8 19.0 14.5
Core Capital/Total Deposits (%) 18.9 17.9 17.9 17.1 8.0
Key: TRWA-Total Risk Weighted Assets
Source: CBK
3.14 Liquidity
Liquidity held by commercial banks depicts their ability to fund increases in assets and meet obligations as they fall due. Liquidity is one of the important financial stability indicators. Liquidity shortfall in one bank can cause systemic crisis in the banking sector due to their interconnected operations.
The average liquidity ratio as at December 2020 stood at 54.5 percent compared to 49.7 percent registered in December 2019. The increase in the liquidity ratio is mainly attributed to a higher growth in total liquid assets compared to the growth in total short-term liabilities. Total liquid assets grew by 23.7 percent while total short-term liabilities grew by 12.9 percent. The higher increase in liquid assets was mainly attributed to a 35.3 percent increase in investments in government treasury bonds. The banking sector’s average liquidity in 2020 was way above the statutory minimum requirement of 20 percent. 3.15 Profit and Loss
The banking sector registered a decrease in profitability in 2020 with profit before tax decreasing by 29.5 percent from Ksh.159.1 billion in December 2019 to Ksh.112.1 billion in December 2020 as shown in Table 22. The decrease in profitability was attributed to a higher increase in total expenses (Ksh.86.1 billion) compared to the increase in income (Ksh.39.1 billion).

C E N T R A L B A N K O F K E N Y ABANK SUPERVISION ANNUAL REPORT 2020
45
MACROECONOMIC CONDITIONS AND BANKING SECTOR PERFORMANCE
3.15.1 Income
Total income for the banking sector increased by 7.3 percent to Ksh.576.4 billion in December 2020 from Ksh.537.3 billion in December 2019 as shown in Table 22. The increase in income was largely attributed to increase in interest on Government Securities which increased by 22.3 percent from Ksh.122.0 billion in 2019 to Ksh.149.2 billion in 2020.
Table 22: Income and Expenditure Items as a Percentage of Total Income/Total Expenses
December 2019 December 2020Income Ksh.M % of Total Income/
Total ExpensesKsh.M % of Total Income/
Total ExpensesInterest on Advances 265,020 49.3 276,933 48.0
Fees and Commission for Loans and Advances
33,946 6.3 35,871 6.2
Other Fees and Commission Income 52,237 9.7 43,816 7.6
Interest on Government Securities 122,011 22.7 149,242 25.9
Interest on Placement 8,515 1.6 7,623 1.3
Other Income 55,578 10.3 62,961 10.9
Total Income 537,307 100.0 576,446 100.0
Expenses
Interest Expenses 137,485 36.4 146,083 31.5
Bad Debts Charge 39,640 10.5 110,688 23.8
Salaries and Wages 96,055 25.4 97,123 20.9
Other Expenses 105,055 27.8 110,407 23.8
Total Expenses 378,236 100.0 464,300 100.0
Profit Before Tax 159,072 112,145Source: CBK
3.15.2 Expenses
As shown in Table 22, the banking sector expenses increased by 22.8 percent from Ksh.378.2 billion in December 2019 to Ksh.464.3 billion in December 2020. The increase in total expenses was largely attributed to increase in loan loss provisions by Ksh.71.0 billion in 2020. Interest expenses accounted for 31.5 percent of the total banking sector expenses in 2020. Interest expense as a ratio of income decreased slightly to 25.3 percent in 2020 from 25.6 in 2019. Other expenses including training, advertising, printing and management fees increased by 5.1 percent from Ksh.105.1 billion in December 2019 to Ksh.110.4 billion in December 2020. Salaries and wages increased by 1.1 percent to Ksh.97.1 billion in December 2020 from Ksh.96.1 billion
in December 2019. Salaries and wages as a ratio of income decreased from 17.9 percent in 2019 to 16.8 percent in 2020 reflecting a lower increase in staffing costs compared to the increase in income.
3.16 Performance Rating
CBK uses the Capital Adequacy, Asset Quality, Management Quality, Earnings strength and Liquidity position (CAMEL) rating system in assessing the soundness of the commercial banks. Commercial banks are ranked in a 5-scale rating as shown in Table 23.
The banking sector was on overall rated satisfactory in 2020 as was in 2019. The institutions rated strong, satisfactory, fair, marginal and unsatisfactory in

C E N T R A L B A N K O F K E N Y ABANK SUPERVISION ANNUAL REPORT 2020
46
MACROECONOMIC CONDITIONS AND BANKING SECTOR PERFORMANCE
December 2020 were 11, 21, 4, 2 and 1 respectively, as compared to 8, 20, 7, 2, and 1 in December 2019, respectively (Table 23). The number of institutions rated strong and satisfactory increased from 8 and 20 in December 2019 to 11 and 21 in December 2020 respectively. The number of institutions rated fair decreased from 7 in December 2019 to 4 in December 2020. The market share for banks rated strong increased to 40.5 percent in December 2020 from 24.5 percent in December 2019.
Table 23: Banking Sector Performance Rating Performance Rating
December 2019 December 2020
No. of Institutions Total Net Assets (Ksh ‘Million)
Market Share (%) No. of Institutions Total Net Assets
(Ksh ‘Million)Market
Share (%)Strong 8 1,177,968 24.49 11 2,187,403 40.46
Satisfactory 20 3,301,374 68.65 21 2,921,548 54.05
Fair 7 183,831 3.82 4 224,317 4.15
Marginal 2 130,792 2.72 2 67,364 1.25
Unsatisfactory 2 15,445 0.32 1 5,114 0.09
Total* 39 4,809,410 100.0 39 5,405,746 100.0Overall Rating Satisfactory Satisfactory* Charterhouse Bank Ltd and Chase Bank Ltd In Liquidation and Imperial Bank Ltd In Receivership have been excluded in the 2020
statistics.
Source: CBK
3.17 Compliance with Supervisory and Regulatory Requirements
During the year ended December 31, 2020, thirteen banks violated the Banking Act and CBK Prudential Guidelines compared to twelve banks in the previous year 2019. Most of the violations were in respect to breach of single obligor limits mainly due to a decline in core capital in some banks that have continued to report losses.
The specific incidences of non-compliance noted during the year ended December 31, 2020 were as follows:
i. Single Obligor Limit
Nine banks violated Section 10 (1) of the Banking Act as they exceeded the single obligor limit of 25 percent of core capital.
ii. Prohibited Business
• Five banks violated Section 12 (C) of the Banking
Act and CBK Prudential Guideline on Prohibited Business (CBK/PG/07) which restricts investment in land and buildings to 20 percent of core capital.
• Five institutions violated CBK/PG/07 on Prohibited Business that restricts aggregate large exposures to not more than 5 times of the Core Capital.
iii. Capital Adequacy Requirements
• Three commercial banks violated Section 7(1) of the Banking Act due to failure to maintain the minimum core capital required of Ksh.1 billion.
• Six banks violated Section 18 of the Banking Act and CBK Prudential Guideline on Capital Adequacy, CBK/PG/03, Clause 4.1.2 due to their failure to meet the minimum statutory required ratio for total capital to total risk-weighted assets of 14.5 percent. Five banks failed to meet the statutory minimum required ratio for core capital to total risk-weighted assets of 10.5 percent. While five banks failed to meet the statutory minimum required ratio for core capital to deposit ratio of 8 percent.

C E N T R A L B A N K O F K E N Y ABANK SUPERVISION ANNUAL REPORT 2020
47
MACROECONOMIC CONDITIONS AND BANKING SECTOR PERFORMANCE
iv. Insider Lending
• Two banks violated Section 11(1) (f) of the Banking Act as they exceeded the single insider borrower limit of 20 percent of core capital.
• One bank violated Section 11(1) (g) of the Banking Act as it exceeded the total insider borrowing limit of 100 percent of core capital.
v. Foreign Exchange Exposure
Two banks violated the Central Bank of Kenya Prudential Guideline on Foreign Exchange Exposure (CBK/PG/06) that requires an institution to maintain foreign exchange exposure at not more than 10 percent of core capital.
vi. Liquidity Management
Two banks violated Section 19 (1) of the Banking Act due to failure to maintain the minimum statutory liquidity ratio of 20 percent.
vii. Financial Statement Reporting
One bank violated Section 22 of the Banking Act due to failure to display a copy of the latest audited balance sheet and profit and loss account in a conspicuous position in every office and at the branches. The same bank violated Section 23(1) of the Banking Act due to failure to submit audited balance sheet, profit and loss account and auditor’s report to the CBK within three months of the end of the financial year.
viii. In Duplum Rule
One bank violated Section 44A (1) of the Banking Act that restricts the amount of interest recoverable on non-performing loans and advances to the principal owing when the loan becomes non-performing.
ix. Corporate Governance Principles
• One bank violated the CBK Prudential Guideline on Corporate Governance, (CBK/PG/02), Clause 3.7.5, due to failure to ensure that the Chief Finance Officer is a member of the Institute of Certified Public Accountants of Kenya (ICPAK)
or an equivalent institute recognized by the East Africa Community member states, or an equivalent international institute recognized by ICPAK.
• One institution violated the CBK Prudential Guideline on Corporate Governance, Clause 3.3.3, due to failure to ensure that every board member attends at least 75 percent of the board meetings of an institution in any financial year.
• One bank violated CBK Prudential Guideline on Corporate Governance, Clause 3.2.2, due to failure to ensure that no Chief Executive Officer, Executive Director or Member of Management owns more than 5 percent of the institution’s shareholding.
Appropriate remedial actions were taken on the concerned institutions by the CBK in respect of the violations.
3.18 Performance of Microfinance Banks
The microfinance banks’ performance declined in the year ended December 31, 2020. As shown in Table 24, the sector reported a combined loss before tax of Ksh.2.2 billion as at December 31, 2020, compared to a loss of Ksh.339 million reported as at December 31, 2019. Four institutions reported profits, while the remaining ten institutions registered losses. The main contributors to the loss-making position were Kenya Women Microfinance Bank Plc. and Faulu Microfinance Bank Limited, which reported losses before tax of Ksh.1.5 billion and Ksh.476 million respectively.
The deterioration in performance of the sector was largely attributed to the effects of COVID-19 on the economy, leading to low uptake of credit, high level of NPLs and decrease in interest income. NPLs increased by 32 percent from Ksh.9.8 billion in 2019 to Ksh.13 billion while interest from the loan portfolio declined by 11 percent from Ksh.11.2 billion in 2019 to Ksh.9.9 billion. The sector’s provisions for loan impairment increased by 219 percent from Ksh.539 million in 2019 to Ksh.1.7 billion. In addition, the sector spent more to cover staff costs, administrative expenses and finance costs, accounting for 29 percent, 19 percent and 24 percent of

C E N T R A L B A N K O F K E N Y ABANK SUPERVISION ANNUAL REPORT 2020
48
MACROECONOMIC CONDITIONS AND BANKING SECTOR PERFORMANCE
total expenses respectively. Consequently, the sector reported a decline in return on assets and equity ratios to stand at negative 3 percent and negative 28 percent. The return on assets and equity ratio as at December 31, 2019 was negative 0.4 percent and negative 3 percent respectively.
Customer deposits increased by 12 percent, from Ksh.43.9 billion in 2019 to Ksh.49.3 billion. The growth in deposits was as a result of increased usage of alternative delivery channels and customers’ choice of deposits as a savings method. Net loans decreased by 5 percent from Ksh.46.7 billion in 2019 to Ksh.44.2 billion. The decline was attributed to low demand for credit due to COVID-19.
Table 24: Performance of MFBs - Ksh. ‘M’Parameter 2019 2020 % ChangePre-Tax Profits (339) (2,240) 561
Customer Deposits 43,941 49,356 12
Loan Portfolio (Net) 46,652 44,179 (5)
Core Capital/Total Risk Weighted Assets (%) 15 10 (34)
Total Capital/Total Risk Weighted Assets (%) 18 13 (29)
Return on Assets (%) (0.4) (3) 650
Return on Shareholder’s funds (%) (3) (28) 833
Number of Branches 124 120 (3)Source: CBK
The sector’s capital levels declined in 2020 as a result of cumulative losses reported by the sector, coupled by increased provisioning occasioned by the effects of COVID-19 on businesses that led to increased default on loan repayments. As a result, the ratio of core capital to total risk weighted assets deteriorated from 15 percent in December 2019 to 10 percent in December 2020 while the ratio of total capital to total risk weighted assets declined from 18 percent as at December 31, 2019 to 13 percent during the same period. While the sectors’ capital ratios were within the minimum requirement of 10 percent and 12 percent respectively, 5 institutions were non-compliant, as shown in Appendix XII.
The sector’s liquidity ratio stood at 37 percent as at December 31, 2020. Two institutions were non-compliant with the statutory minimum liquidity ratio of 20 percent.
The microfinance sector’s branch network declined in the year under review, with the number of branches standing at 120. Kenya Women MFB closed four (4) branches during the period under review. The sector established two marketing offices and closed 32 marketing offices during the period under review, bringing down the total marketing offices from 119 in 2019 to 89 in 2020. Similarly, the sector engaged 128 new specific third-party agents and closed
1,300 agents, leading to a decline of agents from 2,447 in 2019 to 1,275 in December 2020.
3.19 Agency Banking
The delivery of financial services through the agent banking model decreased in 2020. During the year, 21 commercial banks and 5 microfinance banks (MFBs) had contracted 72,617 and 1,275 bank agents, respectively. As at December 2019, commercial banks recorded 67,314 bank agents, while MFBs agents were 2,447. The change was an increase of 5,303 commercial bank agents (7.9 percent) and a decrease of 1,172 MFB agents (91.9 percent).
The increase in the number of agents in banks is attributed to the growing confidence, the need for banks to decongest banking halls and the acceptability of the agency banking model by financial institutions and the general public. This is illustrated by an additional one commercial bank that rolled out the agency banking model during the year and the continued recruitment of specific agents by commercial banks (jointly recruited over 10,000 specific agents). Despite the increase in the number of agents, some commercial banks’ agents closed their businesses, necessitated by the business slowdown in 2020 as a result of COVID-19, and low income earned by the agents rendering the agents inactive.
Over 90 percent of the approved bank agents were concentrated in 3 banks with the largest physical branch presence namely; Equity Bank with 39,951 agents, The Cooperative Bank

C E N T R A L B A N K O F K E N Y ABANK SUPERVISION ANNUAL REPORT 2020
49
MACROECONOMIC CONDITIONS AND BANKING SECTOR PERFORMANCE
Limited with 14,583 agents and KCB Bank Kenya Limited with 12,724 agents. On the other hand, for the MFBs, over 90 percent of the agents were contracted by the two largest MFBs – Kenya Women Microfinance Bank Limited (630 agents) and Faulu Microfinance Bank Limited (479 agents).
3.19.1 Number of Transactions
The number of banking transactions undertaken through bank agents decreased by 30.2 percent from approximately 162.9 million transactions recorded in 2019 to 118.8 million transactions in December 2020, mainly due to the increased use of mobile phone banking. A summary is provided in Table 25(a).
Table 25(a): Agency Banking Data for Banks- No. of Transactions Type of Transactions Number of Transactions 2019 2020 % Change Cumulative
(2010-2020)Cash Deposits 82,528,474 55,003,720 -33.4 443,653,280Cash Withdrawals 46,535,842 33,812,403 -27.3 292,540,133Payment of Bills 2,367,534 2,616,284 10.5 11,358,365Payment of Retirement and Social Benefits 1,391,128 1,810,169 30.1 11,077,823Transfer of Funds 16,388 12,833 -21.7 210,934Account balance enquiries 29,304,050 23,571,720 -19.6 136,975,510Mini statement requests 789,500 1,802,733 128.3 3,462,091Collection of loan applications forms - 56,395 100 62,743Collection of account opening application forms 36,237 19,354 -46.6 1,780,915Collection of debit and credit card application forms - 1,812 100 119,876 Collection of debit and credit cards - - - 60,580 Others - 67,860 100 669,302 Total 162,969,153 118,775,283 -30.2 894,940,147 Number of Agents 67,314 72,617 7.9 Source: CBK
The decrease in total transactions was mainly as a result of decreases in transactions relating to cash deposits, cash withdrawals, transfer of funds, account balances inquiry and collection of account opening application forms which recorded a decline by 33.4 percent, 27.3 percent, 21.7 percent, 19.6 percent and 46,6 percent, respectively (Table 25(b)). The decline in numbers relating to these transactions was attributed to the surge in the use of mobile phone banking in 2020 accelerated by the COVID-19 pandemic.
Table 25(b): Agency Banking Data for Banks- Value of Transactions (Ksh.‘M’)Type of Transactions 2019 2020 % Change Cumulative (2010 to
2020)Cash Deposits 897,903.1 814,732.9 -9.3 4,750,720.6Cash Withdrawals 293,152.2 236,767.0 -19.2 1,598,768.6Payment of Bills 15,547.6 12,280.7 -21.0 72,619.6Payment of Retirement and Social Benefits 13,179.8 9,280.9 -29.6 61,604.7Transfer of Funds 435.7 806.1 85.0 3,193.6 Total 1,220,218.4 1,073,867.6 -12.0 6,486,907.1Source: CBK

C E N T R A L B A N K O F K E N Y ABANK SUPERVISION ANNUAL REPORT 2020
50
MACROECONOMIC CONDITIONS AND BANKING SECTOR PERFORMANCE
In 2020, the value of banking transactions undertaken through agents decreased from Ksh.1.22 trillion (USD12.0 billion) in December 2019 to Ksh.1.07 trillion (USD 9.8 billion) in December 2020. The decrease was attributed to a slowdown in businesses due to the adverse effects of COVID 19 in 2020. This was further enhanced by the COVID-19 mitigation measures taken on March 18, 2020, where banks were to waive all charges for balance enquiries using digital platforms and waive all charges for transfers between mobile money wallets and banks accounts. This led to an increase in the use of mobile phone banking.
3.20 Credit Reference Bureaus
Over the past ten years of operation, the Credit Information Sharing (CIS) mechanism has expanded in scope, both in terms of participants and the range of information shared. To further strengthen the CIS mechanism, the Banking Credit Reference Bureau (CRB) Regulations, 2020 were gazetted on April 8, 2020. The key reforms introduced by CRB Regulations, 2020 include:
• A minimum threshold of Ksh.1,000 for negative credit information submitted to CRBs by lenders.
• First-time certificates to be provided by CRBs at no charge.
• Savings and Credit Cooperatives Societies (SACCOs) regulated by Sacco Societies Regulatory Authority (SASRA) were incorporated as authorized subscribers of data to CRBs.
Other developments during the year include:
• The withdrawal of approvals granted to unregulated digital (mobile-based) and credit-only lenders in April 2020 as third-party credit information providers to CRBs. The prohibition was in response to numerous public complaints about misuse of the CIS by the unregulated digital and credit-only lenders, particularly their poor responsiveness to customer complaints.
• The suspension of negative listing of borrowers for six months to cushion borrowers from the impact
of COVID-19. The suspension applied to borrowers whose loans were performing previously but had become non-performing from April 1, 2020. The six-month suspension ended on September 30, 2020, following which existing procedures for risk classification of loans concerning their performance and subsequent listing with CRBs resumed. Consequently, borrowers whose loans were performing before April 1 and subsequently went into arrears, had three months (up to the end of December 2020) per existing procedures to regularize their loans before they were listed with CRBs.
Despite the challenging business environment due to COVID-19, there was a noted growth in the number of credit reports requested by both individuals and subscribing institutions (commercial banks and microfinance banks) in 2020. The number of credit reports requested by subscribing institutions increased by 19 percent from 26.8 Million reports in 2019 to 31.9 Million reports in 2020. Similarly, the requests for credit reports by individual customers increased by 34 percent from 661,891 reports in 2019 to 889,490 reports in 2020. The increase is a testament to the integral role played by the CIS mechanism in the credit market and the increase in general awareness of the CIS mechanism by the populace. Table 26 shows the growth of credit reports accessed from the CRBs since the inception of the CIS mechanism in July 2010:

C E N T R A L B A N K O F K E N Y ABANK SUPERVISION ANNUAL REPORT 2020
51
MACROECONOMIC CONDITIONS AND BANKING SECTOR PERFORMANCE
Table 26: Number of credit reports requested since August 2010
Period Banks* % Change Individual Customers
% Change
August - December 2010 284,722 - 434 -
January - December 2011 1,021,717 259 5,607 1,192
January - December 2012 1,015,327 -1 22,692 305
January - December 2013 1,275,522 26 26,361 16
January - December 2014 1,674,707 31 33,442 27
January - December 2015 5,966,729 256 75,078 125
January - December 2016 4,938,224 -17 84,412 12
January - December 2017 4,381,442 -11 131,587 56
January - December 2018 12,404,219 183 149,558 14
January - December 2019 26,822,614 116 661,891 343
January - December 2020 31,882,336 19 888,647 34
Total 91,667,559 2,079,709
*Commercial and Microfinance banks
Source: CBK
On a month-to-month basis, the number of credit reports requested during the year declined between April and August 2020 as disclosed in Chart 10.
Chart 10: Monthly credit report requests by banks CRBs in 2020
3.21 Money Remittance Providers (MRPs)
The issuance of the Money Remittance Regulations, 2013 paved the way for the licensing and supervision of MRPs in Kenya. MRPs are licensed by CBK to facilitate the remittance of funds from one country to another, usually conducted through a partnership with authorized money remittance providers based in other countries. As at December 31, 2020, there were a total of seventeen (17) licensed MRPs as compared to nineteen (19) licensed MRPs in 2019. The number of MRPs declined following the closure of two (2) institutions that faced operational challenges in the year. The licensed MRPs had a total of 41 outlets, out of which 33 are located in Nairobi and 4 each in Mombasa and Garissa. Also, the MRPs have engaged 47 agents that are distributed across the country as shown in Table 27.
As at December 31, 2020, CBK had approved a total of 1,994 third-party data providers compared to 2,618 data sources approved as at December 31, 2019. The decline in numbers follows CBK withdrawal on April 14, 2020 of 491 approvals granted to unregulated digital (mobile-based) and credit-only lenders as third-party credit information providers to CRBs. Further, CBK had approved a total of 262 specific third-party agents for one CRB as at December 31, 2020. Bureaus are permitted to contract third-party agents with CBK approval to provide certain services including delivery of credit reports and receiving and channelling of customer complaints.

C E N T R A L B A N K O F K E N Y ABANK SUPERVISION ANNUAL REPORT 2020
52
MACROECONOMIC CONDITIONS AND BANKING SECTOR PERFORMANCE
Table 27: Distribution of outlets and agents of MRPsNo. City/Town Outlets Agents
Number Percentage Number Percentage1 Nairobi 33 80 19 40.3
2 Mombasa 4 10 2 4.3
3 Dadaab 4 8.5
4 Nakuru 2 4.3
5 Eldoret 2 4.3
6 Garissa 4 10 2 4.3
7 Kitale 1 2.1
8 Kajiado 1 2.1
9 Kakuma 1 2.1
10 Moyale 2 4.3
11 Mandera 2 4.3
12 Wajir 1 2.1
13 Isiolo 2 4.3
14 Malindi 1 2.1
15 Namanga 2 4.3
16 Kisumu 1 2.1
17 Malaba 1 2.1
18 Busia 1 2.1
Total 41 100 47 100.0Source: CBK
There was a decline in the number of outlets and agents from 46 outlets and 52 agents in 2019 to 41 outlets and 47 agents respectively in 2020, following closure of two MRPs in 2020 which had a total of 5 outlets and 6 agents. In addition, one agent was opened in the year 2020.
Remittance inflows continue to be a major source of foreign exchange to the country’s economy. Remittance inflows processed through MRPs during the year 2020 amounted to Ksh.149 billion, having increased by 77 percent from Ksh.84 billion in the year 2019 despite the adverse economic impact of the COVID-19 pandemic. The total remittance outflows during the year amounted to Ksh.61 billion increasing by 11 percent from Ksh.55 billion in the year 2019 as shown in Table 28.

C E N T R A L B A N K O F K E N Y ABANK SUPERVISION ANNUAL REPORT 2020
53
MACROECONOMIC CONDITIONS AND BANKING SECTOR PERFORMANCE
Table 28: Total remittance inflows and outflows of MRPs in 2019 and 2020 in Ksh.”000”
Month2019 2020
Inflows Outflows Inflows OutflowsJanuary 6,278,478 6,375,920 9,830,679 4,839,472
February 5,329,420 5,244,304 7,772,509 4,093,252
March 5,918,512 5,587,025 8,053,274 4,602,182
April 6,296,274 6,062,241 8,553,088 4,657,321
May 6,689,422 4,680,258 9,513,140 4,920,314
June 5,458,027 3,565,864 12,801,851 4,928,165
July 7,946,229 4,659,407 15,959,952 5,367,620
August 7,481,946 4,889,738 15,817,444 5,445,440
September 7,209,676 4,079,591 15,940,096 5,421,962
October 8,457,342 4,580,766 16,199,432 5,659,096
November 8,129,812 2,932,397 13,911,028 4,781,943
December 9,120,905 2,199,426 14,951,518 5,824,682
Total 84,316,042 54,856,937 149,304,011 60,541,449Source: CBK
The significant growth in remittances during the COVID-19 pandemic period is mainly attributed to the fact that most of the MRPs in the country have adopted digital remittance platforms that enable individuals to send and receive remittances through their mobile phones.

C E N T R A L B A N K O F K E N Y ABANK SUPERVISION ANNUAL REPORT 2020
54
DEVELOPMENTS IN SUPERVISORY FRAMEWORK
DEVELOPMENTS IN THE SUPERVISORY FRAMEWORK
CHAPTER 4
C E N T R A L B A N K O F K E N Y ABANK SUPERVISION ANNUAL 2020
54

C E N T R A L B A N K O F K E N Y ABANK SUPERVISION ANNUAL REPORT 2020
55
DEVELOPMENTS IN THE SUPERVISORY FRAMEWORK
4.1. Introduction
In the wake of the COVID-19 pandemic, CBK undertook several initiatives geared towards ensuring a resilient banking sector. These initiatives included:
(a) Following the outbreak of the COVID-19 pandemic, CBK issued Banking Circular Number 2 of 2020 on March 25, 2020 advising institutions to activate their precautionary measures and update their business continuity plans (BCPs). This was to ensure continuity of operations while mitigating the pandemic risk.
(a) On March 27, 2020, CBK issued Banking Circular Number 3 of 2020 to provide clarity to banks on loan classification, provisioning and restructuring following the COVID-19 pandemic. Institutions were required to work with their customers to alleviate the adverse effects of the pandemic while safeguarding the soundness of the banking sector.
(a) Banking Circular Number 4 of 2020 issued on March 27, 2020 communicated to institutions, the Monetary Policy Committee’s review of the Cash Reserve Ratio to 4.25 percent from 5.25 percent. The review of the CRR was expected to release Ksh.35.2 billion directly to banks as additional liquidity to support borrowers adversely affected by the COVID-19 pandemic.
(a) On March 27, 2020, CBK vide Banking Circular Number 5 of 2020 issued to institutions, the Guidance Note on Pandemic Planning for the Banking Sector. The Guidance Note provides minimum standards for institutions to ensure that they have resilient frameworks to effectively address emerging pandemic risks in the banking sector.
(a) Banking Circular Number 11 of 2020 issued to institutions on August 14, 2020, required institutions to re-submit by October 31, 2020 their Internal Capital Adequacy Assessment Process (ICAAP) documents for 2020. The re-submitted ICAAP documents considered the impact of the COVID-19 pandemic and mitigating measures taken by the institution, measures taken and proposed to strengthen the balance sheet and maintain adequate capital and liquidity, and any
proposed distribution of 2020 profits. Banks were also required not to make any decisions on the distribution of their 2020 profits before discussing the re-submitted ICAAP documents for 2020 with CBK.
4.2. Proposed Amendments to the Central Bank of Kenya Act
The Central Bank of Kenya (Amendment) Bill, 2020 proposed to amend the Central Bank of Kenya Act and put in place a legal and regulatory framework to govern unregulated digital lenders. The amendment will empower CBK to regulate and supervise the conduct of unregulated digital money lenders. The Bill is currently before the National Assembly for consideration.
4.3 Host Country Assessments
In March 2015, as part of the implementation of Risk Based Supervision Framework on Consolidated Supervision, CBK in partnership with IMF’s East AFRITAC developed a structured approach for the assessment of the quality of supervision undertaken by host countries where Kenyan banks have establishments. Assessment on the quality of host country supervision is required under Basel Core Principle 19(BCP) 12, on consolidated supervision.
The host country assessments entail review of the legal and regulatory frameworks, and supervisory practices of the host countries. The assessments assist CBK to; identify vulnerabilities in banking groups with cross border establishments, which is key in the development of effective supervision strategies for the banking groups. Assessments also assist CBK to develop structured supervisory mechanisms to assess the quality of host country supervision practices, legal and bank’s resolution frameworks.
Currently, Kenyan banking groups have establishments in seven foreign jurisdictions, both in EAC and beyond. Five out of the seven jurisdictions where Kenyan 19These are the minimum global standards for the sound
prudential regulation and supervision of banks issued by the Basel Committee on Bank Supervision.

C E N T R A L B A N K O F K E N Y ABANK SUPERVISION ANNUAL REPORT 2020
56
DEVELOPMENTS IN THE SUPERVISORY FRAMEWORK
banks have establishments belong to the East Africa Community. Since the assessment criterion was developed in 2015, BSD has conducted assessments in all the seven (7) jurisdictions. The assessments revealed that, amongst the seven jurisdictions, the supervisory practices, legal and regulatory frameworks in four (4) jurisdictions were largely adequate and could be relied upon by CBK in the supervision of the hosted subsidiaries. Although, gaps were identified in the legal and supervisory frameworks of two (2) jurisdictions, it was observed that considerable efforts were being undertaken by the host countries to improve the quality of their frameworks. Further, the assessments established that in one (1) jurisdiction, the legal and supervisory framework was inadequate. Therefore, CBK will continue monitoring developments in the legal and supervisory framework in this jurisdiction and undertake another assessment going forward.
In 2020, BSD continued to monitor developments in the legal and regulatory frameworks and supervisory practices in the seven jurisdictions, of which assessments had been conducted. This was necessitated by the external shocks brought about by the slowdown in economic activities in most of the countries as a result of the COVID- 19 pandemic. For the East Africa Community members, it was observed that Central Banks have strived to implement most of the aspects of the convergence criteria agreed amongst them to harmonize banking legal, regulatory and supervisory rules and practices in the region. It is expected that full harmonization of the legal, regulatory and supervisory rules and practices will strengthen supervisory standards for subsidiaries of Kenyan banks in the region.
In totality, it was noted that there were no significant changes in the legal and regulatory regimes and supervisory practices in all jurisdictions where Kenyan banks have establishments, which adversely affect hosted subsidiaries of Kenyan banks.
4.4 D e v e l o p m e n t s i n A n t i - M o n e y Laundering and Combating Financing of Terrorism
National Risk Assessment
As the global standard setter, the Financial Action Task Force (FATF) requires all countries to identify, assess and understand the money laundering (ML) and terrorist financing (TF) risks for its country and to develop a risk-based approach (RBA) in addressing the identified ML/TF risks. FATF could impose counter measures against a country for failing to undertake the national risk assessment. This could include issuing a public statement on the country’s lack of adherence to international AML/CFT standards and eventual blacklisting.
Through a gazette notice issued in March 2019, CBK among other ministries, departments and agencies was appointed as a member to the Task Force on National Risk Assessment on ML and TF. CBK also forms part of the joint Secretariat to the Taskforce. Only a few of the NRA activities were achieved in the year 2019 hence the extension for the taskforce existence to December 2020 through another gazette notice issued in March 2020. The activities that took place in 2020 include:
• Sensitization workshops for stakeholders. • Preparation and dissemination of questionnaires
to stakeholders to collect data. • Data collection where the stakeholders submitted
their responses. • Stakeholder interview workshops held on
November 2 – 13, 2020 to collect views on ML/TF situation in the country.
• Analysis of qualitative data collected through questionnaires at workshops held on November 30 – December 11, 2020.
• Preparation of working group reports retreat held on December 14–18, 2020.
The stakeholders participating in the NRA exercise were drawn from both public and private sectors.
It is anticipated that the NRA exercise will be completed in 2021.

C E N T R A L B A N K O F K E N Y ABANK SUPERVISION ANNUAL REPORT 2020
57
DEVELOPMENTS IN THE SUPERVISORY FRAMEWORK
4.5 International Financial Reporting Standards (IFRS)
4.5.1 Application of IFRS 9 during COVID-19 Pandemic
The year 2020 marked the third year since the commencement of implementation of IFRS 9 on Financial Instruments. IFRS 9 replaced International Accounting Standard (IAS) 39 with regard to the methodology used to compute impairment provisions on financial instruments. IFRS 9 introduced the Expected Credit Loss (ECL) model that replaced the Incurred Credit Loss (ICL) under IAS 39. The IFRS 9’s ECL model requires banks to make provisions for both performing and non-performing loans, which translates to higher provisions compared to IAS 39 ICL model and thus a higher impact on banks’ regulatory capital. In order to mitigate the impact of IFRS 9 on banks’ capital, CBK issued a Guidance Note in April 2018 to the banking sector on the computation of regulatory capital. For purposes of computing capital requirements, banks were allowed to add back IFRS 9 provisions relating to performing facilities/loans outstanding as at December 31, 2017 and those issued in 2018 over a 5-year transition period. The transition period was to enable banks to build-up capital gradually. As a result, IFRS 9 provisions added back to regulatory capital stood at Ksh.22.5 billion in 2018, Ksh.17.3 billion in 2019 and Ksh.1.8 billion in 2020.
In view of the unprecedented impact of COVID-19 pandemic, CBK issued a Banking Circular (CBK’s Circular) to banks in March 2020 providing guidance and clarification on the relief granted to borrowers with regard to loans classification and provisioning of extended and restructured loans. The one-year relief granted under the emergency only applied to borrowers who had made requests to banks and their repayments were up to date as at March 2, 2020 and classified under normal category in accordance with the CBK Prudential Guideline on Assets, Provisioning and Limitation of Interest Recoverable on Non-Performing Loans (CBK/PG/04). Banks were to undertake assessment and restructure the loans based on the
respective circumstances arising from the pandemic and borrower’s capacity to pay under the proposed new terms.
On March 27, 2020, the International Accounting Standards Board (IASB) issued a statement on IFRS 9 and COVID-19. IASB clarified that: -
• the extension of payment holidays to all borrowers in particular classes of financial instruments should not automatically result in all those instruments being considered to have suffered a Significant Increase in Credit Risk (SICR).
• the assessment of SICRs and the measurement of ECLs are required to be based on reasonable and supportable information that is available to an entity without undue cost or effort.
• in assessing forecast conditions, consideration should be given both to the effects of COVID-19 and the significant support measures undertaken by governments.
• IFRS 9 should not be applied mechanistically, in estimating ECLs, particularly during COVID-19 pandemic.
• It had closely engaged with many prudential and securities regulators regarding the application of IFRS 9 in the context of the COVID-19 pandemic and encouraged entities whose regulators had issued guidance to consider it.
In June 2020, the Institute of the Certified Public Accountants of Kenya (ICPAK) issued a statement on the application of IFRS 9 in the COVID-19 pandemic environment. ICPAK observed that the COVID-19 environment was inherently uncertain, the availability of reliable forward-looking information was expected to become increasingly available as time and experience progresses. Institutions were therefore urged to make use of such information but could also consider historical information, and in particular past due information, in determining whether there had been a SICR in circumstances where reasonable and supportable forward-looking information was not available. Given the uncertainty, and where banks foresaw a lack of availability of reasonable and

C E N T R A L B A N K O F K E N Y ABANK SUPERVISION ANNUAL REPORT 2020
58
DEVELOPMENTS IN THE SUPERVISORY FRAMEWORK
supportable forward-looking information, they could assign a greater probability to the overall longer-term prospects of default by the borrower, particularly for instruments with longer expected lives. ICPAK further observed that CBK’s Circular required banks to: -
• exercise judgement in implementing IFRS 9 with regard to restructured loans considering the dynamic COVID-19 environment.
• carefully assess the relief measures in the Circular to determine their impact on the credit risk. As restructured facilities do not automatically imply that there is increase in credit risk.
• provide adequate disclosures including the impact of COVID-19 emergency/relief measures on the application of IFRS 9.
4.5.2 Impact of COVID-19 on implementation of IFRS 16
IFRS 16 on Leases came into effect on January 1, 2019. Under IFRS 16, a lessee (user of asset) is required to recognize a right of use asset representing its right to use the underlying leased asset and a lease liability representing obligation to make lease payments. Due to the COVID-19 pandemic, a number of lease modifications have occurred in the lease arrangements. These modifications include; lessors (owner of asset) providing rent concessions, adding or terminating the right to use (ROU) underlying assets and extending or shortening the contractual lease term.
In May 2020, IASB issued COVID-19-Related Rent Concessions20 (Amendment to IFRS 16). The amendment provides relief to lessees in accounting for rent concessions occurring as a direct consequence of COVID-19. The relief permits a lessee to elect not to assess whether a COVID-19-related rent concession is a lease modification.
20The rent concessions could be in various forms and may include one-off rent reductions, rent waivers or deferrals of lease payments.
Some commercial banks were granted rent concessions by the lessors due to COVID-19. These concessions mostly consisted of rent reduction. However, these concessions do not qualify as lease modification under IFRS 16 as the concessions period was short. Therefore, the rent concessions as a result of COVID-19 did not yield a significant impact on the ROU, lease liabilities, depreciation and the finance charge associated with the lease liability.
4.6 Developments in Digital Lending/Credit
Digital credit in Kenya has become a tool for households and small businesses to supplement their day-to-day expenses. Digital credit has acquired heightened significance during the COVID-19 crisis which strained most sources of income for the low- and middle-class populace. High mobile phone penetration, the adoption of mobile phone based financial services, and the ease and convenience of access to digital lending platforms, have catapulted the growth of digital lending in Kenya over the last few years. Changes in consumer behaviour, especially in the wake of the COVID-19 pandemic, has also boosted activity in the digital lending space. The Digital Credit space comprises of:
• Digital lending regulated by the CBK.• Unregulated digital lending, which in recent years
has experienced notable growth in activity and use21.
Several key concerns have been raised regarding unregulated digital lending:
• High indebtedness of borrowers, given the ease with which they can switch between platforms without settling their previous debts.
• Lack of consumer protection safeguards: This includes not giving customers the full terms and conditions for use of the platforms before on-boarding – especially regarding pricing, and aggressive debt collection by the unregulated credit providers
21FinAccess 2019 indicated that usage of unregulated digital credit had grown from 0.6 percent (200,000) of Kenya’s adult population in 2016 to 8.3 percent (Approximately two million people) in 2019.

C E N T R A L B A N K O F K E N Y ABANK SUPERVISION ANNUAL REPORT 2020
59
DEVELOPMENTS IN THE SUPERVISORY FRAMEWORK
• Financial integrity concerns relating to Anti-Money Laundering (AML)/Combatting the Financing of Terrorism (CFT)
• Misuse of Credit Reference Bureau (CRB) reporting for blackmailing borrowers
In this regard, the CBK (Amendment) Bill, 2021 is under consideration by the National Assembly. The Bill seeks to empower CBK to regulate and supervise the conduct of unregulated lenders. The enactment of the Bill will lead to a robust credit market that provides choice and in which consumers are protected through:
• Fairness and transparency in pricing.• Complaints resolution.• Consumer Data protection.

C E N T R A L B A N K O F K E N Y ABANK SUPERVISION ANNUAL REPORT 2020
60
REGIONAL AND INTERNATIONAL DEVELOPMENTS AND INITIATIVES
REGIONAL AND INTERNATIONAL DEVELOPMENTS AND INITIATIVES
C E N T R A L B A N K O F K E N Y ABANK SUPERVISION ANNUAL 2020
60
CHAPTER 5

C E N T R A L B A N K O F K E N Y ABANK SUPERVISION ANNUAL REPORT 2020
61
5.1 Introduction
In 2020, CBK participated in several regional and global initiatives that fall within its supervisory mandate. CBK participates in these initiatives either by its membership in regional/global forums or by invitation. These engagements enable CBK to keep abreast with developments in the regional and international regulatory environment, broaden exposure to international developments, and provide capacity-enhancement opportunities to CBK staff.
CBK mainly hosted and participated in meetings and training forums which were held virtually arising from the outbreak of the COVID-19 pandemic. In the regional and global arena, BSD participated in forums hosted by the International Institute of Finance (IIF), Financial Stability Board (FSB) in the Sub-Saharan Africa region and Financial Stability Institute (FSI). These forums discussed key issues affecting the global arena including sustainable finance, digital finance, innovation as well as the implications of the COVID-19 pandemic on financial stability. BSD also participated in meetings under the auspices of the Monetary Affairs Committee (MAC) whose aim was to promote convergence of supervisory frameworks as the East African Community region moves towards the establishment of the proposed East African Monetary Union. Bank Supervision Staff continued to equip themselves on regulatory and supervisory matters through the Financial Stability Institute’s (FSI) on-line learning tool, FSI Connect.
5.2 Regional and International Initiatives
Monetary Affairs Committee of the East African Community
The Monetary Affairs Committee (MAC) of the East African Community (EAC) is composed of the Governors of the Central Banks of the six EAC Partner States22. The main objective of MAC is to coordinate efforts by EAC Central Banks towards greater regional financial integration, stability and harmonization of financial systems. Ultimately, MAC aims at facilitating the establishment
22Kenya, Uganda, Tanzania, Rwanda, Burundi and South Sudan.
of the envisaged East African Monetary Union (EAMU). MAC initiatives focus on areas pertinent to financial stability, including bank supervision, and are implemented through committees composed of technical officials whose work is overseen by the Governors. In 2020, the Bank Supervision Department participated in various MAC activities, including the following:
• The virtual meeting of the MAC Macro-Prudential Analysis, Stress Testing and Statistics Working Group was held from October 12 – 15, 2020. The meeting assessed the progress on implementation of the Basel III and G20 recommendations by the Partner States Central Banks as well as conducted a regional risk assessment based on the updated EAC Dashboard to reflect the impact of the COVID-19 pandemic on the regional financial system. The participants also assessed the progress on network analysis framework for assessing Regional Systemically Important Banks.
• The virtual meeting of the MAC Working Group on Crisis Management hosted by CBK was held from October 12 – 15, 2020. The objectives of the Working Group meeting were for EAC Central Banks to make presentations on their existing national Crisis Management Frameworks to identify common areas and gaps, aimed at developing key elements for EAC Crisis Management Frameworks convergence criteria. Additionally, the Partner States’ provided status updates on the implementation of the Working Group Action Plan.
• The 24th Ordinary Meeting of MAC held virtually from October 19-23, 2020. The meeting reviewed the impact and threat of COVID-19 on regional economies, banks and banking systems. It also reviewed the progress on implementation of the decisions of the 23rd MAC meeting. During the meetings, the Partner States Central Banks identify emerging issues of interest to the region and assign one of the Central Banks to take the lead in suggesting the necessary policy interventions. To this end, CBK was requested to lead in the development of minimum standards
REGIONAL AND INTERNATIONAL DEVELOPMENTS AND INITIATIVES

C E N T R A L B A N K O F K E N Y ABANK SUPERVISION ANNUAL REPORT 2020
62
for supervision of Cyber Security in the EAC region. The developed standards were subjected to consultation and approved during the 24th Ordinary Meeting. Further, during the same meeting it was noted that cloud computing has increasingly gained significance across the EAC region as a mechanism for storage and management of customer data in the banking sector. In this regard, CBK was charged with the task of taking the lead in developing minimum standards for overseeing cloud computing in the EAC region.
East African Monetary Union (EAMU)
Efforts to implement the East African Monetary Union (EAMU) roadmap continued in 2020. Progress continued towards the attainment of the prerequisites stipulated under the EAMU Protocol, namely integration of regional financial systems and adoption of common frameworks for the regulation and supervision of the regional financial system. Efforts to harmonize monetary policy frameworks, exchange rate policies, supervisory rules and practices governing bank supervision, financial accounting principles, as well as payment systems, were carried on.
In 2020, engagements between EAMU partner states were conducted mostly virtually owing to the COVID-19 crisis that broke out in mid-March 2020, which restricted cross-border movement. All Monetary Affairs Committee (MAC) engagements held during the year, including meetings of technical sub-committees and working groups, as well as the 24th Ordinary Meeting of MAC, were conducted virtually. Negotiations carried on towards implementation of the agreed convergence criteria on supervisory rules and practices. The strides made so far in harmonizing regional supervisory frameworks were acknowledged but outstanding work was also highlighted.
At their virtual meeting held on October 23, 2020 at the start of the 24th Ordinary MAC Meeting, which was chaired by the National Bank of Rwanda, EAC Central Bank Governors noted the progress made towards
convergence and operationalization of EAMU. With the meeting being held against the backdrop of the COVID-19 crisis, the Governors shared and assessed policy measures implemented in the respective member jurisdictions to mitigate the adverse economic effects and financial disruptions arising from the pandemic.
The Governors noted that economic growth in the EAC region had been strong, supported by public investments in infrastructure and the enabling environment put in place by EAC Governments. However, the COVID-19 crisis had disrupted regional economic activity, forcing partner states to put in place containment measures to limit its spread including travel restrictions and lockdowns. This had led to a contraction in regional economic growth in the second half of 2020. Governors however expressed optimism that regional and global economic growth would recover in 2021 once current containment measures were eased.
Common Market for Eastern and Southern Africa (COMESA)
CBK was represented at a virtual symposium on The Potential of Establishing a Cross Border Retail Payments Scheme within the East African Community (EAC), the South African Development Community (SADC) and Common Market for East and Southern Africa (COMESA) regions in November 2020.
The Eastern and Southern Africa Anti-Money Laundering Group (ESAAMLG)
The Eastern and Southern Africa Anti-Money Laundering Group (ESAAMLG) is among the eight (8) regional Financial Action Taskforce Style Regional Bodies (FSRBs) that form part of the Financial Action Task Force’s (FATF) global network.
In 2020, the Bank Supervision Department being the host of the Secretariat to the National Taskforce on Anti-Money Laundering and Combating the Financing of Terrorism (NTF), continued to coordinate Kenya’s participation in ESAAMLG activities. The ESAAMLG Taskforce of Senior Officials held a combined 39th and 40th virtual meeting from November 24 to December 4, 2020. The Council of Ministers meeting was held on December 7, 2020.
REGIONAL AND INTERNATIONAL DEVELOPMENTS AND INITIATIVES

C E N T R A L B A N K O F K E N Y ABANK SUPERVISION ANNUAL REPORT 2020
63
Member countries were directed to adequately prepare for assessments and to provide all necessary support and assistance to the ESAAMLG Secretariat and the Assessors to enable the second-round mutual evaluations. Kenya is to be assessed in November 2021 under the revised program. A desktop review will therefore be carried out in June 2021.
A work programme of ESAAMLG Secretariat was developed for the 5th ESAAMLG Strategic Plan for 2020 – 2023. The strategic objectives are as follows:
• Sustaining effective Post Evaluation Implementation of AML/CFT measures in member countries under the first round of assessments.
• Sustaining the second round of assessments and monitoring of ESAAMLG members’ technical compliance with the FATF Recommendations and the Effectiveness of individual AML/CFT systems.
• Increase and sustain the knowledge of ML/TF trends and techniques in the region to effectively contribute to regional and international AML/CFT policy formulation.
• Complete the expansion of ESAAMLG membership and increase the visibility of ESAAMLG in the region.
• Promoting the implementation of risk-based AML/CFT measures which support the implementation of financial inclusion initiatives.
• Kenya’s Post Implementation Evaluation report that is used to gauge the effectiveness of the AML/CFT system in place was considered. Kenya is expected to make significant progress in designating advocates, notaries and other independent legal professionals as reporting institutions. Kenya had been scheduled to receive a High-Level Mission in March 2020 that did not take place due to the outbreak of the COVID-19 pandemic. The mission is expected to visit the country once the pandemic situation improves.
Alliance for Financial Inclusion (AFI)
Owned and powered by its members, the Alliance for Financial Inclusion (AFI) continues to live up to its vision, of making financial services more accessible to the world’s unbanked, for over a decade now. During this period, AFI has witnessed tremendous achievements including the growth of membership to 100-member institutions (84 Principal members and 16 Associate members) representing 88 countries. It has also facilitated the implementation of impactful policy changes by providing a platform for peer learning, knowledge sharing and peer transformation across its network.
AFI’s transformative journey has been successful so far due to the use of the collaborative model whose focus has been on two priority areas;
a. Country-led approaches: Under this approach, AFI members focus on ways to support countries to identify their unique needs and challenges and come up with customized high-impact solutions. Through this approach, member countries have been able to own and take pride in the process as more ambitious targets are set and achieved.
b. Peer-to-peer engagement: This approach promotes a culture of equal opportunities for members by allowing all members to share their experiences as well as learn from each other. The value of knowledge and experience is not judged by the size or wealth of any one institution.
CBK, being a member of AFI, since inception and later on a Principal member, continues to support AFI’s initiatives as well as participate in AFI activities such as working groups and other global initiatives. CBK also participates as a Board Member of the AFI Board of Directors.
a) The 12th AFI Global Policy Forum
AFI has over the years, since 2009, organized its annual flagship event, the Global Policy Forum (GPF), for its vibrant and growing global network. Being the most important and comprehensive forum within the AFI network, the GPF provides a platform for regulatory
REGIONAL AND INTERNATIONAL DEVELOPMENTS AND INITIATIVES

C E N T R A L B A N K O F K E N Y ABANK SUPERVISION ANNUAL REPORT 2020
64
institutions, other AFI members and stakeholders to share experiences, knowledge and initiatives. These discussions have made an impact in bringing financial services to the world’s 1.7 billion unbanked population. This has been supported by the creation of a supporting environment for financial inclusion policy initiatives as well as declarations geared towards financial inclusion.Each year, the GPF is co-hosted by a different member institution in a different region of the world. The last GPF was held in September 2019, in conjunction with National Bank of Rwanda. The 12th GPF was scheduled to take place from September 7-11, 2020 in the Dead Sea Region, in conjunction with the Central Bank of Jordan. However, due to the COVID-19 pandemic, the AFI Board of Directors agreed to postpone the event to 2021, on dates to be communicated in due course.
The AFI Annual General Meeting (AGM), which is held during the GPF was convened virtually on September 9, 2020 to facilitate decision-making by the AFI Membership Council on key strategic matters. Some of these matters included;
• Submission of the Annual Report and Audited Financial Report of AFI.
• The adoption of Financial Inclusion Policy Models.• Ratification of appointments to AFI’s Board
Committees for the term 2020-2022.
CBK participated in the AGM as a Principal member and member of the Board of Directors.
b) African Financial Inclusion Policy Initiative (AfPI)
Unveiled in May 2017 in Maputo, Mozambique, AfPI carries on the objectives of the African Mobile Phone Financial Services Policy Initiative (AMPI) which was launched in Zanzibar in February 2013. The main aim of AfPI is to provide a platform for AFI’s African members to support and develop financial inclusion policies, regulatory frameworks, and other knowledge products which are customized to their specific needs. It also coordinates regional capacity building and peer learning efforts. The key AfPI initiatives include; the Leaders Roundtable and an Expert Group on Financial Inclusion Policy (EGFIP).
The Leaders Roundtable brings together AfPI leaders and high-level policymakers and regulators to discuss policy issues and provide strategic guidance. The 8th Annual Roundtable of the Leaders of AfPI, a first of its kind, was convened virtually and co-hosted by Bank of Tanzania and AFI, on August 20, 2020. This event was attended by AfPI leaders from nearly 30 countries with the objective of discussing challenges faced across the continent and beyond with special attention given to enhancing enablers for accelerating financial inclusion. One of the topics discussed, was how to accelerate financial inclusion among disadvantaged groups such as women, youth, forcibly displaced persons and other disproportionately excluded communities.
The participants also examined the key aspects of two policy frameworks being developed by AfPI’s Expert Group on Financial Inclusion Policy. These are;
• The framework on Strengthening Agent Network for Digital Financial Services in Africa. This framework highlights key aspects that should be considered by the regulators and Digital Financial Services (DFS) providers in ensuring that agent networks are ably managed and do not create undue risk to the consumers. In addition, the framework is intended to ensure that financial integrity is not compromised, and that there are no disruptions in the DFS ecosystem.
• The framework on Enhancing MSME Financing Ecosystem in Africa. This framework is intended to;§Identify the best practices of MSME financing
policy.§Explore pathways and enabling factors of
implementable action plans.§Provide policy recommendations to financial
sector regulators with regard to access to finance for MSMEs in Africa.
In addition, discussions on AFI’s COVID-19 policy response support to members in the Africa region were held.
REGIONAL AND INTERNATIONAL DEVELOPMENTS AND INITIATIVES

C E N T R A L B A N K O F K E N Y ABANK SUPERVISION ANNUAL REPORT 2020
65
The EGFIP is a working group comprising of senior officials from AFI member institutions whose mandate is to undertake the technical implementation of AfPI activities. The team also assists in addressing pertinent regional and sub-regional challenges in enhancing financial inclusion in Africa through providing insights on policy and regulatory approaches. In 2020, EGFIP and AFI’s Eastern Europe and Central Asia Policy Initiative (ECAPI) held a joint virtual meeting from June 1-3, 2020. The meeting was co-hosted by AFI and the Central Bank of Armenia (CBA) with the objective of sharing key achievements and current challenges of member countries. In addition, the participants also explored peer learning opportunities to address specific challenges in responding to the COVID-19 pandemic.
Financial Stability Board’s Regional Consultative Group for Sub-Saharan Africa
In 2020, CBK continued participating in the activities of the Financial Stability Board (FSB) in the Sub-Saharan Africa region. The Bank was part of efforts to implement the FSB 2020 Workplan, which had the following areas of focus:
• Identification and assessment of new and emerging risks to global financial stability.
• Strengthening policy guidance on technological innovations in the financial sector to enhance oversight.
• Review of regulatory and supervisory approaches to global ‘stable coins’ and cross-border payment systems among member jurisdictions.
• Addressing new and emerging vulnerabilities in the financial system;
• Finalizing implementation and evaluating the effects of post-crisis regulatory reforms.
As part of its participation, CBK was represented at the FSB Regional Consultative Group meeting for Sub-Saharan Africa held virtually in December 2020 which discussed, among others, recent macroeconomic and financial market developments, including the medium- and long-term implications to regional financial stability arising from the COVID-19 pandemic. The meeting also
considered the importance of international cooperation in coordinating the policy responses to COVID-19, and ways in which members could contribute towards enhanced policy responses.
IMF’s East Africa Technical Assistance Centre (East-AFRITAC)
IMF’s East Africa Technical Assistance Centre (East-AFRITAC) East AFRITAC is a Technical Assistance (TA) arm of the International Monetary Fund (IMF). The TA arm of the IMF’s objective is to enhance financial sector capacity in seven Eastern Africa countries (Eritrea, Ethiopia, Kenya, Malawi, Rwanda, Tanzania and Uganda). In 2020, CBK benefited from East AFRITAC’s Technical Assistance (TA) and capacity building in various areas aimed at developing robust banking sector regulatory and supervisory frameworks. Due to the COVID-19 pandemic, the following TA missions/capacity building trainings were undertaken virtually by East AFRITAC.
• Six BSD officers attended training on the assessment of banks’ implementation of the International Financial Reporting Standard (IFRS) 9 on financial instruments on January 13-17, 2020.
• Five BSD officers attended training on the implementation of the Internal Liquidity Adequacy Assessment Process (ILAAP) by banks on January 20 – 24, 2020.
• Five BSD officers participated in an on-line roundtable discussion on Banking Regulation and Supervision during the COVID-19 Pandemic on July 2, 2020. The roundtable discussion was organized by the International Monetary Fund’s (IMF) East AFRITAC and the Monetary and Capital Markets (MCM) Department of the IMF. The roundtable brought together participants from Central Banks in the East African region and focused on the supervisory actions taken by banking regulators in the region to deal with the effects of COVID-19.
• Two (2) BSD officers participated in the IMF MCM/East AFRITAC Regional Financial Sector Virtual Seminar on Fintech, SupTech and RegTech, on October 26-27, 2020.
REGIONAL AND INTERNATIONAL DEVELOPMENTS AND INITIATIVES

C E N T R A L B A N K O F K E N Y ABANK SUPERVISION ANNUAL REPORT 2020
66
Part of CBK’s strategic objectives is to ensure that the skills of its staff are enhanced continuously. This is key as it will ensure that the staff are kept abreast with the changing times. In this regard, CBK and East AFRITAC have scheduled the following virtual training missions and workshops for 2021: -
a) Training on implementation of Basel III liquidity and capital ratios specifically Liquidity Coverage Ratio (LCR), Net Stable Funding Ratio (NSFR) and leverage ratio.
b) Capacity building of BSD staff on the adoption of regulatory and supervisory technologies. This will enhance BSD staff on the management of the ever-evolving digital financial services risks with the focus being cyber resilience.
c) Training on the development of Basel Core Principles (BCPs) EAC regional Peer Review Mechanism. This TA mission for EAC Central Banks will play a key role in developing and implementing a regional BCP Peer Review Mechanism. Currently, there is no framework in place for conducting a peer review of the EAC Central Banks’ self-assessment on compliance with BCPs. In this regard, TA from East AFRITAC will guide the design and development of the proposed framework. Further, it will provide insights on how the framework can be used as a tool for evaluating the individual EAC Central Banks’ self-assessments on compliance with BCPs during the peer reviews.
African Rural and Agricultural Credit Association (AFRACA)
The African Rural & Agricultural Credit Association (AFRACA) is a regional association of financial and non-financial institutions involved in promoting rural and agricultural finance in Africa. AFRACA has a network of over 110 members spread across Africa and is currently based at the Kenya School of Monetary Studies (KSMS). In spite of the COVID-19 pandemic, AFRACA managed to host some of their meetings virtually. This includes; The first virtual East Africa Sub-Regional Meeting which was held from June 2-4, 2020. the meeting’s objective was
to strengthen the AFRACA network for effective impact on rural and agribusiness financing. In addition, the meeting also focused on how AFRACA can support its members in making an impact on access to finance in rural areas, especially during the period of the COVID-19 pandemic.
Bank Supervision Application (BSA)
a) Background
Bank Supervision Application (BSA) software is a web-based software developed through a joint initiative of Eastern, Central and Sothern Africa central banks to support the automation of Banking Supervision functions. Currently, the BSA application is being used by 1723 (seventeen) central banks and one regulatory authority.
The BSA System is managed by Bank Supervision Application Support Office (BSO) domiciled at the Central Bank of Mozambique. BSO is responsible for the BSA development, maintenance and providing support to the BSA users.
BSO, as the lead developer of BSA together with central banks using BSA System have continued to improve the BSA software. The software has evolved from BSA Version 1.0 in 2003 to the current BSA Version 4.0 launched in 2018. BSO is currently in the process of developing BSA version 5.0, which is expected to be launched in 2022.
b) BSA Version 4.0
The current BSA Version 4.0 (BSAV.4.0) is composed of 4 modules:i) The Bank Supervision System (BSS) Module,
which facilitates workflow management.
23Banco de Cabo Verde, Banco de Moçambique, Bank of Na-mibia, Bank of Uganda, Bank of Zambia, Banque Centrale du Congo, Banque de la République du Burundi, Central Bank of Kenya, Central Bank of Lesotho, Central Bank of Eswa-tini, Reserve Bank of Malawi, Reserve Bank of Zimbabwe, National Bank of Ethiopia, Central Bank of the Republic of Madagascar, Central Bank of the Republic of Djibouti, Cen-tral Bank of the Democratic Republic of Timor-Leste , Central Bank of Haiti and Financial Services Regulatory Authority from Kingdom of Eswatini
REGIONAL AND INTERNATIONAL DEVELOPMENTS AND INITIATIVES

C E N T R A L B A N K O F K E N Y ABANK SUPERVISION ANNUAL REPORT 2020
67
ii) The Institution Information Submission System (IISS) Module, which facilitates online compilation and submission of returns to central banks by institutions licensed by central banks.
iii) The Risk Analysis Automation System (RAAS) Module enables automated financial analysis and processing of returns from financial institutions. This includes storage of returns and generation of customized reports.
iv) Customer Protection System (CPS) module, which enables customers of commercial banks to lodge complaints online to the central banks. The module aims to improve the quality of services and products offered to bank customers as well as contribute to financial inclusion.
c) BSA Governance
The functioning of the BSA System is governed by the BSA Stakeholders and the BSA Executive Committee. The BSA Stakeholders are the Bank Supervision and Information Technology Directors from fourteen BSA founding Central Banks. The BSA Executive is composed of four central banks elected on rational basis from among the BSA Stakeholders every three years. The BSA Stakeholders and the BSA Executive Committee are responsible for strategic management of all BSA related activities
d) BSA Activities in the year 2020
BSO organized a virtual BSA Executive Committee, on September 23 -24, 2020, and BSA Stakeholders meeting on September 30, 2020. The meetings reviewed and approved BSA Operational Plan for the year 2020/2021, ratified the Budget for 2020/2021 and approved the BSA Financial Audit Report for 2020.
BSO also organized a BSA v 4.0 virtual Users Training on December 30, 2020. The training focused on current functionalities of BSA v 4.0 and the BSA User requirements to be incorporated in the development of BSA v 5.0.
BSO launched the BSA software system at the Central Bank of Haiti in November 2020, which became the latest central bank to adopt the BSA Software.
e) BSA Version 5.0
BSO together with central banks using BSA software are currently developing BSA version 5.0. (BSA v 5.0). The BSA v 5.0 is being developed based on changing requirements of the BSA users.
BSA v 5.0 will introduce several innovations and enhancements in order to:• support supervisory activities in the data collection
and analysis of financial industry.• ensure that the regulated institutions comply with
regulatory standards, compliance and reporting requirements.
The release of BSA v 5.0 is scheduled for 2022.
International Institute of Finance
In January 2020, CBK marked five years since joining the International Institute of Finance (IIF) as an Associate Member in 2016. Over the previous four years, the Bank has benefitted from access to IIF’s wide research and publications that focus on a broad range of topical issues relevant to CBK’s regulatory mandate. In 2020, the Bank continued exploring options towards participation in IIF’s capacity-building programmes for the enhancement of staff skills and competencies.
In 2020, CBK was represented in the 2020 IIF Annual Membership Meeting held virtually from October 12-16, 2020. Discussions focused on themes pertinent to the global financial sector including sustainable finance, digital finance and innovation, and the outlook for the international financial sector in the wake of the COVID-19 pandemic.
Financial Stability Institute
CBK maintained its subscription to the Financial Stability Institute’s (FSI) on-line learning tool, FSI Connect. Under FSI Connect, staff can pursue on-line courses in various areas of financial regulation. The courses update users’ knowledge of both the theoretical and practical aspects of financial regulation for continued learning and capacity development.
REGIONAL AND INTERNATIONAL DEVELOPMENTS AND INITIATIVES

C E N T R A L B A N K O F K E N Y ABANK SUPERVISION ANNUAL REPORT 2020
68
• The utilisation of FSI Connect: In 2020, 80 members of BSD’s technical staff held user licences in FSI Connect and completed a wide range of tutorials covering various technical areas in financial services and regulation. 28 other staff members from the Banking and Payment Services (BPS) Department were also granted regular access to FSI Connect for the first time. 12 additional CBK staff benefitted from a complementary licence programme offered to subscribers by FSI from April to September 2020. The programme was part of FSI’s efforts to support member institutions by broadening e-learning capabilities in the wake of the disruptions caused by the COVID-19 pandemic. Under the programme, beneficiaries were granted complementary access to the FSI Connect learning platform for six months.
• BIS-IMF Supervisory and Regulatory Online Course (SROC) for Banking Supervisors: 5 members of BSD’s technical staff participated in this interactive on-line programme organised jointly between the Bank of International Settlements (BIS) and the International Monetary Fund from September 2020 through January 2021. The programme updated participants on the technical aspects of various relevant supervisory matters.
• FSI Survey on supervisory practices relating to correspondent banking activity: In January – March 2020, CBK participated in a survey conducted by FSI on supervisory practices relating to correspondent banking. The survey, which was part of FSI’s efforts to learn more on global correspondent banking activity and associated risks, sought to:
a) identify the range of supervisory practices relating to correspondent banking,
b) describe trends in supervisory practices, especially in light of recent guidance by the FATF and BCBS, and
c) identify areas where further reform could support both improved AML/CFT regimes and financial inclusion.
The findings will further inform FSB’s work and facilitate a better understanding of the current state of international correspondent banking activity.
Islamic Financial Services Board (IFSB)
CBK joined the Institute Financial Services Board (IFSB) in 2019 as an Associate Member. IFSB is an international standard-setting organization based in Kuala Lumpur, Malaysia for the Islamic financial services industry. It promotes the soundness and stability of the industry, by issuing global prudential standards and guiding principles for Islamic banking, Islamic capital markets and Takāful (Insurance) sectors. Over the previous two years, the Bank has benefitted from participating in surveys and conferences that focus on Islamic banking which is relevant to CBK’s regulatory mandate. The most recent survey CBK participated in, focused on Recovery and Resolution Planning for Institutions Offering Islamic Financial Services. The Conferences on the other hand emphasized FinTech, RegTech, and SupTech and their Implications on Regulation and Supervision as well as the development of strong regulations to support a robust regulatory regime for Islamic Banking.
In 2020, CBK intended to host a training course on Islamic Banking for BSD which was scheduled to be held from March 9 -12, 2020 at the Kenya School of Monetary Studies, Nairobi. The focus of the course was on the implementation of the IFSB Standards in the regulatory framework. However, due to the outbreak of the COVID-19 pandemic, the course was cancelled.
Knowledge Exchanges
CBK did not host delegations in 2020 for knowledge exchange visits due to the outbreak of the COVID-19 pandemic.
Memoranda of Understanding
To enhance its relationship with foreign banking regulators, CBK continued to explore the possibility of entering into formal arrangements for supervisory cooperation with other banking regulators. This was aimed at promoting cross border banking supervisory cooperation as recommended by the Basel Committee
REGIONAL AND INTERNATIONAL DEVELOPMENTS AND INITIATIVES

C E N T R A L B A N K O F K E N Y ABANK SUPERVISION ANNUAL REPORT 2020
69
on Banking Supervision. The MOUs with these regulators govern areas of cooperation and collaboration, help define and guide the working relationships between regulators and enable the smooth exchange of supervisory information.
CBK continues to establish contacts with more central banks from various countries to negotiate MOUs.
5.3 Kenyan Banks Regional FootprintCross border banking by some Kenyan banks has expanded in the East African Community (EAC) Partner States and the Democratic Republic of Congo (DRC). The banks include, KCB Group Holdings Plc, Diamond Trust Bank Group, NCBA Group Plc, Guaranty Trust Bank Kenya Limited, Equity Group Holdings Plc, I&M Holdings Plc, African Banking Corporation Limited and The Co-operative Bank of Kenya Limited. These banks have positioned themselves to capitalize on the growing cross
border trade flows. This has in turn not only contributed to the deepening of customer relationships, delivery of products and services but also utilization of host country resources, both capital and human that have positively impacted market development and social economics.
The year 2020 was challenging particularly due to the COVID-19 pandemic that affected global economic activities as well as cross border activities of these banks. However, as at December 31, 2020, the total number of branches of Kenyan banks subsidiaries in EAC Partner States and DRC grew by 8.5 percent from 316 branches recorded as at December 31, 2019 to 343 recorded as at December 31, 2020. The growth was mainly driven by Equity Group Holding Plc’s acquisition of Banque Commerciale du Congo in DRC. However, two banking groups, KCB Group Plc and Guarantee Trust Bank Kenya Limited, scaled down their branch network in the region. The regional presence is as illustrated in Table 29.
Table 29: Branches of Kenyan Banks Subsidiaries in the Region
Country Presence
KCB Group Plc
Equity Group Holdings Plc
Diamond Trust Bank Group
NCBA Group Plc
I&M Holdings Plc
Guaranty Trust Bank
Co-operative Bank
ABC Bank
Total
Tanzania 14 14 28 12 8 - - - 76
Uganda 13 43 36 5 - 8 - 3 108
Rwanda 13 14 - 3 14 14 - - 58
Burundi 6 - 4 - - - - - 10
South Sudan
12 5 - - - - 4 - 21
Democratic Republic of Congo
70 - - - - - - 70
Total 2020 58 146 68 20 22 22 4 3 343Total 2019 60 116 68 20 22 23 4 3 316Source: CBK
In addition to having presence within the EAC Partner States and DRC, some of the Kenyan banks such as I&M Holdings Plc and Prime Bank Limited have expanded beyond the EAC jurisdiction. I&M Holdings Plc has 50 percent shareholding in Bank One Limited in Mauritius, Prime Bank Limited has 11.24 percent shareholding of
First Merchant Bank Limited in Malawi and 10.96 percent shareholding of Capital Bank of Botswana. Equity Group PLC introduced cross border banking services to its customers enabling them to transact seamlessly across all countries it has presence.
REGIONAL AND INTERNATIONAL DEVELOPMENTS AND INITIATIVES

C E N T R A L B A N K O F K E N Y ABANK SUPERVISION ANNUAL REPORT 2020
70
REGIONAL AND INTERNATIONAL DEVELOPMENTS AND INITIATIVES
5.3.1 Performance Highlights
5.3.1.1 Number of Employees
The subsidiaries of Kenyan banks had a combined employee count of 7,244 as at December 31, 2020, an increase of 8 percent compared to 6,706 employees in the preceding year. The growth was primarily driven by the expansion of Equity Group Holdings Plc in DRC. The employee count in subsidiaries shows that Uganda had the highest number of employees at 2,229 as at December 2020 compared to 2,266 employees in 2019. Uganda accounted for 30.8 percent of the total number of employees and has the largest proportion of subsidiaries and branches in the region. Table 30 shows regional employee count for subsidiaries of Kenyan banks.
Table 30: Regional employee countCountry Presence KCB
Group Plc
Equity Group Holdings Plc
Diamond Trust Bank Group
NCBA Group Plc
I&M Holdings Plc
Guaranty Trust Bank
The Co-opera-tive Bank
ABC Bank
Total
Tanzania 270 400 531 305 185 - - - 1,691 Uganda 236 1,000 626 165 153 - 49 2,229 Rwanda 244 353 - 61 400 128 - 1,186 Burundi 126 48 - - - - - 174 South Sudan 115 89 - - - - 132 336 Democratic Republic of Congo
- 1,180 - - - - - - 1,180
Mauritius - - - - 448 - - - 448 Total 2020 991 3,022 1,205 531 1,033 281 132 49 7,244 Total 2019 1,043 2,503 1,213 492 995 273 131 56 6,706 Source: CBK
5.3.1.2 Total Assets
Total assets of subsidiaries stood at Ksh.936 billion as at December 31, 2020 compared to Ksh.665 billion as at December 31, 2019. A significant contributor to the asset base was: Equity Group Plc’s subsidiary in DRC, Banque Commerciale Du Congo -BCDC with total assets of Ksh.286 billion. Individual performance per country is as illustrated in Table 31.
Tale 31: Total Assets of Subsidiaries in host countryCountry presence
2019 2020 % Change of Total Assets From 2019
Total Assets (Ksh.‘000’) % of Total Assets Total Assets (Ksh.‘000’) % of Total Assets
Burundi 11,837,557 1.8 13,862,559 1.48 17.11
DRC 80,315,464 12.1 286,410,379 30.58 256.61
Mauritius 151,222,691 22.7 151,255,673 16.15 0.02
Rwanda 99,660,206 15.0 128,273,589 13.69 28.71
South Sudan 30,386,798 4.6 33,594,663 3.59 10.56
Tanzania 150,559,866 22.6 166,085,152 17.73 10.31
Uganda 141,199,944 21.2 157,198,236 16.78 11.33
Grand Total 665,182,526 100 936,680,251 100.00 40.82 Source: CBK

C E N T R A L B A N K O F K E N Y ABANK SUPERVISION ANNUAL REPORT 2020
71
REGIONAL AND INTERNATIONAL DEVELOPMENTS AND INITIATIVES
As shown in Table 32, DRC now accounts for most regional assets at 30.6 percent in 2020 compared to 12.1 percent in 2019.
5.3.1.3 Gross Loans
The combined gross loans for the subsidiaries in the host countries stood at Ksh.421.1 billion as at December 31, 2020, an increase of 25.2 percent from Ksh.336.4 billion as at December 31, 2019. The Kenyan banks subsidiaries operating in Tanzania recorded the highest level of gross loans at Ksh.105 billion accounting for 25 percent of gross loans in all the subsidiaries outside Kenya. This was followed by subsidiaries operating in DRC which accounted for 23 percent of the gross loans. Uganda and Rwanda accounted for 18 percent and 17 percent of the gross loans respectively. Mauritius recorded gross loans of Ksh.62 billion accounting for 15 percent of gross loans. Chart 11 below shows the proportion of gross loans for subsidiaries in the host countries.
Chart 11: Percent of gross loans per host country
5.3.1.4 Deposits
The Kenyan subsidiaries accounted for a combined deposit base of Ksh.746 billion in December 2020 compared to Ksh.514.4 billion in December 2019. The main contributor of deposits was Equity Group Plc’s subsidiary in DRC, Banque Commerciale Du Congo -BCDC with total deposits of Ksh.243 billion or 33 per cent of the total deposits of subsidiaries in the host countries. The regional spread of deposits is as depicted in Table 32.
Table 32: Deposit distributionCountry Presence
2020Gross Deposits (Ksh.’000)
2020% of Gross Deposits
2019Gross Deposits (Ksh.’000)
2019% of Gross Deposits
Burundi 10,111,090 1.4 7,976,384 1.6
DRC 243,329,559 32.5 64,347,778 12.5
Mauritius 129,613,843 17.4 131,009,393 25.4
Rwanda 93,056,595 12.5 72,913,865 14.2
South Sudan
22,120,241 3.0 19,844,601 3.9
Tanzania 127,611,824 17.1 110,323,447 21.4
Uganda 120,221,909 16.1 108,023,084 21.0
Grand Total
746,065,061 100 514,438,552 100
Source: CBK
5.3.1.5 Profitability
The regional subsidiaries profit before tax stood at Ksh.12.79 billion as at December 31, 2020, an increase of 0.51 percent from Ksh.12.72 billion reported in December 31, 2019. The negative impact of COVID-19 pandemic that continues to disrupt growth in global markets has impaired profitability of the Kenyan banks across borders. Profitability of the banks in their respective host countries is as shown in Chart 12.
Source: CBK

C E N T R A L B A N K O F K E N Y ABANK SUPERVISION ANNUAL REPORT 2020
72
REGIONAL AND INTERNATIONAL DEVELOPMENTS AND INITIATIVES
Chart 12: Regional profitability K’000’
Rwanda contributed the highest earnings capacity recording Ksh.3.55 billion in profits, translating to 27.75 percent of the total profits. • Subsidiaries operating in Tanzania were the least profitable and
contributed 5 percent of the total profits of combined subsidiaries in all host countries. The performance in Tanzania was affected by losses reported by some subsidiaries attributed to provisions for loan losses.
• Three subsidiaries registered a combined loss of Ksh.978.5 million. Out of the three loss- making subsidiaries, two were operating in Tanzania and one in Rwanda.
Source: CBK

C E N T R A L B A N K O F K E N Y ABANK SUPERVISION ANNUAL REPORT 2020
73
APPENDIX I: BANKING SECTOR BALANCE SHEET - DECEMBER 2020-KSH.MDecember 2019 December 2020
A ASSETS BANKS NBFIS GRAND TOTAL
% OF TOTAL
BANKS NBFIS GRAND TOTAL
% OF TOTAL
1 Cash ( both Local & Foreign) 71,454 559 72,013 1.5 71,345 761 72,107 1.332 Balances due from Central Bank of Kenya 255,498 2,288 257,786 5.4 214,064 757 214,820 3.973 Kenya Government and other securities held for
dealing purposes71,604 - 71,604 1.5 77,649 - 77,649 1.44
4 Financial Assets at fair value through profit and loss
17,220 - 17,220 0.4 14,757 - 14,757 0.27
5 Investment Securities: - - - 0.0 - - - 0.00a) Held to Maturity: - - - 0.0 - - - 0.00a. Kenya Government securities 566,238 427 566,665 11.8 781,367 1,942 783,308 14.49b. Other securities 16,341 - 16,341 0.3 13,729 - 13,729 0.25b) Available for sale: - - - 0.0 - - - 0.00a. Kenya Government securities 659,534 4,176 663,710 13.8 734,923 5,164 740,087 13.69b. Other securities 30,055 - 30,055 0.6 29,248 - 29,248 0.54
6 Deposits and balances due from local banking institutions
62,469 870 63,340 1.3 68,487 205 68,692 1.27
7 Deposits and balances due from banking institu-tions abroad
151,445 69 151,514 3.2 254,030 764 254,793 4.71
8 Tax recoverable 3,558 63 3,621 0.1 7,146 233 7,380 0.149 Loans and advances to customers (net) 2,454,071 39,935 2,494,006 51.9 2,620,517 38,195 2,658,712 49.1810 Balances due from banking institutions in the
group91,966 - 91,966 1.9 127,780 - 127,780 2.36
11 Investments in associates 4,270 - 4,270 0.1 6,843 - 6,843 0.1312 Investments in subsidiary companies 25,900 - 25,900 0.5 18,438 - 18,438 0.3413 Investments in joint ventures - 242 242 0.0 - 208 208 0.0014 Investment properties 5,864 538 6,402 0.1 6,673 560 7,232 0.1315 Property and equipment 68,629 1,805 70,434 1.5 71,818 1,775 73,594 1.3616 Prepaid lease rentals 1,358 38 1,395 0.0 983 - 983 0.0217 Intangible assets 31,228 862 32,090 0.7 29,698 702 30,400 0.5618 Deferred tax asset 54,838 1,013 55,850 1.2 75,580 1,095 76,674 1.4219 Retirement benefit asset - 1,647 1,647 0.0 72 - 72 0.0020 Other assets 111,337 - 111,337 2.3 140,695 2,118 142,813 2.6421 TOTAL ASSETS 4,754,878 54,532 4,809,410 100.0 5,351,268 54,478 5,405,746 100B LIABILITIES - - -22 Balances due to Central Bank of Kenya 19,275 - 19,275 0.5 18,981 - 18,981 0.4123 Customer deposits 3,493,897 37,476 3,531,373 86.5 3,971,310 40,006 4,011,316 87.2424 Deposits and balances due to local banking
institutions54,553 528 55,081 1.3 57,344 1,190 58,534 1.27
25 Deposits and balances due to foreign banking institutions
44,861 - 44,861 1.1 46,984 - 46,984 1.02
26 Other money market deposits 534 - 534 0.0 5,675 - 5,675 0.1227 Borrowed funds 155,993 5,804 161,797 4.0 209,824 3,681 213,505 4.6428 Balances due to banking institutions in the group 116,419 - 116,419 2.9 106,949 - 106,949 2.3329 Tax payable 4,021 - 4,021 0.1 1,515 - 1,515 0.0330 Dividends payable 8,517 - 8,517 0.2 274 - 274 0.0131 Deferred tax liability 570 - 570 0.0 27 - 27 0.0032 Retirement benefit liability 349 - 349 0.0 418 - 418 0.0133 Other liabilities 136,219 1,571 137,791 3.4 132,752 1,354 134,105 2.9234 TOTAL LIABILITIES 4,035,209 45,379 4,080,588 100.0 4,552,052 46,231 4,598,283 100C SHAREHOLDERS’ FUNDS - - -35 Paid up /Assigned capital 196,319 5,000 201,319 27.6 203,416 5,000 208,416 25.8136 Share premium/(discount) 106,345 3,514 109,858 15.1 109,073 3,514 112,587 13.9437 Revaluation reserves 11,163 180 11,343 1.6 14,697 311 15,008 1.8638 Retained earnings/Accumulated losses 359,846 (2,309) 357,538 49.1 417,621 (4,226) 413,395 51.2039 Statutory loan loss reserves 20,455 2,668 23,123 3.2 17,540 3,654 21,194 2.6240 Other Reserves (864) 48 (816) -0.1 3,392 (5) 3,387 0.4241 Proposed dividends 24,032 - 24,032 3.3 31,168 - 31,168 3.8642 Capital grants 2,374 51 2,425 0.3 2,310 - 2,310 0.2943 TOTAL SHAREHOLDERS’ FUNDS 719,669 9,152 728,822 100.0 799,217 8,247 807,464 100%44 Minority Interest - - - - - -45 TOTAL LIABILITIES AND SHAREHOLDERS’ FUNDS 4,754,878 54,532 4,809,410 5,351,268 54,478 5,405,746
Source: Commercial Banks Published Financial Statements

C E N T R A L B A N K O F K E N Y ABANK SUPERVISION ANNUAL REPORT 2020
74
APPENDIX II: BANKING SECTOR PROFIT AND LOSS ACCOUNT –DECEMBER 2020 – KSH.MDecember 2019 December 2020
BANKS NBFIS GRAND TOTAL
% OF TOTAL
BANKS NBFIS GRAND TOTAL
% OF TOTAL
1 INTEREST INCOME1.1 Loans and advances 260,341 4,679 265,020 66.3 273,112 3,821 276,933 64.31.2 Government securities 121,591 419 122,011 30.5 148,687 555 149,242 34.71.3 Deposits and placements with banking
institutions8,497 19 8,515 2.1 7,582 41 7,623 1.8
1.4 Other Interest Income 1,207 - 1,207 0.3 1,591 - 1,591 0.41.5 Total interest income 391,635 5,117 396,752 99.2 430,972 4,417 435,389 101.22.0 INTEREST EXPENSE2.1 Customer deposits 114,146 1,788 115,933 30.7 125,469 1,806 127,275 27.42.2 Deposits and placement from banking
institutions8,108 99 8,208 2.2 6,891 154 7,045 1.5
2.3 Other interest expenses 12,367 977 13,344 3.5 11,317 445 11,763 2.52.4 Total interest expenses 134,622 2,864 137,485 36.3 143,677 2,405 146,083 31.53.0 NET INTEREST INCOME/(LOSS) 257,014 2,253 259,267 287,294 2,012 289,3074.0 NON-INTEREST INCOME4.1 Fees and commissions on loans and
advances33,763 184 33,946 8.5 35,817 54 35,871 8.3
4.2 Other fees and commissions 52,074 164 52,237 13.1 43,698 118 43,816 10.24.3 Foreign exchange trading income/(Loss) 30,836 50 30,886 7.7 35,396 85 35,481 8.24.4 Dividend Income 1,785 - 1,785 0.4 3,391 - 3,391 0.84.5 Other income 21,582 119 21,701 5.4 22,395 103 22,498 5.24.6 Total Non-interest income 140,039 517 140,555 35.2 140,697 360 141,057 32.85.0 TOTAL OPERATING INCOME 397,053 2,770 399,822 100.0 427,991 2,372 430,363 100.06.0 OTHER OPERATING EXPENSES6.1 Loan loss provision 39,289 351 39,640 10.5 110,273 415 110,688 23.86.2 Staff costs 92,325 924 93,249 24.7 93,555 1,109 94,664 20.46.3 Directors’ emoluments 2,798 8 2,805 0.7 2,452 7 2,459 0.56.4 Rental charges 5,046 136 5,181 1.4 5,481 146 5,628 1.26.5 Depreciation charge on property and
equipment15,884 160 16,044 4.2 16,537 165 16,703 3.6
6.6 Amortisation charges 7,342 212 7,554 2.0 8,451 227 8,678 1.96.7 Other operating expenses 75,274 1,003 76,276 20.2 78,133 1,266 79,399 17.16.8 Total Other Operating Expenses 237,957 2,793 240,750 63.7 314,883 3,335 318,218 68.5
TOTAL EXPENSES (2.4+6.8) 372,579 5,657 378,236 100.0 458,560 5,741 464,300 100.07 Profit/(loss) Before Tax and Exceptional
Items159,095 (23) 159,072 113,109 (963) 112,145
8.0 Exceptional Items 3,635 (6) 3,629 4,840 34 4,8759.0 Profit/(Loss) After Exceptional Items 155,460 (18) 155,443 108,268 (997) 107,27110.0 Current Tax 55,437 126 55,563 42,361 - 42,36111.0 Deferred Tax (10,086) (150) (10,236) (22,096) (66) (22,161)12.0 Profit/(Loss) After Tax and Exceptional
Items110,110 6 110,116 88,003 (932) 87,071
13.0 Minority Interest - -14.0 Profit/(loss) after tax, exceptional items
and Minority Interest110,110 6 110,116 88,003 (932) 87,071
15.0 Other Comprehensive Income15.1 Gains/(Losses) from translating the finan-
cial statements of foreign operations(1,172) - (1,172) (176) - (176)
15.2 Fair value changes in available for sale financial assets
(2,197) 104 (2,093) 6,582 (76) 6,507
15.3 Revaluation surplus on Property, plant and equipment
(494) - (494) 196 137 333
15.4 Share of other comprehensive income of associates
316 - 316 - - -
15.5 Income tax relating to components of other comprehensive income
1,196 (31) 1,164 (502) 16 (486)
16.0 Other Comprehensive Income for the year net of tax
(2,351) 73 (2,278) 6,101 77 6,178
17.0 Total comprehensive income for the year 107,758 79 107,838 94,104 (855) 93,249Source: Commercial Banks Published Financial Statements

C E N T R A L B A N K O F K E N Y ABANK SUPERVISION ANNUAL REPORT 2020
75
Appendix III: BANKING SECTOR OTHER DISCLOSURES – DECEMBER 2020, Ksh. MillionsDecember 2019 December 2020
BANKS NBFIS GRAND TOTAL BANKS NBFIS GRAND TOTAL
ANNUAL PERCENTAGE CHANGE
NON-PERFORMING LOANS AND ADVANCES(a) Gross Non-performing loans and advances 324,272 12,316 336,588 425,268 10,799 436,067 29.6(b) Less: Interest in Suspense 59,376 3,231 62,607 68,523 3,288 71,810 14.7(c)Total Non-Performing Loans and Advances (a-b) 264,896 9,085 273,980 356,745 7,511 364,256 32.9(d) Less: Loan Loss Provision 131,640 2,656 134,296 194,503 3,564 198,067 47.5(e) Net Non-Performing Loans and Advances(c-d) 133,255 6,429 139,684 162,242 3,947 166,189 19.0(f) Discounted Value of Securities 121,208 6,429 127,637 148,488 3,947 152,435 19.4(g) Net NPLs Exposure (e-f) 12,047 0 12,047 13,754 0 13,754 14.2INSIDER LOANS AND ADVANCES -(a) Directors, Shareholders and Associates 41,323 1,411 42,734 46,732 2,212 48,943 14.5(b) Employees 72,661 814 73,475 77,713 794 78,507 6.8
(c)Total Insider Loans and Advances and other facilities 113,983 2,226 116,209 124,444 3,006 127,450 9.7OFF-BALANCE SHEET ITEMS -
(a) Letters of credit, guarantees, acceptances 544,379 92 544,471 586,922 822 587,743 7.9(b) Forwards, swaps and options 548,606 1,238 549,843 452,430 665 453,095 (17.6)(c) Other contingent liabilities 18,903 - 18,903 14,154 - 14,154 (25.1)(d) Total Contingent Liabilities 1,111,888 1,330 1,113,217 1,053,505 1,487 1,054,992 (5.2)
CAPITAL STRENGTH -(a) Core capital 626,393 5,813 632,206 683,048 3,622 686,669 8.6(b) Minimum Statutory Capital 1,000 1,000 1,000 1,000 1,000 1,000 -(c) Excess/(Deficiency)(a-b) 626,393 4,813 631,206 683,048 2,622 685,669 8.6(d) Supplementary Capital 82,260 558 82,818 98,991 579 99,569 20.2(e) Total Capital (a+d) 708,653 6,371 715,024 782,038 4,200 786,239 10.0(f) Total risk weighted assets 3,752,476 44,679 3,797,156 4,090,000 46,280 4,136,280 8.9(g) Core Capital/Total deposits Liabilities 17.9 15.5 17.9 17.2 9.1 17.1(h) Minimum statutory Ratio 8.0 8.0 8.0 8.0 8.0 8.0(i) Excess/(Deficiency) (g-h) 9.9 7.5 9.9 9.2 1.1 9.1(j) Core Capital / total risk weighted assets 16.7 13.0 16.6 16.7 7.8 16.6(k) Minimum Statutory Ratio 10.5 10.5 10.5 10.5 10.5 10.5(l) Excess (Deficiency) (j-k) 6.2 2.5 6.1 6.2 -2.7 6.1(m) Total Capital/total risk weighted assets 18.9 14.3 18.8 19.1 9.1 19.0(n) Minimum statutory Ratio 14.5 14.5 14.5 14.5 14.5 14.5(o) Excess/(Deficiency) (m-n) 4.4 -0.2 4.3 4.6 -5.4 4.5
LIQUIDITY(a) Liquidity Ratio 46.2 20.8 45.5 54.9 18.2 54.5(b) Minimum Statutory Ratio 20.0 20.0 20.0 20.0 20.0 20.0(c) Excess (Deficiency) (a-b) 26.2 0.8 25.5 34.9 -1.8 34.5Performance IndicatorsYield on Earning Assets 9.4 10.0 9.4 9.0 8.3 9.0Cost of Funding Earning Assets 3.2 5.6 3.3 3.0 4.5 3.0Interest Margin on Earning Assets 6.2 4.4 6.1 6.0 3.8 6.0Yield on Advances 9.8 10.2 9.8 9.5 8.5 9.5Cost of Deposits 3.7 7.5 3.8 3.5 5.8 3.5Return on Assets (ROA) 2.6 0.0 2.6 1.7 -1.5 1.7Return on Equity (ROE) 22.1 -0.3 21.8 14.2 -11.7 13.9Overheads to Earnings 44.8 49.6 44.8 55.1 69.8 55.2Gross NPLs/Gross Loans 12.3 26.9 12.5 14.3 25.8 14.5RATINGSCapital Adequacy 2 3 2 2 4 2Asset Quality 2 5 2 2 4 2Earnings 2 5 2 3 5 3Liquidity 1 3 1 1 4 1Composite Score 2 4 2 2 4 2Performance Category Satisfactory Marginal Satisfactory Satisfactory Marginal Satisfactory
Ratings PERFORMANCE CATEGORY
CAPITAL ADE-QUACY (Total Capital/TRWA) (%)
ASSET QUALITY (NPLs-Provi-sions)/Gross Loans (%)
EARNINGS Net Profits/Total Assets (%)
LIQUIDITY (Total Liquid Assets/Total Short-term Liabilities)(%)
MANAGEMENT (Total weighted Score)
COMPOSITE SCORE (Average Score)
1 Strong 19.50 and above 0 - 5 Over 3% Over 34 1.0 - 1.4 1.0 - 1.4
2 Satisfactory 15.60 - .49 5.1 - 10.0 2.0%-2.9% 26 - 34 1.5 - 2.4 1.5 - 2.43 Fair 12.00 - .59 10.1 - 15.0 1.0%-1.9% 20 - 25 2.5 - 3.4 2.5 - 3.44 Marginal 8.31 - 1.99 15.1 - 20.0 0.0%-0.9% 15 - 19 3.5 - 4.4 3.5 - 4.4
5 Unsatisfactory 8.30 and below Over 20 Net Loss Under 15 4.5 - 5.0 4.5 - 5.0
Source: Commercial Banks Published Financial Statements

C E N T R A L B A N K O F K E N Y ABANK SUPERVISION ANNUAL REPORT 2020
76
Appendix IV: BANKING SECTOR MARKET SHARE - DECEMBER 2020
Market size index (%)
Mar-ket Rank index (%)
Total Net Assets
% of the market(%)
Total Deposits
% of the market(%)
Total Share-holders’ funds (%)
% of the mar-ket (%)
Num-ber Depos-it ac-counts (Mil-lions)
% of the mar-ket (%)
Number of loan accounts (Mil-lions)
% of the Market (%)
Ksh.M Ksh.M Ksh.M
Weighting 0.33 0.33 0.33 0.005 0.005
Large Peer Group >5%1 KCB Bank Kenya Ltd 14.05 1 758,345 14.03 591,067 14.34 111,271 13.78 8.96 12.82 1.87 16.392 Equity Bank Kenya Ltd 11.75 2 667,650 12.35 502,423 12.19 86,697 10.74 10.73 15.36 0.70 6.093 NCBA Bank Kenya PLC 9.70 3 491,614 9.09 394,813 9.58 72,028 8.92 38.73 55.42 7.30 63.91
4 Co-operative Bank of Kenya Ltd 9.56 4 496,823 9.19 370,085 8.98 85,597 10.60 3.62 5.18 0.80 7.03
5 Absa Bank Kenya Plc 6.23 5 377,936 6.99 257,706 6.25 44,969 5.57 1.83 2.63 0.25 2.23
6 Standard Chartered Bank (K) Ltd 6.10 6 325,873 6.03 256,951 6.23 50,219 6.22 0.24 0.34 0.05 0.44
7 Diamond Trust Bank Kenya Limited 6.00 7 312,189 5.78 235,048 5.70 54,032 6.69 0.53 0.75 0.01 0.12
8 I & M Bank Limited 5.63 8 283,569 5.24 219,167 5.32 52,324 6.48 0.18 0.25 0.02 0.139 Stanbic Bank Kenya Ltd 5.53 9 318,986 5.90 233,493 5.66 41,857 5.18 0.21 0.30 0.05 0.45
Sub-Total 74.55 4,032,984 74.60 3,060,754 74.24 598,995 74.18 65.03 93.05 11.06 96.78Medium Peer Group (1-5%)
1 Bank of Baroda (K) Limited 3.21 10 166,313 3.08 138,406 3.36 26,677 3.30 0.05 0.08 0.00 0.032 Prime Bank Ltd 2.44 11 116,204 2.15 88,594 2.15 24,902 3.08 0.04 0.06 0.00 0.043 Citibank N.A. Kenya 2.20 12 106,454 1.97 81,190 1.97 22,134 2.74 0.00 0.00 0.00 0.00
4 National Bank of Kenya Ltd 2.17 13 126,842 2.35 112,672 2.73 11,936 1.48 0.78 1.11 0.05 0.40
5 Family Bank Ltd. 1.68 14 90,591 1.68 70,577 1.71 13,162 1.63 2.34 3.35 0.18 1.556 Bank of India 1.64 15 75,129 1.39 56,912 1.38 17,853 2.21 0.02 0.02 0.00 0.017 Ecobank Kenya Ltd 1.55 16 94,428 1.75 85,021 2.06 7,070 0.88 0.18 0.26 0.00 0.048 SBM Bank Kenya Ltd 1.31 17 79,190 1.46 57,094 1.38 8,871 1.10 0.20 0.29 0.02 0.169 HFC Ltd 1.00 18 54,478 1.01 41,196 1.00 8,247 1.02 0.28 0.40 0.01 0.09
Sub-Total 17.21 909,628 16.83 731,662 17.75 140,851 17.44 3.89 5.57 0.26 2.31
Small Peer Group < 1%
1 Victoria Commercial Bank Limited 0.74 19 37,890 0.70 28,806 0.70 6,745 0.84 0.01 0.01 0.00 0.01
2 Guaranty Trust Bank Limited 0.74 20 31,267 0.58 21,316 0.52 9,189 1.14 0.02 0.03 0.00 0.01
3 Bank of Africa Ltd 0.72 21 44,917 0.83 27,977 0.68 5,419 0.67 0 0.13 0 0.084 Gulf African Bank Limited 0.68 22 37,653 0.70 29,972 0.73 5,029 0.62 0.11 0.15 0.02 0.19
5 African Banking Corporation Ltd 0.58 23 32,643 0.60 28,082 0.68 3,816 0.47 0.04 0.05 0.00 0.01
6 Sidian Bank Ltd 0.56 24 33,500 0.62 23,770 0.58 4,080 0.51 0.19 0.28 0.02 0.137 Habib Bank A.G Zurich 0.47 25 27,212 0.50 22,082 0.54 3,204 0.40 0.01 0.01 0.00 0.008 Credit Bank Ltd 0.42 26 23,145 0.43 18,149 0.44 3,218 0.40 0.04 0.06 0.00 0.029 First Community Bank Ltd 0.37 27 21,947 0.41 19,038 0.46 2,051 0.25 0.08 0.12 0.01 0.0510 UBA Kenya Bank Ltd 0.33 28 18,743 0.35 15,544 0.38 2,257 0.28 0.00 0.01 0.00 0.01
11 Development Bank of Kenya Ltd 0.33 29 17,222 0.32 8,279 0.20 3,823 0.47 0.00 0.00 0.00 0.01
12 Guardian Bank Limited 0.32 30 16,858 0.31 13,238 0.32 2,834 0.35 0.01 0.01 0.00 0.0113 Mayfair CIB Bank Ltd 0.31 31 12,729 0.24 8,082 0.20 4,121 0.51 0.00 0.00 0.00 0.01
14 M Oriental Commercial Bank Limited 0.28 32 12,985 0.24 9,749 0.24 3,071 0.38 0.00 0.00 0.00 0.01
15 Kingdom Bank Limited 0.28 33 30,612 0.57 5,081 0.12 1,300 0.16 0.17 0.24 0.02 0.1916 DIB Bank Kenya Ltd 0.28 34 13,263 0.25 10,149 0.25 2,847 0.35 0.00 0.01 0.00 0.01
17 Consolidated Bank of Kenya Limited 0.23 35 12,886 0.24 9,287 0.23 1,837 0.23 0.05 0.06 0.00 0.03
18 Paramount Bank Ltd 0.22 36 11,378 0.21 9,265 0.22 1,911 0.24 0.01 0.01 0.00 0.0219 Middle East Bank (K) Ltd 0.20 37 11,022 0.20 9,605 0.23 1,274 0.16 0.00 0.01 0.00 0.0120 Access Bank Plc 0.18 38 10,147 0.19 7,826 0.19 1,413 0.18 0.11 0.15 0.01 0.0921 Spire Bank Limited 0.00 39 5,114 0.09 4,793 0.12 (1,820) -0.23 0.02 0.03 0.00 0.0322 Imperial Bank Ltd*
23 Chase Bank (K) Ltd**
24 Charterhouse Bank Ltd**
Sub-Total 8.24 463,135 8.57 330,093 8.01 67,618 8.38 0.96 1.38 0.10 0.91
Grand-Total 100 5,405,746 100 4,122,509 100 807,464 100 69.88 100 11.42 100*Bank In Receivership**Banks In LiquidationSource: Commercial Banks Published Financial Statements (December 2020)

C E N T R A L B A N K O F K E N Y ABANK SUPERVISION ANNUAL REPORT 2020
77
Appendix V: BANKING SECTOR PROFITABILITY - DECEMBER 2020Return on Assets Return on Equity
Profit/(Loss) Before Tax (Ksh.M)
Total Assets (Ksh.M)
(1/2) (%) Total Sharehold-ers’ Funds (Ksh.M)
(1/4) (%)
1 2 3 4 51 KCB Bank Kenya Ltd 23,586 758,345 3.11 111,271 21.22 Co-operative Bank of Kenya Ltd 16,961 496,823 3.41 85,597 19.83 Equity Bank Kenya Ltd 14,207 667,650 2.13 86,697 16.44 I & M Bank Ltd 10,289 283,569 3.63 52,324 19.75 Absa Bank Kenya Plc 8,300 377,936 2.20 44,969 18.56 Standard Chartered Bank Kenya Ltd 7,018 325,873 2.15 50,219 14.07 NCBA Bank Kenya PLC 6,955 491,614 1.41 72,028 9.78 Stanbic Bank Kenya Ltd 6,237 318,986 1.96 41,857 14.99 Bank of Baroda (Kenya) Limited 5,791 166,313 3.48 26,677 21.710 Citibank N.A. Kenya 5,480 106,454 5.15 22,134 24.811 Diamond Trust Bank Kenya Limited 3,942 312,189 1.26 54,032 7.312 Bank of India 2,733 75,129 3.64 17,853 15.313 Prime Bank Ltd 1,849 116,204 1.59 24,902 7.414 Family Bank Ltd. 1,326 90,591 1.46 13,162 10.115 SBM Bank Kenya Ltd 617 79,190 0.78 8,871 7.016 Gulf African Bank Ltd 559 37,653 1.49 5,029 11.117 Guaranty Trust Bank Ltd 493 31,267 1.58 9,189 5.418 Victoria Commercial Bank Limited 480 37,890 1.27 6,745 7.119 Habib Bank AG Zurich 451 27,212 1.66 3,204 14.120 National Bank of Kenya Ltd 313 126,842 0.25 11,936 2.621 First Community Bank Ltd 238 21,947 1.09 2,051 11.622 African Banking Corporation Ltd 147 32,643 0.45 3,816 3.923 Middle East Bank (K) Ltd 105 11,022 0.95 1,274 8.324 Sidian Bank Ltd 104 33,500 0.31 4,080 2.525 Paramount Bank Ltd 97 11,378 0.85 1,911 5.126 Guardian Bank Limited 77 16,858 0.45 2,834 2.727 UBA Kenya Bank Ltd 56 18,743 0.30 2,257 2.528 M-Oriental Commercial Bank Ltd 43 12,985 0.33 3,071 1.429 Development Bank of Kenya Ltd 19 17,222 0.11 3,823 0.530 Credit Bank Ltd 8 23,145 0.04 3,218 0.331 Ecobank Kenya Ltd 6 94,428 0.01 7,070 0.132 Kingdom Bank Ltd -124 30,612 (0.41) 1,300 (9.6)33 Consolidated Bank of Kenya Limited -262 12,886 (2.03) 1,837 (14.2)34 Mayfair CIB Bank Ltd -352 12,729 (2.76) 4,121 (8.5)35 Bank of Africa (K) Ltd -680 44,917 (1.51) 5,419 (12.5)36 DIB Bank Kenya Ltd -693 13,263 (5.22) 2,847 (24.3)37 HFC Ltd -963 54,478 (1.77) 8,247 (11.7)38 Spire Bank Limited -1,257 5,114 (24.59) -1,820 69.139 Access Bank Plc -2,010 10,147 (19.81) 1,413 (142.3)40 Imperial Bank Ltd* - -41 Chase Bank (K) Ltd** - -42 Charterhouse Bank Ltd** - -
Total 112,145.42 5,405,746 2.07 807,464 13.9*Bank In Receivership**Banks In LiquidationSource: Commercial Banks Published Financial Statements (December 2020)

C E N T R A L B A N K O F K E N Y ABANK SUPERVISION ANNUAL REPORT 2020
78
Appendix VI: BANKING SECTOR GROSS LOANS AND NON-PERFORMING LOANS- DECEMBER 2020BANKS Gross Loans and Advances, Ksh. M Gross Non-Performing Loans, Ksh. M
December 2019 December 2020 December 2019 December 20201 KCB Bank Kenya Ltd 468,258 544,837 34,786 66,810
2 Equity Bank Kenya Ltd. 290,564 355,630 26,185 42,825
3 Co - operative Bank of Kenya Ltd 281,516 307,324 31,156 51,781
4 NCBA Bank Kenya Plc 244,395 259,698 30,516 35,995
5 Absa Bank Kenya Plc 205,304 229,677 13,519 17,099
6 Stanbic Bank (Kenya) Ltd 163,859 176,597 19,345 25,038
7 Diamond Trust Bank (K) Ltd 155,307 165,948 12,892 19,747
8 I&M Bank Ltd 152,807 160,665 18,799 20,178
9 Standard Chartered Bank (K) Ltd 144,483 152,711 20,058 22,337
10 National Bank of Kenya Ltd 60,677 74,774 25,175 26,438
11 Family Bank Ltd. 54,389 63,111 8,244 9,391
12 Bank of Baroda (K) Ltd 49,335 51,151 4,126 6,342
13 HFC Ltd 45,822 41,836 12,316 10,799
14 Prime Bank Ltd 38,932 44,531 4,555 4,838
15 SBM Bank (Kenya) Ltd 27,226 36,760 14,980 16,225
16 Citibank N.A. Kenya 27,068 39,726 1,116 1,120
17 Gulf African Bank Ltd 24,578 22,928 3,613 4,028
18 Victoria Commercial Bank Ltd 24,542 25,442 1,204 1,679
19 Ecobank Kenya Ltd 24,118 26,884 4,783 4,377
20 Bank of Africa (K) Ltd 22,546 21,850 8,998 8,689
21 African Banking Corporation Ltd 20,115 21,961 3,557 3,425
22 Sidian Bank Ltd 15,846 20,409 3,258 2,337
23 Credit Bank Ltd 15,797 17,512 1,592 2,017
24 Guaranty Trust Bank Ltd 14,872 15,714 2,747 3,269
25 Bank of India 13,608 20,980 1,212 996
26 First Community Bank Ltd 11,833 14,572 4,699 5,258
27 Kingdom Bank Limited 10,766 8,907 6,083 6,787
28 Guardian Bank Ltd 9,892 9,248 944 1,181
29 Development Bank of Kenya Ltd 9,801 10,149 3,341 3,420
30 Consolidated Bank of Kenya Ltd 8,929 10,130 2,632 2,436
31 M-Oriental Commercial Bank Ltd 7,455 7,742 1,411 1,812
32 Access Bank (Kenya) PLC 7,313 3,481 2,196 159
33 Paramount Bank Ltd 7,177 7,883 1,263 1,346
34 Habib Bank A.G. Zurich 7,000 6,847 787 836
35 Middle East Bank (K) Ltd 6,153 7,639 870 790
36 Spire Bank Ltd 5,114 3,827 2,632 2,711
37 DIB Bank Kenya Ltd 5,067 8,789 50 125
38 Mayfair CIB Bank Ltd 4,606 5,056 67 129
39 UBA Kenya Ltd 3,841 3,178 883 1,295
40 Imperial Bank Ltd * - - - -
41 Chase Bank (K) Ltd** - - - -
42 Charterhouse Bank Ltd ** - - - -
Total 2,690,910 3,006,104 336,588 436,067*Bank In Receivership
**Banks In Liquidation
Source: Commercial Banks Published Financial Statements

C E N T R A L B A N K O F K E N Y ABANK SUPERVISION ANNUAL REPORT 2020
79
APPENDIX VII: BANKING SECTOR CAPITAL AND RISK WEIGHTED ASSETS-DECEMBER 2020
BanksCore Capital (Ksh.000)
Total Capital (Ksh.000)
Overall Risk Weighted Assets (Ksh.000)
Core Capital/TRWA (%)
Total Capital/TRWA (%)
Core Capital/Total Deposits (%)
1 KCB Bank Kenya Ltd 102,218 126,674 654,393 15.6 19.4 17.3
2 Co-operative Bank of Kenya Ltd 70,566 77,446 455,847 15.5 17.0 19.1
3 Equity Bank Kenya Ltd 70,268 92,118 566,959 12.4 16.2 14.1
4 NCBA Bank Kenya PLC 60,707 61,233 341,742 17.8 17.9 15.6
5 Diamond Trust Bank Kenya Limited 47,561 51,543 229,366 20.7 22.5 22.9
6 Absa Bank Kenya Plc 43,715 51,909 297,314 14.7 17.5 17.2
7 I&M Bank Ltd 42,208 49,335 223,976 18.8 22.0 19.3
8 Stanbic Bank Kenya Ltd 40,940 46,444 256,472 16.0 18.1 18.9
9 Standard Chartered Bank (K) Ltd 39,240 45,676 247,251 15.9 18.5 15.3
10 Bank of Baroda (Kenya) Limited 26,670 26,670 86,842 30.7 30.7 19.8
11 Prime Bank Ltd 22,559 22,912 58,365 38.7 39.3 25.5
12 Citibank N.A. Kenya 18,091 18,515 82,243 22.0 22.5 22.8
13 Bank of India 17,145 17,322 35,693 48.0 48.5 35.1
14 Family Bank Ltd. 11,344 13,363 74,824 15.2 17.9 16.2
15 SBM Bank Kenya Ltd 7,355 7,932 46,180 15.9 17.2 13.1
16 National Bank of Kenya Ltd 6,578 7,835 76,037 8.7 10.3 6.6
17 Victoria Commercial Bank Limited 6,097 6,605 35,151 17.3 18.8 21.6
18 Ecobank Kenya Ltd 5,804 7,070 44,549 13.0 15.9 7.2
19 Guaranty Trust Bank 5,413 5,673 20,794 26.0 27.3 25.4
20 Gulf African Bank 4,640 6,055 31,903 14.5 19.0 15.5
21 Mayfair CIB Bank Ltd 4,052 4,052 7,625 53.1 53.1 50.2
22 HFC Ltd 3,622 4,200 46,280 7.8 9.1 9.1
23 Sidian Bank Ltd 3,506 5,123 31,047 11.3 16.5 15.4
24 Credit Bank Ltd 2,870 3,220 22,156 13.0 14.5 16.3
25 Habib Bank AG Zurich 2,826 2,995 11,255 25.1 26.6 13.0
26 Guardian Bank Limited 2,649 2,834 12,030 22.0 23.6 20.1
27 M-Oriental Commercial Bank 2,546 2,654 8,712 29.2 30.5 26.1
28 African Banking Corporation Ltd 2,534 3,208 21,095 12.0 15.2 9.3
29 Development Bank of Kenya Ltd 2,395 2,695 12,114 19.8 22.2 38.6
30 UBA Kenya Bank Ltd 2,259 2,259 7,426 30.4 30.4 29.1
31 Bank of Africa Ltd 2,246 3,484 21,331 10.5 16.3 8.0
32 Paramount Bank Ltd 1,747 1,747 7,064 24.7 24.7 18.9
33 DIB Bank Kenya Ltd 1,620 1,663 10,291 15.7 16.2 16.0
34 Access Bank Limited 1,413 1,413 6,699 21.1 21.1 18.0
35 Middle East Bank (K) Ltd 1,209 1,221 4,371 27.7 27.9 12.7
36 Kingdom Bank Limited 1,026 1,026 7,427 13.8 13.8 20.2
37 First Community Bank Ltd 836 1,619 17,453 4.8 9.3 4.4
38 Consolidated Bank of Kenya Limited 828 1,076 11,740 7.0 9.2 9.0
39 Spire Bank Limited (2,634) (2,581) 4,263 (61.8) (60.6) (55.0)
Total 686,669 786,239 4,136,280 16.6 19.0 17.1
Source: Commercial Banks Published Financial Statements

C E N T R A L B A N K O F K E N Y ABANK SUPERVISION ANNUAL REPORT 2020
80
Appendix VIII: BANKING SECTOR ACCESS TO FINANCIAL SERVICES - NUMBER OF DEPOSIT ACCOUNTS - DECEMBER 2020PeerGroup - 2020
December 2019 December 2020Commercial Banks < 100,000 >100,000 Total < 100,000 >100,000 Total % change
1 NCBA Bank Kenya Ltd. Large 31,609,349 102,235 31,711,584 38,608,821 122,535 38,731,356 22.142 Equity Bank Kenya Ltd Large 10,935,007 347,787 11,282,794 10,355,380 377,148 10,732,528 -4.883 KCB Bank Kenya Ltd Large 8,013,686 253,958 8,267,644 8,677,330 280,186 8,957,516 8.344 Co-operative Bank of Kenya Ltd Large 3,299,513 241,260 3,540,773 3,359,864 262,614 3,622,478 2.315 ABSA Kenya Plc Large 1,641,727 108,177 1,749,904 1,722,587 112,265 1,834,852 4.856 Diamond Trust Bank (K) Ltd Large 453,359 55,617 508,976 468,471 56,852 525,323 3.217 Stanbic Bank Kenya Ltd Large 165,342 38,216 203,558 169,528 41,931 211,459 3.888 Standard Chartered Bank (K) Ltd Large 158,852 71,645 230,497 162,193 74,423 236,616 2.659 Family Bank Ltd Medium 2,193,599 56,468 2,250,067 2,280,069 60,389 2,340,458 4.0210 National Bank of Kenya Ltd Medium 659,446 40,683 700,129 734,115 43,108 777,223 11.0111 HFC Limited Medium 254,663 12,651 267,314 262,926 13,799 276,725 3.5212 Ecobank Kenya Ltd Medium 164,974 8,045 173,019 174,315 8,409 182,724 5.6113 I & M Bank Ltd. Medium 108,468 52,560 161,028 118,764 57,176 175,940 9.2614 Bank of Africa Kenya Ltd Medium 95,591 9,559 105,150 83,377 9,555 92,932 -11.6215 Bank of Baroda Ltd Medium 21,078 29,987 51,065 19,777 34,228 54,005 5.7616 Prime Bank Ltd Medium 18,529 16,954 35,483 19,950 19,040 38,990 9.8817 Bank of India Medium 6,780 9,396 16,176 6,008 9,765 15,773 -2.4918 Citibank N.A. Kenya Medium 559 1,381 1,940 678 1,426 2,104 8.4519 Sidian Bank Limited Small 239,857 8,249 248,106 184,669 9,633 194,302 -21.6920 SBM Bank (Kenya) Ltd. Small 200,162 13,637 213,799 187,091 14,277 201,368 -5.8121 Kingdom Bank Limited Small 157,475 2,007 159,482 166,567 2,003 168,570 5.7022 Access Bank (Kenya) PLC Small 100,344 5,944 106,288 101,458 6,287 107,745 1.3723 Gulf African Bank Ltd Small 88,196 16,235 104,431 88,229 16,953 105,182 0.7224 First Community Bank Ltd Small 76,126 9,308 85,434 72,739 9,720 82,459 -3.4825 Consolidated Bank of Kenya Ltd Small 42,241 5,087 47,328 39,971 5,118 45,089 -4.7326 Credit Bank Ltd Small 35,121 4,140 39,261 37,918 4,351 42,269 7.6627 African Banking Corporation Ltd Small 31,266 5,748 37,014 29,688 6,157 35,845 -3.1628 Spire Bank Limited Small 21,367 1,875 23,242 21,149 1,669 22,818 -1.8229 Guaranty Trust Bank (Kenya) Ltd Small 11,770 5,340 17,110 13,008 6,014 19,022 11.1730 Guardian Bank Limited Small 6,257 3,003 9,260 6,304 3,150 9,454 2.1031 Paramount Bank Ltd Small 6,122 1,473 7,595 6,218 1,493 7,711 1.5332 UBA Bank Kenya Ltd Small 5,493 777 6,270 4,044 800 4,844 -22.7433 M-Oriental Commercial Bank Ltd Small 2,914 1,439 4,353 2,705 1,529 4,234 -2.7334 DIB Bank Kenya Ltd Small 2,455 814 3,269 2,827 1,057 3,884 18.8135 Habib Bank A.G. Zurich Small 1,935 3,051 4,986 1,885 3,144 5,029 0.8636 Middle East Bank Ltd Small 1,563 738 2,301 1,904 1,090 2,994 30.1237 Victoria Commercial Bank Ltd Small 1,362 3,685 5,047 1,360 3,980 5,340 5.8138 Mayfair CIB Bank Ltd Small 1,136 1,250 2,386 1,548 1,380 2,928 22.7239 Development Bank of Kenya Ltd Small 747 850 1,597 758 1,000 1,758 10.0840 Imperial Bank Ltd*41 Chase Bank Ltd**42 Charterhouse Bank Ltd**
Sub-Totals 60,834,431 1,551,229 62,385,660 68,196,193 1,685,654 69,881,847 12.02Microfinance Banks
1 Kenya Women Microfinance Bank Limited Large 941,578 10,189 951,767 984,851 9,850 994,701 4.51
2 Faulu Microfinance Bank Limited Large 395,010 8,871 403,881 365,033 8,961 373,994 -7.403 Rafiki Microfinance Bank Limited Large 125,856 1,949 127,805 127,518 2,000 129,518 1.344 SMEP Microfinance Bank Limited Medium 533,319 1,900 535,219 544,132 1,911 546,043 2.025 Sumac Microfinance Bank Limited Medium 8,736 328 9,064 10,780 343 11,123 22.726 KEY Microfinance Bank Limited Medium 11,230 111 11,341 10,288 88 10,376 -8.517 Maisha Microfinance Bank Ltd Small 220,422 167 220,589 451,952 101 452,053 104.938 Caritas Microfinance Bank Limited Small 22,106 973 23,079 26,195 1,226 27,421 18.819 Century Microfinance Bank Limited Small 24,241 168 24,409 23,391 160 23,551 -3.5210 U & I Microfinance Bank Limited Small 6,138 152 6,290 6,696 119 6,815 8.3511 Uwezo Microfinance Bank Limited Small 5,775 31 5,806 6,063 15 6,078 4.6812 Choice Microfinance Bank Limited Small 7,526 99 7,625 8,103 113 8,216 7.7513 Daraja Microfinance Bank Limited Small 4,188 79 4,267 4,394 71 4,465 4.6414 Muungano Microfinance Bank Limited Small 1,124 44 1,168 100.00
Sub-Totals 2,306,125 25,017 2,331,142 2,569,396 24,958 2,594,354 11.29Grand Total 63,140,556 1,576,246 64,716,802 70,765,589 1,710,612 72,476,201 11.99
* Bank In receivership** Banks In LiquidationSource: CBK

C E N T R A L B A N K O F K E N Y ABANK SUPERVISION ANNUAL REPORT 2020
81
Appendix IX: BANKING SECTOR PROTECTED DEPOSITS - DECEMBER 2020December 2019 December 2020
Insured Customer Insured Customer Change in Insured
% Change In
BANKS Deposits Deposits Deposits Deposits Deposits CustomerKsh M Ksh. M Ksh M Ksh. M Deposits
1 ABSA Bank Kenya Plc Large 15,084 242,375 44,333 253,630 29,249 4.62 Access Bank Plc Small 837.45 7,100 1,884 7,826 1,046 10.23 African Banking Corporation Ltd Small 762.487 22,981 2,618 27,299 1,855 18.84 Bank of Africa (K) Ltd Small 1,659 33,329 3,835 27,977 2,176 -16.15 Bank of Baroda (Kenya) Limited Medium 3,472 119,341 14,791 135,000 11,320 13.16 Bank of India Medium 1,075.26 46,755 4,345 48,874 3,269 4.57 Citibank N.A. Kenya Medium 144.82 65,335 676 79,193 531 21.28 Consolidated Bank of Kenya Limited Small 806.09 8,796 2,025 9,224 1,219 4.99 Credit Bank Ltd Small 565.39 17,347 1,834 17,638 1,268 1.710 Development Bank of Kenya Ltd Small 100.07 6,029 439 6,202 339 2.911 Diamond Trust Bank Kenya Limited Large 7,283.64 221,038 23,807 207,984 16,524 -5.912 DIB Bank Kenya Ltd Small 106.56 6,512 356 10,149 249 55.913 Ecobank Kenya Ltd Medium 1,170.63 66,321 3,389 80,233 2,218 21.014 Equity Bank Kenya Ltd Large 68,758 381,138 144,726 496,748 75,969 30.315 Family Bank Ltd. Medium 10,050.88 58,332 22,695 70,125 12,644 20.216 First Community Bank Ltd Small 1,409.09 16,285 3,900 18,819 2,491 15.617 Guaranty Trust Bank (Kenya) Ltd Small 694.94 18,932 1,594 21,314 899 12.618 Guardian Bank Limited Small 394.44 13,078 1,286 13,238 891 1.219 Gulf African Bank Ltd Small 2,429.08 27,818 6,716 29,972 4,287 7.720 Habib Bank AG Zurich Small 366.27 20,532 1,333 21,749 967 5.921 HFC Ltd Medium 1,970.58 38,004 5,443 40,006 3,472 5.322 I & M Bank Ltd Large 6,677.94 195,841 38,191 218,153 31,513 11.423 KCB Bank Kenya Ltd Large 50,115.44 536,830 116,106 588,628 65,991 9.624 Kingdom Bank Ltd Small 397.30 4,795 870 5,081 473 6.025 Mayfair CIB Bank Ltd Small 147.13 7,293 615 8,069 467 10.626 Middle East Bank (K) Ltd Small 94.25 7,138 470 9,523 375 33.427 M-Oriental Commercial Bank Ltd Small 184.98 9,188 646 9,749 461 6.128 National Bank of Kenya Ltd Medium 6,954.97 97,079 17,218 99,229 10,263 2.229 NCBA Bank Kenya Limited Large 24,431.57 360,305 52,384 389,484 27,952 8.130 Paramount Bank Ltd Small 200.02 8,479 648 9,265 448 9.331 Prime Bank Ltd Medium 1,994.84 81,345 8,471 88,548 6,476 8.932 SBM Bank Kenya Ltd Medium 1,935.72 50,573 5,870 56,033 3,934 10.833 Sidian Bank Limited Small 1,532.73 18,014 3,860 22,768 2,328 26.434 Spire Bank Limited Small 305.30 4,553 683 4,793 377 5.335 Stanbic Bank Kenya Ltd Large 5,373.90 205,516 16,804 216,805 11,430 5.536 Standard Chartered Bank Kenya Ltd Large 9,437.28 236,461 29,877 256,498 20,439 8.537 Co-operative Bank of Kenya Ltd Large 44,419.95 330,113 100,384 369,430 55,964 11.938 UBA Kenya Bank Ltd Small 104.50 13,600 341 7,772 236 -42.939 Victoria Commercial Bank Limited Small 408.175 27,350 1,721 28,286 1,313 3.440 Imperial Bank Ltd*41 Chase Bank Kenya Ltd**42 Charterhouse Bank Ltd**
Sub-Totals 273,856 3,631,850 687,182.5 4,011,315.7 384,077.9 18.4Microfinance Banks
1 Faulu Microfinance Bank Ltd Large 1,563.0 20,092 3,804.10 22931.3 2,241 14.12 Kenya Women Microfinance Bank Ltd Large 8,225.0 15,774 8,644 16,335 419 3.63 Rafiki Microfinance Bank Ltd Large 424.9 2576 850 3,027 425 17.54 Century Microfinance Bank Ltd Medium 40.3 256 80 270 40 5.45 SMEP Microfinance Bank Ltd Medium 690.2 2,143 1,129 2,398 438 11.97 Sumac Microfinance Bank Ltd Medium 47.0 631 11 978 (36) 54.96 Muungano Microfinance Bank PLc Small 19 47 19 100.08 Caritas Microfinance Bank Ltd Small 173.3 1353 501 1,943 328 43.69 Choice Microfinance Bank Ltd Small 19.4 83 33 98 14 18.110 Daraja Microfinance Bank Ltd Small 16.6 107 33 97 17 -9.711 KEY Microfinance Bank Ltd Small 28.3 99 42 74 14 -25.612 Maisha Microfinance Bank Ltd Small 50.8 446 48 781 (3) 75.213 U & I Microfinance Bank Ltd Small 31.1 356 55 368 24 3.314 Uwezo Microfinance Bank Ltd Small 13.1 25 509 10 496 -60.5
Sub-Totals 11,323 43,941 11,954.1 26,425.0 2,194.0 10.8Grand total 285,179 3,675,791 699,136.6 4,037,740.8 386,271.9 18.3
*Bank In Receivership**Banks In LiquidationSource: Banks Published Financial Statements (December 2019 and December 2020)

C E N T R A L B A N K O F K E N Y ABANK SUPERVISION ANNUAL REPORT 2020
82
APPENDIX X: MICRO FINANCE BANKS BALANCE SHEET - DECEMBER 2020KENYA WOMEN FAULU RAFIKI* SMEP CARITAS SUMAC KEY U & I UWEZO DARAJA* MAISHA CENTURY MUUNGANO CHOICE* TOTAL
Ksh.M Ksh.M Ksh. M Ksh. M Ksh. M Ksh. M Ksh. M Ksh. M Ksh. M Ksh. M Ksh. M Ksh. M Ksh. M Ksh. M Ksh. M
A) STATEMENT OF FINANCIAL POSITION
1.0 ASSETS
1.1 Cash and bank balances
703 399 79 41 24 15 4 8 1 0 3 2 0 0 1,280
1.2 Short term deposits with banks
4,490 3,099 948 682 643 568 85 72 11 7 195 65 65 6 10,935
1.3 Government securities
- 4,294 - - 15 - - - - - - - - - 4,309
1.4 Advances to customers (net)
16,741 17,561 4,095 1,761 1,411 1,314 98 700 39 2 307 114 29 6 44,179
1.5 Due from related organisations
1.6 Other receivables 413 383 89 390 55 294 34 4 20 29 38 45 1 3 1,797
1.7 Tax recoverable 200 337 53 29 - - 3 - 0 1 - 2 6 - 632
1.8 Deferred tax Asset 448 771 18 78 - 8 76 - 55 71 24 38 4 26 1,616
1.9 Other investment - - - - - - - - - - - - - - -
1.10 Investment in associate companies
1 61 333 - - - - - - - 113 - - - 507
1.11 Intangible assets 336 1,348 60 155 32 62 10 4 17 4 21 1 17 24 2,092
1.12 Property and equipment
5,042 2,374 389 465 137 111 7 21 8 14 985 31 27 13 9,622
TOTAL ASSETS 28,038 29,279 6,005 3,446 2,284 2,310 307 805 134 124 1,665 296 132 54 74,879
2.0 LIABILITIES
2.1 Cash collaterals held - - - - - - - - - - - - 1 - -
2.2 Customer deposits 16,335 22,931 3,027 2,398 1,943 978 74 368 10 97 781 270 47 98 49,356
2.3 Borrowings 7,108 2,017 726 401 - 728 110 236 - - - 9 - 5 11,340
2.4 Deposit & balances due to banking institutions
- - - - - - - - - - - - 1 - 1
2.5 Deferred tax liability - - - - - - - 0.89 - - - - - - 1
2.6 Due to related organisations
- - - - - - - - - - - - 1 - 1
2.7 Other liabilities 2,235 1,423 1,633 214 85 253 15 3 25 75 19 56 15 17 6,069
TOTAL LIABILITIES 25,678 26,371 5,386 3,012 2,028 1,958 199 608 34 172 801 335 63 119 66,766
3.0 SHARE CAPITAL & RESERVES
3.1 Share capital 186 480 2,500 545 610 212 230 151 203 139 1,017 373 91 154 6,890
3.2 Share premium 2,851 2,900 - 2 - 110 16 - - 27 20 - - 5 5,932
3.3 Retained earnings (676) (748) (1,961) (293) (379) 29 (138) 46 (103) (217) (377) (414) (21) (225) (5,479)
3.4 Revaluation reserve - 275 - 154 - - - - - 2 205 - - - 637
3.5 Statutory reserve 0 - 79 26 26 - 0 - - - - 3 - - 133
3.6 Total Shareholders’ funds
2,361 2,907 619 434 256 351 108 197 100 (48) 864 (39) 69 (65) 8,113
TOTAL LIABILITIES AND EQUITY
28,038 29,279 6,005 3,446 2,284 2,310 307 805 134 124 1,665 296 132 54 74,879
*Unaudited Financial Statements
Source: MFBs Published Financial Statements

C E N T R A L B A N K O F K E N Y ABANK SUPERVISION ANNUAL REPORT 2020
83
APPENDIX XI: MICRO FINANCE BANKS PROFIT AND LOSS ACCOUNT - DECEMBER 2020KENYA WOMEN
FAULU RAFIKI* SMEP CARITAS SUMAC KEY U & I UWEZO DARAJA* MAISHA CENTURY MUUNGANO CHOICE* TOTAL
1.0 Income Ksh. M Ksh.M Ksh. M Ksh. M Ksh. M Ksh. M Ksh. M Ksh. M Ksh. M Ksh. M Ksh. M Ksh. M Ksh. M Ksh. M Ksh. M1.1 Interest on Loan
Portfolio4,079 3,948 620 475 172 358 26 106 10 3 101 39 2 6 9,946
1.2 Fees and Commission on Loan Portfolio
513 558 71 56 31 24 1 28 5 0 7 4 2 1 1,301
1.3 Government Securities - 457 - - 1 - - - - - - - - - 458
1.4 Deposit and Balances with Banks and Financial Inst.
199 95 66 31 66 11 7 - - - 9 - 8 - 493
1.5 Other Investments - - 12 - - - - - - - - 1 - 1 14
1.6 Other Operating Income
267 124 117 58 14 6 3 - 1 1 69 9 0 0 669
1.7 Non- Operating Income - 4 - - - - - - 0 - 205 - - - 209
Total Income 5,058 5,185 886 620 285 400 38 135 16 4 390 53 11 9 13,0902.0 Expenses2.1 Interest and Fee
Expense on Deposits858 1,866 171 120 65 101 6 34 0 9 70 27 2 6 3,334
2.2 Other Fees and Commissions expense
66 237 4 - - 10 0 - - - - - 0 - 317
2.3 Provision for Loan Impairment
625 952 (37) 33 1 20 1 5 4 (1) 89 22 0 3 1,719
2.4 Staff Costs 2,215 903 374 241 88 59 25 22 10 11 38 26 10 9 4,029
2.5 Director’s Emoluments 170 12 5 7 5 12 0 6 1 1 2 4 1 - 227
2.6 Rental Charges 382 139 112 24 6 20 4 4 5 4 5 1 1 4 710
2.7 Depreciation Charges 332 275 87 28 33 11 1 3 2 2 5 8 3 2 791
2.8 Amortization Charges 40 91 2 17 1 6 0 0 3 2 7 5 3 3 179
2.9 Other Administrative Expense
1,187 770 181 201 75 42 17 19 13 16 111 20 6 7 2,665
2.1 Non-Operating Expense
- - - - - - - 3 1 - - - - - 3
Total Expenses 5,874 5,244 899 671 274 281 54 96 40 44 326 112 26 34 13,9743.0 Operating Profit (816) (59) (14) (51) 11 119 (17) 39 (23) (40) 65 (59) (15) (25) (884)4.0 Interest and Fee
Expense on Borrowings (Finance Costs)
691 417 46 47 6 108 17 21 - - - 2 - 0 1,356
5.0 Profit/(Loss) before tax (1,507) (476) (60) (98) 5 11 (34) 18 (23) (40) 65 (60) (15) (26) (2,240)
6.0 Current Tax - 118 (18) - - 4 - 6 - - - - - - 110
6.1 Deferred Tax - (195) - (29) - - - 0 (6) - - - - - (230)
7.0 Net Profit (After Taxes and Before Donations)
(1,507) (399) (42) (69) 5 7 (34) 12 (18) (40) 65 (60) (15) (26) (2,120)
8.0 Donations for Operating Expense
22 - - - - - - - - - - - - - -
9.0 Net Profit After Taxes (1,485) (399) (42) (69) 5 7 (34) 12 (18) (40) 65 (60) (15) (26) (2,120)
Other Comprehensive Income
- - - - - - - - - - - - - - -
Surplus on revaluation of building
- - - - - - - - - - - - - - -
Deferred tax on revaluation surplus
- - - - - - - - - - - - - - -
Total comprehensive income
(1,485) (399) (42) (69) 5 7 (34) 12 (18) (40) 65 (60) (15) (26) (2,120)
*Unaudited Financial Statements
Source: MFBs Published Financial Statements

C E N T R A L B A N K O F K E N Y ABANK SUPERVISION ANNUAL REPORT 2020
84
APPENDIX XII: MICRO FINANCE BANKS OTHER DISCLOSURES - DECEMBER 2020KENYA WOMEN
FAULU RAFIKI* SMEP CARITAS SUMAC KEY U & I UWEZO DARAJA* MAISHA CENTURY MUUNGANO CHOICE* TOTAL
1 NON-PERFORMING LOANS AND ADVANCES
Ksh. M Ksh. M Ksh. M Ksh. M Ksh. M Ksh. M Ksh. M Ksh. M Ksh. M Ksh. M Ksh. M Ksh. M Ksh. M Ksh. M Ksh.M
(a) Gross Non-Performing Loans and Advances
4,784 4,086 2,648 465 128 425 86 39 62 16 160 73 0 8 12,980
(b) Less: Interest in Suspense
668 606 1,107 155 20 - - 9 - 18 - 25 - 3 2,611
(c) Total Non-Performing Loans and Advances (a-b)
4,116 3,480 1,540 311 108 425 86 31 62 (2) 160 48 0 5 10,369
(d) Less: Impairment Loss Allowance
365 3,122 409 307 65 95 53 16 32 (1) 169 30 0 8 4,670
(e) Net Non-Performing Loans (c-d)
3,751 358 1,132 3 43 330 33 15 30 (2) (9) 18 - (3) 5,699
2 INSIDER LOANS AND ADVANCES(a) Directors,
Shareholders and Associates
163 31 - 9 1 6 1 5 2 - - - 1 - 220
(b) Employees 299 468 35 7 48 13 7 10 - 0 11 5 1 4 907
(c) Total Insider Loans, Advances and Other Facilities
462 499 35 16 49 19 8 15 2 0 11 5 2 4 1,127
3 OFF-BALANCE SHEET ITEMS(a) Guarantees and
Commitments92 157 4,028 - - - - - - - 214 - - - 4,491
(b) Other Contingent Liabilities
32 1,048 - - - - - - - - - - - - 1,080
(c) Total Contingent Liabilities
124 1,205 4,028 - - - - - - - 214 - - - 5,570
4 CAPITAL STRENGTH(a) Core Capital 1,911 1,800 539 147 231 332 32 197 44 (121) 436 (41) 80 (93) 5,494
(b) Minimum Statutory Capital
60 60 60 60 60 60 60 60 60 20 60 60 20 20 720
(c) Excess/(Deficiency) (a-b)
1,851 1,740 479 87 171 272 (28) 137 (16) (141) 376 (101) 60 (113) 4,774
(d) Supplementary Capital
1,473 69 104 - 26 - - - - 2 - - - 1,674
(e) Total Capital (a+d) 3,385 1,869 642 147 256 332 32 197 44 (119) 436 (41) 80 (93) 7,168
(f) Total Risk Weighted Assets
20,848 19,715 5,341 2,444 1,712 1,832 234 571 68 47 1,499 240 80 78 54,709
(g) Core Capital/ Total Deposit Liabilities (%)
12 8 18 6 12 34 43 54 451 -125 56 -15 170 -95 11
(h) Minimum Statutory Ratio (%)
8 8 8 8 8 8 8 8 8 8 8 8 8 8 8
(i) Excess/(Deficiency) (g-h) (%)
4 0 10 -2 4 26 35 46 443 -133 48 -23 162 -103 3
(j) Core Capital/ Total Risk Weighted Assets (%)
9 9 10 6 13 18 13 35 65 -259 29 -17 100 -120 10
(k) Minimum Statutory Ratio (%)
10 10 10 10 10 10 10 10 10 10 10 10 10 10 10
(l) Excess/(Deficiency) ( j-k) (%)
-1 -1 0 -4 3 8 3 25 55 -269 19 -27 90 -130 0
(m) Total Capital/ Total Risk Weighted Assets (%)
16 9 12 6 15 18 13 35 65 -254 29 -17 100 -120 13
(n) Minimum Statutory Ratio (%)
12 12 12 12 12 12 12 12 12 12 12 12 12 12 12
(O) Excess/(Deficiency) (m-n) (%)
4 -3 0 -6 3 6 1 23 53 -266 17 -29 88 -132 1
5 LIQUIDITY(a) Liquidity Ratio (%) 20 29 31 23 35 37 31 22 95 6 25 23 138 1 37
(b) Minimum Statutory Ratio (%)
20 20 20 20 20 20 20 20 20 20 2 20 20 20 20
(c) Excess/(Deficiency) (a-b) (%)
0 9 11 3 1 17 11 22 75 -14 5 3 118 -19 17
* Unaudited Financial Statements
Source: MFBs Published Financial Statements

C E N T R A L B A N K O F K E N Y ABANK SUPERVISION ANNUAL REPORT 2020
85
APPENDIX XIII: RESIDENTIAL MORTGAGES MARKET SURVEY DECEMBER 2020December 2019 December 2020
Institution Peer Group
Mortgage Outstanding (Ksh. M)
% of the Mortgage Market
No. of Mortgage Accounts
Value of Mortgage Loans NPLs (Ksh. M)
Number of Accounts for Mortgage Loans NPLs
Mortgage Outstanding (Ksh. M)
% of the Mortgage Market
Number of Mortgage Accounts
Value of Mortgage Loans NPLs (Ksh. M)
Number of Accounts for Mortgage Loans NPLs
1 KCB Bank Kenya Ltd Large 66,134.0 27.8 8,404 5,143.0 559 69,063.0 29.7 8,837 6,040.0 795
2 Stanbic Bank Kenya Limited Large 28,380.0 11.9 2,224 1,830.0 201 30,541.0 13.1 2,344 2,597.0 258
3 HFC Ltd Medium 40,066.0 16.9 4,717 11,652.0 533 26,092.0 11.2 4,101 4,398.0 209
4 Standard Chartered Bank Kenya Limited
Large 21,983.0 9.3 2,042 669.0 97 21,422.1 9.2 1,942 1,142.0 120
5 Absa Bank Kenya Limited Large 12,594.0 5.3 1,242 423.0 49 14,298.0 6.1 1,371 449.0 63
6 The Co-operative Bank of Kenya Limited
Large 11,646.0 4.9 1,274 1,656.0 94.00 11,884.0 5.1 1,285 2,071.0 142.00
7 Equity Bank Ltd Large 10,872.0 4.6 1,955 1,052.0 198 11,529.0 5.0 1,898 1,225.0 212
8 NCBA Bank Ltd Large 10,133.0 4.3 1,283 789.0 87 11,102.0 4.8 1,371 1,640.0 177
9 Family Bank Ltd Medium 7,161.8 3.0 863 834.5 81 7,656.3 3.3 965 1,212.4 105
10 DIB Bank Kenya Ltd Small 2,163.9 0.9 70 55.3 3 3,716.0 1.6 90 60.0 6
11 Development Bank of Kenya Limited
Small 2,950.0 1.2 617 875 90.00 3,092.4 1.3 473 807 62.00
12 SBM Bank Kenya Limited Medium 3,239.6 1.4 199 2,276.8 98 3,049.4 1.3 149 2,427.4 89
13 I&M Bank Ltd Large 2,546.0 1.1 314 387.0 37 2,866.0 1.2 307 537.0 39
14 First Community Bank Ltd Small 2,108.0 0.9 218 727.0 40 2,415.8 1.0 221 698.7 37
15 Bank of Africa Ltd Medium 2,996.0 1.3 374 52.0 6 2,285 1.0 182 123.0 28
16 National Bank of Kenya Ltd Medium 1,953.0 0.8 324 142.0 21 2,163.0 0.9 342 189.0 25
17 Bank of Baroda Ltd Small 1,268.8 0.5 128 35.9 2 1,563.0 0.7 142 91.0 6
18 Kingdom Bank Ltd Small 1,294.6 0.5 223 840.2 82 1,194.5 0.5 203 853.9 109
19 Diamond Trust Bank of Kenya Ltd
Large 980.0 0.4 90 52.0 6 1,118.3 0.5 100 68.3 9
20 Sidian Bank Ltd Small 621.0 0.3 109 211.0 47 984.0 0.4 149 135.0 28
21 Consolidated Bank of Kenya Limited
Small 2,272.3 1.0 293 621.8 48 869.4 0.4 153 169.7 36
22 Guardian Bank Ltd Small 880.0 0.4 32.00 259.0 150 793.0 0.3 27 299.0 3
23 African Banking Corpora-tion Ltd
Small 707.4 0.3 658 75.8 6 764.6 0.3 92 96.4 7
24 Ecobank Kenya Ltd Medium 550.6 0.2 84 52.0 645 533.4 0.2 70 56.4 14
25 Gulf African Bank Ltd Small 751.0 0.3 154 - - 385.6 0.2 61 39.1 9
26 Spire Bank Ltd Small 390.8 0.2 21.00 183.4 5.00 322.9 0.1 20 248.3 8.00
27 Bank of India Medium 252.7 0.1 22 - - 288.9 0.1 23 - -
28 Victoria Commercial Bank Ltd Small 328.0 0.1 14 17.0 1.00 276.0 0.1 11 90.0 3.00
29 Paramount Bank Ltd Small 254.0 0.1 19 18.0 3 246.0 0.1 21 22.0 3
30 Prime Bank Ltd Medium 195.0 0.1 21 10.0 1 164.0 0.1 17 9.0 1
31 Middle East Bank Kenya Limited
Small 42.0 0.0 5 34.0 3 22.0 0.0 4 13.0 1
32 Habib Bank A.G. Zurich Small - - - - - - - -
33 M-Oriental Commercial Bank Ltd
Small - - - - - - - -
34 Access Bank Ltd Small - - - - - - - -
35 Mayfair CIB Bank Kenya Ltd Small - -
Banks not offering Mortgage Loans
32 Citibank N.A. Kenya Medium - - - - - - -
33 Guaranty Trust Bank Ltd Small - - - - - - -
34 Credit Bank Ltd Small - - - - - - -
39 UBA Kenya Bank Ltd Small
Total 237,715 100.0 27,993 30,974 3,193 232,700 100 26,971 27,808 2,604
Average Mortgage Loan Size (Mortgage outstanding loans/Number of mortgage accounts)
8.5 8.6
Source: Commercial Banks and Mortgage Finance Companies

C E N T R A L B A N K O F K E N Y ABANK SUPERVISION ANNUAL REPORT 2020
86
APPENDIX XIV: BANKING CIRCULARS ISSUED IN 2020Circular No.
Date Title Purpose
1 January 27, 2020 Review of the Central Bank Rate (CBR) To inform the financial institutions on the revised CBR and the Central Bank Window Rate.
2 March 25, 2020 Activation of precautionary measures to ensure business continuity and mitigate pandemic risk
To ensure institutions review and update their Business Continuity Plans (BCPs) to ensure continuity of opera-tions.
3 March 27, 2020 Implementation of the emergency measures to mitigate the adverse impact of corona virus (COVID 19) pandemic on loans and advances
To provide guidance to commercial banks and mort-gage finance companies on the implementation of the recommended emergency measures on extended and restructured loans.
4 March 27, 2020 Review of the Cash Reserve Ratio (CRR) To provide guidance on how to access the additional liquidity following the reduction of the CRR from 5.25 to 4.25 percent.
5 March 27, 2020 Guidance Note on Pandemic Planning for the banking sector
To provide guidance on pandemic planning for the banking sector.
6 March 30, 2020 Extension of Reverse REPO tenors To advise commercial banks on the extension of Reverse Repos from 28 to 91 days which enables them access longer term liquidity.
7 April 14, 2020 Temporary suspension of exchange of some aspects of negative credit information
To direct financial institutions to comply with the directives published by the Cabinet Secretary, National Treasury and Planning on negative credit information.
8 April 14, 2020 Submission of credit information by digital lenders and credit only microfinance insti-tutions
To direct credit reference bureaus to terminate data submission arrangements with the unregulated digital lenders and credit only micro-finance institutions.
9 May 4, 2020 Review of the Central Bank Rate (CBR) To inform the financial institutions on the revised CBR and the Central Bank Window Rate.
10 May 19, 2020 Anti-Money Laundering and Combating the Financing of Terrorism requirements relating to safety deposit boxes/lockers
To ensure that the financial institutions ascertain the contents of the safety deposit boxes in their custody in order to minimize the risk of these boxes being used to perpetrate illegal activities.
11 August 14, 2020 Internal Capital Adequacy Assessment Process (ICAAP) by commercial banks and mortgage finance companies during the COVID-19 pandemic
To ensure that the financial institutions remain resilient by strengthening their capital levels that would guaran-tee continuity of operations.
12 September 1, 2020 Fraudulent and Unlicensed Financial Schemes
To ensure that the financial institutions review their customer databases to ensure they do not hold accounts with fraudulent entities and schemes.

C E N T R A L B A N K O F K E N Y ABANK SUPERVISION ANNUAL REPORT 2020
87
APPENDIX XV: A Summary of Signed MOUsNo. Memorandum of Understanding (MOU) Date of Signing
1 Multilateral MOU by the Central Banks of the East African Community member states (Bank of the Republic of Burundi (BRB), Central Bank of Kenya (CBK), National Bank of Rwanda (NBR), Bank of Uganda (BOU) and Bank of Tanzania (BOT)
28.01.2009Amended in March 2016
2 Multilateral MOU by the Domestic Financial Sector Regulators (Capital Markets Authority, Central Bank of Kenya (CBK), Insurance Regulatory Authority (IRA) and Retirement Benefits Authority (RBA)
31.08.2009Amended on 28.08.2013
3 Bilateral MOU between South Africa Reserve Bank (SARB) and Central Bank of Kenya (CBK) 01.07.2010
4 Bilateral MOU between Central Bank of Nigeria (CBN) and Central Bank of Kenya (CBK) 23.06.2011
5 Bilateral MOU between Bank of Mauritius (BoM) and Central Bank of Kenya (CBK) 08.08.2011
6 Bilateral MOU on Technical Cooperation between the Bank of Southern Sudan and the Central Bank of Kenya
19.12.2012
7 Bilateral MOU between Reserve Bank of Malawi (RBM) and Central Bank of Kenya (CBK) 23.04.2013
8 Bilateral MOU between Reserve Bank of Zimbabwe (RBZ) and Central Bank of Kenya (CBK) 15.05.2013
9 Bilateral MOU between Bank of Zambia (BoZ) and Central Bank of Kenya (CBK) 12.06.2013
10 Bilateral MOU between the Financial Reporting Centre and Central Bank of Kenya (CBK) 30.09.2013
11 Bilateral MOU between the Reserve Bank of India and Central Bank of Kenya (CBK) 16.10.2014

C E N T R A L B A N K O F K E N Y ABANK SUPERVISION ANNUAL REPORT 2020
88
APPENDIX XVI :BANKS BRANCH NETWORK PER COUNTY County December 2019 December 2020 Increase/(Decrease)
1 Baringo 10 9 -12 Bomet 8 9 13 Bungoma 15 16 14 Busia 10 10 05 Elgeyo/Marakwet 6 6 06 Embu 10 10 07 Garissa 9 9 08 Homa Bay 9 9 09 Isiolo 7 7 0
10 Kajiado 46 44 -211 Kakamega 17 18 112 Kericho 17 17 013 Kiambu 74 76 214 Kilifi 34 35 115 Kirinyaga 16 17 1
16 Kisii 22 21 -117 Kisumu 39 40 118 Kitui 15 15 019 Kwale 12 12 020 Laikipia 18 20 221 Lamu 9 9 022 Machakos 30 29 -123 Makueni 14 16 224 Mandera 3 3 025 Marsabit 7 7 026 Meru 39 40 127 Migori 13 14 128 Mombasa 123 121 -229 Murang’a 20 20 030 Nairobi City 593 597 431 Nakuru 62 61 -132 Nandi 12 12 033 Narok 15 15 034 Nyamira 5 6 135 Nyandarua 10 9 -136 Nyeri 29 29 037 Samburu 3 3 038 Siaya 7 8 139 Taita/Taveta 10 9 -140 Tana River 3 3 041 Tharaka-Nithi 7 7 042 Trans Nzoia 14 14 043 Turkana 7 7 044 Uasin Gishu 46 49 345 Vihiga 7 6 -1
46 Wajir 4 4 047 West Pokot 4 4 0
Total 1,490 1,502 12

C E N T R A L B A N K O F K E N Y ABANK SUPERVISION ANNUAL REPORT 2020
89
NO. Appendix XVII: DIRECTORY OF COMMERCIAL BANKS, MORTGAGE FINANCE COMPANIES, KENYA BANKERS ASSOCIATION, NON-OPERATING HOLDING COMPANIES AND AUTHORISED REPRESENTATIVE OFFICES
1 Absa Bank Kenya PlcManaging Director: Mr. Jeremy AworiPostal Address: P.O. Box 30120 - 00100Telephone numbers: +254 (20) 4254000Fax: +254 (20) 4455491Email: [email protected]: www.absabank.co.kePhysical Address: ABSA Bank, Westend Building, Off Waiyaki Way, NairobiDate Licensed: 1916Peer Group: LargeNumber of Branches: 107
2 Access Bank (Kenya) PlcManaging Director: Mr. David AlukoPostal Address: P.O. Box 34353 - 00100 NairobiTelephone: 020-2252188/91, 0780022224, 0720081772Fax: +254-20-2252225Email: [email protected]: www.accessbankplc.comPhysical Address: Transnational Plaza, Mama Ngina Street, NairobiDate Licensed: 8/1/1985Peer Group: SmallBranches: 28
3 African Banking Corporation LimitedGroup Managing Director: Mr. Shamaz SavaniPostal Address: P.O. Box 46452-00100, NairobiTelephone: +254-20- 4263000, 223922, 2251540/1, 217856/7/8.Fax: +254-20-2222437Email: [email protected]; [email protected]: http://www.abcthebank.comPhysical Address: ABC Bank House, Woodvale Grove, Westlands, NairobiDate Licensed: 08-12-1984Peer Group: SmallBranches: 12
4 Bank of Africa Kenya LimitedManaging Director: Mr. Ronald Marambii Postal Address: P.O. Box 69562-00400Telephone numbers: +254 20 3275000Email: [email protected]: www.boakenya.comFacebook: Bank of Africa KenyaTwitter: BankofAfrica_KePhysical Address: BOA House, Karuna Close, Off Waiyaki Way, Westlands, NairobiDate Licensed: 22-07-2004 Peer Group: SmallNumber of Branches: 31
5 Bank of Baroda (Kenya) LtdManaging Director: Mr. Saravanakumar AppavuPostal Address: P.O. Box 300333-00100 NairobiTelephone numbers: +254(20)2248402/2248412/2226416Fax: +254(20)3316070/310439Email: [email protected]: [email protected] Address: Baroda House, 29 Koinange Street, NairobiDate Licensed: 01-07-1953Peer Group: Medium Number of Branches: 13
6 Bank of IndiaChief Executive Officer: Sharda Bhushan RaiPostal Address: P.O. Box 30246 - 00100 NairobiTelephone: +254-20-2221414/5/6/7,0720606707, 0734636737Fax: +254-20-2221417Email: [email protected]: www.boikenya.comPhysical Address: Bank of India Building, Kenyatta Avenue, Nairobi Date Licensed: 05-06-1953Peer Group: MediumBranches: 5

C E N T R A L B A N K O F K E N Y ABANK SUPERVISION ANNUAL REPORT 2020
90
NO. Appendix XVII: DIRECTORY OF COMMERCIAL BANKS, MORTGAGE FINANCE COMPANIES, KENYA BANKERS ASSOCIATION, NON-OPERATING HOLDING COMPANIES AND AUTHORISED REPRESENTATIVE OFFICES
7 Charterhouse Bank LtdIN LIQUIDATION17th Floor UAP Old Mutual Towers, Upper Hill, NairobiPostal Address: P.O. Box 45983-00100 Nairobi, KenyaEmail: [email protected] +254 20 66 77 000, +254 709 043 000www.kdic.go.keDate Licensed: 11-11-1996
8 Chase Bank (K) LimitedIN LIQUIDATION17th Floor UAP Old Mutual Towers, Upper Hill, NairobiPostal Address: P.O. Box 45983-00100 Nairobi, KenyaEmail: [email protected] +254 20 66 77 000, +254 709 043 000www.kdic.go.keDate Licensed:1st April, 1996
9 Citibank N.A KenyaChief Executive Officer: Mr. Martin MugambiPostal Address: P.O. Box 30711-00100 Nairobi, KenyaTelephone numbers: +254 020 2754444Email: [email protected]: https://citigroup.com/citi/about/countrypresence/kenya.htmlPhysical Address: Citibank House, Upper Hill, NairobiDate Licensed: 01-07-1974Peer Group: MediumNumber of Branches: 3
10 Consolidated Bank of Kenya LtdAg. Chief Executive Officer: Mr. Japheth Kisilu Postal Address: P.O. Box 51133-00200, Nairobi.Telephone numbers: +254 20 3215000, +254 703 016 000Email: [email protected]: www.consolidated-bank.comPhysical Address: Consolidated Bank House, 6th Floor, Koinange Street, NairobiDate Licensed: 18-12-1989Peer Group: SmallNumber of Branches: 17
11 Co-operative Bank of Kenya LimitedGroup Managing Director: Dr. Gideon Muriuki, CBSPostal Address: P.O. Box 48231-00100Telephone numbers: 020-3276000, 0703027000Email: [email protected]: www.co-opbank.co.kePhysical Address: Co-operative Bank House, Haile Selassie Avenue, NairobiDate Licensed: 1968Peer Group: LargeBranches: 156
12 Credit Bank LimitedChief Executive Officer: Ms. Betty C. Maritim-KorirPostal Address: P.O. Box 61064, NairobiTelephone: +254 20 2283000 /+254 709072000 / +254 738 222300Fax: +254-20-2216700Email: [email protected]: www.creditbank.co.kePhysical Address: Mercantile House, Ground Floor, Koinange Street, NairobiDate Licensed: 30-11-1994Peer Group: SmallBranches: 18
13 Development Bank of Kenya Ltd.Chief Executive Officer: Mr. Victor J.O KidiwaPostal Address: P.O. Box 30483 - 00100, NairobiTelephone: +254-20-340401/2/3, 340416, 2251082, 340198Fax: +254-20-2250399Email: [email protected]: www.devbank.comPhysical Address: Finance House, 16th Floor, Loita Street, NairobiDate Licensed: 20-09-1996Peer Group: SmallBranches: 2

C E N T R A L B A N K O F K E N Y ABANK SUPERVISION ANNUAL REPORT 2020
91
NO. Appendix XVII: DIRECTORY OF COMMERCIAL BANKS, MORTGAGE FINANCE COMPANIES, KENYA BANKERS ASSOCIATION, NON-OPERATING HOLDING COMPANIES AND AUTHORISED REPRESENTATIVE OFFICES
14 DIB Bank Kenya LimitedChief Executive Officer: Mr. Peter M. MakauPostal Address: P.O. Box 6450 – 00200 NairobiTelephone numbers: +254 20 513 1300 / +254 709 913 000Fax: N/AEmail: [email protected]: www.dibkenya.co.kePhysical Address: Upper Hill Building, Bunyala/Lower Hill Rd Junction, NairobiDate Licensed: 13-4-2017Peer Group: SmallNumber of Branches: 5
15 Diamond Trust Bank (K) Ltd.Group CEO and Managing Director: Mrs. Nasim M. DevjiPostal Address: P.O. Box 61711 – 00200, NairobiTelephone: +254-20-2849000, +254 719 031 888, +254 732 121 888 Fax: +254-20-2245495Email: [email protected]: https://dtbk.dtbafrica.com Physical Address: DTB Centre, Mombasa Road, NairobiDate Licensed: 1-1-1946Peer Group: LargeBranches: 70
16 Ecobank Kenya LimitedManaging Director: Mr. Cheikh Mohamed TravalyPostal Address: P.O. Box 49584 - 00100 Nairobi, KenyaTelephone numbers: (+254) 719 098 000, Toll Free 0800 221 2218Fax: +254 020 2883304Email: [email protected]: www.ecobank.comPhysical Address: Fortis Office Park, Muthangari Drive Off Waiyaki Way, NairobiDate Licensed: 16-06-2008Peer Group: MediumNumber of Branches: 18
17 Equity Bank Kenya LimitedManaging Director: Mr. Gerald WaruiPostal Address: P.O. Box 75104-00200, NairobiTelephone numbers: +254 (0) 763 063 000Fax: +254 020-2711439Email: [email protected]: www.ke.equitybankgroup.comPhysical Address: Equity Centre, Upper Hill, Hospital Road, NairobiDate Licensed: 28-12-2004Peer Group: LargeBranches:190
18 Family Bank LimitedManaging Director and CEO: Ms. Rebecca MbithiPostal Address: P.O. Box 74145-00200, NairobiTelephone numbers: +254 703 095 445 / +254 705 325 325 / +254 703 095 000Email: [email protected]: www.familybank.co.kePhysical Address: Family Bank Tower, Muindi Mbingu Street, NairobiDate Licensed: 01-05-2007Peer Group: MediumNumber of Branches: 92
19 First Community Bank LtdChief Executive: Dr. Hussein Assad Ahmed HassanPostal Address: P.O. Box 26219-00100, NairobiTelephone numbers:020-2843000Fax: N/AEmail: [email protected]: www.first communitybank.co.kePhysical Address: FCB Mihrab, Mezzanine 1 Lenana Road/Ring Road Kilimani, NairobiDate Licensed: 29-04-2008Peer Group: SmallNumber of Branches:18

C E N T R A L B A N K O F K E N Y ABANK SUPERVISION ANNUAL REPORT 2020
92
NO. Appendix XVII: DIRECTORY OF COMMERCIAL BANKS, MORTGAGE FINANCE COMPANIES, KENYA BANKERS ASSOCIATION, NON-OPERATING HOLDING COMPANIES AND AUTHORISED REPRESENTATIVE OFFICES
20 Guaranty Trust Bank (Kenya) Limited Managing Director: Mr. Olubayo VeracruzPostal Address: P.O. Box 20613-00200, NairobiTelephone numbers: +254 020 3284000 / 0703084000Fax: N/AEmail: [email protected]: www.gtbank.co.kePhysical Address: Plot 1870/IX/167, Sky Park, Westlands, NairobiDate Licensed: 13-01-1995Peer Group: SmallNumber of Branches: 9
21 Guardian Bank LimitedChief Executive Officer: Mr. Narayanamurthi SabesanPostal Address: P.O. Box 67437 – 00200, Nairobi Telephone numbers:(+254) 020 2226771/4 Mobile:0722282213 / 0733888060Email: [email protected]:www.guardian-bank.comPhysical Address: Guardian Centre, Biashara Street, NairobiDate Licensed: 20-12-1995Peer Group: SmallNumber of Branches: 10
22 Gulf African Bank LimitedChief Executive Officer: Mr. Abdalla AbdulkhalikPostal Address: P.O. Box 43683 - 00100 Nairobi, KenyaTelephone numbers: Tel: +254-20-2740000/0711-075000Fax: N/AEmail: [email protected]: http://www.gulfafricanbank.comPhysical Address: Geminia Insurance Plaza, Upper Hill, NairobiDate Licensed: 01-11-2007Peer Group: SmallNumber of Branches: 17
23 Habib Bank AG ZurichChief Executive Officer: Mr. Asim BasharullahPostal Address: P.O. Box 30584 - 00100, NairobiTelephone numbers: 020-3341172/6/7Fax: 020- 2218699Email: [email protected]: www.habibbank.comPhysical Address: Habib House, Koinange Street, NairobiDate Licensed: 01-07-1978Peer Group: SmallNumber of Branches: 4
24 Imperial Bank LtdIN-RECEIVERSHIP17th Floor UAP Old Mutual Towers, Upper Hill, NairobiPostal Address: P.O. Box 45983 – 00100, KenyaEmail: [email protected]+254 20 66 77 000, +254 709 043 000www.kdic.go.ke Date Licensed: 08-12-1994Peer Group: MediumBranches: 1
25 I&M Bank LtdChief Executive Officer: Mr. Christopher M. KiharaPostal Address: P.O. Box 30238 – 00100, Nairobi Telephone: +254 20 322 1000, +254 719 088 000, +254 732 100 000Fax: +254-20-2713757 / 2716372Email: [email protected]: http://www.imbank.comPhysical Address: 1 Park Avenue, First Parklands Avenue Date Licensed: 1-1-1974Peer Group: LargeBranches: 40

C E N T R A L B A N K O F K E N Y ABANK SUPERVISION ANNUAL REPORT 2020
93
NO. Appendix XVII: DIRECTORY OF COMMERCIAL BANKS, MORTGAGE FINANCE COMPANIES, KENYA BANKERS ASSOCIATION, NON-OPERATING HOLDING COMPANIES AND AUTHORISED REPRESENTATIVE OFFICES
26 Kingdom Bank Kenya Ltd Chief Executive Officer: Mr. Anthony MburuPostal Address: P.O. Box 22742 - 00400, NairobiTelephone numbers: 0709881000Fax: N/AEmail: [email protected]: www.kingdombank.co.kePhysical Address: Kingdom Bank Towers, Argwings Kodhek Rd, NairobiDate Licensed: 02-03-2010Peer Group: Small Number of Branches: 20
27 KCB Bank Kenya LimitedChief Executive Officer: Mr. Joshua OigaraPostal Address: P.O. Box 48400 – 00100, Nairobi Telephone numbers: +254 20 3270000, 2852000, 2851000, +254 711012000/ 734 108200Email: [email protected]: www.kcbgroup.comPhysical Address: Kencom House, Moi Avenue, NairobiDate Licensed:01-01-1896 Peer Group: LargeBranches: 203
28 Mayfair CIB Bank LimitedManaging Director: Mr. Joram KiariePostal Address: P.O. Box 2051-00606, NairobiTelephone numbers: +254 20 3951 000/ + 254 709 063 000Fax: N/AEmail: [email protected]: www.mayfair-bank.comPhysical Address: KAM House, Mezzanine Floor, Mwanzi Road, Westlands, NairobiDate Licensed: 20-06-2017Peer Group: SmallBranches: 5
29 Middle East Bank Kenya LimitedManaging Director: Mr. Isaac Mwige Postal Address: P.O. Box 47387-00100, NairobiTelephone numbers: +254 020 2723130Fax: N/AEmail: [email protected]:www.mebkenya.comPhysical Address: Mebank Tower, Jakaya Kikwete Road (formerly Milimani Road), NairobiDate Licensed:15-12-1980Peer Group: SmallBranches: 4
30 M Oriental Bank LimitedManaging Director: Mr. Alakh KohliPostal Address: P.O. Box 44080-00100 Telephone numbers: 0722 209 585/ 0734 333 291Email: [email protected]: www.moriental.co.kePhysical Address: Finance House, 7 Koinange Street, NairobiDate Licensed: 08-02-1991Peer Group: SmallNumber of Branches: 7
31 National Bank of Kenya LtdManaging Director and CEO: Mr. Paul RussoPostal Address: P.O. Box 72866 - 00200 NairobiTelephone: 020 282 8900, 0703 088 900, 0732 118 900Fax: +254-20-311444/2223044Email: [email protected]: www.nationalbank.co.kePhysical Address: National Bank Building, Harambee Ave, NairobiDate Licensed:01-01-1968Peer Group: MediumBranches: 78

C E N T R A L B A N K O F K E N Y ABANK SUPERVISION ANNUAL REPORT 2020
94
NO. Appendix XVII: DIRECTORY OF COMMERCIAL BANKS, MORTGAGE FINANCE COMPANIES, KENYA BANKERS ASSOCIATION, NON-OPERATING HOLDING COMPANIES AND AUTHORISED REPRESENTATIVE OFFICES
32 NCBA Bank PlcChief Executive Officer: Mr. John GachoraPostal Address: P.O. Box 30437-00100, Nairobi, KenyaTelephone numbers: 020-2884000Email: contact @ncbagroup.com Website: www.ncbagroup.comPhysical Address: NCBA Center, Mara/Ragati Roads, Upper Hill, NairobiDate Licensed: 1-1-1967Peer Group: LargeBranches: 82
33 Paramount Bank LimitedChief Executive Officer: Mr. Ayaz A. MeraliPostal Address: P.O. Box 14001-00800, Nairobi Telephone numbers: 020 4449266/7 or 0709 935000Fax: 020-4449265Email: [email protected]: www.paramountbank.co.kePhysical Address: Sound Plaza, Woodvale Grove Road, NairobiDate Licensed:05-07-1995Peer Group: SmallNumber of Branches: 8
34 Prime Bank LtdChief Executive Officer: Mr. Bharat JaniPostal Address: P.O. Box 43825- 00100Telephone numbers: (020) 4203000/4203116/4203148Fax: 020-4451247Email: [email protected]: www.primebank.co.kePhysical Address: Prime Bank Building – Riverside Drive, NairobiDate Licensed: 03-09-1992Peer Group: MediumNumber of Branches: 22
35 SBM Bank (Kenya) LtdManaging Director: Mr. Moezz Mahmood Mir Postal Address: P.O. Box 34886, NairobiTelephone: (254) (20) 2242348 / 2248842 / 2244187Fax: +254-20-2243389/[email protected]: https://www.sbmgroup.mu/Physical Address: Riverside Mews, NairobiDate Licensed:07-03-1996Peer Group: MediumBranches: 53
36 Sidian Bank LimitedChief Executive Officer: Mr. Chege ThumbiPostal Address: P.O. Box 25363 – 00603, NairobiTelephone: (+254)0711-058000, (+254)0732-158000, +254)020-3906000Fax: +254-20-3873178 / 3568998Email: [email protected]: www.sidianbank.co.kePhysical Address: K-Rep Centre Wood Avenue, Kilimani, NairobiDate Licensed: 23-03-1999Peer Group: SmallBranches: 42
37 Spire Bank Ltd Ag. Managing Director: Mr. Brian KilonzoPostal Address: P.O. Box 52764 - 00200Telephone numbers: +254 -020- 4981000Email: [email protected]: spirebank.co.kePhysical Address: Mwalimu Towers, Hill Lane, Upper Hill, NairobiDate Licensed: 23-06-1995Peer Group: SmallBranches: 12

C E N T R A L B A N K O F K E N Y ABANK SUPERVISION ANNUAL REPORT 2020
95
NO. Appendix XVII: DIRECTORY OF COMMERCIAL BANKS, MORTGAGE FINANCE COMPANIES, KENYA BANKERS ASSOCIATION, NON-OPERATING HOLDING COMPANIES AND AUTHORISED REPRESENTATIVE OFFICES
38 Stanbic Bank Kenya LimitedChief Executive Officer: Mr. Charles MudiwaPostal Address: P.O. Box 72833 - 00200 NairobiTelephone: +254-20-36380000. /11 /17 /18 /20 /21, 0711-0688000Fax: +254-20-3752905/7Email: [email protected]: https://www.stanbicbank.co.kePhysical Address: Stanbic Bank Centre, Westlands Road, Chiromo, NairobiDate Licensed: 5/14/1955Peer Group: LargeBranches: 26
39 Standard Chartered Bank Kenya LimitedChief Executive Officer: Mr. Kariuki NgarePostal Address: P.O. Box 30003, 00100, Nairobi, KenyaTelephone numbers: +254 (0)20 3293000Fax: +254 (0)20 3747880Email: [email protected]:www.sc.com/kePhysical Address: Standard Chartered Building, Chiromo 48, Westlands Road, NairobiDate Licensed: 10-1-1910Peer Group: LargeNumber of Branches: 26
40 UBA Kenya Bank LimitedAg. Chief Executive Officer: Mr. Kehinde L. OmirindePostal Address: P.O. Box 34154 00100 NairobiTelephone numbers: +254 711027099 / +254 203612099Fax: N/AEmail: [email protected]: https://www.ubagroup.com/countries/kePhysical Address: 1st Floor, Apollo Centre, Vale Close, Ring Road, Westlands, NairobiDate Licensed: 25-09-2009Peer Group: SmallNumber of Branches: 3
41 Victoria Commercial Bank LimitedManaging Director: Dr. Yogesh PattniPostal Address: P.O. Box 41114-00100Telephone numbers: 0709 876100 Fax: N/AEmail: [email protected]: www.victoriabank.co.kePhysical Address: Victoria Towers, Upper Hill, NairobiDate Licensed: 11-01-1996Peer Group: SmallNumber of Branches: 5
B: MORTGAGE FINANCE COMPANIES
1 HFC LimitedAg. Chief Executive Officer: Ms. Regina AnyikaPostal Address: P.O. Box 30088 – 00100, NairobiTelephone numbers: 020 326 2000/ 0709 438 000Fax: (+254 20) 2250858Email: [email protected]: https://www.hfgroup.co.ke/Physical Address: Rehani House, Kenyatta Avenue/Koinange Street, NairobiDate Licensed: 07.05.1965Peer Group: MediumNumber of Branches: 22
C. KENYA BANKERS ASSOCIATION
1 Chief Executive Officer: Dr. Habil OlakaPostal Address: P.O. Box 73100-00200, NairobiTel: +254-20-2221704/2224014/2224015/2217757Fax: +254-20-2221792Email: [email protected]: www.kba.co.kePhysical Address: 13th floor, International House, Mama Ngina Street, Nairobi

C E N T R A L B A N K O F K E N Y ABANK SUPERVISION ANNUAL REPORT 2020
96
NO. Appendix XVII: DIRECTORY OF COMMERCIAL BANKS, MORTGAGE FINANCE COMPANIES, KENYA BANKERS ASSOCIATION, NON-OPERATING HOLDING COMPANIES AND AUTHORISED REPRESENTATIVE OFFICES
D. NON-OPERATING BANK HOLDING COMPANIES 1 Bakki Holdco Limited
Licensed Subsidiary: Sidian Bank LtdPostal Address: P.O. Box 10518 -00100, NairobiTelephone: 0709902000E-mail: [email protected]: www.centum.co.ke (NB: Bakki Holdco is a subsidiary of CentumLtd)Physical Address: 5th Floor, International Life House, Mama NginaStreet, NairobiDate Authorised: 31st December 2014
2 Equity Group Holdings LimitedLicensed Subsidiary: Equity Bank Kenya LtdPostal Address: P.O. Box 75104 – 00200, NairobiTelephone: +254 763 3026000Contact Centre: +254 763 063 000E-mail: [email protected]: www.equitygroupholdings.comPhysical Address: Equity Centre, 9th Floor, Hospital Road, Upper Hill, Nairobi
3 HF Group LimitedLicensed Subsidiary: HFC LtdPostal Address: P.O. Box 30088 – 00100, NairobiTelephone: +254(20)-3262000, 0722715256, 0722708660, 0722201175,0733617682E-mail: [email protected]: www.hfgroup.co.kePhysical Address: Rehani House, Kenyatta Avenue/ Koinange Street.Junction, Nairobi.Date Authorised: 3rd June, 2015
4 I&M Holdings PLCLicensed Subsidiary: I&M Bank Kenya LtdPostal Address: P.O. Box 30238-00100, NairobiTelephone: +254 20 322 1000, +254 719 088 000, +254 732 100 000,+254 753 221 000E-mail: [email protected]: www.imbank.comPhysical Address: 1 Park Avenue, First Parklands Avenue.Date Authorised: 13th May 2013
5 KCB Group PlcLicensed Subsidiary: KCB Bank Kenya LtdPostal Address: P.O. Box 48400 – 00100, NairobiTelephone: +254 20 3270000/2851000/2852000/+254 711012 000/0734 108200 /Sms: 22522E-mail: [email protected]: www.kcbbankgroup.comPhysical Address: Kencom House, NairobiDate Authorised: 1st November, 2015
6 M Holdings LimitedLicensed Subsidiary: M-Oriental Bank LtdPostal Address: P.O. Box 73248-00200 |Nairobi, KenyaTelephone: +254 20 2149923E-mail address: [email protected] address: Jadala Place, 3rd Floor, Ngong Lane, Ngong Road,NairobiDate Authorised: 18th February, 2015
7 NCBA Group PLCLicensed Subsidiary: NCBA Bank Kenya PlcPostal Address: P.O. Box 44599-00100 |Nairobi, KenyaTelephone: +254 20 2888000E-mail address: [email protected] address: NIC House, Masaba Road, Upper Hill, NairobiDate Authorised: 30th September 2019
8 Stanbic Holdings PLCLicensed Subsidiary: Stanbic Bank Kenya LtdPostal Address: P.O. Box 72833-00200, NairobiTelephone: + 254 20 3638000E-mail: [email protected]: http://www.stanbicbank.co.kePhysical Address: Stanbic Bank Centre, 1st Floor, Westlands Road,Chiromo NairobiDate Authorised: 21st June 2013

C E N T R A L B A N K O F K E N Y ABANK SUPERVISION ANNUAL REPORT 2020
97
NO. Appendix XVII: DIRECTORY OF COMMERCIAL BANKS, MORTGAGE FINANCE COMPANIES, KENYA BANKERS ASSOCIATION, NON-OPERATING HOLDING COMPANIES AND AUTHORISED REPRESENTATIVE OFFICES
E. AUTHORISED REPRESENTATIVE OFFICES
1 Bank of China Limited - Kenya Representative Office Chief Representative Officer: Mr. Chen Thao Address: P.O. Box 21357 - 00505 – Nairobi, Kenya Telephone No.: +254 - 20 - 3862811 / 2 Mobile: +254 - 788808600 E-mail: chentao [email protected] Physical Address: Unit 1, 5th Floor, Wing B, Morningside Office Park, Ngong Road, Nairobi Date Authorised: 29th June 2012
2 Bank of Kigali Ltd - Kenya Representative Office Chief Representative Officer Designate: Ms. Christa Sangwa Postal Address: P.O. Box 73279-00200 GPO– Nairobi, Kenya Telephone No.: +254 (20) 2711076 E-mail: [email protected] Physical Address: Ground Floor, Capitol Hill Square, Off Chyulu Road, Upper Hill, Nairobi Date Authorised: 12th February 2013
3 FirstRand Bank Limited - Kenya Representative Office Chief Representative Officer: Mrs. Alfetta Koome Mungai Postal Address: P.O. Box 35909 - 00200 – Nairobi, Kenya Telephone No.: +254 20 4908201 / 4908206 Cell: +254790469978 E-mail: [email protected] Physical Address: Ground Floor, Eaton Place, UN Crescent, Gigiri, Nairobi Date Authorised: 29th November 2011
4 HDFC Bank Limited - Kenya Representative Office Chief Representative Officer: Mr. Rajesh Kumar SabooPostal Address: P.O. Box 14235 - 00800 – Nairobi, Kenya Mobile No.: +254 713597593 Telephone No: +254 20 3749857/63 E-mail address: [email protected] Physical Address: Prosperity House, Westlands Road, Off Museum Hill, Westlands, Nairobi Date Authorised: 26th June 2008
5 Mauritius Commercial Bank Limited - Kenya Representative Office Chief Representative Officer: Mr. Murray Van RessomPostal Address: P.O. Box 35699 - 00800 – Nairobi, Kenya Telephone No: +254 20 44931000 Mobile No: +254 798 362 948 E-mail address: [email protected] Physical Address: 7th Floor, Pramukh Towers, 52 Westlands Road, Westlands, NairobiDate Authorised: 27th November 2014
6 Nedbank Limited - Kenya Representative Office Chief Representative Officer: Mr. Jaap van LuijkPostal Address: P.O Box 39218 - 00623, Nairobi, Kenya Telephone: +254-20 - 8045102 E-mail: [email protected] Physical Address: The Exchange Building, 3rd Floor, 55 Westlands Road, Nairobi Date Authorized: 18th June 2010
7 Co-operative Rabobank U.A - Kenya Representative Office Chief Representative Officer: Mr. Adrianus Cornelis VerbeekPostal Address: P.O. Box 1105-00606, Nairobi, Kenya Telephone: +254 202 955 000/1/2 | Mobile: 254 700 331 196 E-mail: [email protected] Website Address: www.rabobank.com Physical Address: 17th Floor, Delta Corner Tower, Waiyaki Way, Nairobi Date Authorised: 5th June 2014
8 Société Générale - Kenya Representative Office Chief Representative Officer: Mr. George Mutua Postal Address: P.O. Box 1795-00606, Nairobi, Kenya Telephone: +254 774995860 | Mobile: 254 710764933 E-mail: [email protected] Website Address: www.societegenerale.com Physical Address: Unit 2, 8th Floor, Tower 3, The Mirage, Chiromo Road, Westlands, Nairobi Date Authorised: 28th August 2017
9 BAHL - Representative Office Chief Representative Officer: Mr. Hasnain MuhammadPostal Address: P.O. Box 2445-00606, Nairobi, KenyaTelephone: +254 799743776 | Mobile: +254 799743777E-mail: [email protected]/[email protected] Address: www.bankalhabib.com Physical Address: Unit 5, 8th Floor, The Mirage Tower, Waiyaki Way, Nairobi Date Authorised: 9th April, 2018

C E N T R A L B A N K O F K E N Y ABANK SUPERVISION ANNUAL REPORT 2020
98
APPENDIX XVIII: DIRECTORY OF MICROFINANCE BANKS1 Caritas Microfinance Bank Limited
Chief Executive Officer: Mr. David MukaruPostal Address: P.O. Box 15352 – 00100, NairobiTelephone: +254 – 020 – 5151500Email: [email protected]: www.caritas-mfb.co.kePhysical address: Cardinal Maurice Otunga Plaza, Kaunda Street, NairobiDate Licensed: 02.06.2015Branches: 5
2 Century Microfinance Bank LimitedAg. Chief Executive Officer: Ms. Florence Mugure MuchiriPostal Address: P.O. Box 38319 – 00623, NairobiTelephone: +254 – 020 – 2664282, 0722168721, 0756305132Email: [email protected]: www.century.co.kePhysical address: Bihi Towers, 8th Floor, Moi Avenue, NairobiDate Licensed: 17.09.2012Branches: 3
3 Choice Microfinance Bank LimitedAg. Chief Executive Officer: Mr. Joseph Kung’u Ndung’uPostal Address: P.O Box 18263 – 00100, NairobiTelephone: +254 – 020 – 3882206/207, 0736662218, 0724308000Email: [email protected]: www.choicemfb.comPhysical address: Siron Place, Ongata Rongai, Magadi Road, KajiadoDate Licensed: 13.05.2015Branches: 2
4 Daraja Microfinance Bank Limited,Ag. Chief Executive Officer: Ms. Jane MwangiPostal Address: P.O Box 100854 - 00101, NairobiTelephone: +254 – 020 – 3879995, 0733988888, 0707444888, 0718444888Email: [email protected]: www.darajabank.co.kePhysical address: Daraja House, Karandini Road, off Naivasha Road, Nairobi Date Licensed: 12.01.2015Branches: 2
5 Faulu Microfinance Bank Limited Managing Director: Mr. Apollo Nderitu Njoroge Postal Address: P. O. Box 60240 – 00200, NairobiTelephone: +254 – 020 – 3877290/3/7; 3872183/4; 3867503, 0711074074, 0708 111000Fax: +254 – 020 – 3867504, 3874875Email: [email protected], [email protected], [email protected]: www.faulukenya.comPhysical address: Faulu Kenya House, Ngong Lane - Off Ngong Road, NairobiDate Licensed: 21.05.2009Branches: 37
6 Kenya Women Microfinance Bank PLC.Managing Director: Mr. James Mwangi Githaiga Postal Address: P.O Box 4179 – 00506, NairobiTelephone: +254 – 020 – 3067000, 2470272-5/2715334-5, 0729 920920, 0732633332, 0703067000Email: [email protected] Website: www. kwft.com Physical address: KWFT House, Kiambere Road/Masaba Road Junction, Upper Hill, NairobiDate Licensed: 31.03.2010Branches: 28
7 Key Microfinance Bank LimitedChief Executive Officer: Mr. Gregory Siro OdongoPostal Address: P. O. Box 20833 – 00100, NairobiTelephone: +254 – 020 – 2214483/2215384/5/7/8/9, 2631070, 2215380, 0733554555Email: [email protected]: www.remu.co.ke Physical Address: Finance House, 14th Floor, Loita Street, NairobiDate Licensed: 31.12.2010Branches: 3

C E N T R A L B A N K O F K E N Y ABANK SUPERVISION ANNUAL REPORT 2020
99
APPENDIX XVIII: DIRECTORY OF MICROFINANCE BANKS8 Maisha Microfinance Bank Limited
Chief Executive Officer: Mr. Ireneus Gichana Postal Address: P.O Box 49316 - 00100, NairobiTelephone: +254 – 020 – 2220648, 0736028982, 0792002300Email: [email protected]: www.maishabank.com Physical Address: Chester House, 2nd Floor, Koinange Street, NairobiDate Licensed: 21.05.2016Branches: 2
9 Muungano Microfinance Bank LimitedChief Executive Officer: Ms. Lydia KibaaraPostal Address: P.O. Box 355 – 10218, MurangaTelephone: +254 725454762Email: [email protected]: www.muunganomfbank.com Date Licensed: 30.10.2019Branches: 2
10 Rafiki Microfinance Bank LimitedAg. Managing Director: Mr. Paul Karanja MachariaPostal Address: P.O. Box 12755 – 00400, NairobiTelephone: +254 – 020 – 2166401, 0730170000/500Email: [email protected]: www.rafiki.co.ke Physical address: Rafiki House, Biashara Street, NairobiDate Licensed: 14.06.2011Branches: 17
11 SMEP Microfinance Bank LimitedThe Chief Executive Officer: Mr. Symon Kamore Postal Address: P.O. Box 64063 – 00620, NairobiTelephone: +254 – 020 – 3572799, 2055761, 2673327/8, 0711606900Email: [email protected]: www.smep.co.ke Physical address: SMEP Building - Kirichwa Road, Off Argwings Kodhek Road, Nairobi Date Licensed: 14.12.2010Branches: 7
12 Sumac Microfinance Bank LimitedChief Executive Officer: Mr. John Njihia Postal Address: P.O. Box 11687 – 00100, NairobiTelephone: +254 – 020 – 2212587, 2210440, 2249047, 0738637245, 0725223499Fax: +254 – 020 –2210430Email: [email protected]: www.sumacmicrofinancebank.co.ke Physical address: Consolidated Bank House, 2nd Floor, Koinange Street, NairobiDate Licensed: 29.10.2012Branches: 5
13 U & I Microfinance Bank LimitedChief Executive Officer: Mr. Simon Mwangi Ngigi Postal Address: P.O. Box 15825 – 00100, NairobiTelephone: +254 – 020 – 2367288, 0713112791Email: [email protected]: www.uni-microfinance.co.ke Physical address: Asili Complex, 1st Floor, River Road, NairobiDate Licensed: 08.04.2013Branches: 2
14 UWEZO Microfinance Bank LimitedChief Executive Officer/Managing Director: Mr. Jaafah SheikhPostal Address: P.O. Box 1654 – 00100, NairobiTelephone: +254 720 – 350808, 0729 - 211829Email: [email protected]: www.uwezomfbank.com Physical Address: Park Plaza Building, Ground Floor, Moktar Daddah Street, NairobiDate Licensed: 08.11.2010Branches: 3

C E N T R A L B A N K O F K E N Y ABANK SUPERVISION ANNUAL REPORT 2020
100
NO. APPENDIX XIX: DIRECTORY OF CREDIT REFERENCE BUREAUS
1 Credit Reference Bureau Africa Limited (Trading as TransUnion)Chief Executive Officer: Mr. Billy Osano OwinoPostal Address: P.O Box 46406 – 00100, NairobiTelephone: +254 - 020 – 3751799/3751360/2/4/5Fax: +254 – 020- 3751344Email: [email protected]: www.transunionafrica.com Physical Address: Delta Corner Annex, 2nd Floor, Ring Road, Westland, NairobiDate Licensed: 09.02.2010
2 Creditinfo Credit Reference Bureau Kenya Limited Chief Executive Officer: Mr. Stephen Kamau KunyihaPostal Address: P.O Box 38941 – 00623, NairobiTelephone: +254 - 020 – 3757272/0735880880Email: [email protected] or [email protected]: www.creditinfo.co.kePhysical Address: Standard Chartered Building, 48 Westlands Rd, NairobiDate Licensed: 29.04.2015
3 Metropol Credit Reference Bureau LimitedManaging Director: Mr. Sam OmukokoPostal Address: P.O. Box 35331 – 00200, NairobiTelephone: +254 - 020 – 2713575Email: [email protected]: www. Metropolcorporation.comPhysical address: KCB Towers, 15th Floor - Kenya Road, Upper Hill, NairobiDate Licensed: 06.04.2011

C E N T R A L B A N K O F K E N Y ABANK SUPERVISION ANNUAL REPORT 2020
101
APPENDIX XX: DIRECTORY OF FOREIGN EXCHANGE BUREAUSName of Bureau Location E-mail Address & Fax
1 Alpha Forex Bureau Ltd P. O. Box 476 – 00606 Nairobi Tel: 4451435/7
Pamstech House Woodvale Grove Westlands, Nairobi
[email protected] Fax: 254-2-4451436
2 Aristocrats Forex Bureau Ltd P. O. Box 10884 – 00400 Nairobi Tel: (020) 2228080
Kenindia House, Loita Street Nairobi
[email protected] [email protected] Fax: 254-2-213794
3 Avenue Forex Bureau Ltd P. O. Box 1755 – 80100 MombasaTel: (041) 2319749/50
Motor Mart Building, Moi Avenue, Mombasa
[email protected] [email protected]
4 Bamburi Forex Bureau Ltd P. O. Box 97803 - 80102 Mombasa Tel: 041-4477004, 0722-412649/ 0733-466729
City Mall Nakumatt Nyali, Mombasa - Malindi Road
[email protected] Fax: 254-41-5486948
5 Bay Forex Bureau (Nairobi) Ltd P. O. Box 46154 – 00100 Nairobi Tel: 0704482421/0700-510000
280 Annex Building, Eastleigh, Nairobi
[email protected] Fax: 254-2-229665/248676
6 Boston Forex Bureau Limited P.O. Box 11076–00400 Nairobi Tel: 0205249664/ 0732622429/ 0702022429
Ameer Centre, Westlands, Nairobi [email protected]
7 CBD Forex Bureau Limited P. O. Box 30840 – 00100 Nairobi Tel: 020 – 316123/2250853
Sound Plaza, Woodvale Groove, Nairobi
[email protected]: 254-2-318895
8 Central Forex Bureau Ltd P. O. Box 43966 – 00100 Nairobi Tel: (020) 317217/2226777
I. P. S. Building, Ground Floor, Kaunda Street, Nairobi
[email protected] Fax: 254-2-249016
9 Classic Forex Bureau Limited P. O. Box 76694 – 00508 Nairobi Tel: 3862343/4
Prestige Plaza, 1st Floor, Ngong Road, Nairobi
[email protected] Fax No. 3862346
10 Commercial Forex Bureau Limited P. O. Box 47452 – 00100 Nairobi Tel. 020-2210307/8
KCS House, Mama Ngina Street,Nairobi
11 Conference Forex Bureau Company Limited P. O. Box 32268 – 00600 Nairobi Tel. (020) 2219677, 2219518, 2219069
KICC, Ground Flour, Harambee Avenue,Nairobi
Fax: 254-2-224126
12 Continental Forex Bureau Ltd P. O. Box 49580 – 00400 Nairobi Tel: (020) 5101078
Old Mutual Building, Ground Floor, Kimathi Street, Nairobi
[email protected] Fax: 254 2-216163
13 Cosmos Forex Bureau Ltd P. O. Box 10284 – 00100 Nairobi Tel: 2250582/5; 0701666622
Rehema House, Ground Floor, Standard/Kaunda Street, Nairobi
[email protected]: 254-2-250591
14 Forex Bureau Afro Ltd P. O. Box 14353 – 00800 Nairobi Tel: 2222950/2250676/222950
Jamia Plaza Kigali Street Nairobi
[email protected]: 254-2-2251078
15 Gala Forex Bureau Ltd P. O. Box 35021-00100 Nairobi Tel: 020-2210346 Mobile: 0717729772/0712095004
20th Century, 1st Floor Mama Ngina/ Kaunda Street, Nairobi
[email protected] Fax: 254 20 310261
16 Gateway Forex Bureau Ltd P. O. Box 11500 – 00100 Nairobi Tel: 020-2212945/55
Town House, Kaunda Street, Nairobi
[email protected] Fax: 254-20-2212942

C E N T R A L B A N K O F K E N Y ABANK SUPERVISION ANNUAL REPORT 2020
102
APPENDIX XX: DIRECTORY OF FOREIGN EXCHANGE BUREAUSName of Bureau Location E-mail Address & Fax
17 Giant Forex Bureau de Change Ltd P. O. Box 56947 – 00200 Nairobi Tel: 020-2680516
Terminal 1A, Jomo Kenyatta International Airport, Nairobi
[email protected]: 254-2-825327
18 Give and Take Forex Bureau Ltd P. O. Box 51463 – 00200 Nairobi Tel: 020-3562152/0738157274
China Garden, United Nations Avenue, Nairobi
[email protected]: 254-2-7120046
19 Glory Foreign Exchange Bureau Ltd P. O. Box 42909 – 00100 Nairobi Tel: 2244333/2241164/2243115
Norwich Union House Kimathi Street, Nairobi
[email protected] Fax: 254-2-245614
20 GNK Forex Bureau Ltd P. O. Box 14297 – 00100 Nairobi Tel: 890303/2461598
The Great Jubilee Shopping Centre, Ground Floor, Langata Road, Nairobi
[email protected] Fax: 254-2-892266
21 Green Exchange Forex Bureau Ltd P. O. Box 20809 – 00100 Nairobi Tel:+2540202214547/8/9
Emperor Plaza, Ground Floor, Koinange Street, Nairobi
[email protected] Fax: 254-2-2214550
22 Industrial Area Forex Bureau Ltd P. O. Box 45746 – 00100 Nairobi Tel: 020-3755456/0711768786
Diamond Plaza, Parklands, Nairobi. [email protected]: 254-2-551186
23 Island Forex Bureau Ltd P. O. Box 84300- 80100 Mombasa Tel: 041-2223988/ 2229626
Abdulrasul Inst. Building, Makadara Road, Moi Avenue, Mombasa
[email protected]: 254-41-2227057
24 Junction Forex Bureau Limited P. O. Box 43888 – 00100 Nairobi Tel: 3861268/9, 0725-852840
The Junction Shopping Mall, Ngong Road/ Dagoreti Corner,Nairobi
25 Kenza Exchange Bureau Ltd P. O. Box 21819 – 00400 Nairobi Tel: 0710320345, 0735320345
JKIA, Arrival Unit 1 Nairobi [email protected], [email protected]
26 La’che Forex Bureau Ltd P. O. Box 13464 – 00800 Nairobi Tel: (020) 2221305/6
Mirage Towers, Chiromo Road, Nairobi.
[email protected] Fax: 254-2-2733485
27 Leo Forex Bureau Ltd P. O. Box 3073– 80100 Mombasa Tel: 041-2230396/7/8; 2230399
T. S. S. Towers Nkrumah Road, Mombasa
[email protected] Fax: 254-41-230399
28 Link Forex Bureau Ltd P. O. Box 11659 – 00400 Nairobi Tel: 0734-542903
Uganda House – Arcade, Kenyatta Avenue, Nairobi
[email protected] Fax: 254-2-213620
29 Magnum Forex Bureau De Change Ltd P. O. Box 46434 – 00100 NairobiTel: 652532/0732736575
Southfield Mall, Airport North Road, Nairobi
30 Maritime Forex Bureau Ltd P. O. Box 43296 – 80100 Mombasa Tel: 041- 2319175/6/7/0734244644
Hassanali Building, Nkrumah Road, Nairobi
[email protected] Fax: 254-41-2319178
31 Middletown Forex Bureau Ltd P. O. Box 41830 – 00100 Nairobi Tel: 2211227/2211798
Westminister House Kaunda Street Nairobi
[email protected] Fax: 254-2-332534
32 Mona Bureau De Change Ltd P. O. Box 46180 – 00100 Nairobi Tel: 828111/2, Cell: 0733-744348
Panari Centre, Mombasa Road Nairobi
[email protected]: 254-2-828113

C E N T R A L B A N K O F K E N Y ABANK SUPERVISION ANNUAL REPORT 2020
103
APPENDIX XX: DIRECTORY OF FOREIGN EXCHANGE BUREAUSName of Bureau Location E-mail Address & Fax
33 Moneypoint Forex Bureau Ltd P. O. Box 3338-00100 Nairobi Tel No. 0720-393049
Immigrations Department, Customs Yard Busia
[email protected] Fax:+254-20-2211342
34 Morgan Forex Bureau De Change Ltd P. O. Box 79012 – 00400 Nairobi Tel No. 020-4444072/3
Kipro Centre, Sports Street, Westlands, Nairobi
[email protected] Fax: 254 -2-4444074
35 Mustaqbal Forex Bureau Ltd P. O. Box 100745 – 00101 Nairobi Tel: 020-2497344
Mosque House, 6th Street, Eastleigh, Nairobi
[email protected] Fax: 254-2-6766650
36 Muthaiga-ABC Forex Bureau Ltd P. O. Box 63533 – 00619, Tel: 020-2135761 Cell: 07215/0736 - 123456
Triad Building, Muthaiga Road, Nairobi
[email protected]; [email protected]
37 Nairobi Bureau De Change Ltd P. O. Box 644 – 00624, Village Mkt Nairobi Tel: 822158
Unit 2 JKIA Nairobi
[email protected]: 254-2-241307
38 Namanga Forex Bureau Ltd P. O. Box 12577 – 00100 Nairobi Tel: 0721466737/0732412157
Immigration Building, Namanga Town
39 Nawal Forex Bureau Ltd P. O. Box 10715 – 00100 Nairobi Tel: 2720111/0720242578
Chaka Place, Chaka Road, Nairobi
[email protected]: 254-2-272011
40 Offshore Forex Bureau Limited P. O. Box 26650 – 00100 Nairobi Tel: 020 – 310837/8
Cianda House,Ground Floor, Koinange Street, Nairobi
[email protected]: 254-02-310839
41 Pacific Forex Bureau Limited P. O. Box 24273 – 00100 Nairobi Tel. 020-5100940/310882
Lonhro House, Standard Street, Nairobi
[email protected], [email protected]
42 Peaktop Bureau De Change Ltd P. O. Box 13074 – 00100 Nairobi Tel: 020-254371, 0722 - 332518
20th Century, Mama Ngina/Kaunda Streets, Nairobi
[email protected], [email protected]: 254-2-210210
43 Pearl Forex Bureau Ltd P. O. Box 58059 – 00200 Nairobi Tel: 2724769/ 2724778
Hurlingham Shopping Centre, Unipen Flats, Nairobi
[email protected]: 254-2-2724770
44 Pel Forex Bureau Ltd P. O. Box 957 – 40100 Kisumu Tel: 057-2024134/2044425
Allmamra Plaza Oginga Odinga Road, Kisumu
[email protected] Fax: 254-57-2022495
45 Pwani Forex Bureau Ltd P. O. Box 87200 – 80100 Mombasa Tel: 041-2221727/2221734/2221845
Mombasa Block 404 XV11/M1 Abdel Nasser
[email protected] Fax: 254-41-2221870
46 Rand Forex Bureau Limited P. O. Box 30923 - 00100 Nairobi Tel: 0722200815
The Waterfront Mall, Karen, Nairobi [email protected]
47 Regional Forex Bureau Limited P. O. Box 634 – 00100, Nairobi Tel. 020-3311953
Kimathi House, Kimathi Street, Nairobi
[email protected]: 254-20-312296
48 Rift Valley Forex Bureau Ltd P. O. Box 12165 Nakuru Tel: 051-2212495/2210174
Merica Hotel Building, Court Road, Nakuru
[email protected] Fax: 254-51-2210174

C E N T R A L B A N K O F K E N Y ABANK SUPERVISION ANNUAL REPORT 2020
104
APPENDIX XX: DIRECTORY OF FOREIGN EXCHANGE BUREAUSName of Bureau Location E-mail Address & Fax
49 Satellite Forex Bureau Ltd P. O. Box 43617– 00100 Nairobi Tel: 2218140/1, Cell: 0721-411300
City House, Standard Street, Nairobi
[email protected] Fax: 254-20-230630
50 Simba Forex Bureau Limited P. O. Box 66886 – 00800 Nairobi Tel. 020 – 445995, 0723 – 598662
Moi International Airport, Mombasa
[email protected] No: 020 – 4443706
51 Sisi Forex Bureau Limited P.O. Box 60770 - 00200 Nairobi Tel: 2445846/0722-382995
Agip House, Haile Selasie Avenue, Nairobi
52 Sky Forex Bureau Limited P. O. Box 26150 – 00100 Nairobi Tel: 020-2242062/3
20th Century, Mama Ngina/ Kaunda Street, Nairobi
[email protected] No. 020-2242064
53 Solid Exchange Bureau Ltd P. O. Box 19257– 00501 Nairobi Tel: 822922/0722-853769
JKIA-Unit 2, Nairobi [email protected]: 254-2-822923
54 Southend Forex Bureau Ltd P. O. Box 3321 – 00506 Nairobi Tel: 0722844598, 0719806999
Freedom Heights Mall, Langata Road, Nairobi
55 Springs Forex Bureau LimitedP.O. Box 15913 – 00100 NairobiTel: 0711796625
Medina Mall, Ground Floor, Eastleigh, Nairobi.
56 Sterling Forex Bureau Ltd P. O. Box 43673 – 00200 Nairobi Tel: 2228923/340624
Laxmi Plaza, Biashara Street, Nairobi
[email protected] Fax: 254-2-330894
57 Sunny Forex Bureau Limited P. O. Box 41257 – 00100 Nairobi Tel: 2252013/252079
Uniafric House, Koinange Street, Nairobi
[email protected] Fax: 254-2-252076
58 Taipan Forex Bureau Ltd P. O. Box 42909 – 00100 Nairobi Tel: 0722 397661/7122901
The Village Market, Nairobi [email protected] Fax: 254-2-229665/248676
59 Trade Bureau De Change Ltd P. O. Box 102214 – 00101 Nairobi Tel: (020) 8000700/0715518999
St Eliss House, City Hall Way, Nairobi [email protected] Fax: 254-2-317759
60 Travellers Forex Bureau Ltd P. O. Box 13580 – 00800 Nairobi Tel: 447204/5/6
The Mall, Ring Road Westlands, Nairobi
Fax: 254-2-443859
61 Travel Point Forex Bureau Limited P. O. Box 75901 – 00200 Nairobi Tel. 020-2532065/2306479
JKIA, International Arrivals Terminal, Nairobi
[email protected]: 254-2-827872
62 Union Forex Bureau Ltd P. O. Box 430– 00606 Nairobi Tel: 4441855/4448327/4447618
Sarit Centre , Lower Kabete Road , Westlands,Nairobi
[email protected] Fax: 254-2-4441855
63 Victoria Forex Bureau De Change Ltd P. O. Box 705 – 40100 Kisumu Tel 057-2025626/2021134/2023809
Sansora Building, Central Square, Kisumu
[email protected]: 254-57-202536
64 Wallstreet Bureau De Change Ltd P. O. Box 6841- 30100 Eldoret Tel: 053-2062907/0733665555
Bargetuny Plaza, Uganda Road, Eldoret
[email protected]: 254- 53-2062907
65 Westlands Forex Bureau Ltd P. O. Box 45746 – 00100 Nairobi Tel: 4442385/6
Westgate Mall, Nairobi [email protected] Fax: 254-2-3748785

C E N T R A L B A N K O F K E N Y ABANK SUPERVISION ANNUAL REPORT 2020
105
APPENDIX XX: DIRECTORY OF FOREIGN EXCHANGE BUREAUSName of Bureau Location E-mail Address & Fax
66 Yaya Centre Exchange Bureau Ltd P. O. Box 76302 – 00508 Nairobi Tel: 02-3862881/0722349746
Yaya Centre Towers, Argwings Kodhek Road, Nairobi
[email protected] Fax: 254-2-3870869
APPENDIX XXI: DIRECTORY OF MONEY REMITTANCE PROVIDERSName of MRP Location Email Address
1 Airtel Money Transfer LimitedP.O. Box 73146 – 00200 NAIROBITel: 0734110000
Parkside Towers, Mombasa Road, Nairobi. [email protected]
2 Amal Express Money Transfer Limited P.O.BOX 3165 – 00100NairobiTel: 0722878597 / 0723281122
Amal Plaza, 1st Avenue Eastleigh, Nairobi [email protected]
3 Amana Money Transfer LtdP.O. Box 68578 – 00622NairobiTel : 6761296 / 2379824
Amana Shopping Complex, Captain Mungai Street, Eastleigh, Nairobi.
[email protected]/ [email protected]
4 Bakaal Express Money Transfer LtdP.O.BOX 71248 – 00610Nairobi Tel: 2394513 / 0717399039
Amco Shopping Mall, 1st Avenue Eastleigh, Nairobi
5 Dahabshiil Money Transfer Company Limited.P.O. Box 68991 – 00622NairobiTel:2222728/9 / 0720169999
Sanlam House, Kenyatta Avenue, Nairobi [email protected]
6 Flex Money Transfer Limited P.O. Box 23786-00100 Nairobi Tel: 020-3861100/ 0715919391
Green House, 4th Floor, Suite 13, Ngong Road, Nairobi
7 Hodan Global Money Remittance and Exchange LimitedP.O. Box 68811 – 00622NairobiTel:2084862
Ecobank Towers, Ground Floor, Kaunda Street, Nairobi [email protected] hodanforex2008@
hotmail.com
8 Iftin Express Money Transfer LimitedP.O. Box 100184 – 00101NairobiTel: 2629818 / 0713105944
Portal Place, Muindi Mbingu Street, Nairobi
9 Juba Express Money Transfer Limited P.O.BOX 16567 – 00100NairobiTel: 2240540, 0727699669 / 0772699669
Hamilton House, Kaunda StreetNairobi
10 Kaah Express Money Transfer LimitedP.O.BOX 10327 – 00400NairobiTel: 0206767494/604 / 0724710153
Kaah Building, 2th Avenue, 8th Street, Eastleigh, Nairobi
11 Mobex Money Transfer Services LtdP.O. Box 1956 - 00621 NAIROBITel: 0733701243 / 0731005504
4th Floor, Woodlands Office Park, Woodlands Road, Nairobi.
[email protected]@terrapay.com
12 Mukuru Money Transfer LimitedP. O. Box 764 – 00606 Sarit Centre, NairobiTel:0736219056, 0708047188/9
ALN House, Eldama Ravine Close,Westlands, Nairobi
13 Real Value Money Transfer LimitedP.O. Box 26530-00100NairobiTel:0721297906
Shariff Complex, 5th Avenue, Eastleigh, Nairobi
14 Safaricom Money Transfer Services LimitedP. O . B ox 6 6 8 2 7 – 0 0 8 0 0 N a i r o b i Tel: 20 4273272, 0722003272 /0722000000
Safaricom House,Waiyaki Way, Westlands, Nairobi
15 Taaj Money Transfer Limited P.O. Box 47583 – 00100 Nairobi Tel: 020-2321972 / 0700420700 / 0732420777
1st Floor Shariff Centre, Eastleigh Nairobi [email protected]

C E N T R A L B A N K O F K E N Y ABANK SUPERVISION ANNUAL REPORT 2020
106
APPENDIX XXI: DIRECTORY OF MONEY REMITTANCE PROVIDERSName of MRP Location Email Address
16 Tawakal Money Transfer Limited P.O. BOX 71623 – 00610NairobiTel: 6766171, 0722146643
City House, Ground Floor, Nairobi. [email protected]
17 Upesi Money Transfer LimitedP.O Box 60776-00200NairobiTel:0726499656 / 0726500404
Morning Side Office Park, Ngong Road, Nairobi

C E N T R A L B A N K O F K E N Y ABANK SUPERVISION ANNUAL REPORT 2020
107