Embed Size (px)
Citation preview
1 of 15
Organic versus Conventional Bananas:
Comparison of economic performances and
carbon footprint
Lorenzo Giovanni Bellú, Economist (ESA)
Louis Bockel, Economist (ESA)
Uwe Grewer, International Consultant (ESA)
Fabrizio Moscatelli, International Consultant (ESA)
2 of 15
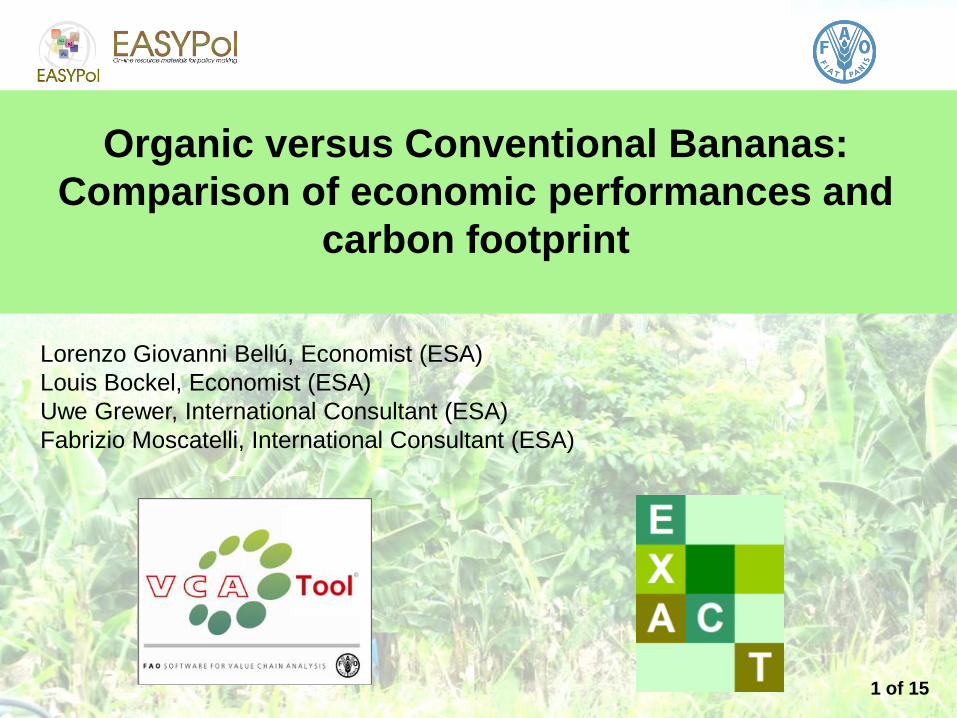
Key questions
•Do organic bananas have a lower carbon
footprint?
•Which practices lower the carbon
footprint?
•Do certification and labelling allow for
higher prices?
•How to assess which type of banana is
better performing in economic terms ?
3 of 15
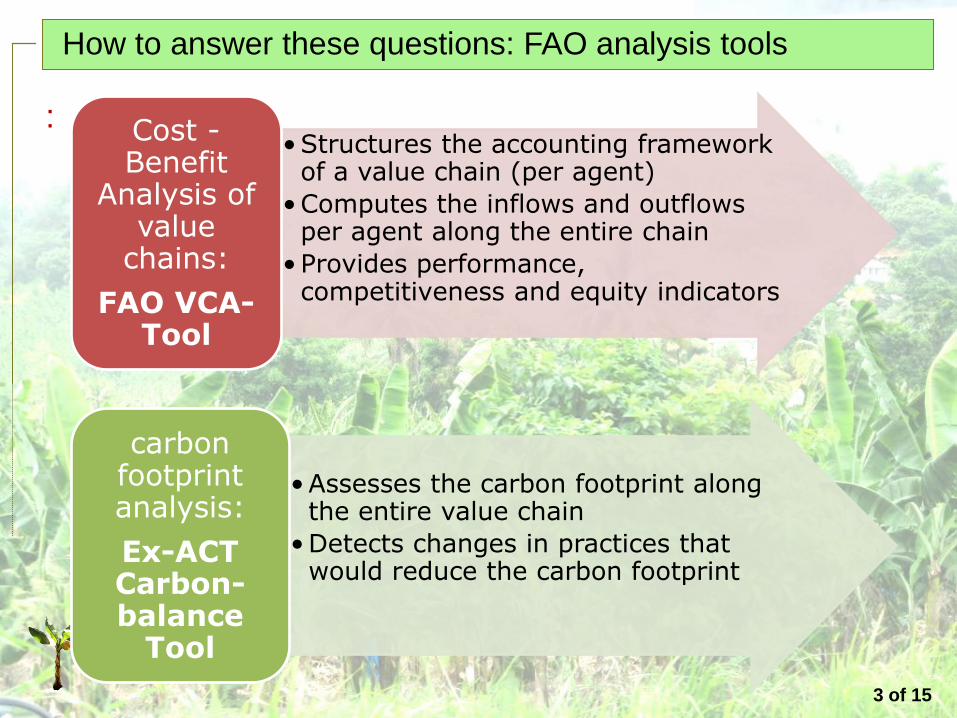
How to answer these questions: FAO analysis tools
:
•Structures the accounting framework
of a value chain (per agent)
•Computes the inflows and outflows per agent along the entire chain
•Provides performance, competitiveness and equity indicators
Cost - Benefit
Analysis of value
chains:
FAO VCA- Tool
•Assesses the carbon footprint along the entire value chain
•Detects changes in practices that would reduce the carbon footprint
carbon footprint analysis:
Ex-ACT Carbon-balance
Tool
4 of 15
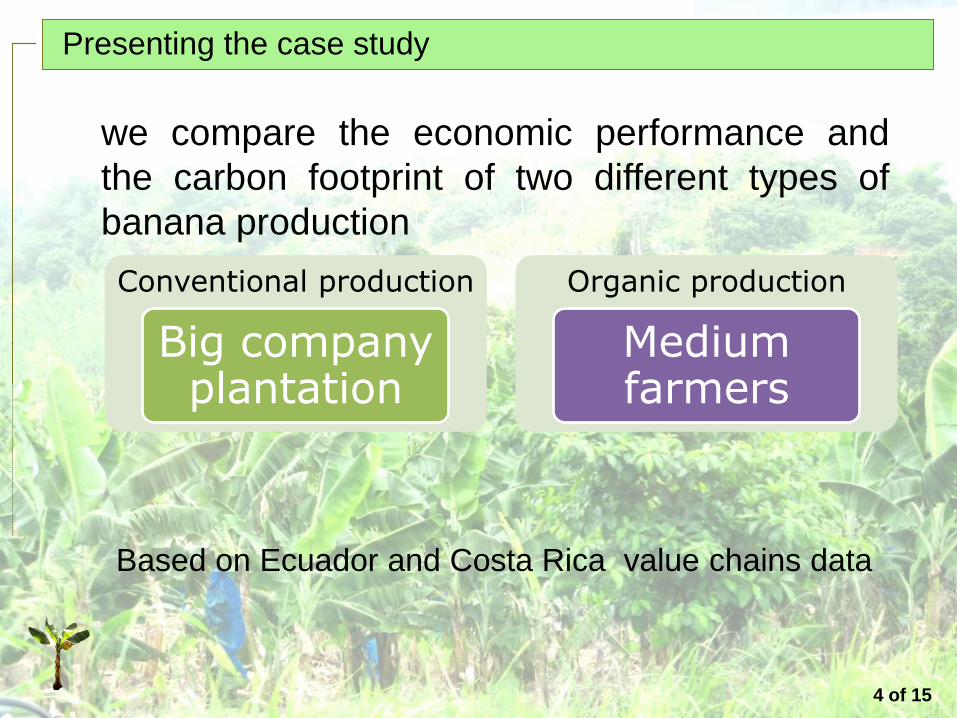
Presenting the case study
we compare the economic performance and
the carbon footprint of two different types of
banana production
Conventional production
Big company plantation
Organic production
Medium farmers
Based on Ecuador and Costa Rica value chains data
5 of 15
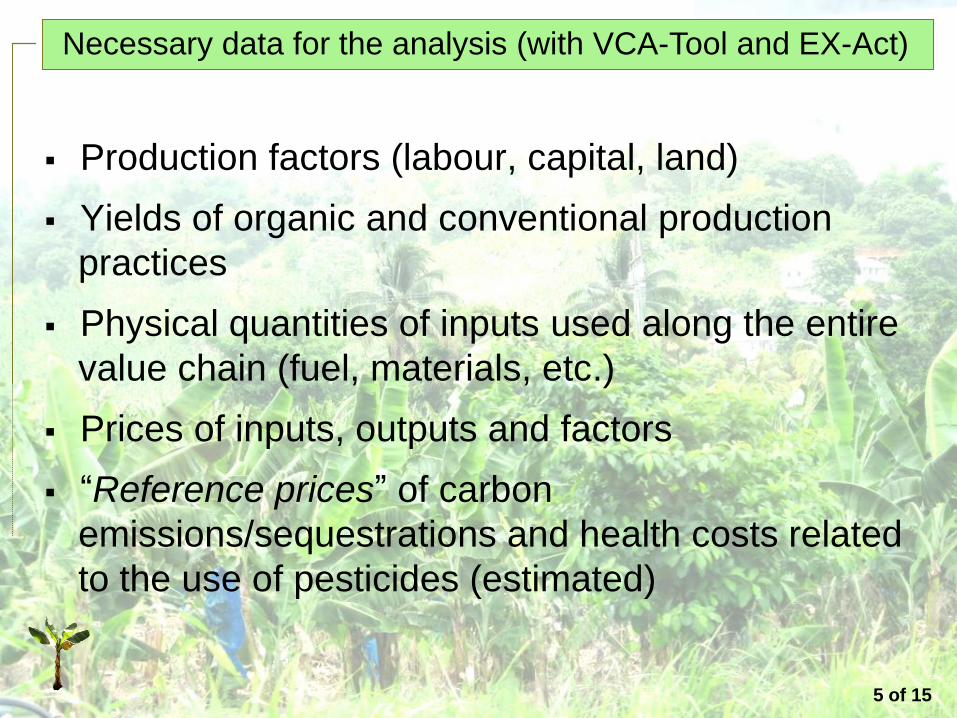
Necessary data for the analysis (with VCA-Tool and EX-Act)
Production factors (labour, capital, land)
Yields of organic and conventional production
practices
Physical quantities of inputs used along the entire
value chain (fuel, materials, etc.)
Prices of inputs, outputs and factors
“Reference prices” of carbon
emissions/sequestrations and health costs related
to the use of pesticides (estimated)
6 of 15
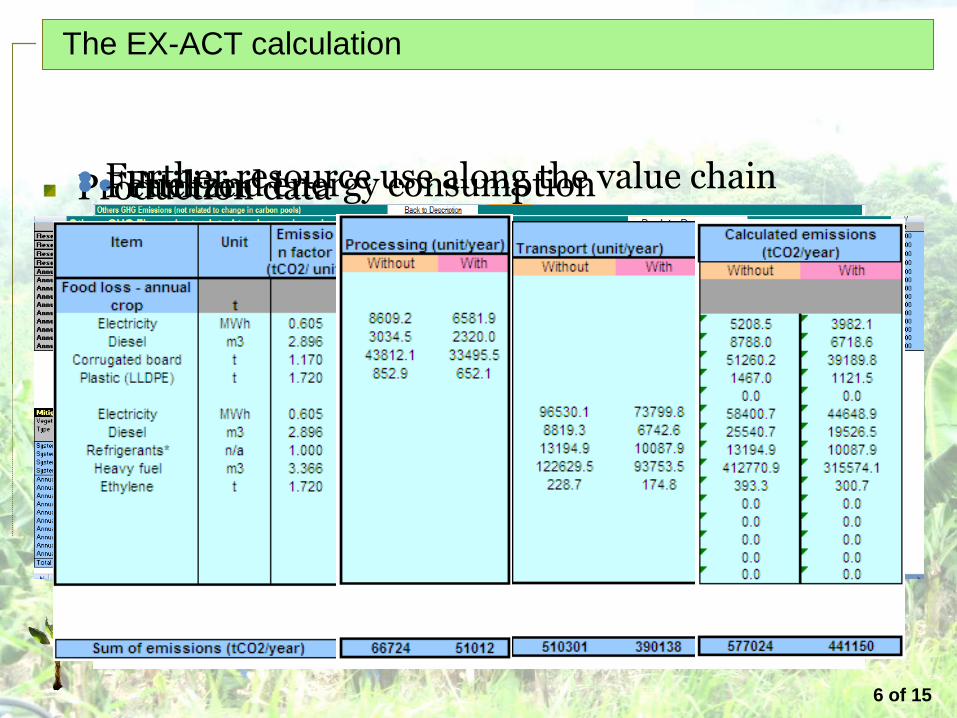
The EX-ACT calculation
Production data Fertilizer Fuel and energy consumption Further resource use along the value chain
7 of 15
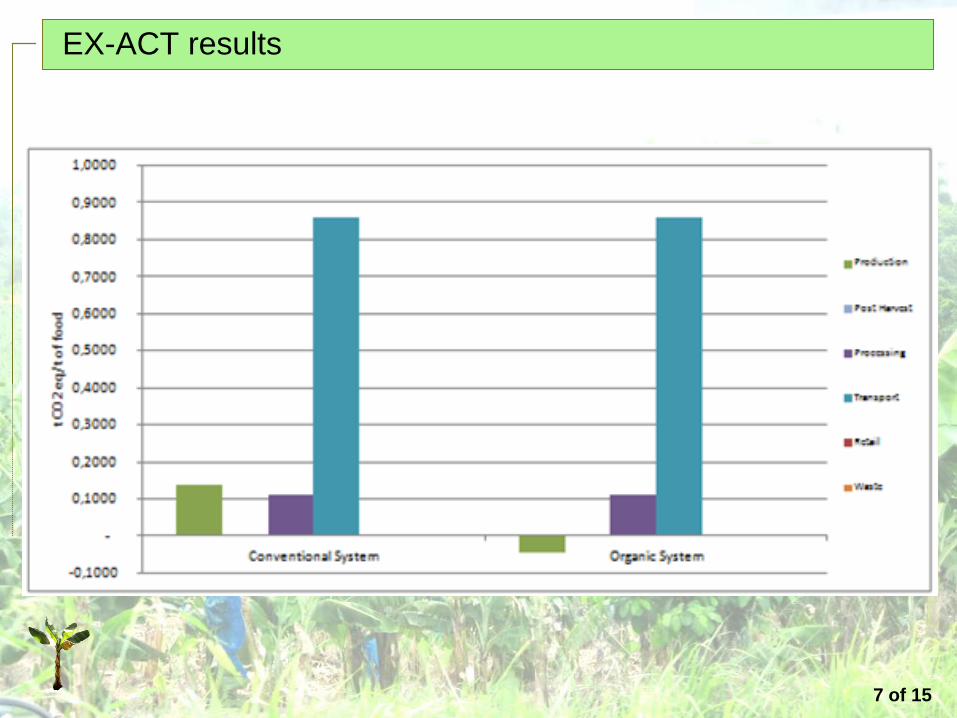
Conventional Organic
Production 0.138 -0.043
Packaging & Post harvest
0.113 0.113
Transport 0.860 0.860
TOTAL 1.111 0.929
EX-ACT results
8 of 15
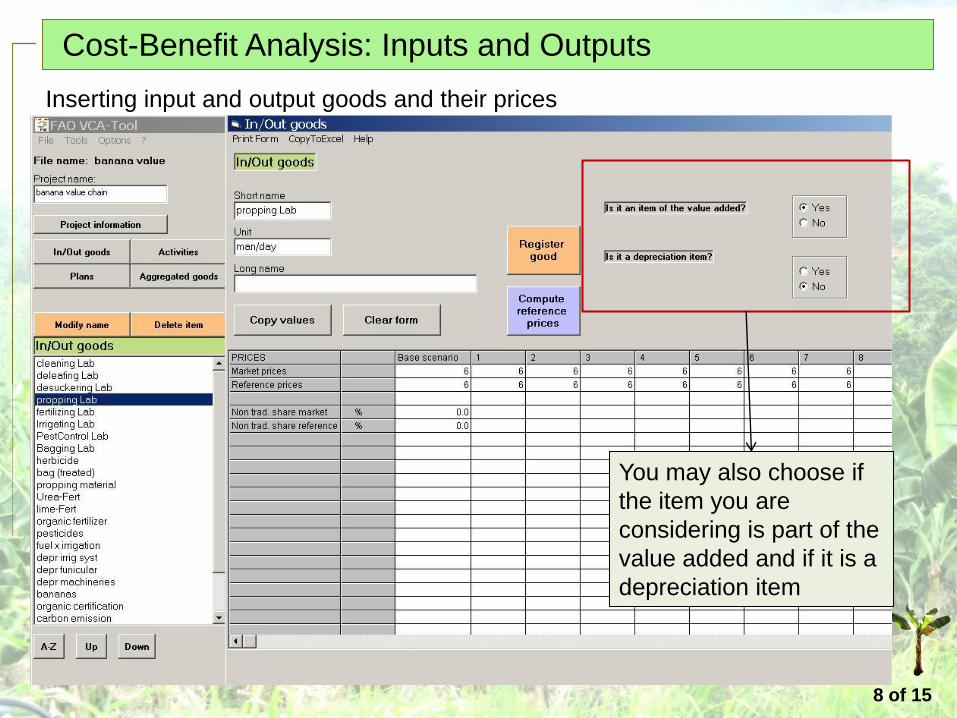
Cost-Benefit Analysis: Inputs and Outputs
Inserting input and output goods and their prices
You may also choose if
the item you are
considering is part of the
value added and if it is a
depreciation item
9 of 15
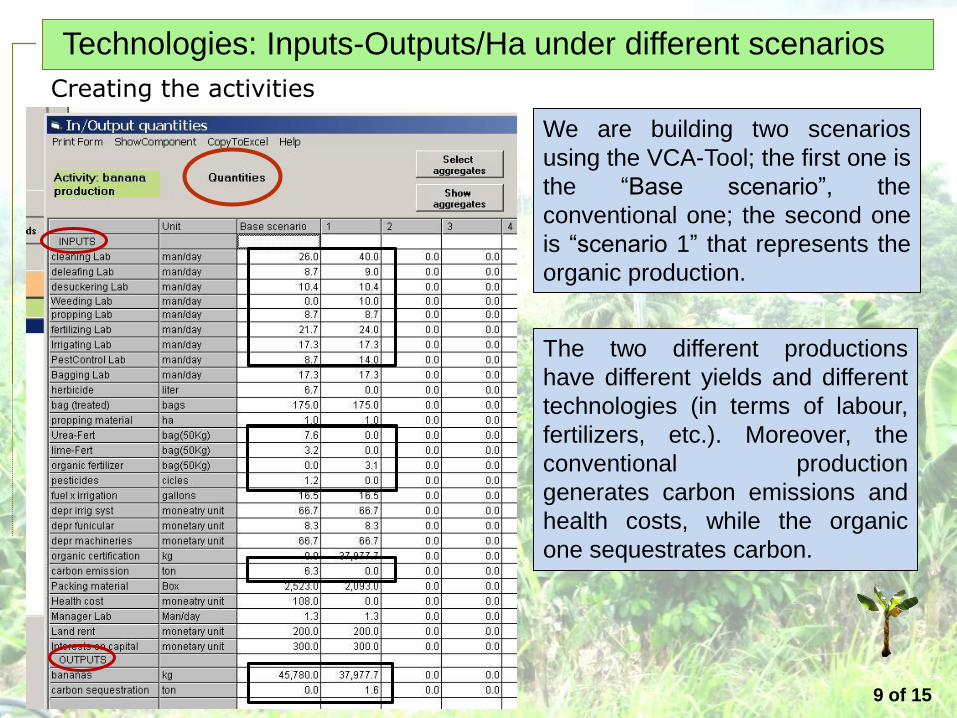
Technologies: Inputs-Outputs/Ha under different scenarios
Creating the activities
We are building two scenarios
using the VCA-Tool; the first one is
the “Base scenario”, the
conventional one; the second one
is “scenario 1” that represents the
organic production.
The two different productions
have different yields and different
technologies (in terms of labour,
fertilizers, etc.). Moreover, the
conventional production
generates carbon emissions and
health costs, while the organic
one sequestrates carbon.
10 of 15
Cost/Benefit Analysis at market and reference prices
After creating the two scenarios is possible to compare them and
determine the differences in terms of costs and benefits. In this analysis
market prices of carbon emissions and health costs are zero, as private
agents do not pay for them (they are costs only in a social perspective).
At market prices profits in the organic production are higher due to:
• higher prices of the outputs
• No costs for chemicals
-NB: Value added is even higher due to more labour intensive process
At “reference prices” profits are even higher, due to:
• zero carbon emissions (even slight sequestration)
• no health costs
The reference price of the carbon emission (or sequestration ) is 5 $/T.
11 of 15
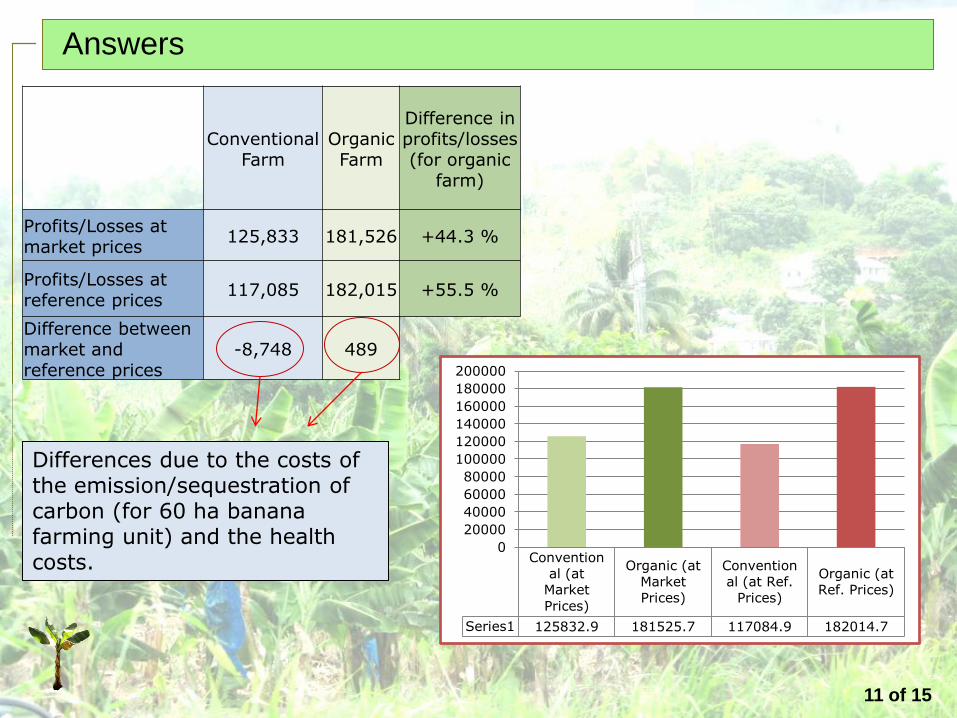
Answers
Conventional
Farm Organic Farm
Difference in profits/losses (for organic
farm)
Profits/Losses at market prices
125,833 181,526 +44.3 %
Profits/Losses at reference prices
117,085 182,015 +55.5 %
Difference between market and reference prices
-8,748 489
Differences due to the costs of the emission/sequestration of carbon (for 60 ha banana farming unit) and the health costs. Convention
al (at
Market
Prices)
Organic (at
Market
Prices)
Convention
al (at Ref.
Prices)
Organic (at
Ref. Prices)
Series1 125832.9 181525.7 117084.9 182014.7
0
20000
40000
60000
80000
100000
120000
140000
160000
180000
200000
12 of 15
Conclusion remarks
Results with limited data:
• Organic production decreases the carbon footprint,
though transportation stays the most central issue
• Organic production is more profitable both from a social
and private perspective
• FAO VCA-Tool and EX-ACT allow for further analysis in
different situations...
• FAO is ready to assist to carry out further analysis
..including equity concerns in value added distribution
across agents and countries....
13 of 15
References
•P. Liu , FAO (2008), “Certification In The Value Chain For Fresh Fruits The Example Of
Banana Industry”
•Athukorala, Wasantha and others (2010), “Determinants of health costs due to farmers’
exposure to pesticides : an empirical analysis”
•C. B. Ochoa – B. R. Benavides (2001) “Conversión a banano orgánico: una alternativa
para la recuperación financiera de las bananeras”
•S.Smith, (2010), Institute of Development Studies, University of Sussex, Uk, “Fairtrade
bananas: a global assessment of impact”
•B. Luske (2010), Soil & More International, “Comprehensive Carbon Footprint Assessment
Dole Bananas “
The VCA-Tool can be downloaded at: http://www.fao.org/easypol The Ex-Act tool can be downloaded at:
http://www.fao.org/tc/exact