Embed Size (px)
Citation preview

Oregon Terascale Workshop March 7, 2011
Rick Field – Florida/CDF/CMS Page 1
Northwest Terascale WorkshopNorthwest Terascale WorkshopModeling Min-Bias and the Underlying EventModeling Min-Bias and the Underlying Event
Rick FieldUniversity of Florida
UE&MB@CMSUE&MB@CMS
Part 1
Predicting the behavior of the “underlying event” at the LHC. What we expected to see.
CMS
ATLAS
Proton Proton
PT(hard)
Outgoing Parton
Outgoing Parton
Underlying Event Underlying Event
Initial-State Radiation
Final-State Radiation
University of Oregon March 7-11, 2011
The Underlying Event at the LHC
How well did we do at predicting the behavior of the “underlying event” at the LHC (900 GeV and 7 TeV)?
PYTHIA 6.4 Tune Z1: CMS LHC tune (pT-ordered parton showers and new MPI). Comparisons with the LHC UE data.

Oregon Terascale Workshop March 7, 2011
Rick Field – Florida/CDF/CMS Page 2
Northwest Terascale WorkshopNorthwest Terascale WorkshopModeling Min-Bias and the Underlying EventModeling Min-Bias and the Underlying Event
Rick FieldUniversity of Florida
UE&MB@CMSUE&MB@CMS
Part 2 (tomorrow) How are “min-bias” collisions related to the
“underlying event”.
CMS
ATLAS
University of Oregon March 7-11, 2011
Min-Bias Collisions at the LHC
PYTHIA 6.4 Tune Z1: CMS tune (pT-ordered parton showers and new MPI). Comparisons with the LHC Min-Bias data.
How well did we do at predicting the behavior of “min-bias” collisions at the LHC (900 GeV and 7 TeV)?
New Physics in Min-Bias?? Observation of long-range same-side correlations at 7 TeV.
Strange particle production: A problem for the models?
Proton Proton
“Minimum Bias” Collisions

Oregon Terascale Workshop March 7, 2011
Rick Field – Florida/CDF/CMS Page 3
Northwest Terascale WorkshopNorthwest Terascale WorkshopParton Showers and Event Structure at the LHCParton Showers and Event Structure at the LHC
Previous Workshop February 23-27, 2009
The last 2 years have been amazing!We now have a lot of nice LHCdata on the “underlying event”
and min-bias collisions.So much has happened so fast!

Oregon Terascale Workshop March 7, 2011
Rick Field – Florida/CDF/CMS Page 4
QCD Monte-Carlo Models:QCD Monte-Carlo Models:High Transverse Momentum JetsHigh Transverse Momentum Jets
Start with the perturbative 2-to-2 (or sometimes 2-to-3) parton-parton scattering and add initial and final-state gluon radiation (in the leading log approximation or modified leading log approximation).
Hard Scattering
PT(hard)
Outgoing Parton
Outgoing Parton
Initial-State Radiation
Final-State Radiation
Hard Scattering
PT(hard)
Outgoing Parton
Outgoing Parton
Initial-State Radiation
Final-State Radiation
Proton AntiProton
Underlying Event Underlying Event
Proton AntiProton
Underlying Event Underlying Event
“Hard Scattering” Component
“Jet”
“Jet”
“Underlying Event”
The “underlying event” consists of the “beam-beam remnants” and from particles arising from soft or semi-soft multiple parton interactions (MPI).
Of course the outgoing colored partons fragment into hadron “jet” and inevitably “underlying event” observables receive contributions from initial and final-state radiation.
“Jet”
The “underlying event” is an unavoidable background to most collider observables and having good understand of it leads to
more precise collider measurements!

Oregon Terascale Workshop March 7, 2011
Rick Field – Florida/CDF/CMS Page 5
QCD Monte-Carlo Models:QCD Monte-Carlo Models:Lepton-Pair ProductionLepton-Pair Production
Start with the perturbative Drell-Yan muon pair production and add initial-state gluon radiation (in the leading log approximation or modified leading log approximation).
Proton AntiProton
Underlying Event Underlying Event
Proton AntiProton
Underlying Event Underlying Event
Lepton-Pair Production
Lepton
Anti-Lepton
Initial-State Radiation
Lepton-Pair Production
Lepton
Anti-Lepton
Initial-State Radiation
“Underlying Event”
The “underlying event” consists of the “beam-beam remnants” and from particles arising from soft or semi-soft multiple parton interactions (MPI).
Of course the outgoing colored partons fragment into hadron “jet” and inevitably “underlying event” observables receive contributions from initial-state radiation.
“Jet”
Proton AntiProton
High PT Z-Boson Production
Z-boson
Outgoing Parton
Initial-State Radiation Final-State Radiation
High PT Z-Boson Production
Z-boson
Outgoing Parton
Initial-State Radiation
Final-State Radiation
“Hard Scattering” Component

Oregon Terascale Workshop March 7, 2011
Rick Field – Florida/CDF/CMS Page 6
MPI, Pile-Up, and OverlapMPI, Pile-Up, and Overlap MPI: Additional 2-to-2 parton-parton
scatterings within a single hadron-hadron collision.
Pile-Up
Primary
MPI: Multiple Parton Interactions
Proton Proton
PT(hard)
Outgoing Parton
Outgoing Parton
Underlying Event Underlying Event
Initial-State Radiation
Final-State Radiation
Pile-Up Proton
Interaction Region z
Proton ProtonProton
Pile-Up: More than one hadron-hadron collision in the beam crossing.
Overlap Overlap: An experimental timing issue where a hadron-hadron collision from the next beam crossing gets included in the hadron-hadron collision from the current beam crossing because the next crossing happened before the event could be read out.

Oregon Terascale Workshop March 7, 2011
Rick Field – Florida/CDF/CMS Page 7
Traditional ApproachTraditional Approach
Look at charged particle correlations in the azimuthal angle relative to a leading object (i.e. CaloJet#1, ChgJet#1, PTmax, Z-boson). For CDF PTmin = 0.5 GeV/c cut = 1.
Charged Particle Correlations PT > PTmin || < cut
Leading Object Direction
“Toward”
“Transverse” “Transverse”
“Away”
Define || < 60o as “Toward”, 60o < || < 120o as “Transverse”, and || > 120o as “Away”.
Leading Calorimeter Jet or Leading Charged Particle Jet or
Leading Charged Particle orZ-Boson
-cut +cut
2
0
Leading Object
Toward Region
Transverse Region
Transverse Region
Away Region
Away Region
All three regions have the same area in - space, × = 2cut×120o = 2cut×2/3. Construct densities by dividing by the area in - space.
Charged Jet #1Direction
“Transverse” “Transverse”
“Toward”
“Away”
“Toward-Side” Jet
“Away-Side” Jet
“Transverse” region very sensitive to the “underlying event”!
CDF Run 1 Analysis

Oregon Terascale Workshop March 7, 2011
Rick Field – Florida/CDF/CMS Page 8
"Transverse" Charged Particle Density: dN/dd
0.0
0.4
0.8
1.2
1.6
0 5 10 15 20 25
PTmax (GeV/c)
"Tra
nsv
erse
" C
har
ged
Den
sity
PY Tune A
Min-Bias14 TeV Charged Particles (||<1.0, PT>0.5 GeV/c)
RDF Preliminarygenerator level
PY64 Tune P329
PY64 Tune S320 PY Tune DW
PY Tune DWTPY ATLAS
Transverse Charged Particle DensityTransverse Charged Particle Density
Shows the “associated” charged particle density in the “transverse” region as a function of PTmax for charged particles (pT > 0.5 GeV/c, || < 1, not including PTmax) for “min-bias” events at 1.96 TeV from PYTHIA Tune A, Tune S320, Tune N324, and Tune P329 at the particle level (i.e. generator level).
PTmax Direction
“Toward”
“Transverse” “Transverse”
“Away”
"Transverse" Charged Particle Density: dN/dd
0.0
0.2
0.4
0.6
0.8
0 2 4 6 8 10 12 14 16 18 20
PTmax (GeV/c)
"Tra
ns
ve
rse
" C
harg
ed
Den
sit
y RDF Preliminarygenerator level
PY Tune A
PY64 Tune P329
PY64 Tune S320
Charged Particles (||<1.0, PT>0.5 GeV/c)
PY64 Tune N324
Min-Bias1.96 TeV
Tevatron LHC
PTmax Direction
“Toward”
“Transverse” “Transverse”
“Away”
Extrapolations of PYTHIA Tune A, Tune DW, Tune DWT, Tune S320, Tune P329, and pyATLAS to the LHC.
RDF LHC Prediction!
If the LHC data are not in the range shown here then
we learn new (QCD) physics!Rick Field October 13, 2009

Oregon Terascale Workshop March 7, 2011
Rick Field – Florida/CDF/CMS Page 9
““Transverse” Charged DensityTransverse” Charged Density
PTmax Direction
“Toward”
“Transverse” “Transverse”
“Away”
ChgJet#1 Direction
“Toward”
“Transverse” “Transverse”
“Away”
Shows the charged particle density in the “transverse” region for charged particles (pT > 0.5 GeV/c, || < 1) at 7 TeV as defined by PTmax, PT(chgjet#1), and PT(muon-pair) from PYTHIA Tune DW at the particle level (i.e. generator level). Charged particle jets are constructed using the Anti-KT algorithm with d = 0.5.
"Transverse" Charged Particle Density: dN/dd
0.0
0.4
0.8
1.2
1.6
0 5 10 15 20 25 30 35 40 45 50
PT(chgjet#1) or PTmax or PT(pair) (GeV/c)
"Tra
nsv
erse
" C
har
ged
Den
sity
7 TeV
Charged Particles (||<1.0, PT>0.5 GeV/c)
RDF Preliminarypy Tune DW generator level
PTmax
ChgJet#1
DY(muon-pair)70 < M(pair) < 110 GeV
Muon-Pair Direction
“Toward”
“Transverse” “Transverse”
“Away”

Oregon Terascale Workshop March 7, 2011
Rick Field – Florida/CDF/CMS Page 10
Min-Bias “Associated”Min-Bias “Associated”Charged Particle DensityCharged Particle Density
Shows the “associated” charged particle density in the “transverse” region as a function of PTmax for charged particles (pT > 0.5 GeV/c, || < 1, not including PTmax) for “min-bias” events at 0.2 TeV, 0.9 TeV, 1.96 TeV, 7 TeV, 10 TeV, 14 TeV predicted by PYTHIA Tune DW at the particle level (i.e. generator level).
PTmax Direction
“Toward”
“Transverse” “Transverse”
“Away”
PTmax Direction
“Toward”
“Transverse” “Transverse”
“Away”
RHIC Tevatron
0.2 TeV → 1.96 TeV (UE increase ~2.7 times)
PTmax Direction
“Toward”
“Transverse” “Transverse”
“Away”
LHC
1.96 TeV → 14 TeV (UE increase ~1.9 times)
Linear scale!
"Transverse" Charged Particle Density: dN/dd
0.0
0.4
0.8
1.2
0 5 10 15 20 25
PTmax (GeV/c)
"Tra
ns
vers
e"
Ch
arg
ed D
en
sity
Charged Particles (||<1.0, PT>0.5 GeV/c)
RDF Preliminarypy Tune DW generator level
Min-Bias 14 TeV
1.96 TeV
0.2 TeV
7 TeV
0.9 TeV
10 TeV
"Transverse" Charged Particle Density: dN/dd
0.0
0.4
0.8
1.2
0 2 4 6 8 10 12 14
Center-of-Mass Energy (TeV)
"Tra
ns
vers
e"
Ch
arg
ed D
ensi
ty RDF Preliminarypy Tune DW generator level
Charged Particles (||<1.0, PT>0.5 GeV/c)
PTmax = 5.25 GeV/c
RHIC
Tevatron900 GeV
LHC7
LHC14
LHC10

Oregon Terascale Workshop March 7, 2011
Rick Field – Florida/CDF/CMS Page 11
Min-Bias “Associated”Min-Bias “Associated”Charged Particle DensityCharged Particle Density
Shows the “associated” charged particle density in the “transverse” region as a function of PTmax for charged particles (pT > 0.5 GeV/c, || < 1, not including PTmax) for “min-bias” events at 0.2 TeV, 0.9 TeV, 1.96 TeV, 7 TeV, 10 TeV, 14 TeV predicted by PYTHIA Tune DW at the particle level (i.e. generator level).
Log scale!
"Transverse" Charged Particle Density: dN/dd
0.0
0.4
0.8
1.2
0 5 10 15 20 25
PTmax (GeV/c)
"Tra
ns
vers
e"
Ch
arg
ed D
en
sity
Charged Particles (||<1.0, PT>0.5 GeV/c)
RDF Preliminarypy Tune DW generator level
Min-Bias 14 TeV
1.96 TeV
0.2 TeV
7 TeV
0.9 TeV
10 TeV
"Transverse" Charged Particle Density: dN/dd
0.0
0.4
0.8
1.2
0.1 1.0 10.0 100.0
Center-of-Mass Energy (TeV)
"Tra
ns
vers
e"
Ch
arg
ed D
ensi
ty RDF Preliminarypy Tune DW generator level
Charged Particles (||<1.0, PT>0.5 GeV/c)
PTmax = 5.25 GeV/c
RHIC
Tevatron
900 GeV
LHC7
LHC14LHC10
PTmax Direction
“Toward”
“Transverse” “Transverse”
“Away”
PTmax Direction
“Toward”
“Transverse” “Transverse”
“Away”
LHC7 LHC14
7 TeV → 14 TeV (UE increase ~20%)
Linear on a log plot!

Oregon Terascale Workshop March 7, 2011
Rick Field – Florida/CDF/CMS Page 12
Conclusions November 2009Conclusions November 2009 We are making good progress in understanding and modeling the
“underlying event”. RHIC data at 200 GeV are very important!
It is clear now that the default value PARP(90) = 0.16 is not correct and the value should be closer to the Tune A value of 0.25.
The new Pythia pT ordered tunes (py64 S320 and py64 P329) are very similar to Tune A, Tune AW, and Tune DW. At present the new tunes do not fit the data better than Tune AW and Tune DW. However, the new tune are theoretically preferred!
Proton AntiProton
PT(hard)
Outgoing Parton
Outgoing Parton
Underlying Event Underlying Event
Initial-State Radiation
Final-State Radiation
Need to measure “Min-Bias” and the “underlying event” at the LHC as soon as possible to see if there is new QCD physics to be learned!
All tunes with the default value PARP(90) = 0.16 are wrong and are overestimating the activity of min-bias and the underlying event at the LHC! This includes all my “T” tunes and the (old) ATLAS tunes! UE&MB@CMSUE&MB@CMS
Hard-Scattering Cut-Off PT0
1
2
3
4
5
100 1,000 10,000 100,000
CM Energy W (GeV)
PT
0
(Ge
V/c
)
PYTHIA 6.206
= 0.16 (default)
= 0.25 (Set A))
The new and old PYTHIA tunes are beginning to converge and I believe we are finally in a position to make some legitimate predictions at the LHC!

Oregon Terascale Workshop March 7, 2011
Rick Field – Florida/CDF/CMS Page 13
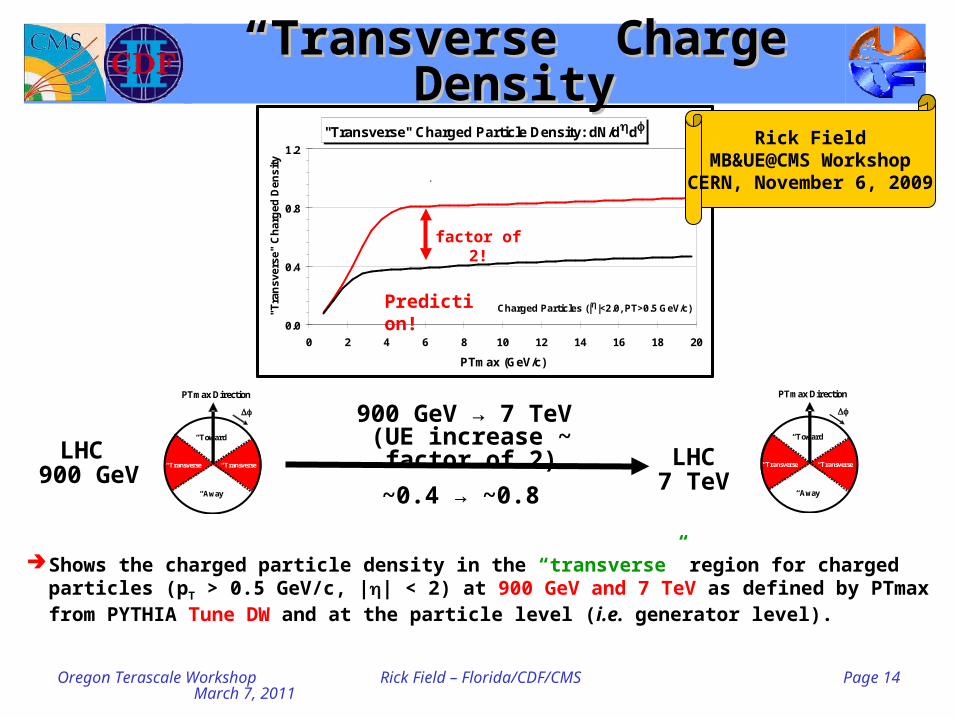
““Transverse” Charged Particle DensityTransverse” Charged Particle Density
Fake data (from MC) at 900 GeV on the “transverse” charged particle density, dN/dd, as defined by the leading charged particle (PTmax) and the leading charged particle jet (chgjet#1) for charged particles with pT > 0.5 GeV/c and || < 2. The fake data (from PYTHIA Tune DW) are generated at the particle level (i.e. generator level) assuming 0.5 M min-bias events at 900 GeV (361,595 events in the plot).
PT(chgjet#1) Direction
“Toward”
“Transverse” “Transverse”
“Away”
"Transverse" Charged Particle Density: dN/dd
0.0
0.2
0.4
0.6
0.8
0 2 4 6 8 10 12 14 16 18
PTmax or PT(chgjet#1) (GeV/c)
"Tra
ns
vers
e"
Ch
arg
ed D
ensi
ty
900 GeV
Charged Particles (||<2.0, PT>0.5 GeV/c)
RDF PreliminaryFake Data
pyDW generator levelChgJet#1
PTmax
Rick FieldMB&UE@CMS WorkshopCERN, November 6, 2009
PTmax Direction
“Toward”
“Transverse” “Transverse”
“Away”
Leading Charged Particle Jet, chgjet#1.
Leading Charged Particle, PTmax.
Prediction!
Oregon Terascale Workshop March 7, 2011
Rick Field – Florida/CDF/CMS Page 14
““Transverse” Charge DensityTransverse” Charge Density
PTmax Direction
“Toward”
“Transverse” “Transverse”
“Away”
PTmax Direction
“Toward”
“Transverse” “Transverse”
“Away”
LHC 900 GeV
LHC7 TeV
900 GeV → 7 TeV (UE increase ~ factor of 2)
"Transverse" Charged Particle Density: dN/dd
0.0
0.4
0.8
1.2
0 2 4 6 8 10 12 14 16 18 20
PTmax (GeV/c)
"Tra
ns
ve
rse
" C
ha
rge
d D
en
sit
y
Charged Particles (||<2.0, PT>0.5 GeV/c)
RDF Preliminarypy Tune DW generator level
900 GeV
7 TeV
Shows the charged particle density in the “transverse” region for charged particles (pT > 0.5 GeV/c, || < 2) at 900 GeV and 7 TeV as defined by PTmax from PYTHIA Tune DW and at the particle level (i.e. generator level).
factor of 2!
~0.4 → ~0.8
Rick FieldMB&UE@CMS WorkshopCERN, November 6, 2009
Prediction!

Oregon Terascale Workshop March 7, 2011
Rick Field – Florida/CDF/CMS Page 15
““Transverse” Charged Particle DensityTransverse” Charged Particle Density
Fake data (from MC) at 900 GeV on the “transverse” charged particle density, dN/dd, as defined by the leading charged particle (PTmax) and the leading charged particle jet (chgjet#1) for charged particles with pT > 0.5 GeV/c and || < 2. The fake data (from PYTHIA Tune DW) are generated at the particle level (i.e. generator level) assuming 0.5 M min-bias events at 900 GeV (361,595 events in the plot).
"Transverse" Charged Particle Density: dN/dd
0.0
0.2
0.4
0.6
0.8
0 2 4 6 8 10 12 14 16 18
PTmax or PT(chgjet#1) (GeV/c)
"Tra
ns
vers
e"
Ch
arg
ed D
ensi
ty
900 GeV
Charged Particles (||<2.0, PT>0.5 GeV/c)
RDF PreliminaryFake Data
pyDW generator levelChgJet#1
PTmax
CMS preliminary data at 900 GeV on the “transverse” charged particle density, dN/dd, as defined by the leading charged particle (PTmax) and the leading charged particle jet (chgjet#1) for charged particles with pT > 0.5 GeV/c and || < 2. The data are uncorrected and compared with PYTHIA Tune DW after detector simulation (216,215 events in the plot).
"Transverse" Charged Particle Density: dN/dd
0.0
0.2
0.4
0.6
0.8
0 2 4 6 8 10 12 14 16 18
PTmax or PT(chgjet#1) (GeV/c)
"Tra
nsv
erse
" C
har
ged
Den
sity CMS Preliminary
data uncorrectedpyDW + SIM
900 GeV
ChgJet#1
PTmax
Charged Particles (||<2.0, PT>0.5 GeV/c) Real Data!Monte-Carlo!

Oregon Terascale Workshop March 7, 2011
Rick Field – Florida/CDF/CMS Page 16
““Transverse” Charged PTsum DensityTransverse” Charged PTsum Density
"Transverse" Charged PTsum Density: dPT/dd
0.0
0.2
0.4
0.6
0.8
0 2 4 6 8 10 12 14 16 18
PTmax or PT(chgjet#1) (GeV/c)
PT
su
m D
en
sity
(G
eV
/c)
900 GeV
Charged Particles (||<2.0, PT>0.5 GeV/c)
ChgJet#1
PTmax
RDF PreliminaryFake Data
pyDW generator level
Fake data (from MC) at 900 GeV on the “transverse” charged PTsum density, dPT/dd, as defined by the leading charged particle (PTmax) and the leading charged particle jet (chgjet#1) for charged particles with pT > 0.5 GeV/c and || < 2. The fake data (from PYTHIA Tune DW) are generated at the particle level (i.e. generator level) assuming 0.5 M min-bias events at 900 GeV (361,595 events in the plot).
"Transverse" Charged PTsum Density: dPT/dd
0.0
0.2
0.4
0.6
0.8
0 2 4 6 8 10 12 14 16 18
PTmax or PT(chgjet#1) (GeV/c)
PT
sum
Den
sity
(G
eV/c
)
CMS Preliminarydata uncorrected
pyDW + SIM
900 GeV
Charged Particles (||<2.0, PT>0.5 GeV/c)
ChgJet#1
PTmax
CMS preliminary data at 900 GeV on the “transverse” charged PTsum density, dPT/dd, as defined by the leading charged particle (PTmax) and the leading charged particle jet (chgjet#1) for charged particles with pT > 0.5 GeV/c and || < 2. The data are uncorrected and compared with PYTHIA Tune DW after detector simulation (216,215 events in the plot).
Real Data!Monte-Carlo!
Oregon Terascale Workshop March 7, 2011
Rick Field – Florida/CDF/CMS Page 17
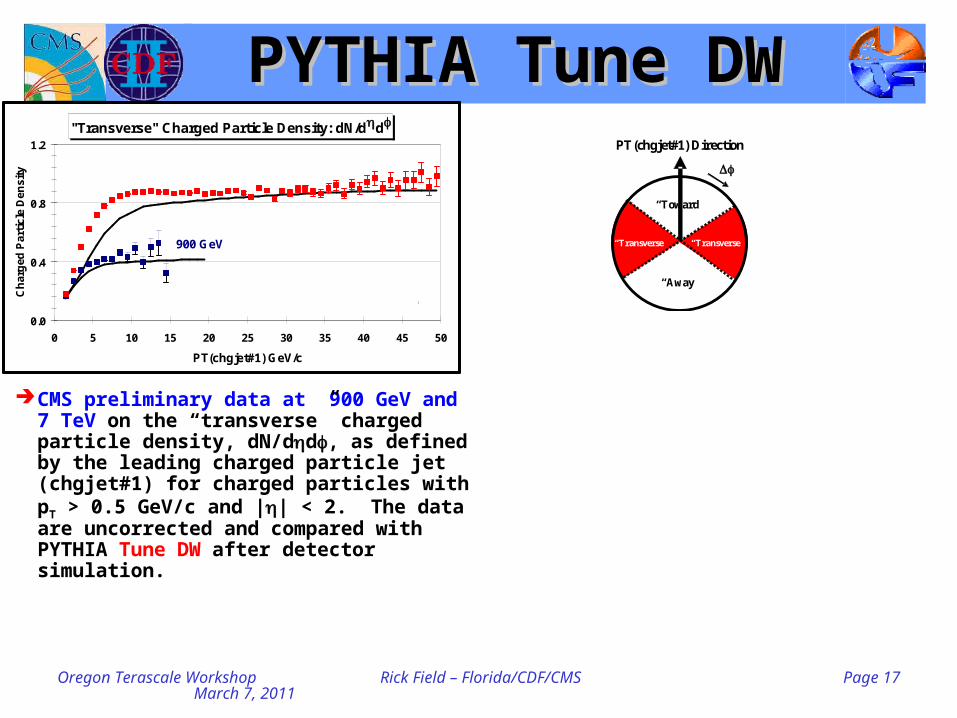
PYTHIA Tune DWPYTHIA Tune DW
CMS preliminary data at 900 GeV and 7 TeV on the “transverse” charged particle density, dN/dd, as defined by the leading charged particle jet (chgjet#1) for charged particles with pT > 0.5 GeV/c and || < 2. The data are uncorrected and compared with PYTHIA Tune DW after detector simulation.
"Transverse" Charged Particle Density: dN/dd
0.0
0.4
0.8
1.2
0 5 10 15 20 25 30 35 40 45 50
PT(chgjet#1) GeV/c
Ch
arg
ed P
arti
cle
Den
sity
900 GeV
CMS Preliminarydata uncorrected
pyDW + SIM
Charged Particles (||<2.0, PT>0.5 GeV/c)
7 TeV
PT(chgjet#1) Direction
“Toward”
“Transverse” “Transverse”
“Away”

Oregon Terascale Workshop March 7, 2011
Rick Field – Florida/CDF/CMS Page 18
PYTHIA Tune DWPYTHIA Tune DW"Transverse" Charged Particle Density: dN/dd
0.0
0.4
0.8
1.2
0 2 4 6 8 10 12 14 16 18 20
PTmax (GeV/c)
"Tra
nsv
erse
" C
har
ged
Den
sity RDF Preliminary
ATLAS corrected dataTune DW generator level
900 GeV
7 TeV
Charged Particles (||<2.5, PT>0.5 GeV/c)
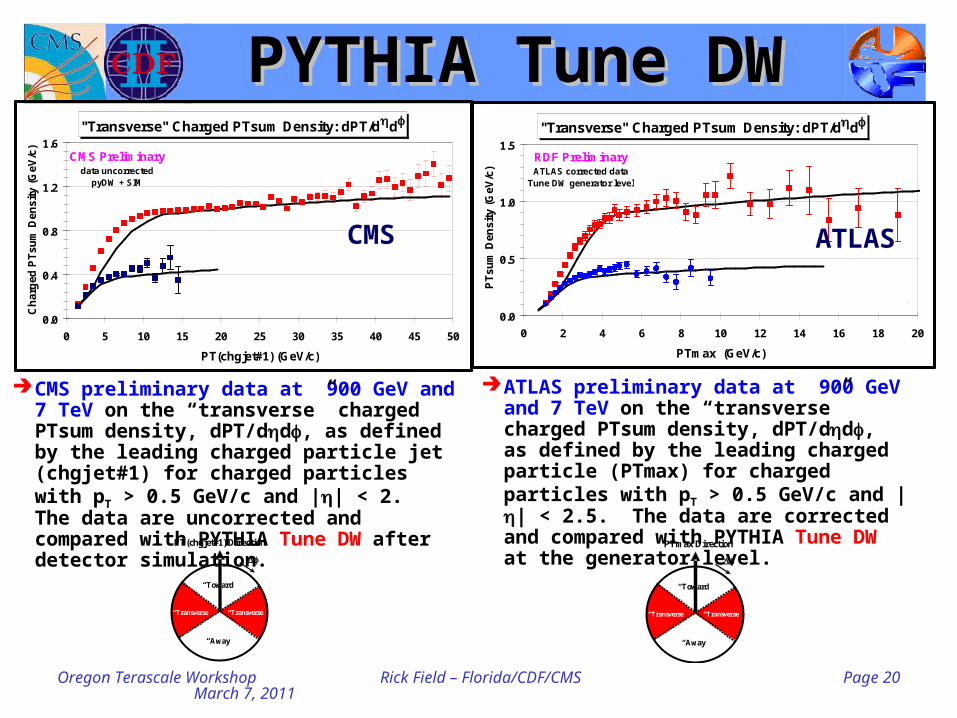
ATLAS preliminary data at 900 GeV and 7 TeV on the “transverse” charged particle density, dN/dd, as defined by the leading charged particle (PTmax) for charged particles with pT > 0.5 GeV/c and || < 2.5. The data are corrected and compared with PYTHIA Tune DW at the generator level.
PTmax Direction
“Toward”
“Transverse” “Transverse”
“Away”
ATLAS Note: ATLAS-CONF-2010-029May 29, 2010
I read the points off with a ruler!

Oregon Terascale Workshop March 7, 2011
Rick Field – Florida/CDF/CMS Page 19
PYTHIA Tune DWPYTHIA Tune DW
PTmax Direction
“Toward”
“Transverse” “Transverse”
“Away”
"Transverse" Charged Particle Density: dN/dd
0.0
0.4
0.8
1.2
0 2 4 6 8 10 12 14 16 18 20
PTmax (GeV/c)
"Tra
nsv
erse
" C
har
ged
Den
sity RDF Preliminary
ATLAS corrected dataTune DW generator level
900 GeV
7 TeV
Charged Particles (||<2.5, PT>0.5 GeV/c)
ATLAS preliminary data at 900 GeV and 7 TeV on the “transverse” charged particle density, dN/dd, as defined by the leading charged particle (PTmax) for charged particles with pT > 0.5 GeV/c and || < 2.5. The data are corrected and compared with PYTHIA Tune DW at the generator level.
CMS preliminary data at 900 GeV and 7 TeV on the “transverse” charged particle density, dN/dd, as defined by the leading charged particle jet (chgjet#1) for charged particles with pT > 0.5 GeV/c and || < 2. The data are uncorrected and compared with PYTHIA Tune DW after detector simulation.
"Transverse" Charged Particle Density: dN/dd
0.0
0.4
0.8
1.2
0 5 10 15 20 25 30 35 40 45 50
PT(chgjet#1) GeV/c
Ch
arg
ed P
arti
cle
Den
sity
900 GeV
CMS Preliminarydata uncorrected
pyDW + SIM
Charged Particles (||<2.0, PT>0.5 GeV/c)
7 TeV
CMS ATLAS
PT(chgjet#1) Direction
“Toward”
“Transverse” “Transverse”
“Away”
Oregon Terascale Workshop March 7, 2011
Rick Field – Florida/CDF/CMS Page 20
PYTHIA Tune DWPYTHIA Tune DW
CMS preliminary data at 900 GeV and 7 TeV on the “transverse” charged PTsum density, dPT/dd, as defined by the leading charged particle jet (chgjet#1) for charged particles with pT > 0.5 GeV/c and || < 2. The data are uncorrected and compared with PYTHIA Tune DW after detector simulation.
ATLAS preliminary data at 900 GeV and 7 TeV on the “transverse” charged PTsum density, dPT/dd, as defined by the leading charged particle (PTmax) for charged particles with pT > 0.5 GeV/c and || < 2.5. The data are corrected and compared with PYTHIA Tune DW at the generator level.
"Transverse" Charged PTsum Density: dPT/dd
0.0
0.4
0.8
1.2
1.6
0 5 10 15 20 25 30 35 40 45 50
PT(chgjet#1) (GeV/c)
Ch
arg
ed P
Tsu
m D
ensi
ty (
GeV
/c)
CMS Preliminarydata uncorrected
pyDW + SIM
Charged Particles (||<2.0, PT>0.5 GeV/c)
900 GeV
7 TeV
"Transverse" Charged PTsum Density: dPT/dd
0.0
0.5
1.0
1.5
0 2 4 6 8 10 12 14 16 18 20
PTmax (GeV/c)
PT
sum
Den
sity
(G
eV/c
)
RDF PreliminaryATLAS corrected data
Tune DW generator level
900 GeV
7 TeV
Charged Particles (||<2.5, PT>0.5 GeV/c)
CMS ATLAS
PTmax Direction
“Toward”
“Transverse” “Transverse”
“Away”
PT(chgjet#1) Direction
“Toward”
“Transverse” “Transverse”
“Away”

Oregon Terascale Workshop March 7, 2011
Rick Field – Florida/CDF/CMS Page 21
““Transverse” Charge DensityTransverse” Charge Density
PTmax Direction
“Toward”
“Transverse” “Transverse”
“Away”
PTmax Direction
“Toward”
“Transverse” “Transverse”
“Away”
LHC 900 GeV
LHC7 TeV
900 GeV → 7 TeV (UE increase ~ factor of 2)
"Transverse" Charged Particle Density: dN/dd
0.0
0.4
0.8
1.2
0 2 4 6 8 10 12 14 16 18 20
PTmax (GeV/c)
"Tra
ns
ve
rse
" C
ha
rge
d D
en
sit
y
Charged Particles (||<2.0, PT>0.5 GeV/c)
RDF Preliminarypy Tune DW generator level
900 GeV
7 TeV
Shows the charged particle density in the “transverse” region for charged particles (pT > 0.5 GeV/c, || < 2) at 900 GeV and 7 TeV as defined by PTmax from PYTHIA Tune DW and at the particle level (i.e. generator level).
factor of 2!
~0.4 → ~0.8
Rick FieldMB&UE@CMS WorkshopCERN, November 6, 2009
Prediction!

Oregon Terascale Workshop March 7, 2011
Rick Field – Florida/CDF/CMS Page 22
PYTHIA Tune DWPYTHIA Tune DW
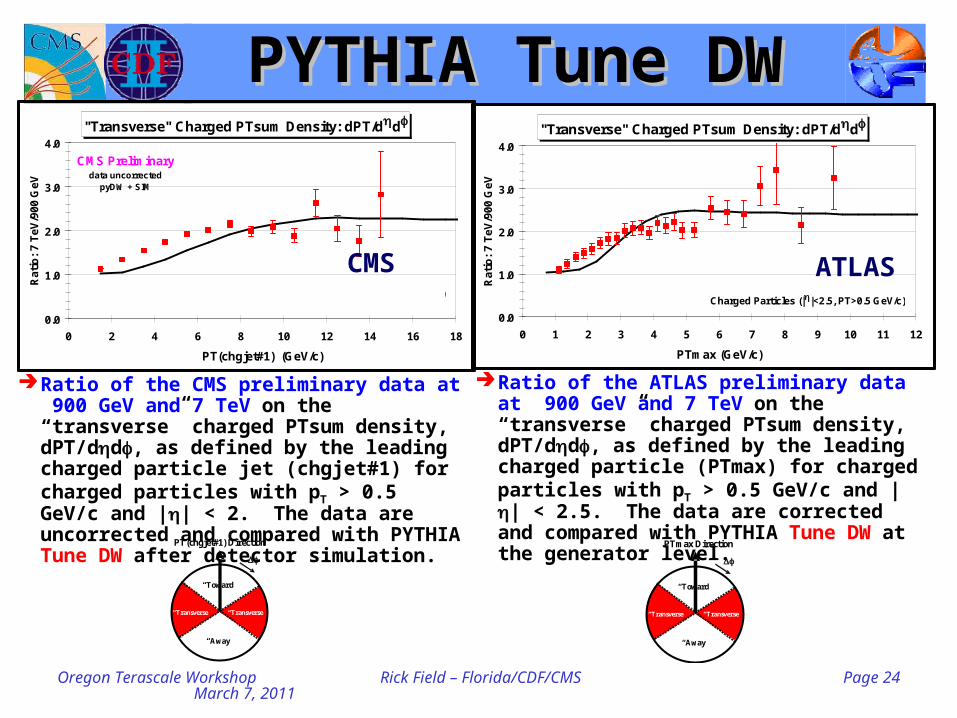
Ratio of CMS preliminary data at 900 GeV and 7 TeV on the “transverse” charged particle density, dN/dd, as defined by the leading charged particle jet (chgjet#1) for charged particles with pT > 0.5 GeV/c and || < 2. The data are uncorrected and compared with PYTHIA Tune DW after detector simulation.
"Transverse" Charged Particle Density: dN/dd
0.0
1.0
2.0
3.0
0 2 4 6 8 10 12 14 16 18
PT(chgjet#1) (GeV/c)
Rat
io:
7 T
eV/9
00 G
eV
CMS Preliminarydata uncorrected
pyDW + SIM
Charged Particles (||<2.0, PT>0.5 GeV/c) 7 TeV / 900 GeV
CMS
PT(chgjet#1) Direction
“Toward”
“Transverse” “Transverse”
“Away”
CMS preliminary data at 900 GeV and 7 TeV on the “transverse” charged particle density, dN/dd, as defined by the leading charged particle jet (chgjet#1) for charged particles with pT > 0.5 GeV/c and || < 2. The data are uncorrected and compared with PYTHIA Tune DW after detector simulation.
"Transverse" Charged Particle Density: dN/dd
0.0
0.4
0.8
1.2
0 5 10 15 20 25 30 35 40 45 50
PT(chgjet#1) GeV/c
Ch
arg
ed P
arti
cle
Den
sity
900 GeV
CMS Preliminarydata uncorrected
pyDW + SIM
Charged Particles (||<2.0, PT>0.5 GeV/c)
7 TeV
CMS
PT(chgjet#1) Direction
“Toward”
“Transverse” “Transverse”
“Away”
Ratio

Oregon Terascale Workshop March 7, 2011
Rick Field – Florida/CDF/CMS Page 23
PYTHIA Tune DWPYTHIA Tune DW
Ratio of CMS preliminary data at 900 GeV and 7 TeV on the “transverse” charged particle density, dN/dd, as defined by the leading charged particle jet (chgjet#1) for charged particles with pT > 0.5 GeV/c and || < 2. The data are uncorrected and compared with PYTHIA Tune DW after detector simulation.
Ratio of the ATLAS preliminary data at 900 GeV and 7 TeV on the “transverse” charged particle density, dN/dd, as defined by the leading charged particle (PTmax) for charged particles with pT > 0.5 GeV/c and || < 2.5. The data are corrected and compared with PYTHIA Tune DW at the generator level.
"Transverse" Charged Particle Density: dN/dd
0.0
1.0
2.0
3.0
0 2 4 6 8 10 12 14 16 18
PT(chgjet#1) (GeV/c)
Rat
io:
7 T
eV/9
00 G
eV
CMS Preliminarydata uncorrected
pyDW + SIM
Charged Particles (||<2.0, PT>0.5 GeV/c) 7 TeV / 900 GeV
"Transverse" Charged Particle Density: dN/dd
0.0
1.0
2.0
3.0
0 1 2 3 4 5 6 7 8 9 10 11 12
PTmax (GeV/c)
Rat
io:
7 T
eV/9
00 G
eV
Charged Particles (||<2.5, PT>0.5 GeV/c)
RDF PreliminaryATLAS corrected datapyDW generator level
7 TeV / 900 GeV
CMS ATLAS
PTmax Direction
“Toward”
“Transverse” “Transverse”
“Away”
PT(chgjet#1) Direction
“Toward”
“Transverse” “Transverse”
“Away”
Oregon Terascale Workshop March 7, 2011
Rick Field – Florida/CDF/CMS Page 24
PYTHIA Tune DWPYTHIA Tune DW
Ratio of the CMS preliminary data at 900 GeV and 7 TeV on the “transverse” charged PTsum density, dPT/dd, as defined by the leading charged particle jet (chgjet#1) for charged particles with pT > 0.5 GeV/c and || < 2. The data are uncorrected and compared with PYTHIA Tune DW after detector simulation.
Ratio of the ATLAS preliminary data at 900 GeV and 7 TeV on the “transverse” charged PTsum density, dPT/dd, as defined by the leading charged particle (PTmax) for charged particles with pT > 0.5 GeV/c and || < 2.5. The data are corrected and compared with PYTHIA Tune DW at the generator level.
"Transverse" Charged PTsum Density: dPT/dd
0.0
1.0
2.0
3.0
4.0
0 1 2 3 4 5 6 7 8 9 10 11 12
PTmax (GeV/c)
Rat
io:
7 T
eV/9
00 G
eV
Charged Particles (||<2.5, PT>0.5 GeV/c)
RDF PreliminaryATLAS corrected datapyDW generator level
7 TeV / 900 GeV
"Transverse" Charged PTsum Density: dPT/dd
0.0
1.0
2.0
3.0
4.0
0 2 4 6 8 10 12 14 16 18
PT(chgjet#1) (GeV/c)
Rat
io:
7 T
eV/9
00 G
eV
CMS Preliminarydata uncorrected
pyDW + SIM
Charged Particles (||<2.0, PT>0.5 GeV/c) 7 TeV / 900 GeV
CMS ATLAS
PTmax Direction
“Toward”
“Transverse” “Transverse”
“Away”
PT(chgjet#1) Direction
“Toward”
“Transverse” “Transverse”
“Away”

Oregon Terascale Workshop March 7, 2011
Rick Field – Florida/CDF/CMS Page 25
““Transverse” Multiplicity DistributionTransverse” Multiplicity Distribution
CMS uncorrected data at 900 GeV and 7 TeV on the charged particle multiplicity distribution in the “transverse” region for charged particles (pT > 0.5 GeV/c, || < 2) as defined by the leading charged particle jet, chgjet#1, with PT(chgjet#1) > 3 GeV/c compared with PYTHIA Tune DW at the detector level (i.e. Theory + SIM).
Same hard scale at two different center-
of-mass energies!
Shows the growth of the “underlying event” as the center-of-mass energy increases.
"Transverse" Charged Particle Multiplicity
1.0E-07
1.0E-06
1.0E-05
1.0E-04
1.0E-03
1.0E-02
1.0E-01
1.0E+00
0 5 10 15 20 25 30 35 40
Number of Charged Particles
Pro
bab
ilit
y
CMS Preliminarydata uncorrected
pyDW + SIM
Normalized to 1
Charged Particles (||<2.0, PT>0.5 GeV/c)
PT(chgjet#1) > 3 GeV/c
900 GeV 7 TeV
CMS PT(chgjet#1) Direction
“Toward”
“Transverse” “Transverse”
“Away”

Oregon Terascale Workshop March 7, 2011
Rick Field – Florida/CDF/CMS Page 26
““Transverse” Multiplicity DistributionTransverse” Multiplicity Distribution
CMS uncorrected data at 7 TeV on the charged particle multiplicity distribution in the “transverse” region for charged particles (pT > 0.5 GeV/c, || < 2) as defined by the leading charged particle jet, chgjet#1, with PT(chgjet#1) > 3 GeV/c and PT(chgjet#1) > 20 GeV/c compared with PYTHIA Tune DW at the detector level (i.e. Theory + SIM).
Same center-of-mass energy at two different
hard scales!
Shows the growth of the “underlying event” as the hard scale increases.
"Transverse" Charged Particle Multiplicity
1.0E-07
1.0E-06
1.0E-05
1.0E-04
1.0E-03
1.0E-02
1.0E-01
1.0E+00
0 5 10 15 20 25 30 35 40
Number of Charged Particles
Pro
bab
ilit
y
CMS Preliminarydata uncorrected
pyDW + SIM
Normalized to 1
Charged Particles (||<2.0, PT>0.5 GeV/c)
7 TeV
PT(chgjet#1) > 20 GeV/c
PT(chgjet#1) > 3 GeV/c
CMS
PT(chgjet#1) Direction
“Toward”
“Transverse” “Transverse”
“Away”

Oregon Terascale Workshop March 7, 2011
Rick Field – Florida/CDF/CMS Page 27
PYTHIA Tune DWPYTHIA Tune DW
I am surprised that the Tunes did not do a better job of predicting the behavior of the “underlying event” at 900 GeV and 7 TeV!
How well did we do at predicting the “underlying event” at 900 GeV and 7 TeV?
"Transverse" Charged Particle Density: dN/dd
0.0
0.4
0.8
1.2
0 5 10 15 20 25 30 35 40 45 50
PT(chgjet#1) GeV/c
Ch
arg
ed P
arti
cle
Den
sity
900 GeV
CMS Preliminarydata uncorrected
pyDW + SIM
Charged Particles (||<2.0, PT>0.5 GeV/c)
7 TeV
"Transverse" Charged Particle Density: dN/dd
0.0
0.2
0.4
0.6
0.8
0 2 4 6 8 10 12 14 16 18
PTmax or PT(chgjet#1) (GeV/c)
"Tra
nsv
erse
" C
har
ged
Den
sity CMS Preliminary
data uncorrectedpyDW + SIM
900 GeV
ChgJet#1
PTmax
Charged Particles (||<2.0, PT>0.5 GeV/c)
"Transverse" Charged Particle Density: dN/dd
0.0
1.0
2.0
3.0
0 2 4 6 8 10 12 14 16 18
PT(chgjet#1) (GeV/c)
Rat
io:
7 T
eV/9
00 G
eV
CMS Preliminarydata uncorrected
pyDW + SIM
Charged Particles (||<2.0, PT>0.5 GeV/c) 7 TeV / 900 GeV
Tune DW Tune DW
Tune DW

Oregon Terascale Workshop March 7, 2011
Rick Field – Florida/CDF/CMS Page 28
PYTHIA Tune DWPYTHIA Tune DW
I am surprised that the Tunes did as well as they did at predicting the behavior of the “underlying event” at 900 GeV and 7 TeV!
How well did we do at predicting the “underlying event” at 900 GeV and 7 TeV?
"Transverse" Charged Particle Density: dN/dd
0.0
0.4
0.8
1.2
0 5 10 15 20 25 30 35 40 45 50
PT(chgjet#1) GeV/c
Ch
arg
ed P
arti
cle
Den
sity
900 GeV
CMS Preliminarydata uncorrected
pyDW + SIM
Charged Particles (||<2.0, PT>0.5 GeV/c)
7 TeV
"Transverse" Charged Particle Density: dN/dd
0.0
0.2
0.4
0.6
0.8
0 2 4 6 8 10 12 14 16 18
PTmax or PT(chgjet#1) (GeV/c)
"Tra
nsv
erse
" C
har
ged
Den
sity CMS Preliminary
data uncorrectedpyDW + SIM
900 GeV
ChgJet#1
PTmax
Charged Particles (||<2.0, PT>0.5 GeV/c)
"Transverse" Charged Particle Density: dN/dd
0.0
1.0
2.0
3.0
0 2 4 6 8 10 12 14 16 18
PT(chgjet#1) (GeV/c)
Rat
io:
7 T
eV/9
00 G
eV
CMS Preliminarydata uncorrected
pyDW + SIM
Charged Particles (||<2.0, PT>0.5 GeV/c) 7 TeV / 900 GeV
Tune DW Tune DW
Tune DW
Warning! All the UE studies lookat charged particles with pT > 0.5 GeV/c.We do not know if the models correctly
describe the UE at lower pT values!

Oregon Terascale Workshop March 7, 2011
Rick Field – Florida/CDF/CMS Page 29
ATLAS Tune AMBT1ATLAS Tune AMBT1Judith Katzy LPCC
MB&UE working group meeting, May 31, 2010.
Emily Nurse ICHEP, July 24, 2010.
ATLAS-CONF-2010-031

Oregon Terascale Workshop March 7, 2011
Rick Field – Florida/CDF/CMS Page 30
ATLAS Tune AMBT1ATLAS Tune AMBT1
Attempt to fit a subset of the “min-bias” data (Nchg ≥ 6) where the contamination due to diffraction is expected to be small!
Subset of the “min-bias” data!

Oregon Terascale Workshop March 7, 2011
Rick Field – Florida/CDF/CMS Page 31
PYTHIA Tune Z1PYTHIA Tune Z1
Proton Proton
PT(hard)
Outgoing Parton
Outgoing Parton
Underlying Event Underlying Event
Initial-State Radiation
Final-State Radiation
I believe that it is time to move to PYTHIA 6.4 (pT-ordered parton showers and new MPI model)!
Tune Z1: I started with the parameters of ATLAS Tune AMBT1, but I changed LO* to CTEQ5L and I varied PARP(82) and PARP(90) to get a very good fit of the CMS UE data at 900 GeV and 7 TeV.
UE&MB@CMSUE&MB@CMS
All my previous tunes (A, DW, DWT, D6, D6T, CW, X1, and X2) were PYTHIA 6.4 tunes using the old Q2-ordered parton showers and the old MPI model (really 6.2 tunes)!
PARP(90)
Color
Connections
PARP(82)
Diffraction
The ATLAS Tune AMBT1 was designed to fit the inelastic data for Nchg ≥ 6 and to fit the PTmax UE data with PTmax > 10 GeV/c. Tune AMBT1 is primarily a min-bias tune, while Tune Z1 is a UE tune!

Oregon Terascale Workshop March 7, 2011
Rick Field – Florida/CDF/CMS Page 32
PYTHIA Tune Z1PYTHIA Tune Z1Parameter
Tune Z1
(R. Field CMS)Tune AMBT1
(ATLAS)
Parton Distribution Function CTEQ5L LO*
PARP(82) – MPI Cut-off 1.932 2.292
PARP(89) – Reference energy, E0 1800.0 1800.0
PARP(90) – MPI Energy Extrapolation 0.275 0.25
PARP(77) – CR Suppression 1.016 1.016
PARP(78) – CR Strength 0.538 0.538
PARP(80) – Probability colored parton from BBR 0.1 0.1
PARP(83) – Matter fraction in core 0.356 0.356
PARP(84) – Core of matter overlap 0.651 0.651
PARP(62) – ISR Cut-off 1.025 1.025
PARP(93) – primordial kT-max 10.0 10.0
MSTP(81) – MPI, ISR, FSR, BBR model 21 21
MSTP(82) – Double gaussion matter distribution 4 4
MSTP(91) – Gaussian primordial kT 1 1
MSTP(95) – strategy for color reconnection 6 6
Parameters not shown are the PYTHIA 6.4
defaults!

Oregon Terascale Workshop March 7, 2011
Rick Field – Florida/CDF/CMS Page 33
CMS UE DataCMS UE Data
CMS preliminary data at 900 GeV and 7 TeV on the “transverse” charged particle density, dN/dd, as defined by the leading charged particle jet (chgjet#1) for charged particles with pT > 0.5 GeV/c and || < 2.0. The data are uncorrected and compared with PYTHIA Tune Z1 after detector simulation (SIM).
CMS preliminary data at 900 GeV and 7 TeV on the “transverse” charged particle density, dN/dd, as defined by the leading charged particle jet (chgjet#1) for charged particles with pT > 0.5 GeV/c and || < 2.0. The data are uncorrected and compared with PYTHIA Tune DW and D6T after detector simulation (SIM).
"Transverse" Charged Particle Density: dN/dd
0.0
0.4
0.8
1.2
0 5 10 15 20 25 30 35 40 45 50
PT(chgjet#1) GeV/c
Ch
arg
ed P
arti
cle
Den
sity
900 GeV
CMS Preliminarydata uncorrected
Theory + SIM
7 TeV
DW
D6T
"Transverse" Charged Particle Density: dN/dd
0.0
0.4
0.8
1.2
0 5 10 15 20 25 30 35 40 45 50
PT(chgjet#1) GeV/c
Ch
arg
ed P
arti
cle
Den
sity
900 GeV
CMS Preliminarydata uncorrected
pyZ1 + SIM
Charged Particles (||<2.0, PT>0.5 GeV/c)
7 TeV
Tune Z1 (CTEQ5L)PARP(82) = 1.932PARP(90) = 0.275PARP(77) = 1.016PARP(78) = 0.538
Tune Z1 is a PYTHIA 6.4 using pT-ordered parton showers and
the new MPI model!
Color reconnection suppression.Color reconnection strength.
CMS CMSTune Z1

Oregon Terascale Workshop March 7, 2011
Rick Field – Florida/CDF/CMS Page 34
CMS UE DataCMS UE Data
CMS preliminary data at 900 GeV and 7 TeV on the “transverse” charged PTsum density, dPT/dd, as defined by the leading charged particle jet (chgjet#1) for charged particles with pT > 0.5 GeV/c and || < 2.0. The data are uncorrected and compared with PYTHIA Tune Z1 after detector simulation (SIM).
CMS preliminary data at 900 GeV and 7 TeV on the “transverse” charged PTsum density, dPT/dd, as defined by the leading charged particle jet (chgjet#1) for charged particles with pT > 0.5 GeV/c and || < 2.0. The data are uncorrected and compared with PYTHIA Tune DW and D6T after detector simulation (SIM).
"Transverse" Charged PTsum Density: dPT/dd
0.0
0.4
0.8
1.2
1.6
0 5 10 15 20 25 30 35 40 45 50
PT(chgjet#1) (GeV/c)
Ch
arg
ed P
Tsu
m D
ensi
ty (
GeV
/c)
CMS Preliminarydata uncorrected
Theory + SIM
Charged Particles (||<2.0, PT>0.5 GeV/c)
900 GeV
7 TeV
DW
D6T
"Transverse" Charged PTsum Density: dPT/dd
0.0
0.4
0.8
1.2
1.6
0 5 10 15 20 25 30 35 40 45 50
PT(chgjet#1) (GeV/c)
Ch
arg
ed P
Tsu
m D
ensi
ty (
GeV
/c)
CMS Preliminarydata uncorrected
pyZ1 + SIM
Charged Particles (||<2.0, PT>0.5 GeV/c)
900 GeV
7 TeV
Tune Z1 (CTEQ5L)PARP(82) = 1.932PARP(90) = 0.275PARP(77) = 1.016PARP(78) = 0.538
Tune Z1 is a PYTHIA 6.4 using pT-ordered parton showers and
the new MPI model!
Color reconnection suppression.Color reconnection strength.
CMS CMSTune Z1

Oregon Terascale Workshop March 7, 2011
Rick Field – Florida/CDF/CMS Page 35
ATLAS UE DataATLAS UE Data
ATLAS published data at 900 GeV and 7 TeV on the “transverse” charged PTsum density, dPT/dd, as defined by the leading charged particle (PTmax) for charged particles with pT > 0.5 GeV/c and || < 2.5. The data are corrected and compared with PYTHIA Tune Z1 at the generrator level.
ATLAS published data at 900 GeV and 7 TeV on the “transverse” charged particle density, dN/dd, as defined by the leading charged particle (PTmax) for charged particles with pT > 0.5 GeV/c and || < 2.5. The data are corrected and compared with PYTHIA Tune Z1 at the generator level.
ATLASATLASTune Z1Tune Z1
"Transverse" Charged Particle Density: dN/dd
0.0
0.4
0.8
1.2
0 5 10 15 20 25
PTmax (GeV/c)
"Tra
nsv
ers
e" C
har
ged
Den
sit
y
Charged Particles (||<2.5, PT>0.5 GeV/c)
RDF Preliminary ATLAS corrected dataTune Z1 generator level
900 GeV
7 TeV
"Transverse" Charged PTsum Density: dPT/dd
0.0
0.5
1.0
1.5
0 5 10 15 20 25
PTmax (GeV/c)
PT
su
m D
en
sit
y (G
eV/c
)
Charged Particles (||<2.5, PT>0.5 GeV/c)
RDF PreliminaryATLAS corrected data
Tune Z1 generator level
900 GeV
7 TeV
ATLAS publication – arXiv:1012.0791December 3, 2010
I read the points off with a ruler!

Oregon Terascale Workshop March 7, 2011
Rick Field – Florida/CDF/CMS Page 36
PYTHIA Tune Z1PYTHIA Tune Z1
ATLAS preliminary data at 7 TeV on the “transverse” charged PTsum density, dPT/dd, as defined by the leading charged particle (PTmax) for charged particles with pT > 0.5 GeV/c and || < 2.5. The data are corrected and compared with PYTHIA Tune Z1 at the generator level. Also shows the prediction of Tune Z1 for the “transverse” charged particle density with pT > 0.1 GeV/c and || < 2.5.
ATLAS preliminary data at 7 TeV on the “transverse” charged particle density, dN/dd, as defined by the leading charged particle (PTmax) for charged particles with pT > 0.5 GeV/c and || < 2.5. The data are corrected and compared with PYTHIA Tune Z1 at the generator level. Also shows the prediction of Tune Z1 for the “transverse” charged particle density with pT > 0.1 GeV/c and || < 2.5.
"Transverse" Charged Particle Density: dN/dd
0.0
0.5
1.0
1.5
2.0
2.5
0 2 4 6 8 10 12 14 16 18 20
PTmax (GeV/c)
"Tra
nsv
erse
" C
har
ged
Den
sity RDF Preliminary
ATLAS corrected dataTune Z1 generator level
7 TeV
Charged Particles (||<2.5)
PT > 0.1 GeV/c
PT > 0.5 GeV/c
"Transverse" Charged PTsum Density: dPT/dd
0.0
0.5
1.0
1.5
2.0
2.5
0 2 4 6 8 10 12 14 16 18 20
PTmax (GeV/c)
"Tra
nsv
erse
" P
Tsu
m D
ensi
ty RDF PreliminaryATLAS corrected data
Tune Z1 generator level
7 TeV
PT > 0.1 GeV/c
PT > 0.5 GeV/cCharged Particles (||<2.5) Tune Z1
ATLASTune Z1
ATLAS
Factor of 2 increase!
"Transverse" Ratio: PT > 0.1 and > 0.5 GeV/c
0.0
1.0
2.0
3.0
4.0
0 2 4 6 8 10 12 14 16 18 20
PTmax (GeV/c)
"Tra
nsv
erse
" R
atio
0.1
/0.5
RDF Preliminary generator levelTune Z1 (solid)
Tune DW (dashed)
7 TeVCharged Particles (||<2.5)
Charge Particle Density
Charge PTsum Density
Rick FieldMPI@LHC 2010 Glasgow, Scotland
December 2, 2010

Oregon Terascale Workshop March 7, 2011
Rick Field – Florida/CDF/CMS Page 37
ATLAS UE DataATLAS UE Data
ATLAS published data at 7 TeV on the “transverse” charged PTsum density, dPT/dd, as defined by the leading charged particle (PTmax) for charged particles with pT > 0.5 GeV/c and pT > 0.1 GeV/c (|| < 2.5). The data are corrected and compared with PYTHIA Tune Z1 at the generator level.
ATLAS published data at 7 TeV on the “transverse” charged particle density, dN/dd, as defined by the leading charged particle (PTmax) for charged particles with pT > 0.5 GeV/c and pT > 0.1 GeV/c (|| < 2.5). The data are corrected and compared with PYTHIA Tune Z1 at the generator level.
"Transverse" Charged Particle Density: dN/dd
0.0
0.5
1.0
1.5
2.0
2.5
0 2 4 6 8 10 12 14 16 18 20
PTmax (GeV/c)
"Tra
nsv
erse
" C
har
ged
Den
sity RDF Preliminary
ATLAS corrected dataTune Z1 generator level
7 TeV
Charged Particles (||<2.5)
PT > 0.1 GeV/c
PT > 0.5 GeV/c
"Transverse" Charged PTsum Density: dPT/dd
0.0
0.5
1.0
1.5
2.0
2.5
0 2 4 6 8 10 12 14 16 18 20
PTmax (GeV/c)
"Tra
nsv
erse
" P
Tsu
m D
ensi
ty RDF PreliminaryATLAS corrected data
Tune Z1 generator level
7 TeV
PT > 0.1 GeV/c
PT > 0.5 GeV/cCharged Particles (||<2.5)
"Transverse" Charged Particle Density: dN/dd
0.0
0.5
1.0
1.5
2.0
2.5
0 2 4 6 8 10 12 14 16 18 20
PTmax (GeV/c)
"Tra
ns
ve
rse
" C
harg
ed
Den
sit
y RDF PreliminaryATLAS corrected data
Tune Z1 generator level
7 TeV
PT > 0.1 GeV/c
PT > 0.5 GeV/cCharged Particles (||<2.5)
Tune Z1 ATLAS
"Transverse" Charged PTsum Density: dPT/dd
0.0
0.5
1.0
1.5
2.0
2.5
0 2 4 6 8 10 12 14 16 18 20
PTmax (GeV/c)
PT
su
m D
en
sit
y (
Ge
V/c
)
RDF PreliminaryATLAS corrected data
Tune Z1 generator level
7 TeV
PT > 0.1 GeV/c
PT > 0.5 GeV/c
Charged Particles (||<2.5)
Tune Z1
ATLAS
ATLAS publication – arXiv:1012.0791December 3, 2010
I read the points off with a ruler!
"Transverse" Ratio: PT > 0.1 and > 0.5 GeV/c
0.0
1.0
2.0
3.0
4.0
0 2 4 6 8 10 12 14 16 18 20
PTmax (GeV/c)
"Tra
nsv
erse
" R
atio
0.1
/0.5
7 TeVCharged Particles (||<2.5)
RDF PreliminaryATLAS corrected data
Tune Z1 generator levelCharge Particle Density
Charge PTsum Density

Oregon Terascale Workshop March 7, 2011
Rick Field – Florida/CDF/CMS Page 38
ALICE UE DataALICE UE Data
ALICE preliminary data at 900 GeV and 7 TeV on the “transverse” charged PTsum density, dPT/dd, as defined by the leading charged particle (PTmax) for charged particles with pT > 0.5 GeV/c and || < 0.8. The data are corrected and compared with PYTHIA Tune Z1 at the generrator level.
ALICE preliminary data at 900 GeV and 7 TeV on the “transverse” charged particle density, dN/dd, as defined by the leading charged particle (PTmax) for charged particles with pT > 0.5 GeV/c and || < 0.8. The data are corrected and compared with PYTHIA Tune Z1 at the generator level.
ALICE UE Data: Talk by S. ValleroMPI@LHC 2010 Glasgow, Scotland
November 30, 2010
"Transverse" Charged Particle Density: dN/dd
0.0
0.4
0.8
1.2
0 5 10 15 20 25
PTmax (GeV/c)
"Tra
nsv
erse
" C
har
ged
Den
sity RDF Preliminary
ALICE corrected dataTune Z1 generator level
Charged Particles (||<0.8, PT>0.5 GeV/c)
900 GeV
7 TeV
"Transverse" Charged PTsum Density: dPT/dd
0.0
0.5
1.0
1.5
0 5 10 15 20 25
PTmax (GeV/c)
PT
sum
Den
sity
(G
eV/c
)
RDF PreliminaryALICE corrected data
Tune Z1 generator level
Charged Particles (||<0.8, PT>0.5 GeV/c)
900 GeV
7 TeV
ALICETune Z1
ALICETune Z1
I read the points off with a ruler!

Oregon Terascale Workshop March 7, 2011
Rick Field – Florida/CDF/CMS Page 39
ATLAS UE DataATLAS UE Data
ATLAS preliminary data at 900 GeV and 7 TeV on the “transverse” charged PTsum density, dPT/dd, as defined by the leading charged particle (PTmax) for charged particles with pT > 0.5 GeV/c and || < 0.8. The data are corrected and compared with PYTHIA Tune Z1 at the generrator level.
ATLAS preliminary data at 900 GeV and 7 TeV on the “transverse” charged particle density, dN/dd, as defined by the leading charged particle (PTmax) for charged particles with pT > 0.5 GeV/c and || < 0.8. The data are corrected and compared with PYTHIA Tune Z1 at the generator level.
ATLAS-CONF-2011-009February 21, 2011
I read the points off with a ruler!
"Transverse" Charged Particle Density: dN/dd
0.0
0.4
0.8
1.2
0 5 10 15 20 25
PTmax (GeV/c)
"Tra
nsv
erse
" C
har
ged
Den
sity
RDF PreliminaryATLAS corrected data
Tune Z1 generator level
Charged Particles (||<0.8, PT>0.5 GeV/c)
900 GeV
7 TeV
ATLASTune Z1
"Transverse" Charged PTsum Density: dPT/dd
0.0
0.5
1.0
1.5
0 5 10 15 20 25
PTmax (GeV/c)
PT
sum
Den
sity
(G
eV/c
)
Charged Particles (|| < 0.8, PT > 0.5 GeV/c)
RDF PreliminaryATLAS corrected data
Tune Z1 generator level
900 GeV
7 TeV
ATLASTune Z1

Oregon Terascale Workshop March 7, 2011
Rick Field – Florida/CDF/CMS Page 40
ATLAS UE DataATLAS UE Data
ATLAS preliminary data at 7 TeV on the “transverse” charged PTsum density, dPT/dd, as defined by the leading charged particle (PTmax) for charged particles with pT > 0.5 GeV/c and || < 0.8 and || < 2.5. The data are corrected and compared with PYTHIA Tune Z1 at the generrator level.
ATLAS preliminary data at 7 TeV on the “transverse” charged particle density, dN/dd, as defined by the leading charged particle (PTmax) for charged particles with pT > 0.5 GeV/c and || < 0.8 and || < 2.5. The data are corrected and compared with PYTHIA Tune Z1 at the generator level.
ATLAS-CONF-2011-009February 21, 2011
I read the points off with a ruler!
"Transverse" Charged Particle Density: dN/dd
0.0
0.4
0.8
1.2
0 5 10 15 20
PTmax (GeV/c)
"Tra
nsv
erse
" C
har
ged
Den
sity RDF Preliminary
Tune Z1 generator level
7 TeV Charged Particles (PT > 0.5 GeV/c)
|| < 0.8
|| < 2.5 ATLAS
ATLASTune Z1
"Transverse" Charged PTsum Density: dPT/dd
0.0
0.5
1.0
1.5
0 5 10 15 20
PTmax (GeV/c)
PT
sum
Den
sity
(G
eV/c
)
RDF PreliminaryTune Z1 generator level
7 TeV Charged Particles (PT > 0.5 GeV/c)
|| < 0.8
|| < 2.5
ATLAS
ATLASTune Z1

Oregon Terascale Workshop March 7, 2011
Rick Field – Florida/CDF/CMS Page 41
ATLAS UE DataATLAS UE Data
ATLAS preliminary data at 900 GeV on the “transverse” charged PTsum density, dPT/dd, as defined by the leading charged particle (PTmax) for charged particles with pT > 0.5 GeV/c and || < 0.8 and || < 2.5. The data are corrected and compared with PYTHIA Tune Z1 at the generrator level.
ATLAS preliminary data at 900 GeV on the “transverse” charged particle density, dN/dd, as defined by the leading charged particle (PTmax) for charged particles with pT > 0.5 GeV/c and || < 0.8 and || < 2.5. The data are corrected and compared with PYTHIA Tune Z1 at the generator level.
ATLAS-CONF-2011-009February 21, 2011
I read the points off with a ruler!
"Transverse" Charged Particle Density: dN/dd
0.0
0.2
0.4
0.6
0.8
0 2 4 6 8 10
PTmax (GeV/c)
"Tra
nsv
erse
" C
har
ged
Den
sity RDF Preliminary
Tune Z1 generator level
Charged Particles (PT > 0.5 GeV/c)
|| < 0.8
|| < 2.5
900 GeV
ATLAS
ATLASTune Z1
"Transverse" Charged PTsum Density: dPT/dd
0.0
0.2
0.4
0.6
0.8
0 2 4 6 8 10
PTmax (GeV/c)
PT
sum
Den
sity
(G
eV/c
)
RDF PreliminaryTune Z1 generator level
Charged Particles (PT > 0.5 GeV/c)
|| < 0.8
|| < 2.5
900 GeV
ATLAS
ATLASTune Z1

Oregon Terascale Workshop March 7, 2011
Rick Field – Florida/CDF/CMS Page 42
ALICE-ATLAS UEALICE-ATLAS UE
ATLAS preliminary data at 900 GeV and 7 TeV on the “transverse” charged particle density, dN/dd, as defined by the leading charged particle (PTmax) for charged particles with pT > 0.5 GeV/c and || < 0.8. The data are corrected and compared with PYTHIA Tune Z1 at the generrator level.
ALICE preliminary data at 900 GeV and 7 TeV on the “transverse” charged particle density, dN/dd, as defined by the leading charged particle (PTmax) for charged particles with pT > 0.5 GeV/c and || < 0.8. The data are corrected and compared with PYTHIA Tune Z1 at the generator level.
"Transverse" Charged Particle Density: dN/dd
0.0
0.4
0.8
1.2
0 5 10 15 20 25
PTmax (GeV/c)
"Tra
nsv
erse
" C
har
ged
Den
sity RDF Preliminary
ALICE corrected dataTune Z1 generator level
Charged Particles (||<0.8, PT>0.5 GeV/c)
900 GeV
7 TeV
ALICETune Z1
"Transverse" Charged Particle Density: dN/dd
0.0
0.4
0.8
1.2
0 5 10 15 20 25
PTmax (GeV/c)
"Tra
nsv
erse
" C
har
ged
Den
sity
RDF PreliminaryATLAS corrected data
Tune Z1 generator level
Charged Particles (||<0.8, PT>0.5 GeV/c)
900 GeV
7 TeV
ATLASTune Z1

Oregon Terascale Workshop March 7, 2011
Rick Field – Florida/CDF/CMS Page 43
ALICE-ATLAS UEALICE-ATLAS UE
ATLAS preliminary data at 900 GeV and 7 TeV on the “transverse” charged particle density, dN/dd, as defined by the leading charged particle (PTmax) for charged particles with pT > 0.5 GeV/c and || < 0.8. The data are corrected and compared with PYTHIA Tune Z1 at the generrator level.
ALICE preliminary data at 900 GeV and 7 TeV on the “transverse” charged particle density, dN/dd, as defined by the leading charged particle (PTmax) for charged particles with pT > 0.5 GeV/c and || < 0.8. The data are corrected and compared with PYTHIA Tune Z1 at the generator level.
ALICETune Z1
"Transverse" Charged PTsum Density: dPT/dd
0.0
0.5
1.0
1.5
0 5 10 15 20 25
PTmax (GeV/c)
PT
sum
Den
sity
(G
eV/c
)
RDF PreliminaryALICE corrected data
Tune Z1 generator level
Charged Particles (||<0.8, PT>0.5 GeV/c)
900 GeV
7 TeV
"Transverse" Charged PTsum Density: dPT/dd
0.0
0.5
1.0
1.5
0 5 10 15 20 25
PTmax (GeV/c)
PT
sum
Den
sity
(G
eV/c
)
Charged Particles (|| < 0.8, PT > 0.5 GeV/c)
RDF PreliminaryATLAS corrected data
Tune Z1 generator level
900 GeV
7 TeV
ATLASTune Z1

Oregon Terascale Workshop March 7, 2011
Rick Field – Florida/CDF/CMS Page 44
PYTHIA Tune Z1PYTHIA Tune Z1
CMS preliminary data at 900 GeV and 7 TeV on the “transverse” charged particle density, dN/dd, as defined by the leading charged particle jet (chgjet#1) for charged particles with pT > 0.5 GeV/c and || < 2. The data are uncorrected and compared with PYTHIA Tune Z1 after detector simulation.
CDF published data at 1.96 TeV on the “transverse” charged particle density, dN/dd, as defined by the leading calorimeter jet (jet#1) for charged particles with pT > 0.5 GeV/c and || < 1.0. The data are corrected and compared with PYTHIA Tune Z1 at the generator level.
"Transverse" Charged Particle Density: dN/dd
0.0
0.4
0.8
1.2
0 50 100 150 200 250 300 350 400
PT(jet#1) (GeV/c)
"Tra
nsv
erse
" C
har
ged
Den
sit
y
CDF Run 2data corrected
pyZ1 generator level
"Leading Jet"MidPoint R=0.7 |(jet#1)|<2
Charged Particles (||<1.0, PT>0.5 GeV/c)
1.96 TeV
"Transverse" Charged Particle Density: dN/dd
0.0
0.4
0.8
1.2
0 5 10 15 20 25 30 35 40 45 50
PT(chgjet#1) GeV/c
Ch
arg
ed P
arti
cle
Den
sity
900 GeV
CMS Preliminarydata uncorrected
pyZ1 + SIM
Charged Particles (||<2.0, PT>0.5 GeV/c)
7 TeV
CMS CDFTune Z1
Tune Z1

Oregon Terascale Workshop March 7, 2011
Rick Field – Florida/CDF/CMS Page 45
PYTHIA Tune Z1PYTHIA Tune Z1
CMS preliminary data at 900 GeV and 7 TeV on the “transverse” charged particle density, dN/dd, as defined by the leading charged particle jet (chgjet#1) for charged particles with pT > 0.5 GeV/c and || < 2. The data are uncorrected and compared with PYTHIA Tune Z1 after detector simulation.
CDF published data at 1.96 TeV on the “transverse” charged particle density, dN/dd, as defined by the leading calorimeter jet (jet#1) for charged particles with pT > 0.5 GeV/c and || < 1.0. The data are corrected and compared with PYTHIA Tune Z1 at the generator level.
"Transverse" Charged Particle Density: dN/dd
0.0
0.4
0.8
1.2
0 50 100 150 200 250 300 350 400
PT(jet#1) (GeV/c)
"Tra
nsv
erse
" C
har
ged
Den
sit
y
CDF Run 2data corrected
pyZ1 generator level
"Leading Jet"MidPoint R=0.7 |(jet#1)|<2
Charged Particles (||<1.0, PT>0.5 GeV/c)
1.96 TeV
"Transverse" Charged Particle Density: dN/dd
0.0
0.4
0.8
1.2
0 5 10 15 20 25 30 35 40 45 50
PT(chgjet#1) GeV/c
Ch
arg
ed P
arti
cle
Den
sity
900 GeV
CMS Preliminarydata uncorrected
pyZ1 + SIM
Charged Particles (||<2.0, PT>0.5 GeV/c)
7 TeV
CMS CDF
Oops Tune Z1 is slightly high at CDF!
Tune Z1
Tune Z1

Oregon Terascale Workshop March 7, 2011
Rick Field – Florida/CDF/CMS Page 46
PYTHIA Tune Z1PYTHIA Tune Z1
MPI Cut-Off versus the Center-of Mass Energy Wcm: PYTHIA Tune Z1 was determined by fitting pT0 independently at 900 GeV and 7 TeV and calculating = PARP(90). The best fit to pT0 at CDF is slightly higher than the Tune Z1 curve. This is very preliminary! Perhaps with a global fit to all three energies (i.e. “Professor” tune) one can get a simultaneous fit to all three??
MPI Cut-Off PT0(Wcm)
1.0
1.5
2.0
2.5
3.0
3.5
0 2000 4000 6000 8000 10000 12000
Center-of-Mass Energy Wcm (GeV)
PT
0 (G
eV/c
)
RDF Very Preliminary
Tune Z1
CMS 900 GeV
CMS 7 TeV
CDF 1.96 TeV
pT0(W)=pT0(W/W0) = PARP(90) pT0 = PARP(82) W = Ecm
pT0(W)=pT0(W/W0)e

Oregon Terascale Workshop March 7, 2011
Rick Field – Florida/CDF/CMS Page 47
PYTHIA Tune Z1PYTHIA Tune Z1
MPI Cut-Off versus the Center-of Mass Energy Wcm: PYTHIA Tune Z1 was determined by fitting pT0 independently at 900 GeV and 7 TeV and calculating = PARP(90). The best fit to pT0 at CDF is slightly higher than the Tune Z1 curve. This is very preliminary! Perhaps with a global fit to all three energies (i.e. “Professor” tune) one can get a simultaneous fit to all three??
pT0(W)=pT0(W/W0) = PARP(90) pT0 = PARP(82) W = Ecm
MPI Cut-Off PT0(Wcm)
1.0
1.5
2.0
2.5
3.0
3.5
0 2000 4000 6000 8000 10000 12000
Center-of-Mass Energy Wcm (GeV)
PT
0 (G
eV/c
)
RDF Very Preliminary
Tune Z1
CMS 900 GeV
CMS 7 TeV
CDF 1.96 TeV
More UE activity for W > 7 TeV!??

Oregon Terascale Workshop March 7, 2011
Rick Field – Florida/CDF/CMS Page 48
““Transverse” Multiplicity DistributionTransverse” Multiplicity Distribution
CMS uncorrected data at 900 GeV and 7 TeV on the charged particle multiplicity distribution in the “transverse” region for charged particles (pT > 0.5 GeV/c, || < 2) as defined by the leading charged particle jet with PT(chgjet#1) > 3 GeV/c compared with PYTHIA Tune DW and Tune D6T at the detector level (i.e. Theory + SIM).
"Transverse" Charged Particle Multiplicity
1.0E-07
1.0E-06
1.0E-05
1.0E-04
1.0E-03
1.0E-02
1.0E-01
1.0E+00
0 5 10 15 20 25 30 35 40
Number of Charged Particles
Pro
bab
ilit
y
CMS Preliminarydata uncorrected
Theory + SIM
Normalized to 1
Charged Particles (||<2.0, PT>0.5 GeV/c)
PT(chgjet#1) > 3 GeV/c
900 GeV 7 TeV
D6T
DW
"Transverse" Charged Particle Multiplicity
1.0E-07
1.0E-06
1.0E-05
1.0E-04
1.0E-03
1.0E-02
1.0E-01
1.0E+00
0 5 10 15 20 25 30 35 40
Number of Charged Particles
Pro
bab
ilit
y
CMS Preliminarydata uncorrected
pyZ1 + SIM
Normalized to 1
Charged Particles (||<2.0, PT>0.5 GeV/c)
PT(chgjet#1) > 3 GeV/c
900 GeV 7 TeV
Tune Z1
CMS uncorrected data at 900 GeV and 7 TeV on the charged particle multiplicity distribution in the “transverse” region for charged particles (pT > 0.5 GeV/c, || < 2) as defined by the leading charged particle jet with PT(chgjet#1) > 3 GeV/c compared with PYTHIA Tune Z1 at the detector level (i.e. Theory + SIM).
CMSCMS
Same hard scale at two different center-
of-mass energies!
Difficult to produce enough events with large “transverse” multiplicity at low
hard scale!

Oregon Terascale Workshop March 7, 2011
Rick Field – Florida/CDF/CMS Page 49
““Transverse” PTsum DistributionTransverse” PTsum Distribution
CMS uncorrected data at 900 GeV and 7 TeV on the charged scalar PTsum distribution in the “transverse” region for charged particles (pT > 0.5 GeV/c, || < 2) as defined by the leading charged particle jet with PT(chgjet#1) > 3 GeV/c compared with PYTHIA Tune DW, and Tune D6T at the detector level (i.e. Theory + SIM).
"Transverse" Charged PTsum Distribution
1.0E-06
1.0E-05
1.0E-04
1.0E-03
1.0E-02
1.0E-01
1.0E+00
0 5 10 15 20 25 30 35 40 45 50
PTsum (GeV/c)
Pro
bab
ilit
y
Charged Particles (||<2.0, PT>0.5 GeV/c)
CMS Preliminarydata uncorrected
Theory + SIM
Normalized to 1
PT(chgjet#1) > 3 GeV/c
900 GeV
7 TeV
D6T
DW
"Transverse" Charged PTsum Distribution
1.0E-06
1.0E-05
1.0E-04
1.0E-03
1.0E-02
1.0E-01
1.0E+00
0 5 10 15 20 25 30 35 40 45 50
PTsum (GeV/c)
Pro
bab
ilit
y
Charged Particles (||<2.0, PT>0.5 GeV/c)
CMS Preliminarydata uncorrected
pyZ1+ SIM
Normalized to 1
PT(chgjet#1) > 3 GeV/c
900 GeV
7 TeV
CMS uncorrected data at 900 GeV and 7 TeV on the charged scalar PTsum distribution in the “transverse” region for charged particles (pT > 0.5 GeV/c, || < 2) as defined by the leading charged particle jet with PT(chgjet#1) > 3 GeV/c compared with PYTHIA Tune Z1, at the detector level (i.e. Theory + SIM).
Tune Z1
CMSCMS
Same hard scale at two different center-
of-mass energies!
Difficult to produce enough events with large “transverse”
PTsum at low hard scale!

Oregon Terascale Workshop March 7, 2011
Rick Field – Florida/CDF/CMS Page 50
““Transverse” Multiplicity DistributionTransverse” Multiplicity Distribution
CMS uncorrected data at 7 TeV on the charged particle multiplicity distribution in the “transverse” region for charged particles (pT > 0.5 GeV/c, || < 2) as defined by the leading charged particle jet with PT(chgjet#1) > 3 GeV/c and PT(chgjet#1) > 20 GeV/c compared with PYTHIA Tune DW and Tune D6T at the detector level (i.e. Theory + SIM).
"Transverse" Charged Particle Multiplicity
1.0E-07
1.0E-06
1.0E-05
1.0E-04
1.0E-03
1.0E-02
1.0E-01
1.0E+00
0 5 10 15 20 25 30 35 40
Number of Charged Particles
Pro
bab
ilit
y
CMS Preliminarydata uncorrected
Theory + SIM
Normalized to 1
Charged Particles (||<2.0, PT>0.5 GeV/c)
7 TeV
PT(chgjet#1) > 20 GeV/c
PT(chgjet#1) > 3 GeV/c
D6T
DW
"Transverse" Charged Particle Multiplicity
1.0E-07
1.0E-06
1.0E-05
1.0E-04
1.0E-03
1.0E-02
1.0E-01
1.0E+00
0 5 10 15 20 25 30 35 40
Number of Charged Particles
Pro
bab
ilit
y
CMS Preliminarydata uncorrected
pyZ1 + SIM
Normalized to 1
Charged Particles (||<2.0, PT>0.5 GeV/c)
7 TeV
PT(chgjet#1) > 20 GeV/c
PT(chgjet#1) > 3 GeV/c
CMS uncorrected data at 7 TeV on the charged particle multiplicity distribution in the “transverse” region for charged particles (pT > 0.5 GeV/c, || < 2) as defined by the leading charged particle jet with PT(chgjet#1) > 3 GeV/c and PT(chgjet#1) > 20 GeV/c compared with PYTHIA Tune Z1 at the detector level (i.e. Theory + SIM).
Tune Z1CMS
CMS
Same center-of-mass energy at two different
hard scales!
Difficult to produce enough events with large “transverse” multiplicity at low
hard scale!

Oregon Terascale Workshop March 7, 2011
Rick Field – Florida/CDF/CMS Page 51
““Transverse” PTsum DistributionTransverse” PTsum Distribution
CMS uncorrected data at 7 TeV on the charged PTsum distribution in the “transverse” region for charged particles (pT > 0.5 GeV/c, || < 2) as defined by the leading charged particle jet with PT(chgjet#1) > 3 GeV/c and PT(chgjet#1) > 20 GeV/c compared with PYTHIA Tune DW and Tune D6T at the detector level (i.e. Theory + SIM).
"Transverse" Charged PTsum Distribution
1.0E-06
1.0E-05
1.0E-04
1.0E-03
1.0E-02
1.0E-01
1.0E+00
0 5 10 15 20 25 30 35 40 45 50
PTsum (GeV/c)
Pro
bab
ilit
y
Charged Particles (||<2.0, PT>0.5 GeV/c)
CMS Preliminarydata uncorrected
Theory + SIM
Normalized to 1
PT(chgjet#1) > 20 GeV/c
PT(chgjet#1) > 3 GeV/c
7 TeV
D6T
DW
"Transverse" Charged PTsum Distribution
1.0E-06
1.0E-05
1.0E-04
1.0E-03
1.0E-02
1.0E-01
1.0E+00
0 5 10 15 20 25 30 35 40 45 50
PTsum (GeV/c)
Pro
bab
ilit
y
Charged Particles (||<2.0, PT>0.5 GeV/c)
CMS Preliminarydata uncorrected
pyZ1 + SIM
Normalized to 1
PT(chgjet#1) > 20 GeV/c
PT(chgjet#1) > 3 GeV/c
7 TeV
Tune Z1
CMS uncorrected data at 7 TeV on the charged PTsum distribution in the “transverse” region for charged particles (pT > 0.5 GeV/c, || < 2) as defined by the leading charged particle jet with PT(chgjet#1) > 3 GeV/c and PT(chgjet#1) > 20 GeV/c compared with PYTHIA Tune Z1 at the detector level (i.e. Theory + SIM).
CMSCMS
Same center-of-mass energy at two different
hard scales!
Difficult to produce enough events with large “transverse”
PTsum at low hard scale!

Oregon Terascale Workshop March 7, 2011
Rick Field – Florida/CDF/CMS Page 52
NSD Multiplicity DistributionNSD Multiplicity Distribution
Generator level charged multiplicity distribution (all pT, || < 2) at 900 GeV and 7 TeV. Shows the NSD = HC + DD prediction for Tune Z1. Also shows the CMS NSD data.
Charged Multiplicity Distribution
1.0E-04
1.0E-03
1.0E-02
1.0E-01
0 20 40 60 80 100
Number of Charged Particles
Pro
ba
bil
ity
Charged Particles (all PT, ||<2.0)
RDF Preliminarydata CMS NSD
pyZ1 generator level
7 TeV
900 GeV
CMS
Tune Z1
Difficult to produce enough events with large multiplicity!
Proton Proton
“Minumum Bias” Collisions
Okay not perfect!But not that bad!

Oregon Terascale Workshop March 7, 2011
Rick Field – Florida/CDF/CMS Page 53
MB & UEMB & UE
Generator level charged multiplicity distribution (all pT, || < 2) at 900 GeV and 7 TeV. Shows the NSD = HC + DD prediction for Tune Z1. Also shows the CMS NSD data.
Charged Multiplicity Distribution
1.0E-04
1.0E-03
1.0E-02
1.0E-01
0 20 40 60 80 100
Number of Charged Particles
Pro
ba
bil
ity
Charged Particles (all PT, ||<2.0)
RDF Preliminarydata CMS NSD
pyZ1 generator level
7 TeV
900 GeV
"Transverse" Charged Particle Multiplicity
1.0E-07
1.0E-06
1.0E-05
1.0E-04
1.0E-03
1.0E-02
1.0E-01
1.0E+00
0 5 10 15 20 25 30 35 40
Number of Charged Particles
Pro
bab
ilit
y
CMS Preliminarydata uncorrected
pyZ1 + SIM
Normalized to 1
Charged Particles (||<2.0, PT>0.5 GeV/c)
PT(chgjet#1) > 3 GeV/c
900 GeV 7 TeV
CMS uncorrected data at 900 GeV and 7 TeV on the charged particle multiplicity distribution in the “transverse” region for charged particles (pT > 0.5 GeV/c, || < 2) as defined by the leading charged particle jet with PT(chgjet#1) > 3 GeV/c compared with PYTHIA Tune Z1 at the detector level (i.e. Theory + SIM).
CMS CMSTune Z1
Tune Z1
“Min-Bias”
“Underlying Event”
Difficult to produce enough events with large multiplicity!
Difficult to produce enough events with large “transverse” multiplicity at low
hard scale!

Oregon Terascale Workshop March 7, 2011
Rick Field – Florida/CDF/CMS Page 54
MB & UEMB & UE
CMS uncorrected data at 7 TeV on the charged particle multiplicity distribution in the “transverse” region for charged particles (pT > 0.5 GeV/c, || < 2) as defined by the leading charged particle jet with PT(chgjet#1) > 20 GeV/c compared with PYTHIA Tune Z1 at the detector level (i.e. Theory + SIM). Also shows the CMS corrected NSD multiplicity distribution (all pT, || < 2) compared with Tune Z1 at the generator.
CMS
Tune Z1
Charged Particle Multiplicity
1.0E-05
1.0E-04
1.0E-03
1.0E-02
1.0E-01
1.0E+00
0 5 10 15 20 25 30 35 40
Number of Charged Particles
Pro
bab
ilit
y
CMS PreliminaryTune Z1
Normalized to 1
Charged Particles (||<2.0)
7 TeV
Underlying Event"Transverse" Region
pT > 0.5 GeV/cPT(chgjet#1) > 20 GeV/c
Min-BiasNSD All pT
Amazing what we are asking the Monte-Carlo models to fit!
Charged Particle Multiplicity
1.0E-05
1.0E-04
1.0E-03
1.0E-02
1.0E-01
1.0E+00
0 20 40 60 80 100
Number of Charged Particles
Pro
bab
ilit
y
CMS PreliminaryTune Z1
Normalized to 1
Charged Particles (||<2.0)
7 TeV
Underlying Event"Transverse" Region
pT > 0.5 GeV/cPT(chgjet#1) > 20 GeV/c
Min-BiasNSD All pT

Oregon Terascale Workshop March 7, 2011
Rick Field – Florida/CDF/CMS Page 55
Summary & ConclusionsSummary & ConclusionsI am surprised that the Tunes did as well as
they did at predicting the behavior of the “underlying event” at 900 GeV and 7 TeV! Remember this is “soft” QCD!
Tune Z1 does nice fob of fitting the CMS, ATLAS, and ALICE UE data at 900 GeV and 7 TeV! But Tune Z1 is a little high at CDF (1.96 TeV)! Not bad on MB!
Proton Proton
PT(hard)
Outgoing Parton
Outgoing Parton
Underlying Event Underlying Event
Initial-State Radiation
Final-State Radiation
Surprises: more soft particles than expected!, high multiplicity tails (possible new source of “soft” events with high multiplicity?), strange particles and baryons in the UE??
I still dream of a “universal” tune that
fits the UE at all energies! Need to
simultaneously tune LHC plus CDF
(“professor” tune)!
Next Step: More PYTHIA 6.4 and PYTHIA 8 tunes. Time to look more closely at Sherpa and HERWIG++!
CMS UE paper with corrected data using charged particle jets
to appear next week!

Oregon Terascale Workshop March 7, 2011
Rick Field – Florida/CDF/CMS Page 56
Northwest Terascale WorkshopNorthwest Terascale WorkshopModeling Min-Bias and the Underlying EventModeling Min-Bias and the Underlying Event
Rick FieldUniversity of Florida
UE&MB@CMSUE&MB@CMS
Part 2 (tomorrow) How are “min-bias” collisions related to the
“underlying event”.
CMS
ATLAS
University of Oregon March 7-11, 2011
Min-Bias Collisions at the LHC
PYTHIA 6.4 Tune Z1: CMS tune (pT-ordered parton showers and new MPI). Comparisons with the LHC Min-Bias data.
How well did we do at predicting the behavior of “min-bias” collisions at the LHC (900 GeV and 7 TeV)?
New Physics in Min-Bias?? Observation of long-range same-side correlations at 7 TeV.
Strange particle production: A problem for the models?
Proton Proton
“Minimum Bias” Collisions