Embed Size (px)
Citation preview
Oregon Reading First (2007) 1
Oregon Reading First Coaches’ Meeting
Spring 2007 IBR Preparation
April 25 and 26th, 2007

Oregon Reading First (2007) 2
Activity: Finding Partners for Today’s Activities
• NOTE: All of the coaches that you find and list must be from outside of your own school district!!
Find someone who....
• Partner 1. ...uses the same core program as your school __________________.
• Partner 2. ...uses the same third grade intervention program as your school. ________.
• Partner 3. ...has approximately the same number of students as your school. _______.
• Partner 4… has approximately the same number of teachers (K-3) as your school_____.
• Partner 5. ...you have never had a long conversation with ____________.
• Partner 6. ...lives in a different part of the state than you. ____________________.
3
WayneTrish
PatRachell
Scott
Carrie

Oregon Reading First (2007) 3
Overview of the IBR Process• GLTs
– Review Grade Level Data• Summary of Effectiveness Report
– Identify systems that need support• Benchmark, Strategic, and/or Intensive
– Plan Instructional Support• Healthy System Checklist
• ERT– Review Schoolwide Data– Create Action Plan

Oregon Reading First (2007) 4
Mini Review:How to Read a Summary Of
Effectiveness Report

Oregon Reading First (2007) 5
Summary of Effectiveness Report: Review
• Time Period, Grade Level, and Measure
• Number of students:
• Total included in the report
• Number with a Benchmark, Strategic, or Intensive in the middle of the year
• Number at each benchmark status

Oregon Reading First (2007) 6
At Risk
Intensive Strategic Benchmark
Time 1: ( e.g., Winter)
Time 2: (e.g., Spring)
1. Some Risk
2. Low Risk
At Risk
Some Risk
3. Low Risk
At Risk
Some Risk
4. Low Risk
DIBELS Summary of Effectiveness Reports4 Ways to Achieve Adequate Progress

Oregon Reading First (2007) 7
Middle of the Year Instructional Recommendation
Intensive Strategic Benchmark

Oregon Reading First (2007) 8
End of Year Benchmark Status
At Risk
1. Some Risk
2. Low Risk
At Risk
Some Risk
3. Low Risk
At Risk
Some Risk
4. Low Risk

Oregon Reading First (2007) 9
Jeopardy “Daily Double” Bonus Question!
The “Benchmark Status” column lists the percent of students who met the benchmark goal. This is the same question that you can answer with the “histogram” (bar graph) report. However, you may notice that the numbers are slightly different on the histogram reports and this report. Why?

Oregon Reading First (2007) 10
TRUE OR FALSE?CAUTION! THIS IS TRICKY!
T or F: An example of a student who made “Adequate Progress” is a kindergarten or first grade student who moved from strategic to benchmark.

Oregon Reading First (2007) 11
Defining Adequate Progress– (a) a benchmark instructional recommendation (i.e., at low risk
for reading difficulty based on DIBELS screening measures) and ended the year with “low risk/established” reading performance on the primary DIBELS measure administered at the end of the year;
– (b) a strategic instructional recommendation (i.e., at some risk for reading difficulty based on DIBELS screening measures) and ended the year with “low risk/established” reading performance on the primary DIBELS measure administered at the end of the year;
– (c) an intensive instructional recommendation (i.e., at risk for reading difficulty based on DIBELS screening measures) and ended the year with “low risk/established” OR “emerging/some risk” reading performance on the primary DIBELS measure administered at the end of the year.

Oregon Reading First (2007) 12
Defining Adequate Progress
• All of these definitions of adequate reading progress share the attribute of increasing the likelihood that a student will be a successful reader at the end of third grade. For many students, adequate progress reflects a meaningful reduction in the degree of reading risk from the beginning to the end of the school year. For students who are reading at benchmark level at the beginning of the year, adequate progress reflects continued reading at the benchmark level.

Oregon Reading First (2007) 13
Partner Practice
• How will you explain the concept of Adequate Progress (as used in the Summary of Effectiveness table) to teachers on your teams?
• Partner up and each take turns explaining the concept…
• Make notes on the back of your Cheat Sheet on example wording.

Oregon Reading First (2007) 14
Summary of Effectiveness Report: Review
Count = Number of students
% of Instructional Recommendation = How many students within the instructional range (i.e., benchmark, strategic, intensive) made adequate progress?
% of Total = How many students made adequate progress at this grade level?

Oregon Reading First (2007) 15
Let’s Create a “Cheat Sheet”
Step 1. Highlight the percentages in the “Summary of Effectiveness” Table that are added together to find the following totals:
Total percent of students that Made Adequate Progress (Blue)Percent of Intensive Students that made Adequate Progress (Pink)Percent of Strategic Students that made Adequate Progress (Yellow)Percent of Benchmark Students that made Adequate Progress (Green)
Step 2. Highlight the columns that correspond to which percentages are added together on the “Summary of
Effectiveness” Table.

Oregon Reading First (2007) 16
Total percent of students that Made Adequate
Progress Include actual numbers
of students, e.g., 90/100 or 90%.
Percent of Intensive Students that made Adequate Progress
Include actual numbers of students,
e.g., 1/5 or 20%.
Percent of Strategic Students that made Adequate Progress
Include actual numbers of students,
e.g., 25/50 or 50%.
Percent of Benchmark Students that made Adequate Progress
Include actual numbers of students,
e.g., 95/100 or 95%.
Grade/Benchmark Goal Measure
Winter to Spring 2006
Winter to
Spring 2007
Percent Change (+ or -)
Winter to
Spring 2006
Winter to
Spring 2007
Percent Change (+ or -)
Winter to
Spring 2006
Winter to
Spring 2007
Percent Change (+ or -)
Winter to
Spring 2006
Winter to
Spring 2007
Percent Change (+ or -)
Kindergarten- PSF
First Grade- ORF
Second Grade ORF

Oregon Reading First (2007) 17
IBR GLT

Oregon Reading First (2007) 18
Purpose of the IBR GLT Meeting
– Review Grade Level Data• Summary of Effectiveness Report
– Identify systems that need support• Benchmark, Strategic, and/or Intensive
– Plan Instructional Support• Healthy System Checklist

Oregon Reading First (2007) 19
IBR GLT Meeting Logistics
Preparing in Advance– Coach can fill in grade level data in advance or the
team could work on this together– Materials
• Each person will have their own packet• Green, Yellow and Pink highlighters• CSI Maps• Schedules • Data

Oregon Reading First (2007) 20
Step 1. Review spring reading outcomes for your grade level.
Discuss as a team: – Has the percentage of students established on each
measure increased? – Has the percentage of students at deficit on each
measure decreased? Discuss as a team.

Oregon Reading First (2007) 21
Table 1 Reviewing Outcomes for K-3 Studen ts Spring 2006 and Comparing to Spring 2007 OutcomesA B C D E F G
Grade/Measure Percent atEstablished(Low Risk)
Spring 2006
Percent atEstablished(Low Risk)
Spring 2007
PercentagePoint
Increase/Decrease
(+ or -)
Percent atDeficit
(At Risk)Spring 2006
Percent atDeficit
(At Risk)Spring 2007
PercentagePoint
Increase/Decrease
(+ or -)Kindergarten-PSFKindergarten-NWFFirst Grade- ORF
Second GradeORF
31% 39% 51% 36%
Third Grade ORF
Note: This table shows the percent of students that met the important end o f the year reading goals for the purpose of reviewingoutcomes.

Oregon Reading First (2007) 22
• Step 2: Use Figure 1 on the following page to evaluate the health of the Winter to Spring support systems for your grade level. Highlight Table 2 to reflect top (green highlighter), middle (yellow) and bottom (pink) quartiles.

Oregon Reading First (2007) 23
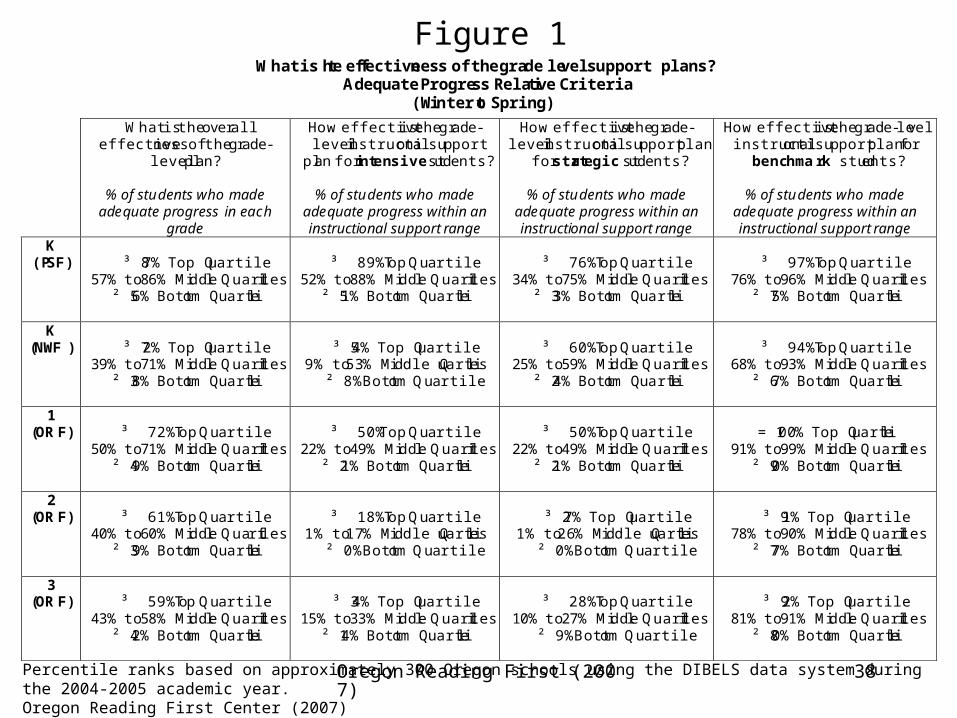
Figure 1
Percentile ranks based on approximately 300 Oregon schools using the DIBELS data system during the 2004-2005 academic year.Oregon Reading First Center (2007)
What is the effectiveness of the grade level support plans? Adequate Progress Relative Criteria
(Winter to Spring)
What is the overall effectiveness of the grade-
level plan?
% of students who made adequate progress in each
grade
How effective is the grade-level instructional support
plan for intensive students?
% of students who made adequate progress within an instructional support range
How effective is the grade-level instructional support plan
for strategic students?
% of students who made adequate progress within an instructional support range
How effective is the grade-level instructional support plan for
benchmark students?
% of students who made adequate progress within an instructional support range
K (PSF)
³ 8 7% Top Quartile
57% to 86% Middle Quartiles ² 5 6% Bottom Quartile
³ 89% Top Quartile
52% to 88% Middle Quartiles ² 5 1% Bottom Quartile
³ 76% Top Quartile
34% to 75% Middle Quartiles ² 3 3% Bottom Quartile
³ 97% Top Quartile
76% to 96% Middle Quartiles ² 7 5% Bottom Quartile
K (NWF)
³ 7 2% Top Quartile
39% to 71% Middle Quartiles ² 3 8% Bottom Quartile
³ 5 4% Top Quartile
9% to 53% Middle Quartiles ² 8% Bottom Quartile
³ 60% Top Quartile
25% to 59% Middle Quartiles ² 2 4% Bottom Quartile
³ 94% Top Quartile
68% to 93% Middle Quartiles ² 6 7% Bottom Quartile
1 (ORF)
³ 72% Top Quartile
50% to 71% Middle Quartiles ² 4 9% Bottom Quartile
³ 50% Top Quartile
22% to 49% Middle Quartiles ² 2 1% Bottom Quartile
³ 50% Top Quartile
22% to 49% Middle Quartiles ² 2 1% Bottom Quartile
= 100% Top Quartile
91% to 99% Middle Quartiles ² 9 0% Bottom Quartile
2 (ORF)
³ 61% Top Quartile
40% to 60% Middle Quartiles ² 3 9% Bottom Quartile
³ 18% Top Quartile
1% to 17% Middle Quartiles ² 0% Bottom Quartile
³ 2 7% Top Quartile
1% to 26% Middle Quartiles ² 0% Bottom Quartile
³ 9 1% Top Quartile
78% to 90% Middle Quartiles ² 7 7% Bottom Quartile
3 (ORF)
³ 59% Top Quartile
43% to 58% Middle Quartiles ² 4 2% Bottom Quartile
³ 3 4% Top Quartile
15% to 33% Middle Quartiles ² 1 4% Bottom Quartile
³ 28% Top Quartile
10% to 27% Middle Quartiles ² 9% Bottom Quartile
³ 9 2% Top Quartile
81% to 91% Middle Quartiles ² 8 0% Bottom Quartile

Oregon Reading First (2007) 24
Table 2. Evaluating Winter to Spring 2006-2007 Grade Level Instructional Support Plans: Percent of Student MakingAdequate Progress Toward DIBELS Benchmark Goals
Percent of Totalstudents that MadeAdequate Progress
Include actual numbersof students,
e.g., 90/100 or 90%.
Percent of IntensiveStudents that madeAdequate Progress
Include actual numbersof students,
e.g., 1/5 or 20%.
Percent of StrategicStudents that madeAdequate Progress
Include actual numbersof students,
e.g., 25/50 or 50%.
Percent of BenchmarkStudents that madeAdequate Progress
Include actualnumbers of students,e.g., 95/100 or 95%.
Grade/BenchmarkGoal Measure
Winterto
Spring2006
Winterto
Spring2007
PercentChange(+ or -)
Winterto
Spring2006
Winterto
Spring2007
PercentChange(+ or -)
Winterto
Spring2006
Winterto
Spring2007
PercentChange(+ or -)
Winterto
Spring2006
Winterto
Spring2007
PercentChange(+ or -)
Kindergarten- PSF
First Grade- ORF
Second Grade ORF 40% 43% +3 0%
0/45
0%
0/23
= 25%
5/19
23%
5/20
-2 90%
17/19
90%
20/22
=
Third Grade ORF
Note: This table shows the percent of students who made adequat e progress. The information can be used to identify systems (i.e.,benchmark, strategic and/or intensive) that are healthy or that need changes. Use caution when interpreting percentages for systemsthat only have a few students. For example 90% of 5 students and 90% of 30 students should lead to different interpretations.

Oregon Reading First (2007) 25
Evaluating Support
Step 2: Use Figure 1on the following page to evaluate the health of the Winter to Spring support systems for your grade level.Highlight the table to reflect top (green highlighter), middle (yellow) and bottom (pink) quartiles.
Table 2. Evaluating Winter to Spring 2006-2007 Grade Level Instructional Support Plans: Percent of Student MakingAdequate Progress Toward DIBELS Benchmark Goals
Percent of Totalstudents that MadeAdequate Progress
Include actual numbersof students,
e.g., 90/100 or 90%.
Percent of IntensiveStudents that madeAdequate Progress
Include actual numbersof students,
e.g., 1/5 or 20%.
Percent of StrategicStudents that madeAdequate Progress
Include actual numbersof students,
e.g., 25/50 or 50%.
Percent of BenchmarkStudents that madeAdequate Progress
Include actualnumbers of students,e.g., 95/100 or 95%.
Grade/BenchmarkGoal Measure
Winterto
Spring2006
Winterto
Spring2007
PercentChange(+ or -)
Winterto
Spring2006
Winterto
Spring2007
PercentChange(+ or -)
Winterto
Spring2006
Winterto
Spring2007
PercentChange(+ or -)
Winterto
Spring2006
Winterto
Spring2007
PercentChange(+ or -)
Kindergarten- PSF
First Grade- ORF
Second Grade ORF
Third Grade ORF
Note: This table shows the percent of students who made adequat e progress. The information can be used to identify systems (i.e.,benchmark, strategic and/or intensive) that are healthy or that need changes. Use caution when interpreting percentages for systemsthat only have a few students. For example 90% of 5 students and 90% of 30 students should lead to different interpretations.
Step 3: Identify systems that need support (circle): Benchmark Strategic Intensive

Oregon Reading First (2007) 26
Step 3: Identify Systems that Need Support
• Using Tables 1 and 2, identify systems that need support– First look at Table 2 for areas in pink or yellow– Next look at Table 1 for systems that are green, but that
could have more students reaching the benchmark goal• Example: Kindergarten Table 2 refers to PSF, but Table 1 will
have information on NWF• Example: If all three systems in the grade level are “green”, the
grade level may still have room for improvement in terms of the number of students who are meeting the goal

Oregon Reading First (2007) 27
Step 4:
a. As a team, use the Healthy Systems Checklist to evaluate a system that you identified as needing support.
b. Highlight questions on the Healthy Systems Checklist that are a concern in this system.
c. Prioritize questions about that system to target what elements are not healthy. For example start with structural questions (in bold) and follow with quality of implementation questions.
d. Record the prioritized questions (taken directly from the Healthy Systems Checklist) in Table 3 and list reasons for prioritizing each question
Repeat Step 4 for each system that your team identified as needing support. Some grade levels may complete this step for one system, two systems or all three systems depending on the priorities set in Step 3.

Oregon Reading First (2007) 28
• Step 5: Identify grade level actions that will address the identified areas of concern and record in Table 3 for each system that you identified as needing changes.
Oregon Reading First (2007) 29
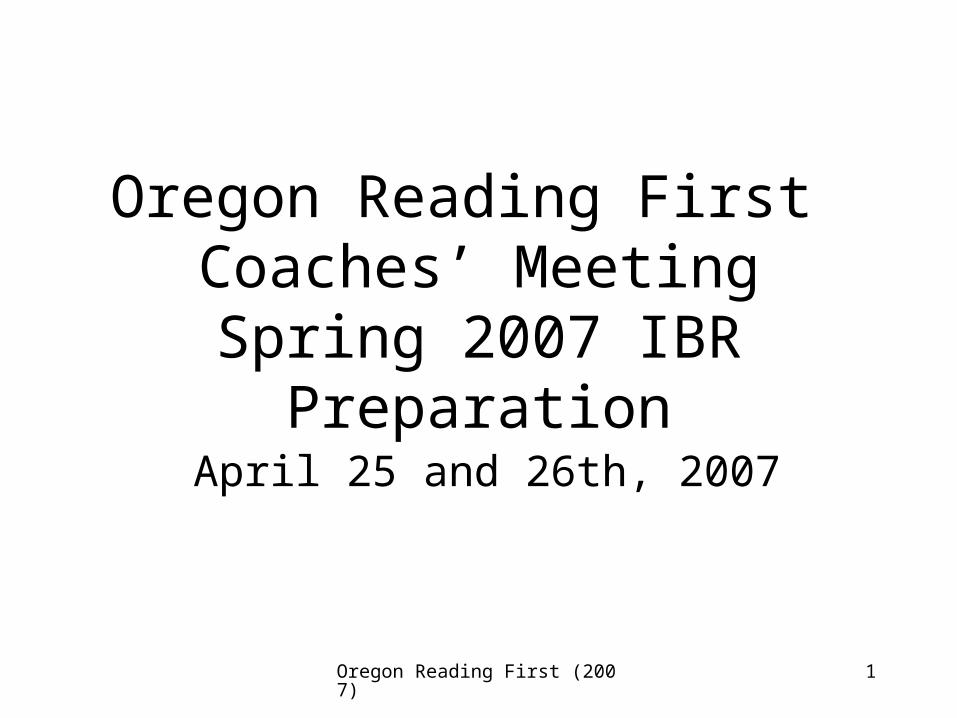
Oregon Reading First -Schoolwide Beginning Reading ModelElements of a Healthy System Checklist
School: Grade: Level of Support:
I. GOALS, OBJECTIVES, PRIORITIES
Were content-coverage goals and pacing guides for programs established so sufficient lessons/units would be mastered and children make adequate progress?
II. ASSESSMENT
Are DIBELS progress monitoring assessments administered frequently for students below grade level?
Are in-program assessments administered regularly?
Did grade level teams regularly analyze student reading data (DIBELS and in-program assessments), plan instruction based on data, and regroup students basedon the data?
III. INSTRUCTIONAL PROGRAMS AND MATERIALS
Are appropriate reading programs and materials being used to teach the full range of students (e.g., intervention programs in place for studentssignificantly below grade level)?*
Are all necessary materials available in each classroom? For each small group?*
Have the grade level teams worked together to systematically enhance the program as necessary (e.g., make instruction more systematic and explicit)?
Is the program implemented with fidelity? Are efforts to improve fidelity working?
IV. INSTRUCTIONAL TIME
Is a sufficient amount of time allocated (i.e., 90-minute reading block with a minimum of 30 minutes of small group teacher-directed reading instructiondaily)?* Are teachers following the schedule?
Is additional instructional time scheduled for students who are struggling?*
Are important activities taught/stressed (e.g., red checks, targets, etc.)?
Are students spending an appropriate amount of time on independent activities? Are the independent activities directly linked to the reading instruction?
Are students meeting projections for lesson progress?
Are students being accelerated whenever possible to bring closer to grade-level performance?
V. DIFFERENTIATED INSTRUCTION/GROUPING/SCHEDULING
Are students grouped homogenously by performance level?*
Are students grouped based on program recommendations?*
Are group sizes for large and small group activities appropriate?*
Are cross-class and cross-grade grouping used when appropriate to maximize learning opportunities?
VI. ADMINISTRATION/ORGANIZATION/COMMUNICATION
Is a sufficient number of staff allocated?*
Have staff been assigned in a way such that reading instruction can be delivered to the full range of students each day?*
Are students participating in a reasonable number of programs so as to have an aligned, coherent program without conflicting information being presented?
Are Ti tle and Special Education coordinated with and complementary to general education reading instruction?
VII. PROFESSIONAL DEVELOPMENT
Is ongoing, high quality training provided (i.e., staff received professional development on programs used in classrooms prior to implementation and at least twiceafter initial training)?
Are program-specific consultants brought in to observe in classrooms and provide ongoing support and training?
Are teachers receiving support from the RF coach in the classroom? outside the classroom?
Are regular inservice sessions developed around implementation issues identified by the coach?
Do teachers have opportunities to observe model lessons from the coach? from peers? from other schools?
Are new teachers provided the necessary program training?* = Structural element

Oregon Reading First (2007) 30
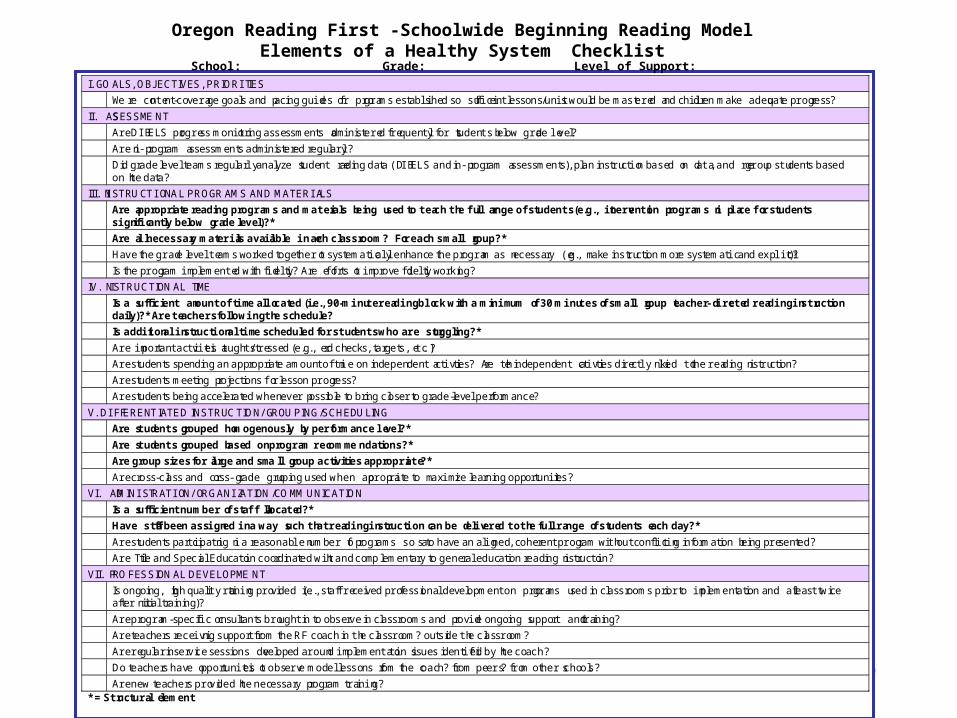
Oregon Reading First Schoolwide Beginning Reading Model
Elements of a Healthy System Checklist
School: Grade: Level of Support: I. GOALS, OBJECTIVES, PRIORITIES Y Were content-coverage goals and pacing guides for programs established so sufficient lessons/units would be mastered and
children make adequate progress? II. ASSESSMENT Y Are DIBELS progress monitoring assessments administered once a month for strategic students? once every two weeks for
intensive students? Y Are in-program assessments administered regularly? Y Did grade level teams regularly analyze student reading data (DIBELS and in-program assessments), plan/adjust instruction
based on data, and regroup students based on the data? III. INSTRUCTIONAL PROGRAMS AND MAT ERIALS
? Are appropriate reading programs and materials being used to teach the full range of students (e.g., intervention programs in place for students significantly below grade level)?*
Are all necessary materials available in each classroom? For each small group?*
? Are instructors incorpora ting general features of strong instruction (e.g., models, explicit language, multiple opportun ities for students to respond, etc.)into their daily lessons?
Y Have the grade level teams worked together to systematically enhance the program as necessary (e.g., make instruction more systematic and explicit)?
Y Is the program implemented with fidelity? Are efforts to improve fidelity working? IV. INSTRUCTIONAL T IME Y Is a sufficient amount of time allocated (i.e., 90-minute reading block with a minimum of 30 minutes of small group
teacher-directed reading instruction daily)?* Are teachers following the schedule? N Is additional instructional time scheduled for students who are struggling?* Y Are important activities taught/stressed (e.g., red checks, targets, etc.)? Are instructional priorities well understood? Y Are students spending an appropriate amount of time on independent activities (i.e., a small portion of the reading block)? Are
the independent activities directly linked to the reading instruction? N Are students meeting projections for lesson progress pacing? Y Are students being accelerated whenever possible to bring closer to grade-level performance (i.e., 2 lessons per day)? V. DIFFERENTIATED INSTRUCTION/GROUPING/SCHEDULING Y Are students grouped homogenously by performance level?* Y Are students grouped based on program recommendations?* Y Are group sizes for small group activities appropriate (i.e., 4-6 students)?* Y Are cross-class and cross-grade grouping used when appropri ate to maximize learning opportun ities? VI. ADMINISTRATION/ORGANIZATIO N/COMMUNICATION Y Is a sufficient number of staff allocated?* Y Have staff been assigned in a way such that reading instruction can be delivered to the full range of students each day?* Y Are the lowest performing students taught by strong, experienced, and well qualified instructors? Y Are students participating in a reasonable number of programs so as to have an aligned, coherent program without conflicting
information being presented?
? Are Title and Special Education coordinated with and complementary to general education reading instruction?
VII. PROFESSIONAL DEVELOPMENT Y Is ongoing, high quality training provided (i.e., staff received professional development on programs used in classrooms prior to
implementation and at least twice after initial training)? Y Are program-specific consultants brought in to observe in classrooms and provide ongoing support and training? Y Are teachers receiving support from the RF coach in the classroom? outside the classroom? Y Are regular inservice sessions developed around implementation issues identified by the coach? Y Do teachers have opportun ities to observe model lessons from the coach? from peers? from other schools? Y Are new teachers provided the necessary program training? * = Structural element
First, look atStructural Elements(in bold)
Second, look atQuality ofImplementation Elements
Healthy System Checklist

Oregon Reading First (2007) 31
System (circle one): Benchmark Strategic Intensive
System Q uestions
(Taken from the Healthy Systems Checklist)
Why is this questi on a concern for this system?
List reasons why this is an important questi on:
List Suggested Actions to Address this Concern:
1. Healthy Systems Checklist Element: Instructional Programs
Are appropriate reading programs and materials being used to teach the full range of students (e.g., intervention programs in place for students significantly below grade level)?*
CSI map says that we are using a supplemental program and not an intervention program.
Have an intervention program (Horizons or Reading Mastery) in place for all second grade students in the intensive range. A teacher will need additional training in the intervention program.
2. Healthy Systems Checklist Element: Instructional Time
Is additional instructional time scheduled for students who are struggling?*
The schedule shows that not all students are getting additional instructional time.
Schedule additional instructional time for all second grade students in the intensive range.
3. Healthy Systems Checklist Element: Differentiated Instruction
Are teachers incorporating general features of instruction (i.e., models, explicit language, etc.)?
We are not sure if we are doing this as well as we could. We would like the Reading Coach to observe next year.
Coach will observe and give us feedback on the general features of instruction. If we need more information, we will work on this in GLT meetings.
Table 3

Oregon Reading First (2007) 32
Let’s try one! Putting it all together…

Oregon Reading First (2007) 33
• Step 1. Review spring reading outcomes for your grade level. Calculate the difference between last year and this year to note whether there is an increase or decrease in the percentage of students meeting the benchmark goals.
• Discuss as a team: – Has the percentage of students established on each measure
increased? – Has the percentage of students at deficit on each measure
decreased? Discuss as a team.
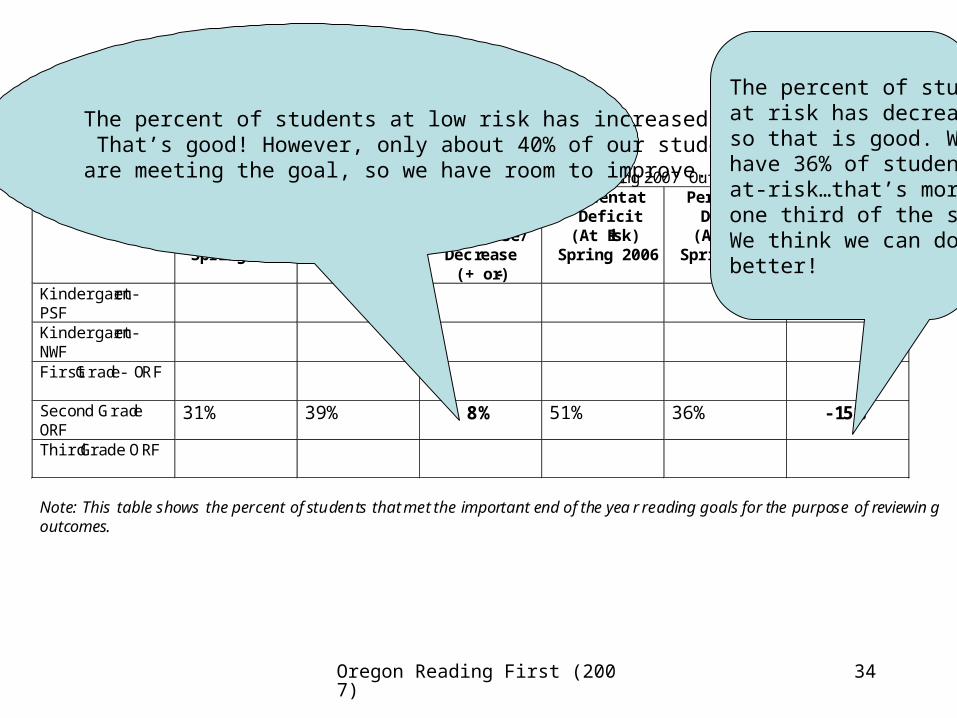
Oregon Reading First (2007) 34
Table 1 Reviewing Outcomes for K-3 Students Spring 2006 and Comparing to Spring 2007 Outcomes Grade/Measu re Percent at
Establi shed (Low Risk)
Spring 2006
Percent at Establi shed (Low Risk)
Spring 2007
Percentage Point
Increase/ Decrease
(+ or -)
Percent at Deficit
(At Risk) Spring 2006
Percent at Deficit
(At Risk) Spring 2007
Percentage Point
Increase/ Decrease
(+ or -) Kindergart en- PSF
Kindergart en- NWF
First Grade- ORF
Second Grade ORF
31% 39% 8% 51% 36% -15%
Third Grade ORF
Note: This table shows the percent of students that met the important end of the year reading goals for the purpose of reviewing outcomes.
The percent of students at low risk has increased. That’s good! However, only about 40% of our studentsare meeting the goal, so we have room to improve.
The percent of studentsat risk has decreased, so that is good. We still have 36% of students at-risk…that’s more than one third of the students.We think we can do better!

Oregon Reading First (2007) 35
Partner Practice
• With a partner, explain the directions in Step 1 to the teachers on your team. – Explain the purpose of the step– Explain how to read Table 1– Demonstrate how to calculate the increase or
decrease– Lead a discussion about the conclusions from the
data

Oregon Reading First (2007) 36
• Step 2: Use Figure 1 on the following page to evaluate the health of the Winter to Spring support systems for your grade level. Highlight Table 2 to reflect top (green highlighter), middle (yellow) and bottom (pink) quartiles.

Oregon Reading First (2007) 37
Table 2. Evaluating Winter to Spring 2006-2007 Grade Level Instructional Support Plans: Percent of Student MakingAdequate Progress Toward DIBELS Benchmark Goals
Percent of Totalstudents that MadeAdequate Progress
Include actual numbersof students,
e.g., 90/100 or 90%.
Percent of IntensiveStudents that madeAdequate Progress
Include actual numbersof students,
e.g., 1/5 or 20%.
Percent of StrategicStudents that madeAdequate Progress
Include actual numbersof students,
e.g., 25/50 or 50%.
Percent of BenchmarkStudents that madeAdequate Progress
Include actualnumbers of students,e.g., 95/100 or 95%.
Grade/BenchmarkGoal Measure
Winterto
Spring2006
Winterto
Spring2007
PercentChange(+ or -)
Winterto
Spring2006
Winterto
Spring2007
PercentChange(+ or -)
Winterto
Spring2006
Winterto
Spring2007
PercentChange(+ or -)
Winterto
Spring2006
Winterto
Spring2007
PercentChange(+ or -)
Kindergarten- PSF
First Grade- ORF
Second Grade ORF 40% 43% +3 0%
0/45
0%
0/23
= 25%
5/19
23%
5/20
-2 90%
17/19
90%
20/22
=
Third Grade ORF
Note: This table shows the percent of students who made adequat e progress. The information can be used to identify systems (i.e.,benchmark, strategic and/or intensive) that are healthy or that need changes. Use caution when interpreting percentages for systemsthat only have a few students. For example 90% of 5 students and 90% of 30 students should lead to different interpretations.
Oregon Reading First (2007) 38
Figure 1
Percentile ranks based on approximately 300 Oregon schools using the DIBELS data system during the 2004-2005 academic year.Oregon Reading First Center (2007)
What is the effectiveness of the grade level support plans? Adequate Progress Relative Criteria
(Winter to Spring)
What is the overall effectiveness of the grade-
level plan?
% of students who made adequate progress in each
grade
How effective is the grade-level instructional support
plan for intensive students?
% of students who made adequate progress within an instructional support range
How effective is the grade-level instructional support plan
for strategic students?
% of students who made adequate progress within an instructional support range
How effective is the grade-level instructional support plan for
benchmark students?
% of students who made adequate progress within an instructional support range
K (PSF)
³ 8 7% Top Quartile
57% to 86% Middle Quartiles ² 5 6% Bottom Quartile
³ 89% Top Quartile
52% to 88% Middle Quartiles ² 5 1% Bottom Quartile
³ 76% Top Quartile
34% to 75% Middle Quartiles ² 3 3% Bottom Quartile
³ 97% Top Quartile
76% to 96% Middle Quartiles ² 7 5% Bottom Quartile
K (NWF)
³ 7 2% Top Quartile
39% to 71% Middle Quartiles ² 3 8% Bottom Quartile
³ 5 4% Top Quartile
9% to 53% Middle Quartiles ² 8% Bottom Quartile
³ 60% Top Quartile
25% to 59% Middle Quartiles ² 2 4% Bottom Quartile
³ 94% Top Quartile
68% to 93% Middle Quartiles ² 6 7% Bottom Quartile
1 (ORF)
³ 72% Top Quartile
50% to 71% Middle Quartiles ² 4 9% Bottom Quartile
³ 50% Top Quartile
22% to 49% Middle Quartiles ² 2 1% Bottom Quartile
³ 50% Top Quartile
22% to 49% Middle Quartiles ² 2 1% Bottom Quartile
= 100% Top Quartile
91% to 99% Middle Quartiles ² 9 0% Bottom Quartile
2 (ORF)
³ 61% Top Quartile
40% to 60% Middle Quartiles ² 3 9% Bottom Quartile
³ 18% Top Quartile
1% to 17% Middle Quartiles ² 0% Bottom Quartile
³ 2 7% Top Quartile
1% to 26% Middle Quartiles ² 0% Bottom Quartile
³ 9 1% Top Quartile
78% to 90% Middle Quartiles ² 7 7% Bottom Quartile
3 (ORF)
³ 59% Top Quartile
43% to 58% Middle Quartiles ² 4 2% Bottom Quartile
³ 3 4% Top Quartile
15% to 33% Middle Quartiles ² 1 4% Bottom Quartile
³ 28% Top Quartile
10% to 27% Middle Quartiles ² 9% Bottom Quartile
³ 9 2% Top Quartile
81% to 91% Middle Quartiles ² 8 0% Bottom Quartile

Oregon Reading First (2007) 39
Table 2. Evaluating Winter to Spring 2006-2007 Grade Level Instructional Support Plans: Percent of Student MakingAdequate Progress Toward DIBELS Benchmark Goals
Percent of Totalstudents that MadeAdequate Progress
Include actual numbersof students,
e.g., 90/100 or 90%.
Percent of IntensiveStudents that madeAdequate Progress
Include actual numbersof students,
e.g., 1/5 or 20%.
Percent of StrategicStudents that madeAdequate Progress
Include actual numbersof students,
e.g., 25/50 or 50%.
Percent of BenchmarkStudents that madeAdequate Progress
Include actualnumbers of students,e.g., 95/100 or 95%.
Grade/BenchmarkGoal Measure
Winterto
Spring2006
Winterto
Spring2007
PercentChange(+ or -)
Winterto
Spring2006
Winterto
Spring2007
PercentChange(+ or -)
Winterto
Spring2006
Winterto
Spring2007
PercentChange(+ or -)
Winterto
Spring2006
Winterto
Spring2007
PercentChange(+ or -)
Kindergarten- PSF
First Grade- ORF
Second Grade ORF 40% 43% +3 0%
0/45
0%
0/23
= 25%
5/19
23%
5/20
-2 90%
17/19
90%
20/22
=
Third Grade ORF
Note: This table shows the percent of students who made adequat e progress. The information can be used to identify systems (i.e.,benchmark, strategic and/or intensive) that are healthy or that need changes. Use caution when interpreting percentages for systemsthat only have a few students. For example 90% of 5 students and 90% of 30 students should lead to different interpretations.

Oregon Reading First (2007) 40
Table 2. Evalu ating Winter to Spring 2006-2007 Grade Level Instructi onal Support Plans: Percent of Student Making Adequate Progress Toward DIBELS Benc hmark Goals
Tota l percent of studen ts that Made Adequate Progress
Include actual numbers of student s,
e.g., 90/100 or 90%.
Percent of Intensive Students that made Adequate Progress
Include actual numbers of student s,
e.g., 1/5 or 20%.
Percent of Strategic Students that made Adequate Progress
Include actual numbers of student s,
e.g., 25/50 or 50%.
Percent of Benchmark Students that made Adequate Progress
Include actual numbers of s tudents, e.g., 95/100 or 95%.
Grade/Benchmark Goal Measure
Winter to
Spring 2006
Winter to
Spring 2007
Percent Change (+ or -)
Winter to
Spring 2006
Winter to
Spring 2007
Percent Change (+ or -)
Winter to
Spring 2006
Winter to
Spring 2007
Percent Change (+ or -)
Winter to
Spring 2006
Winter to
Spring 2007
Percent Change (+ or -)
Kindergart en- PSF
First Grade- ORF
Second Grade ORF 40% 43% +3 0%
0/45
0%
0/23
= 25%
5/19
23%
5/20
-2 90%
17/19
90%
20/22
=
Third Grade ORF
Note: This table shows the percent of students who made adequate progress. The information can be used to identify systems (i.e., benchm ark, strategic and/or intensive) that are healthy or that need changes. Use caution when interpreting percentages for systems that only have a few students. For example 90% of 5 students and 90% of 30 students should lead to different interpretations.
Overall we increased the percent of students who made adequate progress a little bit. The total for the grade level is in the middlequartiles compared to other schoolsin the state using DIBELS. Our challenge is that less than half of our students making adequate progress. How can we make changes to improve the system next year. Let’s look at the systems within the gradeto see where we should prioritize.
None of the studentsin the intensive range moved to some risk or low risk on the benchmarkgoal. This system was in The bottom quartile. We have fewer students in the intensive range (23 vs. 45)but this is a systemthat needs support. Let’s make this a priority.

Oregon Reading First (2007) 41
Table 2. Evalu ating Winter to Spring 2006-2007 Grade Level Instructi onal Support Plans: Percent of Student Making Adequate Progress Toward DIBELS Benc hmark Goals
Tota l percent of studen ts that Made Adequate Progress
Include actual numbers of student s,
e.g., 90/100 or 90%.
Percent of Intensive Students that made Adequate Progress
Include actual numbers of student s,
e.g., 1/5 or 20%.
Percent of Strategic Students that made Adequate Progress
Include actual numbers of student s,
e.g., 25/50 or 50%.
Percent of Benchmark Students that made Adequate Progress
Include actual numbers of s tudents, e.g., 95/100 or 95%.
Grade/Benchmark Goal Measure
Winter to
Spring 2006
Winter to
Spring 2007
Percent Change (+ or -)
Winter to
Spring 2006
Winter to
Spring 2007
Percent Change (+ or -)
Winter to
Spring 2006
Winter to
Spring 2007
Percent Change (+ or -)
Winter to
Spring 2006
Winter to
Spring 2007
Percent Change (+ or -)
Kindergart en- PSF
First Grade- ORF
Second Grade ORF 40% 43% +3 0%
0/45
0%
0/23
= 25%
5/19
23%
5/20
-2 90%
17/19
90%
20/22
=
Third Grade ORF
Note: This table shows the percent of students who made adequate progress. The information can be used to identify systems (i.e., benchm ark, strategic and/or intensive) that are healthy or that need changes. Use caution when interpreting percentages for systems that only have a few students. For example 90% of 5 students and 90% of 30 students should lead to different interpretations.
Almost the same percent of studentsmade adequate progress in the strategic system this year comparedto last year. This system is in the middle quartile. About one quarter of our strategic students made adequate progress Winter to Spring. We couldhave more. Let’s make this system a priority.
Almost all of the studentsin the benchmark range made adequate progressthis year and last year. Only two students did not. Let’s take a look at those students’ data. Depending on that information, we may decide to prioritize this system.
After looking at the data, one student sas absent for 3 months due to illness. The other student missed the cut-off by 1 point.Let’s not prioritize this system right now.

Oregon Reading First (2007) 42
Partner Practice
• With a partner, explain the directions in Step 2 to the teachers on your team. – Explain the purpose of the step– Explain how to read Table 2– Demonstrate how to highlight the systems using
the normative tables– Lead a discussion about the conclusions from the
data
Oregon Reading First (2007) 43
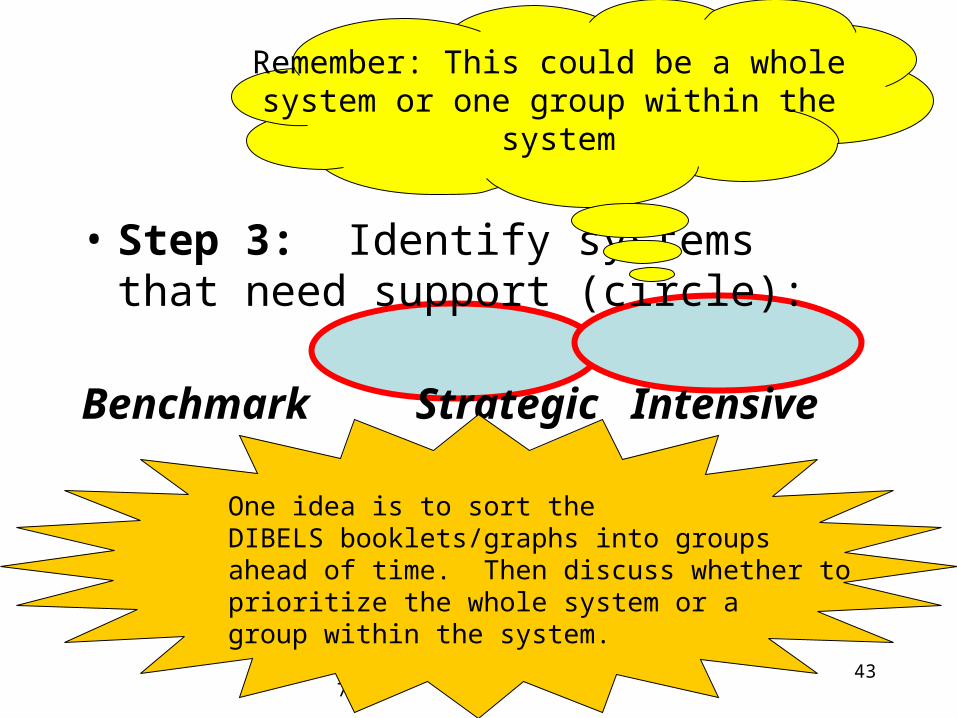
• Step 3: Identify systems that need support (circle):
Benchmark Strategic Intensive
Remember: This could be a whole system or one group within the
system
One idea is to sort the DIBELS booklets/graphs into groups ahead of time. Then discuss whether toprioritize the whole system or agroup within the system.

Oregon Reading First (2007) 44
• Step 3: Identify systems that need support (circle):
Benchmark Strategic Intensive
We’ll focus on Intensive for this example

Oregon Reading First (2007) 45
Partner Practice
• Discuss with a partner at your table…– What are some cautions or things that
might come up at this point in the process (Steps 1 through 3)?

Oregon Reading First (2007) 46
Step 4:a. As a team, use the Healthy Systems Checklist to evaluate a system that you
identified as needing support.
b. Highlight questions on the Healthy Systems Checklist that are a concern in this system.
c. Prioritize questions about that system to target what elements are not healthy. For example start with structural questions (in bold) and follow with quality of implementation questions.
d. Record the prioritized questions (taken directly from the Healthy Systems Checklist) in Table 3 and list reasons for prioritizing each question
Repeat Step 4 for each system that your team identified as needing support. Some grade levels may complete this step for one system, two systems or all three systems depending on the priorities set in Step 3.

Oregon Reading First (2007) 47
First, look at
Structural Questions(in bold)
Healthy System ChecklistOregon Reading First
Schoolwide Beginning Reading Model Elements of a Healthy System
Checklist
School: Grade: Level of Support: I. GOALS, OBJECTIVES, PRIORITIES Were content-coverage goals and pacing guides for programs established so sufficient lessons/units would be mastered and
children make adequate progress? II. ASSESSMENT Are DIBELS progress monitoring assessments administered once a month for strategic students? once every two weeks for
intensive students? Are in-program assessments administered regularly? Did grade level teams regularly analyze student reading data (DIBELS and in-program assessments), plan/adjust instruction
based on data, and regroup students based on the data? III. INSTRUCTIONAL PROGRAMS AND MAT ERIALS N Are appropriate reading programs and materials being used to teach the full range of students (e.g., intervention
programs in place for students significantly below grade level)?* Are all necessary materials available in each classroom? For each small group?* Are instructors incorpora ting general features of strong instruction (e.g., models, explicit language, multiple opportun ities for
students to respond, etc.)into their daily lessons? Have the grade level teams worked together to systematically enhance the program as necessary (e.g., make instruction more
systematic and explicit)? Is the program implemented with fidelity? Are efforts to improve fidelity working? IV. INSTRUCTIONAL T IME Y Is a sufficient amount of time allocated (i.e., 90-minute reading block with a minimum of 30 minutes of small group
teacher-directed reading instruction daily)?* Are teachers following the schedule?
? Is additional instructional time scheduled for students who are struggling?* Are important activities taught/stressed (e.g., red checks, targets, etc.)? Are instructional priorities well understood? Are students spending an appropriate amount of time on independent activities (i.e., a small portion of the reading block)? Are
the independent activities directly linked to the reading instruction? Are students meeting projections for lesson progress pacing? Are students being accelerated whenever possible to bring closer to grade-level performance (i.e., 2 lessons per day)? V. DIFFERENTIATED INSTRUCTION/GROUPING/SCHEDULING Y Are students grouped homogenously by performance level?* Y Are students grouped based on program recommendations?* Y Are group sizes for small group activities appropriate (i.e., 4-6 students)?* Are cross-class and cross-grade grouping used when appropriate to maximize learning opportun ities? VI. ADMINISTRATION/ORGANIZATIO N/COMMUNICATION Y Is a sufficient number of staff allocated?* Y Have staff been assigned in a way such that reading instruction can be delivered to the full range of students each day?* Are the lowest performing students taught by strong, experienced, and well qualified instructors? Are students participating in a reasonable number of programs so as to have an aligned, coherent program without conflicting
information being presented? Are Title and Special Education coordinated with and complementary to general education reading instruction? VII. PROFESSIONAL DEVELOPMENT Is ongoing, high quality training provided (i.e., staff received professional development on programs used in classrooms prior to
implementation and at least twice after initial training)? Are program-specific consultants brought in to observe in classrooms and provide ongoing support and training? Are teachers receiving support from the RF coach in the classroom? outside the classroom? Are regular inservice sessions developed around implementation issues identified by the coach? Do teachers have opportun ities to observe model lessons from the coach? from peers? from other schools? Are new teachers provided the necessary program training? * = Structural element

Oregon Reading First (2007) 48
School: Grade: Level of Support: I. GOALS, OBJECTIVES, PRIORITIES Y Were content-coverage goals and pacing guides for programs established so sufficient lessons/units would be mastered and
children make adequate progress? II. ASSESSMENT Y Are DIBELS progress monitoring assessments administered once a month for strategic students? once every two weeks for
intensive students? Y Are in-program assessments administered regularly? Y Did grade level teams regularly analyze student reading data (DIBELS and in-program assessments), plan/adjust instruction
based on data, and regroup students based on the data? III. INSTRUCTIONAL PROGRAMS AND MAT ERIALS Y Are appropriate reading programs and materials being used to teach the full range of students (e.g., intervention
programs in place for students significantly below grade level)?* Are all necessary materials available in each classroom? For each small group?* N Are instructors incorpora ting general features of strong instruction (e.g., models, explicit language, multiple opportun ities for
students to respond, etc.)into their daily lessons? Y Have the grade level teams worked together to systematically enhance the program as necessary (e.g., make instruction more
systematic and explicit)? Y Is the program implemented with fidelity? Are efforts to improve fidelity working? IV. INSTRUCTIONAL T IME Y Is a sufficient amount of time allocated (i.e., 90-minute reading block with a minimum of 30 minutes of small group
teacher-directed reading instruction daily)?* Are teachers following the schedule? N Is additional instructional time scheduled for students who are struggling?* Y Are important activities taught/stressed (e.g., red checks, targets, etc.)? Are instructional priorities well understood? Y Are students spending an appropriate amount of time on independent activities (i.e., a small portion of the reading block)? Are
the independent activities directly linked to the reading instruction? N Are students meeting projections for lesson progress pacing? Y Are students being accelerated whenever possible to bring closer to grade-level performance (i.e., 2 lessons per day)? V. DIFFERENTIATED INSTRUCTION/GROUPING/SCHEDULING Y Are students grouped homogenously by performance level?* Y Are students grouped based on program recommendations?* Y Are group sizes for small group activities appropriate (i.e., 4-6 students)?* Y Are cross-class and cross-grade grouping used when appropri ate to maximize learning opportun ities? VI. ADMINISTRATION/ORGANIZATIO N/COMMUNICATION Y Is a sufficient number of staff allocated?* Y Have staff been assigned in a way such that reading instruction can be delivered to the full range of students each day?* Y Are the lowest performing students taught by strong, experienced, and well qualified instructors? Y Are students participating in a reasonable number of programs so as to have an aligned, coherent program without conflicting
information being presented?
? Are Title and Special Education coordinated with and complementary to general education reading instruction?
VII. PROFESSIONAL DEVELOPMENT Y Is ongoing, high quality training provided (i.e., staff received professional development on programs used in classrooms prior to
implementation and at least twice after initial training)? Y Are program-specific consultants brought in to observe in classrooms and provide ongoing support and training? Y Are teachers receiving support from the RF coach in the classroom? outside the classroom? Y Are regular inservice sessions developed around implementation issues identified by the coach? Y Do teachers have opportun ities to observe model lessons from the coach? from peers? from other schools? Y Are new teachers provided the necessary program training? * = Structural element
Second, look at
Quality ofImplementation
Questions
Healthy System Checklist

Oregon Reading First (2007) 49
Prioritize QuestionsFocus on questions 1 & 2 before addressing
question 3.
1. Are appropriate reading programs and materials being used to teach the full range of students (e.g., intervention programs in place for students significantly below grade level)?*
2. Is additional instructional time scheduled for students who are struggling?*
3. Are teachers incorporating general features of instruction (i.e., models, explicit language, etc.)?

Oregon Reading First (2007) 50
System (circle one): Benchmark Strategic Intensive
System Q uestions
(Taken from the Healthy Systems Checklist)
Why is this questi on a concern for this system?
List reasons why this is an important questi on:
List Suggested Actions to Address this Concern:
1. Healthy Systems Checklist Element: Instructional Programs
Are appropriate reading programs and materials being used to teach the full range of students (e.g., intervention programs in place for students significantly below grade level)?*
2. Healthy Systems Checklist Element: Instructional Time
Is additional instructional time scheduled for students who are struggling?*
3. Healthy Systems Checklist Element: Differentiated Instruction
Are teachers incorporating general features of instruction (i.e., models, explicit language, etc.)?
Table 3

Oregon Reading First (2007) 51
System (circle one): Benchmark Strategic Intensive
System Questions
(Taken from the Healthy Systems Checklist)
Why is this questi on a concern for this system?
List reasons why this is an important questi on:
List Suggested Actions to Address this Concern:
1. Healthy Systems Checklist Element: Instructional Programs
Are appropriate reading programs and materials being used to teach the full range of students (e.g., intervention programs in place for students significantly below grade level)?*
CSI map says that we are using a supplemental program and not an intervention program.
2. Healthy Systems Checklist Element: Instructional Time
Is additional instructional time scheduled for students who are struggling?*
The schedule shows that not all students are getting additional instructional time.
3. Healthy Systems Checklist Element: Differentiated Instruction
Are teachers incorporating general features of instruction (i.e., models, explicit language, etc.)?
We are not sure if we are doing this as well as we could. We would like the Reading Coach to observe next year.
Table 3

Oregon Reading First (2007) 52
Activity: Think of a system in your building (grade level and B, S, or I) and walk
through Step 4 for that system.
1. Think of a system
2. Fill out the Healthy Systems Checklist
3. Fill in the first two columns of Table 3

Oregon Reading First (2007) 53
• Step 5: Identify grade level actions that will address the identified areas of concern and record in Table 3 for each system that you identified as needing changes.

Oregon Reading First (2007) 54
System (circle one): Benchmark Strategic Intensive
System Questions
(Taken from the Healthy Systems Checklist)
Why is this questi on a concern for this system?
List reasons why this is an important questi on:
List Suggested Actions to Address this Concern:
1. Healthy Systems Checklist Category: Instructional Programs
Are appropriate reading programs and materials being used to teach the full range of students (e.g., intervention programs in place for students significantly below grade level)?*
CSI map says that we are using a supplemental program and not an intervention program.
Have an intervention program (Horizons or Reading Mastery) in place for all second grade students in the intensive range. A teacher will need additional training in the intervention program.
2. Healthy Systems Checklist Category: Instructional Time
Is additional instructional time scheduled for students who are struggling?*
The schedule shows that not all students are getting additional instructional time.
Schedule additional instructional time for all second grade students in the intensive range.
3. Healthy Systems Checklist Category: Differentiated Instr.
Are teachers incorporating general features of instruction (i.e., models, explicit language, etc.)?
We are not sure if we are doing this as well as we could. We would like the Reading Coach to observe next year.
Coach will observe and give us feedback on the general features of instruction. If we need more information, we will work on this in GLT meetings.
Table 3

Oregon Reading First (2007) 55
Activity: Complete Step 5 for your system.
• Complete the third column in Table 3 for the system that you used in the previous activity.
• Share your thinking and table with a partner next to you.
Oregon Reading First (2007) 56
Your Turn!
• Find your “number” in the box on your partner question page.
• Table up by number!• Using the example data set at your table,
walk through a mock GLT meeting. Take turns leading the discussion (playing the role of coach).
• Note the school context on the cover page.

Oregon Reading First (2007) 57
IBR ERT

Oregon Reading First (2007) 58
Purpose of the ERT Meeting
– Review Schoolwide Data
– Review the GLTs’ Suggested Actions
– Create Action Plan
– Consider Budget Implications

Oregon Reading First (2007) 59
IBR ERT Meeting LogisticsPreparing in Advance
– Coach fills in grade level data in advance and can highlight Table 2 of ERT packet.
– Materials• Each person will have their own packet• Green, Yellow and Pink highlighters• CSI Maps• Schedules • Data• List of suggested actions from GLT packets• Sample Action Plan• Blank Action Plan• Spring 2007 Oregon Reading First Activities Checklist
Oregon Reading First (2007) 60
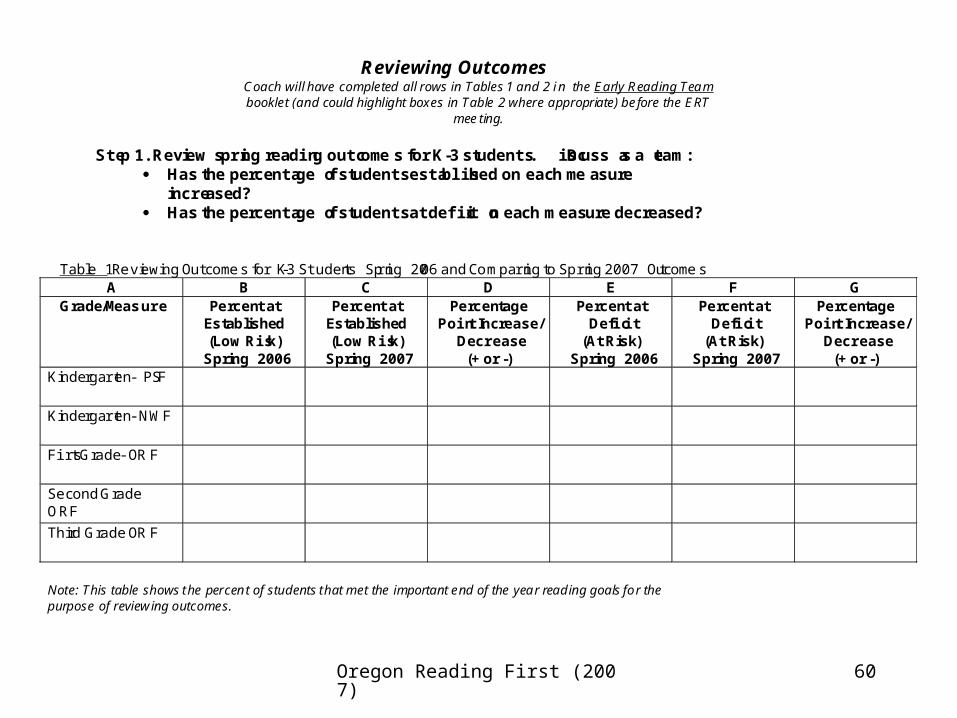
Reviewing OutcomesCoach will have completed all rows in Tables 1 and 2 i n the Early Reading Teambooklet (and c ould highlight boxes in Table 2 where appropriate) before the ERT
meeting.
Step 1. Review spring reading outcomes for K-3 students. Discuss as a team: Has the percentage of students established on each measure
increased? Has the percentage of students at deficit on each measure decreased?
Table 1 Reviewing Outcomes for K-3 Students Spring 2006 and Comparing to Spring 2007 OutcomesA B C D E F G
Grade/Measure Percent atEstablished(Low Risk)
Spring 2006
Percent atEstablished(Low Risk)
Spring 2007
PercentagePoint Increase/
Decrease(+ or -)
Percent atDeficit
(At Risk)Spring 2006
Percent atDeficit
(At Risk)Spring 2007
PercentagePoint Increase/
Decrease(+ or -)
Kindergarten- PSF
Kindergarten- NWF
First Grade- ORF
Second GradeORF
Third Grade ORF
Note: This table shows the percent of students that met the important end of the year reading goals for thepurpose of reviewing outcomes.

Oregon Reading First (2007) 61
Evaluating SupportWhat is the effectiveness of the grade level support plans?
Step 2: Evaluate the health of the Winter to Spring support systems for grades K-3. Discussthe percentage and number of students in each grade level system that are making adequateprogress.
Table 2: Evaluating Winter-Spring 2006-07 Instructional Support Plans: Percent of Students Making AdequateProgress Towards DIBELS Benchmark Goals
Percent of TotalStudents at each grade
that made AdequateProgress
Include actual numbers ofstudents,
e.g., 90/100 or 90%.
Percent of IntensiveStudents that madeAdequate Progress
Include actual numbers ofstudents,
e.g., 1/5 or 20%.
Percent of StrategicStudents that madeAdequate Progress
Include actual numbers ofstudents,
e.g., 25/50 or 50%.
Percent of BenchmarkStudents that madeAdequate Progress
Include actual numbers ofstudents,
e.g., 95/100 or 95%.
Grade/Benchmark Goa l
Measure
Winterto
Spring2006
Winterto
Spring2007
PercentChange(+ or -)
Winterto
Spring2006
Winterto
Spring2007
PercentChange(+ or -)
Winterto
Spring2006
Winterto
Spring2007
PercentChange(+ or -)
Winterto
Spring2006
Winterto
Spring2007
PercentChange(+ or -)
Total Intensive Strategic BenchmarkKindergarten- PSF
First Grade- ORF
Second Grade ORF
Third Grade ORF
Note: This table shows the percent of students who made adequate progress. The information can be used todentify systems (i.e., benchmark, strategic and/or intensive) that are healthy or that need changes. Use cautionwhen interpreting percentages for systems that only have a few students. For example 90% of 5 students and 90%of 30 students should lead to different interpretations.

Oregon Reading First (2007) 62
Step 3: Based on Tab les 1 and 2, list the systems, across K-3 data, that are of highest priority.
Step 4: Review K-3 grade level teams’ Table 3 – Proposed System Support Plan documents to learn more about a) systems identified for support at each grade level, b) system-specific questions from the Healthy Systems Checklist selected by those teams, and c) suggested actions for those identif ied system needs. Step 5: ERT team should consider whether any systems, other than those identified in grade level teams, are in need of support. If so, complete Tabl e 3 – Proposed System Support Plan from the grade level team booklet, using the Healthy Systems Checklist to identify questions and suggested actions. Step 6: Using the system pr iority list from Step 3 above, and K-3 completed Tab le 3 – Proposed System Support Plans, consider the sugges ted actions that are of highest priority. Bas ed on team consensus, prioritize actions that will have a significant impact on student achievement. Identify NO MORE THAN TEN actions and list them on the Schoolwi de Action Plan.

Oregon Reading First (2007) 63
Partner Practice
• With a partner, describe how Step 5 might look in your building. – Explain the purpose of the step.– Discuss why the ERT might focus on different
systems than the GLTs did.

Oregon Reading First (2007) 64
System (circle one): Benchmark Strategic Intensive
System Q uestions
(Taken from the Healthy Systems Checklist)
Why is this questi on a concern for this system?
List reasons why this is an important questi on:
List Suggested Actions to Address this Concern:
1. Healthy Systems Checklist Element: Instructional Programs
Are appropriate reading programs and materials being used to teach the full range of students (e.g., intervention programs in place for students significantly below grade level)?*
CSI map says that we are using a supplemental program and not an intervention program.
Have an intervention program (Horizons or Reading Mastery) in place for all second grade students in the intensive range. A teacher will need additional training in the intervention program.
2. Healthy Systems Checklist Element: Instructional Time
Is additional instructional time scheduled for students who are struggling?*
The schedule shows that not all students are getting additional instructional time.
Schedule additional instructional time for all second grade students in the intensive range.
3. Healthy Systems Checklist Element: Differentiated Instruction
Are teachers incorporating general features of instruction (i.e., models, explicit language, etc.)?
We are not sure if we are doing this as well as we could. We would like the Reading Coach to observe next year.
Coach will observe and give us feedback on the general features of instruction. If we need more information, we will work on this in GLT meetings.
Table 3

Oregon Reading First (2007) 65
Group Brainstorming
• Review Step 6. Share ways that your school could come to a team consensus about the highest priority actions.
• _______________________________
• _______________________________
• _______________________________
• _______________________________

Oregon Reading First (2007) 66
2007-2008 Schoolwide Action Plan
School: Date Created: Staff Who Created this Action Plan:
Schoolwide Element
Indicate Schoolwide or Specific Grade
and Group
Action to Be Taken (be specific enough so that is is possible to determine when the action has been
implemented)
Person Responsible
Report on Progress of
Implementation 1
2
3
4
5

Oregon Reading First (2007) 67
Column Hint: Refer to GLT Table 3 for Roman numerals that reference schoolwide element from Healthy Systems Checklist. List that element in this column.
Column Hint: Possible examples include “All 2nd graders”, “All 2nd graders in HM”, “All 2nd graders within ten words of the benchmark”, “The 2nd graders in the Reading Mastery Bluebirds group.”
Column Hint: Actions should not be a continuation of already established practices. Instead, the action plan is intended to highlight the new practices that will be implemented during the coming year to improve student outcomes. If the ERT team would like to ensure that certain current practices are continued, considering adding a ______ _____ ____(e.g., John Henry Elementary) School Expectations document to the end of your action plan.
Schoolwide Element
Indicate Schoolwide or Specific Grade
and Group
Action to Be Taken (Be specific enough so that it is possible to determine when the action has been
implemented.)
Person Responsible
Report on Progress of
Implementation 1

Oregon Reading First (2007) 68
Writing Good Actions: Who will do what? By When?
Schoolwide Element
Indicate Schoolwide or Specific Grade
and Group
Action to Be Taken (be specific enough so that is is possible to determine when the action has been
implemented)
Person Responsible
Report on Progress of
Implementation 1

Oregon Reading First (2007) 69
Schoolwide Element
Indicate Schoolwide or Specific Grade
and Group
Action to Be Taken (be specific enough so that it is possible to determine when the action has been
implemented)
Person Responsible
Report on Progress of
Implementation 1 Instructional
Programs and Materials
All second grade students in the intensive range
1. Implement Horizons with all 2nd grade students in the intensive range. 2. Provide daily work in Read Naturally once students are able to read 30 words per minute on first grade DIBELS oral reading fluency measure.
Reading Coach and 2nd grade teachers teaching students in the intensive range
2 Instructional Programs and Materials
All second grade students in the intensive range
1. A pacing guide for Horizons will be developed specifying lessons to be covered each week during the reading block and the extra instruction in the afternoon. Assistance in developing these expectations will be provided by a program expert.
Reading Coach
3 Instructional Time All second grade students in the intensive range
1. During the initial reading block, students will receive: a) 45 minutes of instruction in Horizons at their instructional level in small groups b) 15 minutes of rereading stories from earlier lessons in Horizons and d) 5 minutes of extra work for students struggling with content. 2. During extra 60 minute block, students will receive: a) a second 40 minute period of instruction in Horizons and b) a 20 minute period for fluency work in the Read Naturally. 3. Students will be taught at their instructional level in small groups of 6 to 8 students. 4. Groupings will be flexible based on data reviewed during weekly? meetings to consider regrouping a) any student performing significantly below other students in spite of extra tutoring and b) any student performing significantly above other students.
Reading Coach, 2nd grade teachers teaching students in the intensive range
4 Professional Development
All second grade students in the intensive range
1. 2nd grade instructional staff who will be teaching Horizons will receive two days initial training during summer.
2. Coach and instructional staff will meet every two weeks to practice presenting lessons during first two months of school year.
3. A program-specific expert will provide 3 days of in-school, in-class
Reading Coach, Principal, and 2nd grade teachers teaching students in the intensive range
Example Action Plan

Oregon Reading First (2007) 70
Action Plan Logistics
• Your Regional Coordinator will work with you in advance to help guide the action plan development.
• The action plan will be a Word document.• Please have all ERT members sign the document.• Fax,mail or e-mail the final document to Deni at the
Oregon Reading First Center, to Dalles at ODE ([email protected]), and to your regional coordinator.
• See Spring 2007 Oregon Reading First checklist for more details.