Embed Size (px)
Citation preview

Oregon Public Employees Retirement System
Cost-Sharing Multiple-Employer
Defined Benefit Pension Plan
Schedules of Employer Allocations and
Pension Amounts by Employer
As of and for the Year Ended June 30, 2016

Oregon Public Employees Retirement System
Cost-Sharing Multiple-Employer Defined Benefit Pension Plan
Schedules of Employer Allocations and Pension Amounts by Employer
As of and for the Year Ended June 30, 2016
Table of Contents
Page (s)
Independent Auditor’s Report .................................................................................................................... 1-2
Schedule of Employer Allocations .......................................................................................................... 3-17
Schedule of Pension Amounts by Employer .......................................................................................... 18-32
Notes to the Schedules of Employer Allocations and Pension Amounts by Employer ......................... 33-39

Century City
Los Angeles
Newport Beach
Oakland
Sacramento
San Diego
San Francisco
Walnut Creek
Woodland Hills
www.mgocpa.com Macias Gini & O’Connell LLP 3000 S Street, Suite 300 Sacramento, CA 95816
1
Independent Auditor's Report
To the Honorable Kate Brown
Governor of Oregon
To the Public Employees Retirement Board of the
Oregon Public Employees Retirement System
Tigard, Oregon
We have audited the accompanying schedule of employer allocations of the Oregon Public Employees
Retirement System (the System) Cost-Sharing Multiple-Employer Defined Benefit Pension Plan (the
Plan) as of and for the year ended June 30, 2016, and the related notes. We have also audited the total for
all entities of the columns titled net pension liability, total deferred outflows of resources, total deferred
inflows of resources, and total pension expense (specified column totals) included in the accompanying
schedule of pension amounts by employer of the Plan as of and for the year ended June 30, 2016, and the
related notes.
Management’s Responsibility for the Schedules
Management is responsible for the preparation and fair presentation of these schedules in accordance with
accounting principles generally accepted in the United States of America; this includes the design,
implementation, and maintenance of internal control relevant to the preparation and fair presentation of
the schedules that are free from material misstatement, whether due to fraud or error.
Auditor’s Responsibility
Our responsibility is to express opinions on the schedule of employer allocations and the specified
column totals included in the schedule of pension amounts by employer based on our audit. We
conducted our audit in accordance with auditing standards generally accepted in the United States of
America. Those standards require that we plan and perform the audit to obtain reasonable assurance about
whether the schedule of employer allocations and specified column totals included in the schedule of
pension amounts by employer are free from material misstatement.
An audit involves performing procedures to obtain audit evidence about the amounts and disclosures in
the schedule of employer allocations and specified column totals included in the schedule of pension
amounts by employer. The procedures selected depend on the auditor’s judgment, including the
assessment of the risks of material misstatement of the schedule of employer allocations and specified
column totals included in the schedule of pension amounts by employer, whether due to fraud or error. In
making those risk assessments, the auditor considers internal control relevant to the entity’s preparation
and fair presentation of the schedule of employer allocations and specified column totals included in the
schedule of pension amounts by employer in order to design audit procedures that are appropriate in the
circumstances, but not for the purpose of expressing an opinion on the effectiveness of the entity’s
internal control. Accordingly, we express no such opinion. An audit also includes evaluating the
appropriateness of accounting policies used and the reasonableness of significant accounting estimates
made by management, as well as evaluating the overall presentation of the schedule of employer
allocations and specified column totals included in the schedule of pension amounts by employer.

2
We believe that the audit evidence we have obtained is sufficient and appropriate to provide a basis for
our audit opinions.
Opinions
In our opinion, the schedules referred to above present fairly, in all material respects, the employer
allocations and net pension liability, total deferred outflows of resources, total deferred inflows of
resources, and total pension expense for the total of all participating entities for the Oregon Public
Employees Retirement System Cost-Sharing Multiple-Employer Defined Benefit Pension Plan as of and
for the year ended June 30, 2016, in accordance with accounting principles generally accepted in the
United States of America.
Other Matter
We have audited, in accordance with standards generally accepted in the United States of America, the
financial statements of the fiduciary activities and the proprietary activities of the Oregon Public
Employees Retirement System as of and for the fiscal year ended June 30, 2016, and our report thereon
dated December 1, 2016, expressed unmodified opinions on those financial statements.
Restriction on Use
Our report is intended solely for the information and use of the System’s management, the Audit
Committee, the Public Employees Retirement Board, the System’s participating employers and their
auditors and is not intended to be and should not be used by anyone other than these specified parties.
Sacramento, California
February 15, 2017

Oregon Public Employees Retirement System
Cost-Sharing Multiple-Employer Defined Benefit Pension Plan
Schedule of Employer Allocations
June 30, 2016
Employer
Number Employer Name
Employer Total Present
Value of Contribution
Effort
Employer Proportionate
Share Percentage
1000 State Agencies 5,172,948,025$ 26.81965357%
2000 Lake County 7,925,150 0.04108871%
2001 Clackamas County 335,965,162 1.74184415%
2002 Curry County 17,036,763 0.08832876%
2003 Douglas County 111,511,606 0.57814280%
2004 Harney County 9,166,292 0.04752353%
2005 Jackson County 113,059,741 0.58616925%
2006 Jefferson County 12,405,072 0.06431531%
2007 Klamath County 7,371,823 0.03821994%
2008 Lane County 214,063,120 1.10983112%
2009 Marion County 153,274,058 0.79466430%
2011 Washington County 321,564,037 1.66718011%
2012 Grant County 3,186,441 0.01652041%
2013 Umatilla County 25,824,243 0.13388831%
2014 Linn County 93,827,560 0.48645814%
2015 Yamhill County 36,568,825 0.18959464%
2016 Sherman County 5,724,977 0.02968170%
2017 Columbia County 15,127,810 0.07843161%
2018 Coos County 37,677,458 0.19534246%
2020 Wasco County 12,709,855 0.06589548%
2021 Baker County 11,238,031 0.05826467%
2022 Gilliam County 4,962,828 0.02573027%
2023 Morrow County Rural School District Board - 0.00000000%
2027 Deschutes County 119,989,926 0.62209947%
2028 Union County - 0.00000000%
2035 Hood River County 10,010,801 0.05190197%
2036 Clatsop County 23,162,004 0.12008567%
2037 Polk County 34,352,380 0.17810326%
2038 Multnomah County 676,810,438 3.50898973%
2039 Malheur County 13,505,995 0.07002315%
2040 Benton County 44,968,853 0.23314540%
2042 Josephine County 35,278,536 0.18290501%
2043 Lincoln County 8,810,815 0.04568053%
2044 Crook County 2,734,059 0.01417500%
2050 Wallowa County 305,302 0.00158287%
2052 Tillamook County 20,164 0.00010454%
2099 State Judiciary 52,382,748 0.27158347%
2100 City of Roseburg 28,538,726 0.14796181%
2101 City of Salem 187,912,343 0.97424987%
2102 City of Medford 77,106,025 0.39976371%
2103 City of Albany 67,071,185 0.34773710%
2104 City of Ashland 44,774,515 0.23213784%
2105 City of Astoria 14,774,810 0.07660144%
2106 City of Beaverton 93,505,843 0.48479016%
2107 City of Bend 72,869,207 0.37779751%
2109 City of Canby 12,355,803 0.06405987%
2110 City of Coquille 3,887,957 0.02015749%
2111 City of Eugene 258,935,444 1.34247606%
2112 City Of Forest Grove 14,789 0.00007668%
2113 City of Grants Pass 34,834,094 0.18060076%
2114 City of Gresham 99,831,700 0.51758719%
2115 City of Hillsboro 111,279,912 0.57694156%
2117 City of McMinnville 44,189,948 0.22910710%
2118 City of Ontario 14,010,866 0.07264070%
2119 City of Oregon City 26,368,486 0.13670999%
2120 City of Lake Oswego 68,331,767 0.35427271%
2121 City of Portland 729,724,709 3.78332893%
2122 City of Redmond 21,293,302 0.11039720%
2123 City of St Helens 10,869,011 0.05635145%
2125 City of Vernonia 939,229 0.00486952%
2126 City of West Linn 19,197,124 0.09952936%
2127 City of Cottage Grove 11,292,329 0.05854618%
2128 City of Tillamook 4,280,534 0.02219285%
The accompanying notes are an integral part of this schedule.3

Oregon Public Employees Retirement System
Cost-Sharing Multiple-Employer Defined Benefit Pension Plan
Schedule of Employer Allocations
June 30, 2016
Employer
Number Employer Name
Employer Total Present
Value of Contribution
Effort
Employer Proportionate
Share Percentage
2129 City of Sweet Home 494,232 0.00256239%
2131 City of Drain 1,292,027 0.00669864%
2132 Eugene Water & Electric Board 136,039,535 0.70531024%
2138 City of Hood River 10,402,588 0.05393323%
2139 City of Reedsport 2,030,872 0.01052925%
2140 City of Lebanon 11,453,331 0.05938091%
2142 City of Sherwood 15,915,446 0.08251518%
2143 City of Oakland 447,474 0.00231997%
2145 City of Vale 1,063,881 0.00551579%
2146 City of Prineville 5,612,391 0.02909799%
2147 City of Wheeler 373,088 0.00193431%
2148 City of Klamath Falls 17,837,727 0.09248144%
2149 City of Canyonville 708,125 0.00367134%
2150 City of Bandon 4,915,008 0.02548234%
2152 City of Coos Bay 19,623,114 0.10173795%
2154 City of Pendleton 18,261,522 0.09467864%
2155 City of Corvallis 58,921,213 0.30548278%
2157 City of Monmouth 7,688,392 0.03986122%
2158 City of Milton-Freewater 10,231,235 0.05304484%
2159 City of Baker City 9,188,670 0.04763956%
2160 City of Hermiston 13,571,450 0.07036251%
2161 City of Pilot Rock 756,571 0.00392252%
2162 City of Clatskanie 3,139,225 0.01627562%
2163 City of Milwaukie 19,476,713 0.10097892%
2165 City of Cornelius 4,646,753 0.02409154%
2166 City of Nyssa 1,906,167 0.00988271%
2167 City of Athena 274,317 0.00142222%
2168 City of Oakridge 3,000,318 0.01555544%
2170 City of Madras 3,905,870 0.02025036%
2172 City of Sandy 8,949,567 0.04639990%
2174 City of Mt Angel 1,618,654 0.00839207%
2175 City of Umatilla 3,182,018 0.01649748%
2176 City of Scappoose 4,197,688 0.02176332%
2177 City of Condon 452,041 0.00234365%
2178 City of Boardman 2,906,295 0.01506797%
2179 City of Estacada 1,999,943 0.01036890%
2180 City of Enterprise 1,906,441 0.00988413%
2181 City of Central Point 11,420,933 0.05921294%
2182 City of Cascade Locks 1,687,679 0.00874994%
2183 City of Myrtle Point 2,579,375 0.01337302%
2184 City of Port Orford 1,074,477 0.00557073%
2185 City of Wood Village 1,892,996 0.00981442%
2186 City of Chiloquin 122,259 0.00063386%
2187 City of Philomath 3,446,848 0.01787052%
2188 City of Talent 2,553,412 0.01323841%
2189 City of Willamina - 0.00000000%
2191 City of Huntington 266,534 0.00138187%
2192 City of North Plains 1,732,909 0.00898444%
2193 City of Heppner 205,346 0.00106464%
2194 City of Cave Junction 1,146,218 0.00594268%
2195 City of Metolius - 0.00000000%
2196 City of Hubbard 1,979,873 0.01026484%
2197 City of Myrtle Creek 2,133,807 0.01106293%
2198 City of Carlton 807,146 0.00418473%
2199 City of Junction City 6,183,064 0.03205670%
2200 City of Wallowa 265,004 0.00137394%
2201 City of Coburg 1,045,872 0.00542243%
2202 City of Dallas 11,050,682 0.05729334%
2203 City of Rockaway Beach 1,542,014 0.00799472%
2204 City of Burns 1,331,921 0.00690547%
2205 City of Elgin - 0.00000000%
2206 City of Weston 193,585 0.00100366%
2207 City of Mill City 596,364 0.00309191%
The accompanying notes are an integral part of this schedule.4

Oregon Public Employees Retirement System
Cost-Sharing Multiple-Employer Defined Benefit Pension Plan
Schedule of Employer Allocations
June 30, 2016
Employer
Number Employer Name
Employer Total Present
Value of Contribution
Effort
Employer Proportionate
Share Percentage
2208 City of Fairview 6,519,121 0.03379902%
2209 City of Monroe - 0.00000000%
2210 City of Helix 36,295 0.00018817%
2211 City of Jefferson - 0.00000000%
2212 Town of Lakeview 1,856,094 0.00962310%
2213 City of Stanfield - 0.00000000%
2214 City of Yamhill 754,892 0.00391381%
2215 City of Powers - 0.00000000%
2216 City of Brookings 7,319,704 0.03794972%
2217 City of Sutherlin 3,764,944 0.01951972%
2218 City of Prairie City 372,857 0.00193311%
2219 City of Sheridan 1,450,371 0.00751959%
2220 City of Garibaldi 1,012,782 0.00525087%
2221 City of Sisters 1,617,852 0.00838791%
2222 City of Jacksonville 1,959,468 0.01015905%
2223 City of Cannon Beach 4,049,995 0.02099759%
2224 City of Falls City 458,399 0.00237661%
2225 City of Echo 515,341 0.00267184%
2226 City of Hines 1,095,709 0.00568081%
2227 Town Of Bonanza - 0.00000000%
2228 City of Turner 973,892 0.00504924%
2229 City of John Day 1,296,532 0.00672200%
2231 City of Banks 596,139 0.00309074%
2232 City of Joseph 413,475 0.00214370%
2233 City of Lafayette 844,011 0.00437586%
2234 City of Aumsville 1,822,333 0.00944806%
2235 City of Amity 748,115 0.00387868%
2236 City of Creswell 1,549,446 0.00803325%
2237 City of Troutdale 10,264,506 0.05321733%
2238 City of Warrenton 6,443,547 0.03340720%
2240 City of Wilsonville 21,526,464 0.11160605%
2241 City of Bay City 613,162 0.00317900%
2242 City of Gaston - 0.00000000%
2243 City Of Brownsville 1,146,814 0.00594577%
2244 City of Lakeside 626,679 0.00324908%
2245 City of Dundee 1,314,262 0.00681392%
2246 City of Merrill 108,036 0.00056012%
2247 City of Malin 222,193 0.00115198%
2248 City of Fossil 157,670 0.00081746%
2249 City of Phoenix 2,151,828 0.01115636%
2250 City of Gold Beach 982,054 0.00509155%
2251 City of Rogue River 1,533,398 0.00795005%
2252 City of Dayton 670,600 0.00347679%
2253 Town of Butte Falls 47,653 0.00024706%
2254 City of Shady Cove 81,624 0.00042319%
2255 Town of Canyon City 316,313 0.00163996%
2256 City of Jordan Valley - 0.00000000%
2257 City of Culver 356,301 0.00184728%
2258 City of Adair Village 635,693 0.00329581%
2259 Town Of Hammond - 0.00000000%
2260 City of Riddle 554,432 0.00287451%
2261 City of Waldport 391,026 0.00202731%
2262 City of Dufur 228,688 0.00118566%
2263 City of La Grande 5,751,373 0.02981855%
2264 City of Gervais 899,120 0.00466158%
2265 City of Westfir 61,228 0.00031744%
2266 City of Irrigon 1,043,269 0.00540893%
2267 City of Independence 6,045,049 0.03134115%
2268 City of Harrisburg 1,249,367 0.00647747%
2269 City of Durham 155,444 0.00080591%
2270 City of Lyons 156,102 0.00080933%
2271 City of Columbia City 1,138,904 0.00590476%
2272 City of Aurora 197,886 0.00102596%
The accompanying notes are an integral part of this schedule.5

Oregon Public Employees Retirement System
Cost-Sharing Multiple-Employer Defined Benefit Pension Plan
Schedule of Employer Allocations
June 30, 2016
Employer
Number Employer Name
Employer Total Present
Value of Contribution
Effort
Employer Proportionate
Share Percentage
2273 City of Silverton 6,742,385 0.03495655%
2274 City of Gold Hill 293,291 0.00152060%
2275 City of Toledo 3,372,519 0.01748515%
2276 City of Newport 5,742,366 0.02977186%
2277 City Of Rajneeshpuram - 0.00000000%
2278 City of Springfield 55,816,566 0.28938643%
2279 City of Keizer 11,933,248 0.06186909%
2280 City of Winston 2,315,796 0.01200647%
2281 City of Manzanita 1,682,721 0.00872423%
2282 City of Eagle Point 2,140,662 0.01109847%
2283 City of Maupin 267,298 0.00138583%
2284 City of Halsey 375,532 0.00194698%
2285 City of Veneta 1,862,605 0.00965686%
2286 City of Millersburg 538,850 0.00279372%
2287 City of King City 846,322 0.00438784%
2288 City of Tualatin 26,974,702 0.13985297%
2289 City Of St Paul - 0.00000000%
2290 City of Molalla 3,187,252 0.01652462%
2291 City of Florence 4,889,775 0.02535152%
2292 City of North Bend 9,016,345 0.04674612%
2293 City of Lowell 90,138 0.00046733%
2294 City of Depoe Bay 1,614,613 0.00837112%
2295 City of Tigard 14,411,650 0.07471861%
2296 City of Happy Valley 5,837,749 0.03026638%
2297 City of Rainier 1,554,116 0.00805747%
2298 City of Lincoln City 14,965,446 0.07758981%
2299 City of Dunes City 92,678 0.00048050%
2300 City of Yachats 1,177,483 0.00610478%
2301 City of Moro 188,271 0.00097611%
2302 City of Mt. Vernon 278,370 0.00144324%
2303 City of Woodburn 20,852,498 0.10811181%
2304 City of Gladstone 7,198,343 0.03732051%
2305 City of Elkton 63,765 0.00033060%
2306 City of Imbler - 0.00000000%
2307 City of Yoncalla 343,473 0.00178077%
2308 City of North Powder 137,315 0.00071192%
2309 City of Gearhart 981,670 0.00508956%
2501 Port of The Dalles 179,407 0.00093015%
2504 Oak Lodge Water District 2,576,083 0.01335595%
2507 Port of Astoria 2,028,026 0.01051450%
2508 Multnomah Drainage 2,882,654 0.01494540%
2510 Horsefly Irrigation District 157,408 0.00081610%
2511 Grants Pass Irrigation District 1,098,068 0.00569304%
2512 Port of Portland 132,583,001 0.68738950%
2513 Port of Coos Bay 2,842,625 0.01473787%
2515 Klamath County Fire District 1 19,168,060 0.09937868%
2518 Clackamas County Housing Authority 5,427,056 0.02813710%
2519 Portland Housing Authority 30,646,388 0.15888919%
2521 League of Oregon Cities 11,477,358 0.05950548%
2522 Lane Council of Governments 23,651,172 0.12262181%
2524 Oak Lodge Sanitary District 4,067,637 0.02108906%
2526 Clatskanie PUD 7,628,335 0.03954985%
2527 Deschutes Valley Water District 4,622,297 0.02396475%
2528 Columbia River Fire & Rescue 9,101,717 0.04718874%
2529 East Fork Irrigation District 265,934 0.00137876%
2530 River Road Water District 733,344 0.00380209%
2531 Oregon School Boards Association 7,202,087 0.03733992%
2533 Owyhee Irrigation District 3,871,285 0.02007105%
2535 Athena Cemetery Maintenance District 1 - 0.00000000%
2536 Valley View Cemetery - 0.00000000%
2538 Clackamas Vector Control 818,517 0.00424368%
2540 West Extension Irrigation District 578,294 0.00299822%
2541 Jackson County Vector Control District 140,076 0.00072624%
The accompanying notes are an integral part of this schedule.6

Oregon Public Employees Retirement System
Cost-Sharing Multiple-Employer Defined Benefit Pension Plan
Schedule of Employer Allocations
June 30, 2016
Employer
Number Employer Name
Employer Total Present
Value of Contribution
Effort
Employer Proportionate
Share Percentage
2542 Rainbow Water District 1,171,650 0.00607453%
2544 Santa Clara Rural Fire Protection District 649,940 0.00336968%
2545 Council of Governments 16,047,217 0.08319836%
2547 Metzger Water District - 0.00000000%
2549 Rogue River Fire District 2,001,607 0.01037753%
2550 Nyssa Road Assessment District 2 782,703 0.00405800%
2551 Sandy Fire Department 2,179,658 0.01130065%
2552 Winston-Dillard Fire District 2,367,942 0.01227683%
2553 Tangent Rural Fire Protection District 484,471 0.00251179%
2555 Monroe Fire Department 128,663 0.00066707%
2556 Jackson County Fire District 5 7,571,828 0.03925688%
2557 Estacada Fire Department 1,255,248 0.00650796%
2558 Boring Fire Department - 0.00000000%
2559 Keizer Fire Department 5,394,207 0.02796679%
2561 Jefferson Rural Fire Protection District 594,889 0.00308426%
2562 Odell Rural Fire Protection District 106,277 0.00055100%
2563 Central Oregon Irrigation District 3,911,256 0.02027829%
2564 Illinois Valley Fire District 814,824 0.00422453%
2567 Charleston Rural Fire Protection District 449,969 0.00233291%
2568 Molalla Rural Fire Protection District 73 2,756,217 0.01428988%
2569 Central Oregon Intergovernmental Council 6,173,958 0.03200949%
2570 Port of St Helens 799,582 0.00414551%
2571 Crystal Springs Water District 695,286 0.00360478%
2572 Local Government Personnel Institute 410,459 0.00212806%
2573 Goshen Fire District 530,696 0.00275145%
2575 Jefferson County Rural Fire Protection District 1 843,032 0.00437078%
2576 Depoe Bay Rural Fire Protection District 1,329,403 0.00689242%
2578 Washington County Fire District 2 4,066,395 0.02108262%
2579 La Pine Rural Fire Protection District 4,747,147 0.02461205%
2580 Marion County Fire District 1 11,032,453 0.05719883%
2581 Port of Umatilla 624,156 0.00323600%
2582 Talent Irrigation District 1,368,393 0.00709457%
2585 Rogue River Valley Irrigation District 728,964 0.00377938%
2587 Tualatin Valley Irrigation District 417,199 0.00216301%
2588 Clatskanie Rural Fire Protection District 2,291,759 0.01188185%
2589 West Slope Water District 1,398,479 0.00725055%
2590 Redmond Fire & Rescue 11,011,952 0.05709254%
2592 Medford Irrigation District 859,071 0.00445394%
2594 Metro 105,423,278 0.54657727%
2595 Canby Fire District 5,571,049 0.02888365%
2596 Bend Parks & Recreation 10,215,162 0.05296150%
2597 Mapleton Water District 78,841 0.00040876%
2598 Marion County Housing Authority 62,155 0.00032225%
2599 South Suburban Sanitary District 1,713,403 0.00888330%
2600 Winston-Dillard Water District 947,693 0.00491341%
2601 Baker Valley Irrigation District - 0.00000000%
2602 Aumsville Rural Fire Protection District 467,404 0.00242330%
2603 Corbett Water District 485,650 0.00251790%
2604 Netarts-Oceanside Sanitary District 583,663 0.00302606%
2605 Scio Fire District 155,503 0.00080622%
2606 West Valley Housing Authority 1,459,574 0.00756730%
2607 Hoodland Fire District 74 2,132,440 0.01105584%
2608 Gaston Rural Fire Protection District 249,690 0.00129454%
2610 Turner Fire District 719,282 0.00372919%
2612 Community Services Consortium 8,785,976 0.04555175%
2613 Polk Soil & Water Conservation District 254,160 0.00131772%
2614 Mountain Valley Mental Health Program - 0.00000000%
2615 Humanities Council 197,985 0.00102647%
2616 Alcohol Safety Action Program - 0.00000000%
2617 Clean Water Services 49,760,796 0.25798970%
2618 Estacada Cemetery District - 0.00000000%
2619 Comprehensive Options For Drug Abusers - 0.00000000%
2620 Jackson County Fire District 4 872,399 0.00452304%
The accompanying notes are an integral part of this schedule.7

Oregon Public Employees Retirement System
Cost-Sharing Multiple-Employer Defined Benefit Pension Plan
Schedule of Employer Allocations
June 30, 2016
Employer
Number Employer Name
Employer Total Present
Value of Contribution
Effort
Employer Proportionate
Share Percentage
2623 Evans Valley Fire District 6 - 0.00000000%
2624 Klamath Vector Control 123,921 0.00064248%
2625 Port of Newport 874,866 0.00453583%
2626 Tillamook Peoples Utility District 17,492,865 0.09069346%
2628 McKenzie Fire And Rescue 705,678 0.00365866%
2629 Metropolitan Wastewater Management Commission - 0.00000000%
2630 Sheridan Fire District 668,838 0.00346766%
2631 Arch Cape Water-Sanitary District 206,575 0.00107101%
2632 Umpqua Regional Council of Governments 91,601 0.00047491%
2633 Port of Cascade Locks 673,066 0.00348958%
2637 Northeast Oregon Housing Authority 1,577,963 0.00818110%
2638 North Douglas County Fire and EMS 579,979 0.00300696%
2641 Suburban East Salem Water District 782,320 0.00405601%
2642 Dexter Rural Fire Protection District - 0.00000000%
2643 Sweet Home Cemetery 160,189 0.00083052%
2644 Lakeside Water District 266,730 0.00138289%
2645 Chiloquin Agency Lake Rural Fire Protection District 152,805 0.00079223%
2646 Keno Rural Fire Protection District 218,350 0.00113206%
2647 Crooked River Ranch Rural Fire Protection District 794,974 0.00412162%
2648 Black Butte Ranch Rural Fire Protection District 1,796,045 0.00931177%
2649 Colton Fire Department 215,430 0.00111692%
2650 Pleasant Hill Fire Department 156,235 0.00081002%
2651 Imbler Rural Fire Protection District 69,982 0.00036283%
2652 The Oregon Consortium 743,693 0.00385575%
2653 Umatilla Fire Department 361,978 0.00187671%
2654 Spring Valley Rural Fire Protection District - 0.00000000%
2655 North Bay Rural Fire Protection District 131,059 0.00067949%
2657 Mid-Willamette Valley Senior Service Agency 20,314,347 0.10532171%
2658 Salem Metropolitan Communication Agency 388,339 0.00201338%
2659 Silverton Fire District 947,161 0.00491065%
2660 Tualatin Valley Fire & Rescue 117,815,567 0.61082630%
2661 Lincoln County 911 - 0.00000000%
2662 East Central Oregon Association of Counties 51,348 0.00026622%
2663 Metropolitan Area Communications Commission 2,351,022 0.01218910%
2664 Applegate Valley Rural Fire Protection District 9 878,859 0.00455653%
2665 N NE Community Mental Health Center 251,172 0.00130223%
2666 Central City Concern - 0.00000000%
2667 Mental Health Services West Inc - 0.00000000%
2668 Southeast Mental Health Network Inc - 0.00000000%
2669 Roseburg Urban Sanitary Authority 2,161,562 0.01120683%
2670 Mt Hood Community Mental Health Ctr 496,886 0.00257615%
2671 Columbia 911 Communications District 2,879,470 0.01492889%
2672 Rockwood Water PUD 2,980,543 0.01545292%
2673 Port Orford Library - 0.00000000%
2674 Nestucca Rural Fire District 533,392 0.00276542%
2675 Salmon Harbor-Douglas County 498,793 0.00258604%
2676 Woodburn Fire District 3,727,559 0.01932589%
2677 Portland Private Industry Council Inc - 0.00000000%
2678 Central Oregon Regional Housing Authority 797,390 0.00413415%
2679 Columbia River Public Utility District 7,754,700 0.04020500%
2681 Cloverdale Rural Fire Protection District 362,950 0.00188175%
2684 Parkdale Fire District 332,463 0.00172369%
2685 Oregon Community College Association 338,919 0.00175716%
2686 Weston Cemetery 61,670 0.00031973%
2687 Columbia Drainage Vector Control District 148,040 0.00076753%
2688 Polk County Fire District 1 2,514,074 0.01303446%
2689 Redmond Area Park & Recreation District 615,468 0.00319095%
2692 Siuslaw Public Library 857,928 0.00444801%
2694 Philomath Fire Department 1,066,959 0.00553175%
2695 Washington County Consolidated Communications Agency 16,426,260 0.08516355%
2696 Stayton Fire District 1,383,110 0.00717087%
2697 Oregon Museum Park - 0.00000000%
2698 Halsey Shedd Rural Fire Protection District 131,645 0.00068253%
The accompanying notes are an integral part of this schedule.8

Oregon Public Employees Retirement System
Cost-Sharing Multiple-Employer Defined Benefit Pension Plan
Schedule of Employer Allocations
June 30, 2016
Employer
Number Employer Name
Employer Total Present
Value of Contribution
Effort
Employer Proportionate
Share Percentage
2699 Chetco Library Board 499,759 0.00259105%
2700 Lowell Rural Fire Protection District - 0.00000000%
2701 Sisters-Camp Sherman Rural Fire Protection District 2,773,275 0.01437831%
2702 Banks Fire District 13 570,379 0.00295719%
2703 Westport Sewer District - 0.00000000%
2704 Clatsop County 4-H District - 0.00000000%
2705 Lebanon Fire District 7,922,203 0.04107343%
2706 Stanfield Fire District - 0.00000000%
2707 Clatskanie Library 184,773 0.00095797%
2708 Milton-Freewater Cemetery District 3 32,372 0.00016784%
2709 Scappoose Public Library 266,098 0.00137961%
2710 Klamath County Emergency Communications District 1,539,186 0.00798006%
2712 Jefferson County EMS 877,075 0.00454728%
2713 Port of Tillamook Bay 1,507,545 0.00781601%
2714 Winchester Bay Sanitary District 224,545 0.00116418%
2715 Jackson County Fire District 3 14,541,281 0.07539069%
2716 Neskowin Water District 509,434 0.00264121%
2717 Ice Fountain Water District 367,177 0.00190366%
2718 Curry Library - 0.00000000%
2719 Human Solutions, Inc - 0.00000000%
2720 Tri-Met - 0.00000000%
2721 Klamath Housing Authority 874,561 0.00453425%
2722 Tillamook 9-1-1 315,597 0.00163624%
2723 Oregon Coastal Zone Management Association - 0.00000000%
2724 Nehalem Bay Wastewater Agency 459,460 0.00238212%
2725 West Valley Fire District 1,234,323 0.00639947%
2726 Yamhill Communications Agency 2,181,010 0.01130766%
2728 Baker County Library District 985,797 0.00511096%
2729 Douglas County Fire District 2 23,714,976 0.12295261%
2731 Canby Utility Board 4,195,171 0.02175027%
2732 Umatilla County Special Library District 192,516 0.00099812%
2733 Wiard Memorial Park District 355,984 0.00184563%
2734 Seal Rock Water District 897,188 0.00465156%
2736 Wasco 9-1-1 - 0.00000000%
2737 Portland Energy Conservation Inc 140,022 0.00072596%
2739 Scappoose Rural Fire Protection District 4,163,918 0.02158824%
2740 Neskowin Regional Sanitary Authority 106,136 0.00055027%
2741 Port of Garibaldi 388,458 0.00201400%
2742 Amity Fire District 239,182 0.00124006%
2743 Douglas Soil & Water Conservation District - 0.00000000%
2745 Clackamas County Fire District 66,795,481 0.34630769%
2746 Marion-Salem Data Center - 0.00000000%
2747 Salem Housing Authority 5,030,822 0.02608279%
2749 Black Butte Ranch Police 937,379 0.00485993%
2750 Eastern Oregon Human Services Consortium - 0.00000000%
2752 Mist-Birkenfeld Rural Fire Protection District 150,019 0.00077779%
2753 Linn-Benton Housing Authority 2,006,387 0.01040231%
2754 Western Lane Ambulance District 2,530,827 0.01312132%
2756 Sandy Area Sch Trans Agency - 0.00000000%
2757 City of Stayton 2,575,159 0.01335116%
2758 Mohawk Valley Rural Fire District 205,538 0.00106563%
2760 Knappa Svensen Burnside Rural Fire Protection District 209,978 0.00108865%
2761 Clackamas River Water 6,914,255 0.03584763%
2763 Junction City Fire Department 543,981 0.00282032%
2765 Green Sanitary 649,927 0.00336961%
2766 Southwest Lincoln County Water District 573,821 0.00297503%
2767 Springfield Utility Board 113,436 0.00058812%
2768 Lake County Library District 263,596 0.00136664%
2771 Harbor Water PUD 251,313 0.00130296%
2772 Umatilla County Soil & Water District 225,356 0.00116838%
2773 Housing Authority of Jackson County 6,234,764 0.03232474%
2774 Oregon Trail Library District 271,122 0.00140566%
2776 Rainier Cemetery District 18,150 0.00009410%
The accompanying notes are an integral part of this schedule.9

Oregon Public Employees Retirement System
Cost-Sharing Multiple-Employer Defined Benefit Pension Plan
Schedule of Employer Allocations
June 30, 2016
Employer
Number Employer Name
Employer Total Present
Value of Contribution
Effort
Employer Proportionate
Share Percentage
2777 City of Newberg 16,059,906 0.08326415%
2778 Mulino Water District 23 146,694 0.00076055%
2779 Brownsville Rural Fire Protection District 255,057 0.00132237%
2780 Nehalem Bay Health District 92,549 0.00047983%
2781 North Bend Coos-Curry Housing Authority 1,261,788 0.00654186%
2782 Millington Rural Fire Protection District 5,813 0.00003014%
2783 Tillamook Fire District 437,286 0.00226715%
2784 Eisenschmidt Pool 383,560 0.00198860%
2785 Fern Ridge Community Library 70,708 0.00036659%
2786 Seal Rock Rural Fire Protection District 117,794 0.00061071%
2788 Port of Hood River 1,528,115 0.00792266%
2789 Farmers Irrigation District 957,832 0.00496597%
2790 Silver Falls Library District 706,708 0.00366400%
2792 North Wasco County Parks And Recreation District 799,685 0.00414604%
2793 North Lincoln Fire & Rescue District 1 1,540,060 0.00798459%
2794 Siuslaw Rural Fire Protection District 1 1,694,550 0.00878556%
2796 West Side Rural Fire Protection District 178,110 0.00092343%
2797 Vernonia Fire 100,699 0.00052208%
2798 Fairview Water District 204,091 0.00105813%
2799 Sublimity Fire District 203,050 0.00105273%
2801 Coburg Rural Fire Protection District 296,432 0.00153688%
2802 Rural Road Assessment District 3 500,045 0.00259253%
2803 Southwestern Polk County Rural Fire Protection District 23,147 0.00012001%
2804 Aurora Rural Fire Protection District 679,674 0.00352384%
2806 Multnomah County Rural Fire Protection District 14 103,518 0.00053670%
2808 Lifeways - 0.00000000%
2809 Juntura Road District 4 36,759 0.00019058%
2810 Sutherlin Water Control District 120,343 0.00062393%
2811 Mid-Columbia Center For Living 11,556,965 0.05991821%
2812 Workforce Development Board - 0.00000000%
2814 The Job Council 4,836,379 0.02507468%
2815 Hermiston Rural Fire Protection District 5,289,775 0.02742535%
2816 Odell Sanitary District 405,017 0.00209985%
2817 Wickiup Water District 235,687 0.00122194%
2818 Netarts Water District 234,335 0.00121493%
2819 Harrisburg Fire and Rescue 239,338 0.00124087%
2820 Central Oregon Coast Fire & Rescue District 670,310 0.00347529%
2821 Tillamook County Soil And Water Conservation District 273,336 0.00141714%
2822 Deschutes County Rural Fire Protection District 2 263,645 0.00136689%
2823 Lyons Fire District 103,147 0.00053478%
2824 Glide Fire Department 142,118 0.00073682%
2825 Northern Oregon Corrections 6,871,833 0.03562769%
2826 Wasco County Soil-Water Conservation District 631,796 0.00327561%
2828 Deschutes Public Library District 5,470,455 0.02836211%
2829 Hubbard Rural Fire Protection District - 0.00000000%
2830 Netarts-Oceanside Rural Fire Protection District 319,316 0.00165552%
2831 Oregon Advanced Technology Consortium, Inc - 0.00000000%
2832 CareOregon - 0.00000000%
2833 Boardman Rural Fire Protection District 668,079 0.00346372%
2834 Crescent Rural Fire Protection District 203,117 0.00105308%
2835 North Clackamas County Water Commission 504,751 0.00261693%
2837 NORCOM 2,346,578 0.01216606%
2838 High Desert Parks & Recreation District 15,473 0.00008022%
2839 North Morrow Vector Control District 274,763 0.00142454%
2840 Cannon Beach Rural Fire Protection District 426,629 0.00221190%
2841 Jefferson County Soil & Water Conservation District 198,007 0.00102659%
2842 Tualatin Valley Water District 19,503,196 0.10111622%
2843 Yachats Rural Fire Protection District 514,711 0.00266857%
2844 Crook County Rural Fire Protection District 1 4,555,785 0.02361991%
2845 Sunrise Water Authority 2,363,554 0.01225408%
2846 Jefferson County Library District 407,117 0.00211074%
2847 Sweet Home Fire and Ambulance District 2,498,390 0.01295315%
2848 Lane Transit District - 0.00000000%
The accompanying notes are an integral part of this schedule.10

Oregon Public Employees Retirement System
Cost-Sharing Multiple-Employer Defined Benefit Pension Plan
Schedule of Employer Allocations
June 30, 2016
Employer
Number Employer Name
Employer Total Present
Value of Contribution
Effort
Employer Proportionate
Share Percentage
2849 Lebanon Aquatic District 408,471 0.00211776%
2850 Lake County 4-H & Extension Service 111,518 0.00057818%
2851 East Umatilla County Rural Fire Protection District 138,407 0.00071758%
2852 Ochoco Irrigation District 716,532 0.00371493%
2853 Mill City Rural Fire Protection District 103,199 0.00053505%
2854 Sunset Empire Transportation District - 0.00000000%
2855 Harney Hospital 17,721,524 0.09187897%
2856 Mid-Columbia Council Of Governments 32,863 0.00017038%
2857 Sunriver Service District 4,313,065 0.02236151%
2858 Nesika Beach-Ophir Water District 216,481 0.00112237%
2859 South Lane County Fire and Rescue 5,722,614 0.02966945%
2860 Coos County Airport District 1,295,782 0.00671811%
2861 Mt Angel Fire District 67,808 0.00035156%
2864 Tri-City Water and Sanitary Authority 786,021 0.00407520%
2865 Tri-County Cooperative Weed Management Area 69,460 0.00036012%
2866 Jefferson Behavioral Health 9,288 0.00004815%
2867 West Multnomah Soil And Water Conservation District 1,206,062 0.00625295%
2869 Nehalem Bay Fire & Rescue 444,849 0.00230636%
2870 Clackamas River Water Providers 131,178 0.00068011%
2872 Emergency Communications of Southern Oregon 7,335 0.00003803%
2873 Mosier Fire District 68,151 0.00035334%
2874 Umatilla-Morrow Radio and Data District 158,987 0.00082428%
2876 Oregon Municipal Electric Utilities Association 81,429 0.00042218%
2877 Mid-Columbia Fire And Rescue V1-801 3,195,909 0.01656950%
2878 Yamhill Fire Protection District 196,261 0.00101753%
2879 LaGrande Rural Fire Protection District 130,468 0.00067642%
2880 Oregon Health & Science University 676,063,567 3.50511750%
2881 Lake Chinook Fire and Rescue District 61,665 0.00031971%
2883 Lane Fire Authority 6,827,658 0.03539866%
2884 North Central Public Health District 2,906,550 0.01506929%
2885 Siletz Rural Fire Protection District 234,212 0.00121429%
2886 Idanha-Detroit Rural Fire Protection District - 0.00000000%
2900 Clatsop Community College 7,372,243 0.03822211%
2901 Blue Mountain Community College 15,358,335 0.07962679%
2902 Treasure Valley Community College 13,523,876 0.07011585%
2903 Umpqua Community College 21,216,256 0.10999775%
2904 Lane Community College 74,556,063 0.38654318%
2905 Mt Hood Community College 34,271,399 0.17768341%
2906 Klamath Community College 8,980,410 0.04655981%
2908 Clackamas Community College 41,745,987 0.21643614%
2910 Linn-Benton Community College 39,284,982 0.20367682%
2918 Portland Community College 214,375,187 1.11144907%
2919 Chemeketa Community College 64,137,262 0.33252589%
2922 Rogue Community College 32,430,575 0.16813948%
2995 Oregon Coast Community College 3,481,338 0.01804934%
2996 Columbia Gorge Community College 10,336,461 0.05359039%
2997 Tillamook Bay Community College 2,638,947 0.01368188%
2998 Southwestern Community College 14,811,487 0.07679160%
2999 Central Oregon Community College 47,200,364 0.24471489%
3003 Baker School District 5J 17,963,852 0.09313534%
3008 Huntington School District 16J 1,421,421 0.00736950%
3016 Burnt River High School 1,112,413 0.00576741%
3027 Pine-Eagle School District 61 3,592,318 0.01862472%
3037 Alsea School 2,948,588 0.01528724%
3039 Corvallis School District 509J 59,955,930 0.31084737%
3043 Philomath School District 17J 12,624,819 0.06545461%
3049 Monroe Elementary School - 0.00000000%
3075 West Linn School District 100,708,347 0.52213225%
3083 Welches Elementary School - 0.00000000%
3094 Damascus-Union School District 26 - 0.00000000%
3102 Molalla Elementary School 35 - 0.00000000%
3109 Boring School District - 0.00000000%
3111 Sandy Elementary School District 46 - 0.00000000%
The accompanying notes are an integral part of this schedule.11

Oregon Public Employees Retirement System
Cost-Sharing Multiple-Employer Defined Benefit Pension Plan
Schedule of Employer Allocations
June 30, 2016
Employer
Number Employer Name
Employer Total Present
Value of Contribution
Effort
Employer Proportionate
Share Percentage
3116 Colton School District 53 9,005,437 0.04668957%
3122 Oregon City School District 62 86,317,036 0.44751909%
3138 Canby Elementary School District 86 - 0.00000000%
3160 Gladstone School District 115 6,260,805 0.03245975%
3174 Canby Union High School - 0.00000000%
3175 Sandy Union High School - 0.00000000%
3176 Molalla Union High School - 0.00000000%
3179 Clatsop County School District 1C 8,762,629 0.04543070%
3186 Jewell School District 8 5,474,632 0.02838376%
3187 Seaside Schools 18,560,331 0.09622785%
3195 Warrenton-Hammond School District 10,093,650 0.05233151%
3230 Vernonia School District 9,564,099 0.04958600%
3241 Coquille School District 8 12,794,167 0.06633261%
3242 Coos Bay School District 9 31,795,291 0.16484579%
3245 North Bend Public Schools 22,463,934 0.11646646%
3252 Powers School District 2,458,915 0.01274848%
3257 Myrtle Point School District 41 11,126,947 0.05768874%
3264 Bandon School District 10,248,080 0.05313217%
3274 Crook County School District 16,455,014 0.08531263%
3275 Port Orford-Langlois School District 2Cj 4,941,092 0.02561757%
3277 Curry County School District 3C - 0.00000000%
3281 Ophir School - 0.00000000%
3282 Pistol River School District 16 - 0.00000000%
3283 Brookings-Harbor School District 17C 10,519,311 0.05453839%
3288 Central Curry School District 1 7,322,859 0.03796608%
3291 Bend-La Pine Public Schools 183,451,348 0.95112141%
3296 Sisters School District 7,495,834 0.03886288%
3307 Oakland School District 8,517,918 0.04416198%
3310 Roseburg Public Schools 43,899,672 0.22760213%
3316 Glide School District 12 6,804,867 0.03528050%
3318 Days Creek School District 15 3,257,267 0.01688762%
3319 South Umpqua School District 1,421,194 0.00736832%
3320 Camas Valley School District 21 3,141,726 0.01628858%
3321 North Douglas School District 22 5,418,975 0.02809520%
3324 Yoncalla School District 32 4,962,039 0.02572618%
3325 Elkton School District 34 3,626,346 0.01880114%
3331 Umpqua School District - 0.00000000%
3335 Riddle School District 5,607,066 0.02907038%
3338 Glendale 77 4,687,565 0.02430314%
3349 Winston-Dillard Schools 208,847 0.00108279%
3353 Sutherlin School District 130 7,240,806 0.03754066%
3361 Arlington Public Schools 3,187,628 0.01652657%
3364 Condon Admin School District 25J 2,514,389 0.01303610%
3370 Prairie City School District 4 2,827,724 0.01466061%
3372 Monument School District 8 1,633,931 0.00847127%
3375 Dayville School District 16J 1,854,972 0.00961728%
3376 Long Creek Schools 1,038,574 0.00538459%
3392 Burns-Slater School District - 0.00000000%
3394 Crane Elementary School 744,991 0.00386248%
3395 Pine Creek School 99,364 0.00051516%
3396 Diamond School District 7 358,581 0.00185910%
3397 Suntex School District 372,531 0.00193142%
3398 Drewsey School - 0.00000000%
3399 Frenchglen School District 369,129 0.00191379%
3405 Fields-Trout Creek 33 304,723 0.00157987%
3407 Crane Union High School 2,289,736 0.01187136%
3408 Burns Union High School - 0.00000000%
3409 Hood River County School District 47,035,203 0.24385860%
3414 City of Phoenix School District 20,316,799 0.10533443%
3415 Ashland Public Schools 44,412,344 0.23026013%
3416 Central Point School District 6 63,429,820 0.32885809%
3417 Eagle Point School District 9 54,513,459 0.28263035%
3424 Rogue River School District 10,728,724 0.05562412%
The accompanying notes are an integral part of this schedule.12

Oregon Public Employees Retirement System
Cost-Sharing Multiple-Employer Defined Benefit Pension Plan
Schedule of Employer Allocations
June 30, 2016
Employer
Number Employer Name
Employer Total Present
Value of Contribution
Effort
Employer Proportionate
Share Percentage
3432 Prospect School District 3,493,200 0.01811084%
3439 Butte Falls School District 3,630,490 0.01882263%
3440 Pinehurst School 591,159 0.00306492%
3445 Culver School District 4 10,637,588 0.05515161%
3446 Ashwood School 114,591 0.00059411%
3447 Madras School District 40,351,767 0.20920767%
3451 Black Butte School District 647,906 0.00335913%
3453 Josephine County School District Cu - 0.00000000%
3454 Grants Pass School District 100,213,363 0.51956595%
3455 Klamath Falls School District 1 - 0.00000000%
3456 Klamath County School District 94,097,171 0.48785596%
3457 Klamath Falls City Schools 50,928,565 0.26404411%
3460 Union School District 5 - 0.00000000%
3461 Lake County School District 7 12,323,325 0.06389148%
3462 Paisley School District 2,361,423 0.01224303%
3463 North Lake School District 14 4,150,072 0.02151645%
3464 Plush School District 295,681 0.00153299%
3465 Adel School District 21 277,562 0.00143905%
3470 Pleasant Hill School District 12,252,263 0.06352305%
3473 Eugene School District 4J 220,950,442 1.14553912%
3487 Springfield School District 19 110,941,825 0.57518871%
3494 Fern Ridge School District 11,488,191 0.05956165%
3498 Mapleton School District 4,273,076 0.02215418%
3502 Creswell School District 40 16,578,051 0.08595052%
3506 South Lane School District 20,439,494 0.10597055%
3510 Bethel School District 82,288,072 0.42663054%
3517 Crow-Applegate-Lorane District 66 5,122,372 0.02655744%
3519 McKenzie School District 4,787,397 0.02482073%
3520 Junction City School District 69 25,384,474 0.13160828%
3522 Lowell School District 5,061,965 0.02624425%
3524 Oakridge School District 8,774,804 0.04549383%
3527 Marcola School District 79 3,691,125 0.01913700%
3533 Triangle Lake Schools 4,785,097 0.02480880%
3537 Siuslaw School District 97J 12,505,852 0.06483781%
3579 Lincoln County School District - 0.00000000%
3582 Linn County School District 5 - 0.00000000%
3610 Harrisburg Elementary School District 42J - 0.00000000%
3613 Harris School - 0.00000000%
3615 Central Linn School District 552C 11,037,348 0.05722421%
3618 Sweet Home School District 55 9,588,734 0.04971373%
3626 Wyatt School District 63Cj - 0.00000000%
3647 Scio School District 95C 11,507,332 0.05966089%
3665 Santiam Canyon School District 2,628,250 0.01362642%
3676 Harrisburg High School - 0.00000000%
3684 Ontario School District 8C 27,699,881 0.14361273%
3687 Juntura Grade School 179,962 0.00093303%
3689 Vale School District 15 - 0.00000000%
3694 Nyssa School District 26 18,647,485 0.09667970%
3696 Annex Elementary School 746,857 0.00387215%
3707 Adrian School District 61 4,462,022 0.02313379%
3709 Harper School District 66 2,147,151 0.01113211%
3712 W W Jones School 324,192 0.00168081%
3715 Vale High School - 0.00000000%
3720 Silverton RFD - 0.00000000%
3727 Aumsville Elementary - 0.00000000%
3729 Jefferson School District 14Cj 6,909,331 0.03582210%
3730 North Marion School District 15 17,051,547 0.08840541%
3732 Marion Elementary School - 0.00000000%
3735 Salem-Keizer Public Schools 424,609,257 2.20142811%
3750 St Paul School District 5,203,187 0.02697643%
3759 Eldriedge Elementary - 0.00000000%
3760 West Stayton School District - 0.00000000%
3761 Bethany Elementary - 0.00000000%
The accompanying notes are an integral part of this schedule.13
Oregon Public Employees Retirement System
Cost-Sharing Multiple-Employer Defined Benefit Pension Plan
Schedule of Employer Allocations
June 30, 2016
Employer
Number Employer Name
Employer Total Present
Value of Contribution
Effort
Employer Proportionate
Share Percentage
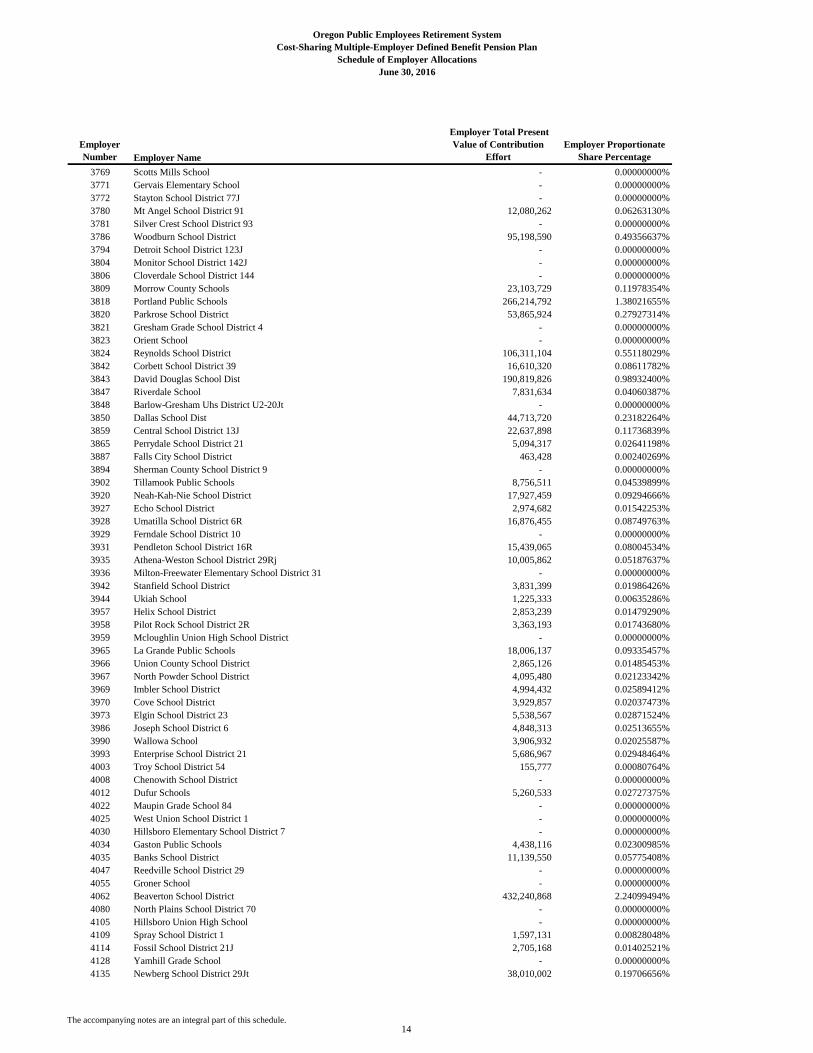
3769 Scotts Mills School - 0.00000000%
3771 Gervais Elementary School - 0.00000000%
3772 Stayton School District 77J - 0.00000000%
3780 Mt Angel School District 91 12,080,262 0.06263130%
3781 Silver Crest School District 93 - 0.00000000%
3786 Woodburn School District 95,198,590 0.49356637%
3794 Detroit School District 123J - 0.00000000%
3804 Monitor School District 142J - 0.00000000%
3806 Cloverdale School District 144 - 0.00000000%
3809 Morrow County Schools 23,103,729 0.11978354%
3818 Portland Public Schools 266,214,792 1.38021655%
3820 Parkrose School District 53,865,924 0.27927314%
3821 Gresham Grade School District 4 - 0.00000000%
3823 Orient School - 0.00000000%
3824 Reynolds School District 106,311,104 0.55118029%
3842 Corbett School District 39 16,610,320 0.08611782%
3843 David Douglas School Dist 190,819,826 0.98932400%
3847 Riverdale School 7,831,634 0.04060387%
3848 Barlow-Gresham Uhs District U2-20Jt - 0.00000000%
3850 Dallas School Dist 44,713,720 0.23182264%
3859 Central School District 13J 22,637,898 0.11736839%
3865 Perrydale School District 21 5,094,317 0.02641198%
3887 Falls City School District 463,428 0.00240269%
3894 Sherman County School District 9 - 0.00000000%
3902 Tillamook Public Schools 8,756,511 0.04539899%
3920 Neah-Kah-Nie School District 17,927,459 0.09294666%
3927 Echo School District 2,974,682 0.01542253%
3928 Umatilla School District 6R 16,876,455 0.08749763%
3929 Ferndale School District 10 - 0.00000000%
3931 Pendleton School District 16R 15,439,065 0.08004534%
3935 Athena-Weston School District 29Rj 10,005,862 0.05187637%
3936 Milton-Freewater Elementary School District 31 - 0.00000000%
3942 Stanfield School District 3,831,399 0.01986426%
3944 Ukiah School 1,225,333 0.00635286%
3957 Helix School District 2,853,239 0.01479290%
3958 Pilot Rock School District 2R 3,363,193 0.01743680%
3959 Mcloughlin Union High School District - 0.00000000%
3965 La Grande Public Schools 18,006,137 0.09335457%
3966 Union County School District 2,865,126 0.01485453%
3967 North Powder School District 4,095,480 0.02123342%
3969 Imbler School District 4,994,432 0.02589412%
3970 Cove School District 3,929,857 0.02037473%
3973 Elgin School District 23 5,538,567 0.02871524%
3986 Joseph School District 6 4,848,313 0.02513655%
3990 Wallowa School 3,906,932 0.02025587%
3993 Enterprise School District 21 5,686,967 0.02948464%
4003 Troy School District 54 155,777 0.00080764%
4008 Chenowith School District - 0.00000000%
4012 Dufur Schools 5,260,533 0.02727375%
4022 Maupin Grade School 84 - 0.00000000%
4025 West Union School District 1 - 0.00000000%
4030 Hillsboro Elementary School District 7 - 0.00000000%
4034 Gaston Public Schools 4,438,116 0.02300985%
4035 Banks School District 11,139,550 0.05775408%
4047 Reedville School District 29 - 0.00000000%
4055 Groner School - 0.00000000%
4062 Beaverton School District 432,240,868 2.24099494%
4080 North Plains School District 70 - 0.00000000%
4105 Hillsboro Union High School - 0.00000000%
4109 Spray School District 1 1,597,131 0.00828048%
4114 Fossil School District 21J 2,705,168 0.01402521%
4128 Yamhill Grade School - 0.00000000%
4135 Newberg School District 29Jt 38,010,002 0.19706656%
The accompanying notes are an integral part of this schedule.14

Oregon Public Employees Retirement System
Cost-Sharing Multiple-Employer Defined Benefit Pension Plan
Schedule of Employer Allocations
June 30, 2016
Employer
Number Employer Name
Employer Total Present
Value of Contribution
Effort
Employer Proportionate
Share Percentage
4142 McMinnville Schools 78,504,872 0.40701617%
4144 Sheridan School District 48J 14,326,415 0.07427670%
4166 Yamhill-Carlton School District 1 4,154,618 0.02154002%
4185 Lebanon School District Uh-1 - 0.00000000%
4189 Wasco County High School - 0.00000000%
4203 Victor Point School - 0.00000000%
4218 Curry County Education Service District - 0.00000000%
4219 Grant County Education Service District 2,304,393 0.01194735%
4220 Jefferson County Education Service District 2,740,499 0.01420838%
4221 Marion Education Service District - 0.00000000%
4223 InterMountain Education Service District 17,301,330 0.08970043%
4224 Wallowa County Region 18 3,257,627 0.01688948%
4225 Washington County Education Service District - 0.00000000%
4226 North Central Education Service District 2,443,014 0.01266604%
4227 Cascade School District Uh5 - 0.00000000%
4230 Mari-Linn School District - 0.00000000%
4232 South Coast Education Service District Region 7 13,995,207 0.07255952%
4237 Douglas Education Service District 23,929,541 0.12406504%
4238 Multnomah Education Service District 25,129,828 0.13028804%
4251 Clatsop County Education Service District - 0.00000000%
4252 High Desert Education Service District 23,188,375 0.12022239%
4254 Willamette Education Service District 18,154,211 0.09412228%
4258 Hermiston School District 8R 44,990,766 0.23325901%
4259 Clackamas Education Service District 28,671,019 0.14864769%
4260 Greater Albany School District 8J 99,630,900 0.51654612%
4268 Lake Oswego School District 59,350,677 0.30770937%
4270 Silver Falls School District 37,305,914 0.19341615%
4271 Malheur Education Service District Region 14 5,405,254 0.02802407%
4272 Linn-Benton-Lincoln Education Service District 35,064,428 0.18179495%
4273 Double O School District 117,037 0.00060679%
4275 Tillamook County Education Service District - 0.00000000%
4276 Lane County Education Service District 16,432,298 0.08519485%
4277 Mitchell School 1,835,129 0.00951441%
4279 St Helens School District 502 14,828,857 0.07688166%
4280 Northwest Regional Education Service District 78,852,260 0.40881723%
4286 Southern Oregon Education Service District 34,774,612 0.18029237%
4288 Medford School District 549C 148,791,736 0.77142527%
4291 Dayton Public Schools 6,611,324 0.03427705%
4293 Lake County Education Service District 1,744,346 0.00904373%
4294 Harney Education Service District Region XVII 3,648,257 0.01891474%
4295 Wasco County Education Service District 3,781,338 0.01960472%
4297 Yamhill Education Service District - 0.00000000%
4306 Amity School District 3,941,563 0.02043542%
4307 Columbia School District 5J - 0.00000000%
4309 Scappoose School District 29,756,272 0.15427429%
4311 Redmond School District 2J 72,917,064 0.37804563%
4312 Reedsport School District 4,635,188 0.02403158%
4313 Forest Grove School District 69,658,264 0.36115006%
4314 Willamina School District 30J 10,250,357 0.05314398%
4315 John Day School District 6,174,799 0.03201385%
4316 Tigard-Tualatin School District 23J 162,625,582 0.84314819%
4317 Sherwood School District 88J 62,709,152 0.32512171%
4320 Rainier School District 13 8,275,036 0.04290273%
4321 North Clackamas School District 12 122,033,567 0.63269493%
4323 Estacada School District 108 16,657,418 0.08636201%
4324 Centennial School District 28 113,215,065 0.58697455%
4326 Harney County School District 3 - 0.00000000%
4327 Jordan Valley School District 3 1,439,858 0.00746508%
4329 Gervais School District 1 6,693,428 0.03470273%
4330 Vale School District 84 16,361,316 0.08482684%
4331 Molalla River School District 5,592,821 0.02899653%
4332 Gresham-Barlow School District 10 103,316,176 0.53565279%
4333 Canby School District 23,783,036 0.12330547%
The accompanying notes are an integral part of this schedule.15

Oregon Public Employees Retirement System
Cost-Sharing Multiple-Employer Defined Benefit Pension Plan
Schedule of Employer Allocations
June 30, 2016
Employer
Number Employer Name
Employer Total Present
Value of Contribution
Effort
Employer Proportionate
Share Percentage
4334 Cascade School District 5 14,346,155 0.07437904%
4335 Milton-Freewater Unified School District 7 10,240,006 0.05309031%
4336 Nestucca Valley School District 101 7,195,168 0.03730405%
4337 Sherman County School District 4,425,327 0.02294354%
4338 Three Rivers U J School District 47,013,400 0.24374556%
4339 Lebanon Community School District 53,139,880 0.27550889%
4340 Monroe School District 1J 4,976,253 0.02579987%
4341 Hillsboro School District 1J 214,857,216 1.11394819%
4342 North Santiam School District 29J 14,764,678 0.07654891%
4343 Harrisburg School District 7 13,973,185 0.07244534%
4344 South Wasco County School District 1 4,639,068 0.02405170%
4345 Oregon Trail School District 46 61,525,049 0.31898262%
4346 Knappa School District 4 8,073,883 0.04185983%
4347 Clatskanie School District 6J 12,185,235 0.06317554%
4348 Lourdes Charter School 504,696 0.00261665%
4350 Ridgeline Montessori 2,361,328 0.01224254%
4351 The Village School 551,150 0.00285749%
4352 Armadillo Technical Institute 1,405,278 0.00728580%
4354 Opal Charter School 567,628 0.00294292%
4355 Three Rivers Charter School 1,680,101 0.00871065%
4358 Detroit Lake Charter School - 0.00000000%
4360 Luckiamute Valley Charter School 2,231,632 0.01157011%
4361 Rimrock Expeditionary Alternative Learning 1,980,612 0.01026868%
4362 Kings Valley Charter School 122,912 0.00063725%
4363 Multisensory Learning Academy 2,999,723 0.01555236%
4365 Mitch Charter School 1,910,456 0.00990495%
4366 Sand Ridge Charter School 2,499,179 0.01295724%
4367 Arthur Academy Charter School 1,171,718 0.00607489%
4369 Trillium Charter School 2,366,027 0.01226690%
4370 Howard Street Charter School, Inc. 525,959 0.00272689%
4371 The Lighthouse School 2,046,121 0.01060831%
4373 Sheridan Japanese School Foundation 749,435 0.00388552%
4374 Ione School District 4,464,973 0.02314909%
4375 Eddyville Charter School 2,186,623 0.01133676%
4376 Four Rivers Community School 3,082,623 0.01598216%
4378 Mosier Community School 1,992,704 0.01033137%
4379 Siletz Valley School 2,626,278 0.01361619%
4380 The Emerson School 1,296,681 0.00672277%
4381 North Wasco County School District 21 27,021,724 0.14009676%
4382 Self Enhancement Inc 1,104,414 0.00572594%
4383 City View Charter School 1,923,739 0.00997381%
4386 Nixyaawii Community School 1,185,327 0.00614544%
4388 West Lane Tech 957,497 0.00496424%
4390 Oregon Connections Academy 20,191,662 0.10468564%
4392 Eagleridge High School 1,801,992 0.00934260%
4393 Cascade Heights Public Charter School 1,779,159 0.00922422%
4395 Siletz Valley Early College Academy 825,085 0.00427773%
4396 Sweet Home Charter School 1,474,615 0.00764529%
4397 Springwater Environmental Sciences School 2,406,155 0.01247495%
4398 LEP High 5,117,049 0.02652984%
4400 Phoenix School 78,529 0.00040714%
4401 Ballston Community School 715,618 0.00371019%
4402 Sage Community School 788,564 0.00408839%
4403 Portland Village School 3,364,155 0.01744179%
4404 Alliance Charter Academy 4,501,229 0.02333706%
4405 Forest Grove Community School 2,045,036 0.01060269%
4407 Madrone Trail Public Charter School 2,218,450 0.01150177%
4408 Muddy Creek Charter School 829,777 0.00430206%
4409 Southwest Charter School 1,529,398 0.00792931%
4410 Ace Academy 1,242,099 0.00643978%
4411 Sherwood Charter School 1,426,832 0.00739755%
4412 Estacada Web Academy 4,384,444 0.02273158%
4418 Lewis And Clark Montessori Charter School 2,267,532 0.01175624%
The accompanying notes are an integral part of this schedule.16

Oregon Public Employees Retirement System
Cost-Sharing Multiple-Employer Defined Benefit Pension Plan
Schedule of Employer Allocations
June 30, 2016
Employer
Number Employer Name
Employer Total Present
Value of Contribution
Effort
Employer Proportionate
Share Percentage
4419 Silvies River Web Academy 522,532 0.00270912%
4420 Oregon Virtual Academy 7,960,442 0.04127169%
4421 Home Scholars Academy of Oakridge and Westfir 76,330 0.00039574%
4422 Redmond Proficiency Academy 6,975,392 0.03616460%
4423 Molalla River Academy 1,591,747 0.00825257%
4424 The Ivy School 1,023,724 0.00530760%
4429 Clackamas Web Academy 58,839 0.00030506%
4430 Clackamas Charter Alliance 2 237,583 0.00123177%
4431 Corbett Charter School 2,385,697 0.01236888%
4432 Renaissance Public Academy 366,852 0.00190198%
4433 Powell Butte Community Charter School 1,854,554 0.00961512%
4434 Logos Public Charter School 8,180,844 0.04241438%
4435 Sunny Wolf Charter School 825,274 0.00427871%
4436 Academy Of Arts & Academics 1,570,938 0.00814468%
4437 Center for Advance Learning 1,983,559 0.01028396%
4439 Homesource Family Charter - 0.00000000%
4440 Sheridan Allprep Academy 623,239 0.00323124%
4441 Baker Web Academy 5,129,386 0.02659380%
4443 Knova Learning Oregon 2,602,198 0.01349135%
4444 Bennett Pearson Academy, Inc. 1,229,841 0.00637623%
4446 Coburg Community Charter School 1,622,130 0.00841009%
4447 Arco Iris Spanish Immersion Charter School 1,510,873 0.00783327%
4448 Gresham Barlow Web Academy 3,425,162 0.01775809%
4449 Mosier Middle School 904,091 0.00468735%
4450 Sauvie Island Academy 2,759,675 0.01430780%
4451 River's Edge Academy Charter School 1,319,435 0.00684074%
4452 South Columbia Family School 324,295 0.00168134%
4453 Woodland Educational Initiative 1,060,454 0.00549803%
4454 Le Monde Immersion Charter School 1,401,117 0.00726423%
4455 Hope Chinese Charter School 1,502,197 0.00778829%
4456 Insight School of Oregon Charter 2,607,161 0.01351708%
4457 Oregon Virtual Education East 178,215 0.00092397%
4458 Oregon Virtual Education West 106,723 0.00055332%
4459 Crater Lake Charter Academy 885,852 0.00459279%
4460 Kairos PDX 122,062 0.00063284%
4461 Mountain View Academy 324,319 0.00168146%
4462 Bend International School - 0.00000000%
4463 Dallas Community School-Community Innovation Partners - 0.00000000%
4464 The Valley School Of Southern Oregon - 0.00000000%
Total 19,287,900,237$ 100%
The accompanying notes are an integral part of this schedule.17

Employer
Number Employer Name Net Pension Liability
Differences between
Expected and
Actual Experience
Changes in
Assumptions
Net Differences
between Projected and
Actual Investment
Earnings
Changes in Employer
Proportion
Total Deferred
Outflows of
Resources
Differences between
Expected and
Actual Experience
Changes in
Assumptions
Net Differences
between Projected and
Actual Investment
Earnings
Changes in Employer
Proportion
Total Deferred
Inflows of Resources
Proportionate Share of
Plan Pension Expense
Net Amortization of
Deferred Amounts
from Changes in
Proportion Total Pension Expense*
1000 State Agencies 4,026,252,725$ 133,206,036$ 858,702,956$ 795,418,610$ 95,778,677$ 1,883,106,279$ -$ -$ -$ -$ -$ 721,452,823$ 23,696,668 745,149,491$
2000 Lake County 6,168,369 204,077 1,315,565 1,218,611 - 2,738,253 - - - 237,587 237,587 1,105,293 (56,224) 1,049,069
2001 Clackamas County 261,491,251 8,651,273 55,769,800 51,659,700 467,092 116,547,865 - - - 8,915,730 8,915,730 46,855,877 (1,936,045) 44,919,832
2002 Curry County 13,260,198 438,705 2,828,082 2,619,659 6,157 5,892,603 - - - 359,079 359,079 2,376,057 (81,696) 2,294,361
2003 Douglas County 86,792,658 2,871,480 18,510,788 17,146,588 - 38,528,856 - - - 5,776,748 5,776,748 15,552,131 (1,352,129) 14,200,002
2004 Harney County 7,134,385 236,037 1,521,593 1,409,455 36,463 3,203,548 - - - 45,612 45,612 1,278,390 116 1,278,506
2005 Jackson County 87,997,615 2,911,346 18,767,777 17,384,637 - 39,063,760 - - - 2,424,631 2,424,631 15,768,043 (581,303) 15,186,740
2006 Jefferson County 9,655,221 319,437 2,059,227 1,907,467 - 4,286,131 - - - 128,029 128,029 1,730,092 (32,756) 1,697,336
2007 Klamath County 5,737,700 189,828 1,223,714 1,133,529 850,497 3,397,568 - - - - - 1,028,122 198,045 1,226,167
2008 Lane County 166,611,420 5,512,234 35,534,212 32,915,426 158,870 74,120,742 - - - - - 29,854,629 41,090 29,895,719
2009 Marion County 119,297,563 3,946,885 25,443,303 23,568,193 244,508 53,202,889 - - - 679,457 679,457 21,376,592 (86,099) 21,290,493
2011 Washington County 250,282,445 8,280,437 53,379,231 49,445,310 80,385 111,185,363 - - - 7,348,792 7,348,792 44,847,402 (1,685,379) 43,162,023
2012 Grant County 2,480,097 82,052 528,945 489,963 563,144 1,664,104 - - - - - 444,402 133,795 578,197
2013 Umatilla County 20,099,744 664,987 4,286,792 3,970,866 78,167 9,000,812 - - - 36,768 36,768 3,601,616 7,364 3,608,980
2014 Linn County 73,028,662 2,416,107 15,575,259 14,427,400 1,169 32,419,935 - - - 2,990,798 2,990,798 13,085,799 (695,191) 12,390,608
2015 Yamhill County 28,462,558 941,666 6,070,380 5,623,007 43,488 12,678,541 - - - 773,073 773,073 5,100,125 (166,994) 4,933,131
2016 Sherman County 4,455,912 147,421 950,339 880,301 - 1,978,061 - - - 157,426 157,426 798,442 (37,447) 760,995
2017 Columbia County 11,774,406 389,549 2,511,198 2,326,129 - 5,226,876 - - - 454,562 454,562 2,109,822 (113,634) 1,996,188
2018 Coos County 29,325,439 970,214 6,254,411 5,793,476 - 13,018,101 - - - 861,464 861,464 5,254,742 (200,935) 5,053,807
2020 Wasco County 9,892,442 327,285 2,109,820 1,954,331 - 4,391,436 - - - 879,892 879,892 1,772,599 (220,240) 1,552,359
2021 Baker County 8,746,880 289,385 1,865,499 1,728,016 2,775 3,885,675 - - - 407,861 407,861 1,567,329 (94,035) 1,473,294
2022 Gilliam County 3,862,711 127,795 823,823 763,110 17,355 1,732,083 - - - 135,449 135,449 692,148 (26,396) 665,752
2023 Morrow County Rural School District Board - - - - 2 2 - - - 618 618 - (143) (143)
2027 Deschutes County 93,391,575 3,089,801 19,918,179 18,450,257 402,174 41,860,411 - - - 1,187,133 1,187,133 16,734,572 (157,791) 16,576,781
2028 Union County - - - - - - - - - - - - - -
2035 Hood River County 7,791,691 257,783 1,661,780 1,539,311 392,824 3,851,698 - - - - - 1,396,171 95,739 1,491,910
2036 Clatsop County 18,027,647 596,433 3,844,864 3,561,507 - 8,002,804 - - - 393,609 393,609 3,230,323 (95,189) 3,135,134
2037 Polk County 26,737,435 884,591 5,702,452 5,282,195 - 11,869,238 - - - 1,904,610 1,904,610 4,791,005 (450,579) 4,340,426
2038 Multnomah County 526,780,834 17,428,212 112,349,693 104,069,791 2,285,295 236,132,991 - - - 4,369,692 4,369,692 94,392,366 (344,062) 94,048,304
2039 Malheur County 10,512,101 347,786 2,241,978 2,076,750 - 4,666,514 - - - 128,781 128,781 1,883,634 (36,435) 1,847,199
2040 Benton County 35,000,538 1,157,971 7,464,774 6,914,638 100,946 15,638,329 - - - 75,566 75,566 6,271,647 12,116 6,283,763
2042 Josephine County 27,458,289 908,440 5,856,193 5,424,606 - 12,189,239 - - - 1,196,514 1,196,514 4,920,173 (296,655) 4,623,518
2043 Lincoln County 6,857,708 226,883 1,462,584 1,354,795 152,187 3,196,449 - - - 288,064 288,064 1,228,813 (22,231) 1,206,582
2044 Crook County 2,127,997 70,403 453,851 420,403 7,273 951,930 - - - 988 988 381,310 1,401 382,711
2050 Wallowa County 237,626 7,862 50,680 46,945 29,163 134,650 - - - - - 42,579 7,649 50,228
2052 Tillamook County 15,694 519 3,347 3,100 - 6,966 - - - 1,175 1,175 2,812 (274) 2,538
2099 State Judiciary 40,770,985 1,348,882 8,695,471 8,054,636 5,866,806 23,965,795 - - - 469,939 469,939 7,305,637 1,226,157 8,531,794
2100 City of Roseburg 22,212,503 734,887 4,737,393 4,388,259 737 9,861,276 - - - 988,206 988,206 3,980,196 (229,599) 3,750,597
2101 City of Salem 146,257,527 4,838,838 31,193,216 28,894,351 - 64,926,405 - - - 1,999,404 1,999,404 26,207,472 (480,707) 25,726,765
2102 City of Medford 60,013,815 1,985,519 12,799,505 11,856,212 182,325 26,823,561 - - - 636,300 636,300 10,753,706 (94,352) 10,659,354
2103 City of Albany 52,203,413 1,727,117 11,133,734 10,313,204 199,956 23,374,011 - - - 2,039,254 2,039,254 9,354,182 (415,434) 8,938,748
2104 City of Ashland 34,849,280 1,152,966 7,432,514 6,884,756 227,037 15,697,273 - - - 1,483,453 1,483,453 6,244,544 (278,213) 5,966,331
2105 City of Astoria 11,499,655 380,459 2,452,600 2,271,849 27,857 5,132,765 - - - 604,792 604,792 2,060,591 (132,455) 1,928,136
2106 City of Beaverton 72,778,259 2,407,823 15,521,854 14,377,930 505,454 32,813,061 - - - 2,049,062 2,049,062 13,040,930 (327,863) 12,713,067
2107 City of Bend 56,716,178 1,876,419 12,096,198 11,204,737 48,477 25,225,831 - - - 85 85 10,162,811 11,249 10,174,060
2109 City of Canby 9,616,874 318,168 2,051,048 1,899,891 60,380 4,329,487 - - - 579,199 579,199 1,723,220 (116,938) 1,606,282
2110 City of Coquille 3,026,107 100,117 645,396 597,832 37,306 1,380,651 - - - 155,999 155,999 542,240 (25,306) 516,934
2111 City of Eugene 201,536,828 6,667,719 42,982,962 39,815,221 1,554,658 91,020,560 - - - 426,816 426,816 36,112,813 236,014 36,348,827
2112 City Of Forest Grove 11,511 381 2,455 2,274 18 5,128 - - - 1,265 1,265 2,063 (288) 1,775
2113 City of Grants Pass 27,112,367 896,996 5,782,416 5,356,266 - 12,035,678 - - - 1,538,040 1,538,040 4,858,188 (361,615) 4,496,573
2114 City of Gresham 77,701,855 2,570,717 16,571,939 15,350,626 814,773 35,308,055 - - - 12,344 12,344 13,923,175 236,768 14,159,943
2115 City of Hillsboro 86,612,324 2,865,514 18,472,327 17,110,961 - 38,448,802 - - - 2,667,712 2,667,712 15,519,817 (631,223) 14,888,594
2117 City of McMinnville 34,394,295 1,137,914 7,335,477 6,794,870 88,809 15,357,070 - - - 1,557,564 1,557,564 6,163,016 (336,104) 5,826,912
2118 City of Ontario 10,905,056 360,787 2,325,786 2,154,381 - 4,840,954 - - - 808,914 808,914 1,954,046 (190,107) 1,763,939
2119 City of Oregon City 20,523,344 679,002 4,377,136 4,054,552 130,958 9,241,648 - - - 201,276 201,276 3,677,520 (8,291) 3,669,229
2120 City of Lake Oswego 53,184,560 1,759,578 11,342,989 10,507,038 - 23,609,605 - - - 2,610,385 2,610,385 9,529,991 (611,897) 8,918,094
2121 City of Portland 567,965,517 18,790,781 121,133,397 112,206,156 2,156,015 254,286,349 - - - - - 101,772,133 624,886 102,397,019
2122 City of Redmond 16,573,183 548,313 3,534,662 3,274,166 153,435 7,510,576 - - - - - 2,969,702 40,403 3,010,105
2123 City of St Helens 8,459,661 279,883 1,804,242 1,671,274 - 3,755,399 - - - 455,157 455,157 1,515,863 (107,233) 1,408,630
2125 City of Vernonia 731,028 24,186 155,911 144,420 - 324,517 - - - 71,200 71,200 130,991 (17,766) 113,225
2126 City of West Linn 14,941,668 494,336 3,186,699 2,951,847 - 6,632,882 - - - 600,436 600,436 2,677,355 (153,296) 2,524,059
2127 City of Cottage Grove 8,789,141 290,783 1,874,513 1,736,365 71,018 3,972,679 - - - - - 1,574,901 19,729 1,594,630
2128 City of Tillamook 3,331,662 110,226 710,563 658,197 51,889 1,530,875 - - - 199,736 199,736 596,991 (31,188) 565,803
Pension Expense
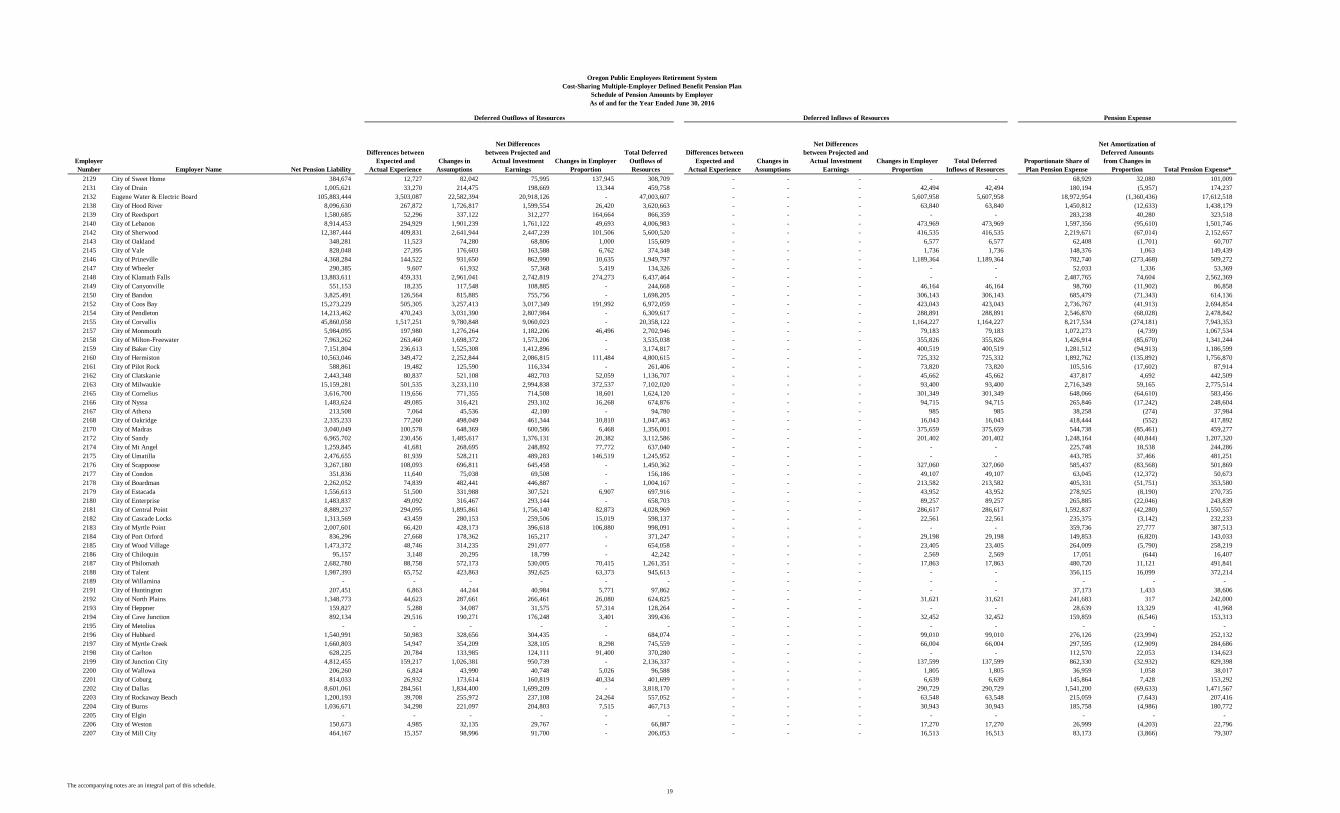
Oregon Public Employees Retirement System
Cost-Sharing Multiple-Employer Defined Benefit Pension Plan
Schedule of Pension Amounts by Employer
As of and for the Year Ended June 30, 2016
Deferred Outflows of Resources Deferred Inflows of Resources
The accompanying notes are an integral part of this schedule.18
Employer
Number Employer Name Net Pension Liability
Differences between
Expected and
Actual Experience
Changes in
Assumptions
Net Differences
between Projected and
Actual Investment
Earnings
Changes in Employer
Proportion
Total Deferred
Outflows of
Resources
Differences between
Expected and
Actual Experience
Changes in
Assumptions
Net Differences
between Projected and
Actual Investment
Earnings
Changes in Employer
Proportion
Total Deferred
Inflows of Resources
Proportionate Share of
Plan Pension Expense
Net Amortization of
Deferred Amounts
from Changes in
Proportion Total Pension Expense*
Pension Expense
Oregon Public Employees Retirement System
Cost-Sharing Multiple-Employer Defined Benefit Pension Plan
Schedule of Pension Amounts by Employer
As of and for the Year Ended June 30, 2016
Deferred Outflows of Resources Deferred Inflows of Resources
2129 City of Sweet Home 384,674 12,727 82,042 75,995 137,945 308,709 - - - - - 68,929 32,080 101,009
2131 City of Drain 1,005,621 33,270 214,475 198,669 13,344 459,758 - - - 42,494 42,494 180,194 (5,957) 174,237
2132 Eugene Water & Electric Board 105,883,444 3,503,087 22,582,394 20,918,126 - 47,003,607 - - - 5,607,958 5,607,958 18,972,954 (1,360,436) 17,612,518
2138 City of Hood River 8,096,630 267,872 1,726,817 1,599,554 26,420 3,620,663 - - - 63,840 63,840 1,450,812 (12,633) 1,438,179
2139 City of Reedsport 1,580,685 52,296 337,122 312,277 164,664 866,359 - - - - - 283,238 40,280 323,518
2140 City of Lebanon 8,914,453 294,929 1,901,239 1,761,122 49,693 4,006,983 - - - 473,969 473,969 1,597,356 (95,610) 1,501,746
2142 City of Sherwood 12,387,444 409,831 2,641,944 2,447,239 101,506 5,600,520 - - - 416,535 416,535 2,219,671 (67,014) 2,152,657
2143 City of Oakland 348,281 11,523 74,280 68,806 1,000 155,609 - - - 6,577 6,577 62,408 (1,701) 60,707
2145 City of Vale 828,048 27,395 176,603 163,588 6,762 374,348 - - - 1,736 1,736 148,376 1,063 149,439
2146 City of Prineville 4,368,284 144,522 931,650 862,990 10,635 1,949,797 - - - 1,189,364 1,189,364 782,740 (273,468) 509,272
2147 City of Wheeler 290,385 9,607 61,932 57,368 5,419 134,326 - - - - - 52,033 1,336 53,369
2148 City of Klamath Falls 13,883,611 459,331 2,961,041 2,742,819 274,273 6,437,464 - - - - - 2,487,765 74,604 2,562,369
2149 City of Canyonville 551,153 18,235 117,548 108,885 - 244,668 - - - 46,164 46,164 98,760 (11,902) 86,858
2150 City of Bandon 3,825,491 126,564 815,885 755,756 - 1,698,205 - - - 306,143 306,143 685,479 (71,343) 614,136
2152 City of Coos Bay 15,273,229 505,305 3,257,413 3,017,349 191,992 6,972,059 - - - 423,043 423,043 2,736,767 (41,913) 2,694,854
2154 City of Pendleton 14,213,462 470,243 3,031,390 2,807,984 - 6,309,617 - - - 288,891 288,891 2,546,870 (68,028) 2,478,842
2155 City of Corvallis 45,860,058 1,517,251 9,780,848 9,060,023 - 20,358,122 - - - 1,164,227 1,164,227 8,217,534 (274,181) 7,943,353
2157 City of Monmouth 5,984,095 197,980 1,276,264 1,182,206 46,496 2,702,946 - - - 79,183 79,183 1,072,273 (4,739) 1,067,534
2158 City of Milton-Freewater 7,963,262 263,460 1,698,372 1,573,206 - 3,535,038 - - - 355,826 355,826 1,426,914 (85,670) 1,341,244
2159 City of Baker City 7,151,804 236,613 1,525,308 1,412,896 - 3,174,817 - - - 400,519 400,519 1,281,512 (94,913) 1,186,599
2160 City of Hermiston 10,563,046 349,472 2,252,844 2,086,815 111,484 4,800,615 - - - 725,332 725,332 1,892,762 (135,892) 1,756,870
2161 City of Pilot Rock 588,861 19,482 125,590 116,334 - 261,406 - - - 73,820 73,820 105,516 (17,602) 87,914
2162 City of Clatskanie 2,443,348 80,837 521,108 482,703 52,059 1,136,707 - - - 45,662 45,662 437,817 4,692 442,509
2163 City of Milwaukie 15,159,281 501,535 3,233,110 2,994,838 372,537 7,102,020 - - - 93,400 93,400 2,716,349 59,165 2,775,514
2165 City of Cornelius 3,616,700 119,656 771,355 714,508 18,601 1,624,120 - - - 301,349 301,349 648,066 (64,610) 583,456
2166 City of Nyssa 1,483,624 49,085 316,421 293,102 16,268 674,876 - - - 94,715 94,715 265,846 (17,242) 248,604
2167 City of Athena 213,508 7,064 45,536 42,180 - 94,780 - - - 985 985 38,258 (274) 37,984
2168 City of Oakridge 2,335,233 77,260 498,049 461,344 10,810 1,047,463 - - - 16,043 16,043 418,444 (552) 417,892
2170 City of Madras 3,040,049 100,578 648,369 600,586 6,468 1,356,001 - - - 375,659 375,659 544,738 (85,461) 459,277
2172 City of Sandy 6,965,702 230,456 1,485,617 1,376,131 20,382 3,112,586 - - - 201,402 201,402 1,248,164 (40,844) 1,207,320
2174 City of Mt Angel 1,259,845 41,681 268,695 248,892 77,772 637,040 - - - - - 225,748 18,538 244,286
2175 City of Umatilla 2,476,655 81,939 528,211 489,283 146,519 1,245,952 - - - - - 443,785 37,466 481,251
2176 City of Scappoose 3,267,180 108,093 696,811 645,458 - 1,450,362 - - - 327,060 327,060 585,437 (83,568) 501,869
2177 City of Condon 351,836 11,640 75,038 69,508 - 156,186 - - - 49,107 49,107 63,045 (12,372) 50,673
2178 City of Boardman 2,262,052 74,839 482,441 446,887 - 1,004,167 - - - 213,582 213,582 405,331 (51,751) 353,580
2179 City of Estacada 1,556,613 51,500 331,988 307,521 6,907 697,916 - - - 43,952 43,952 278,925 (8,190) 270,735
2180 City of Enterprise 1,483,837 49,092 316,467 293,144 - 658,703 - - - 89,257 89,257 265,885 (22,046) 243,839
2181 City of Central Point 8,889,237 294,095 1,895,861 1,756,140 82,873 4,028,969 - - - 286,617 286,617 1,592,837 (42,280) 1,550,557
2182 City of Cascade Locks 1,313,569 43,459 280,153 259,506 15,019 598,137 - - - 22,561 22,561 235,375 (3,142) 232,233
2183 City of Myrtle Point 2,007,601 66,420 428,173 396,618 106,880 998,091 - - - - - 359,736 27,777 387,513
2184 City of Port Orford 836,296 27,668 178,362 165,217 - 371,247 - - - 29,198 29,198 149,853 (6,820) 143,033
2185 City of Wood Village 1,473,372 48,746 314,235 291,077 - 654,058 - - - 23,405 23,405 264,009 (5,790) 258,219
2186 City of Chiloquin 95,157 3,148 20,295 18,799 - 42,242 - - - 2,569 2,569 17,051 (644) 16,407
2187 City of Philomath 2,682,780 88,758 572,173 530,005 70,415 1,261,351 - - - 17,863 17,863 480,720 11,121 491,841
2188 City of Talent 1,987,393 65,752 423,863 392,625 63,373 945,613 - - - - - 356,115 16,099 372,214
2189 City of Willamina - - - - - - - - - - - - - -
2191 City of Huntington 207,451 6,863 44,244 40,984 5,771 97,862 - - - - - 37,173 1,433 38,606
2192 City of North Plains 1,348,773 44,623 287,661 266,461 26,080 624,825 - - - 31,621 31,621 241,683 317 242,000
2193 City of Heppner 159,827 5,288 34,087 31,575 57,314 128,264 - - - - - 28,639 13,329 41,968
2194 City of Cave Junction 892,134 29,516 190,271 176,248 3,401 399,436 - - - 32,452 32,452 159,859 (6,546) 153,313
2195 City of Metolius - - - - - - - - - - - - - -
2196 City of Hubbard 1,540,991 50,983 328,656 304,435 - 684,074 - - - 99,010 99,010 276,126 (23,994) 252,132
2197 City of Myrtle Creek 1,660,803 54,947 354,209 328,105 8,298 745,559 - - - 66,004 66,004 297,595 (12,909) 284,686
2198 City of Carlton 628,225 20,784 133,985 124,111 91,400 370,280 - - - - - 112,570 22,053 134,623
2199 City of Junction City 4,812,455 159,217 1,026,381 950,739 - 2,136,337 - - - 137,599 137,599 862,330 (32,932) 829,398
2200 City of Wallowa 206,260 6,824 43,990 40,748 5,026 96,588 - - - 1,805 1,805 36,959 1,058 38,017
2201 City of Coburg 814,033 26,932 173,614 160,819 40,334 401,699 - - - 6,639 6,639 145,864 7,428 153,292
2202 City of Dallas 8,601,061 284,561 1,834,400 1,699,209 - 3,818,170 - - - 290,729 290,729 1,541,200 (69,633) 1,471,567
2203 City of Rockaway Beach 1,200,193 39,708 255,972 237,108 24,264 557,052 - - - 63,548 63,548 215,059 (7,643) 207,416
2204 City of Burns 1,036,671 34,298 221,097 204,803 7,515 467,713 - - - 30,943 30,943 185,758 (4,986) 180,772
2205 City of Elgin - - - - - - - - - - - - - -
2206 City of Weston 150,673 4,985 32,135 29,767 - 66,887 - - - 17,270 17,270 26,999 (4,203) 22,796
2207 City of Mill City 464,167 15,357 98,996 91,700 - 206,053 - - - 16,513 16,513 83,173 (3,866) 79,307
The accompanying notes are an integral part of this schedule.19

Employer
Number Employer Name Net Pension Liability
Differences between
Expected and
Actual Experience
Changes in
Assumptions
Net Differences
between Projected and
Actual Investment
Earnings
Changes in Employer
Proportion
Total Deferred
Outflows of
Resources
Differences between
Expected and
Actual Experience
Changes in
Assumptions
Net Differences
between Projected and
Actual Investment
Earnings
Changes in Employer
Proportion
Total Deferred
Inflows of Resources
Proportionate Share of
Plan Pension Expense
Net Amortization of
Deferred Amounts
from Changes in
Proportion Total Pension Expense*
Pension Expense
Oregon Public Employees Retirement System
Cost-Sharing Multiple-Employer Defined Benefit Pension Plan
Schedule of Pension Amounts by Employer
As of and for the Year Ended June 30, 2016
Deferred Outflows of Resources Deferred Inflows of Resources
2208 City of Fairview 5,074,018 167,871 1,082,166 1,002,413 80,286 2,332,736 - - - 9,737 9,737 909,199 15,807 925,006
2209 City of Monroe - - - - - - - - - - - - - -
2210 City of Helix 28,249 935 6,025 5,581 - 12,541 - - - 532 532 5,062 (139) 4,923
2211 City of Jefferson - - - - - - - - - - - - - -
2212 Town of Lakeview 1,444,651 47,795 308,109 285,402 61,289 702,595 - - - - - 258,863 14,646 273,509
2213 City of Stanfield - - - - - - - - - - - - - -
2214 City of Yamhill 587,554 19,439 125,311 116,076 28,716 289,542 - - - 14,237 14,237 105,282 2,491 107,773
2215 City of Powers - - - - - - - - - - - - - -
2216 City of Brookings 5,697,134 188,486 1,215,062 1,125,515 9,454 2,538,517 - - - 36,144 36,144 1,020,853 (5,626) 1,015,227
2217 City of Sutherlin 2,930,363 96,949 624,976 578,917 49,448 1,350,290 - - - 65,384 65,384 525,083 (661) 524,422
2218 City of Prairie City 290,205 9,601 61,894 57,332 35,094 163,921 - - - - - 52,001 8,670 60,671
2219 City of Sheridan 1,128,865 37,348 240,760 223,016 - 501,124 - - - 38,403 38,403 202,278 (9,811) 192,467
2220 City of Garibaldi 788,278 26,080 168,121 155,731 51,564 401,496 - - - - - 141,249 13,290 154,539
2221 City of Sisters 1,259,220 41,661 268,561 248,769 4,588 563,579 - - - 4,440 4,440 225,636 (239) 225,397
2222 City of Jacksonville 1,525,109 50,457 325,269 301,298 29,074 706,098 - - - 22,909 22,909 273,280 24 273,304
2223 City of Cannon Beach 3,152,226 104,289 672,294 622,748 39,891 1,439,222 - - - 114,559 114,559 564,838 (14,909) 549,929
2224 City of Falls City 356,784 11,804 76,094 70,486 16,997 175,381 - - - - - 63,931 4,049 67,980
2225 City of Echo 401,105 13,270 85,546 79,242 7,743 185,801 - - - 15,838 15,838 71,873 (1,406) 70,467
2226 City of Hines 852,821 28,215 181,886 168,482 19,188 397,771 - - - - - 152,815 5,087 157,902
2227 Town Of Bonanza - - - - - - - - - - - - - -
2228 City of Turner 758,008 25,078 161,665 149,751 8,913 345,407 - - - 3,955 3,955 135,825 910 136,735
2229 City of John Day 1,009,128 33,386 215,223 199,361 - 447,970 - - - 12,753 12,753 180,823 (3,739) 177,084
2231 City of Banks 463,992 15,351 98,958 91,665 44,266 250,240 - - - - - 83,141 11,168 94,309
2232 City of Joseph 321,819 10,647 68,636 63,578 3,372 146,233 - - - 2,664 2,664 57,666 1 57,667
2233 City of Lafayette 656,918 21,734 140,105 129,779 8,924 300,542 - - - 79,598 79,598 117,711 (15,887) 101,824
2234 City of Aumsville 1,418,373 46,926 302,505 280,211 235,127 864,769 - - - 51,246 51,246 254,154 39,609 293,763
2235 City of Amity 582,280 19,264 124,186 115,034 3,579 262,063 - - - 42,266 42,266 104,337 (8,776) 95,561
2236 City of Creswell 1,205,977 39,899 257,206 238,251 78,319 613,675 - - - 29,063 29,063 216,096 9,666 225,762
2237 City of Troutdale 7,989,157 264,316 1,703,895 1,578,322 57,657 3,604,190 - - - 277,838 277,838 1,431,554 (47,656) 1,383,898
2238 City of Warrenton 5,015,196 165,925 1,069,621 990,792 62,950 2,289,288 - - - 95,499 95,499 898,659 (3,694) 894,965
2240 City of Wilsonville 16,754,659 554,317 3,573,366 3,310,018 160,003 7,597,704 - - - 777,240 777,240 3,002,220 (133,694) 2,868,526
2241 City of Bay City 477,242 15,789 101,784 94,283 7,932 219,788 - - - 4,293 4,293 85,516 582 86,098
2242 City of Gaston - - - - - - - - - - - - - -
2243 City Of Brownsville 892,598 29,531 190,370 176,340 1,104 397,345 - - - 89,081 89,081 159,942 (20,392) 139,550
2244 City of Lakeside 487,762 16,137 104,028 96,361 46,874 263,400 - - - - - 87,401 12,429 99,830
2245 City of Dundee 1,022,928 33,843 218,166 202,088 18,015 472,112 - - - 5,439 5,439 183,296 2,590 185,886
2246 City of Merrill 84,087 2,782 17,934 16,612 26,744 64,072 - - - - - 15,067 6,247 21,314
2247 City of Malin 172,939 5,722 36,884 34,165 - 76,771 - - - 15,537 15,537 30,988 (4,094) 26,894
2248 City of Fossil 122,720 4,060 26,173 24,244 - 54,477 - - - 7,781 7,781 21,990 (1,846) 20,144
2249 City of Phoenix 1,674,829 55,411 357,201 330,876 149,854 893,342 - - - - - 300,108 35,281 335,389
2250 City of Gold Beach 764,360 25,288 163,020 151,005 - 339,313 - - - 101,815 101,815 136,963 (23,711) 113,252
2251 City of Rogue River 1,193,487 39,486 254,542 235,783 - 529,811 - - - 136,733 136,733 213,858 (32,092) 181,766
2252 City of Dayton 521,947 17,268 111,319 103,115 59,019 290,721 - - - - - 93,526 14,758 108,284
2253 Town of Butte Falls 37,089 1,227 7,910 7,327 1,109 17,573 - - - 15,333 15,333 6,646 (3,240) 3,406
2254 City of Shady Cove 63,531 2,102 13,550 12,551 22,782 50,985 - - - 10,555 10,555 11,384 2,194 13,578
2255 Town of Canyon City 246,196 8,145 52,508 48,638 22,531 131,822 - - - 10,039 10,039 44,115 2,287 46,402
2256 City of Jordan Valley - - - - - - - - - - - - - -
2257 City of Culver 277,320 9,175 59,146 54,787 1,707 124,815 - - - 1,400 1,400 49,692 176 49,868
2258 City of Adair Village 494,778 16,369 105,524 97,747 31,556 251,196 - - - 16,566 16,566 88,658 2,467 91,125
2259 Town Of Hammond - - - - - - - - - - - - - -
2260 City of Riddle 431,531 14,277 92,035 85,252 1,408 192,972 - - - 29,794 29,794 77,325 (6,515) 70,810
2261 City of Waldport 304,346 10,069 64,910 60,126 - 135,105 - - - 51,538 51,538 54,535 (12,390) 42,145
2262 City of Dufur 177,995 5,889 37,962 35,164 - 79,015 - - - 10,627 10,627 31,894 (2,551) 29,343
2263 City of La Grande 4,476,457 148,101 954,721 884,360 25,556 2,012,738 - - - 30,703 30,703 802,124 377 802,501
2264 City of Gervais 699,811 23,153 149,253 138,253 16,716 327,375 - - - 20,229 20,229 125,397 (2,062) 123,335
2265 City of Westfir 47,655 1,577 10,164 9,415 4,882 26,038 - - - - - 8,539 1,145 9,684
2266 City of Irrigon 812,006 26,865 173,181 160,418 2,058 362,522 - - - - - 145,501 518 146,019
2267 City of Independence 4,705,034 155,663 1,003,471 929,517 167,997 2,256,648 - - - - - 843,082 40,636 883,718
2268 City of Harrisburg 972,419 32,172 207,394 192,109 - 431,675 - - - 141,492 141,492 174,245 (33,388) 140,857
2269 City of Durham 120,986 4,003 25,803 23,902 18,628 72,336 - - - 9,689 9,689 21,679 1,482 23,161
2270 City of Lyons 121,499 4,020 25,913 24,003 - 53,936 - - - 30,057 30,057 21,771 (7,022) 14,749
2271 City of Columbia City 886,442 29,327 189,057 175,124 15,362 408,870 - - - 120,614 120,614 158,839 (23,531) 135,308
2272 City of Aurora 154,020 5,096 32,849 30,428 55,232 123,605 - - - 27,348 27,348 27,598 4,801 32,399
The accompanying notes are an integral part of this schedule.20

Employer
Number Employer Name Net Pension Liability
Differences between
Expected and
Actual Experience
Changes in
Assumptions
Net Differences
between Projected and
Actual Investment
Earnings
Changes in Employer
Proportion
Total Deferred
Outflows of
Resources
Differences between
Expected and
Actual Experience
Changes in
Assumptions
Net Differences
between Projected and
Actual Investment
Earnings
Changes in Employer
Proportion
Total Deferred
Inflows of Resources
Proportionate Share of
Plan Pension Expense
Net Amortization of
Deferred Amounts
from Changes in
Proportion Total Pension Expense*
Pension Expense
Oregon Public Employees Retirement System
Cost-Sharing Multiple-Employer Defined Benefit Pension Plan
Schedule of Pension Amounts by Employer
As of and for the Year Ended June 30, 2016
Deferred Outflows of Resources Deferred Inflows of Resources
2273 City of Silverton 5,247,790 173,620 1,119,227 1,036,743 17,916 2,347,506 - - - 133,259 133,259 940,337 (25,721) 914,616
2274 City of Gold Hill 228,277 7,552 48,686 45,098 29,084 130,420 - - - 2,915 2,915 40,904 5,907 46,811
2275 City of Toledo 2,624,927 86,844 559,834 518,575 12,189 1,177,442 - - - 17,239 17,239 470,353 (424) 469,929
2276 City of Newport 4,469,447 147,869 953,226 882,975 100,284 2,084,354 - - - - - 800,868 26,468 827,336
2277 City Of Rajneeshpuram - - - - - - - - - - - - - -
2278 City of Springfield 43,443,622 1,437,305 9,265,481 8,582,637 381,216 19,666,639 - - - 1,048,596 1,048,596 7,784,540 (131,737) 7,652,803
2279 City of Keizer 9,287,987 307,287 1,980,904 1,834,917 167,587 4,290,695 - - - - - 1,664,288 39,570 1,703,858
2280 City of Winston 1,802,450 59,633 384,419 356,088 30,592 830,732 - - - 2,311 2,311 322,976 8,461 331,437
2281 City of Manzanita 1,309,709 43,331 279,330 258,744 12,378 593,783 - - - - - 234,683 3,255 237,938
2282 City of Eagle Point 1,666,138 55,123 355,347 329,159 - 739,629 - - - 5,575 5,575 298,551 (1,576) 296,975
2283 City of Maupin 208,045 6,883 44,371 41,101 2,148 94,503 - - - 2,831 2,831 37,279 (332) 36,947
2284 City of Halsey 292,287 9,670 62,338 57,744 70,065 199,817 - - - 15,243 15,243 52,374 11,810 64,184
2285 City of Veneta 1,449,719 47,963 309,190 286,404 26,337 669,894 - - - 51,584 51,584 259,771 (4,250) 255,521
2286 City of Millersburg 419,402 13,876 89,448 82,856 6,623 192,803 - - - 20,142 20,142 75,151 (2,736) 72,415
2287 City of King City 658,717 21,793 140,488 130,135 7,405 299,821 - - - 11,723 11,723 118,034 (548) 117,486
2288 City of Tualatin 20,995,178 694,612 4,477,767 4,147,766 - 9,320,145 - - - 814,581 814,581 3,762,066 (191,247) 3,570,819
2289 City Of St Paul - - - - - - - - - - - - - -
2290 City of Molalla 2,480,729 82,073 529,080 490,088 21,469 1,122,710 - - - 2,352 2,352 444,515 5,767 450,282
2291 City of Florence 3,805,852 125,914 811,697 751,877 46,654 1,736,142 - - - 105,116 105,116 681,960 (10,724) 671,236
2292 City of North Bend 7,017,678 232,175 1,496,702 1,386,399 - 3,115,276 - - - 137,172 137,172 1,257,478 (33,745) 1,223,733
2293 City of Lowell 70,157 2,321 14,963 13,860 1,489 32,633 - - - 116,863 116,863 12,571 (26,740) (14,169)
2294 City of Depoe Bay 1,256,699 41,577 268,024 248,271 - 557,872 - - - 16,081 16,081 225,184 (4,154) 221,030
2295 City of Tigard 11,216,998 371,107 2,392,316 2,216,008 99,051 5,078,482 - - - 364,425 364,425 2,009,942 (55,617) 1,954,325
2296 City of Happy Valley 4,543,686 150,325 969,059 897,642 54,620 2,071,646 - - - 9,082 9,082 814,170 13,953 828,123
2297 City of Rainier 1,209,613 40,019 257,981 238,969 45,078 582,047 - - - 37,520 37,520 216,747 (553) 216,194
2298 City of Lincoln City 11,648,032 385,368 2,484,245 2,301,162 120,147 5,290,922 - - - 439,574 439,574 2,087,178 (66,889) 2,020,289
2299 City of Dunes City 72,134 2,387 15,384 14,251 551 32,573 - - - 3,469 3,469 12,926 (645) 12,281
2300 City of Yachats 916,469 30,321 195,461 181,056 1,682 408,520 - - - 1,976 1,976 164,220 34 164,254
2301 City of Moro 146,537 4,848 31,253 28,950 11,626 76,677 - - - - - 26,258 2,842 29,100
2302 City of Mt. Vernon 216,664 7,168 46,209 42,804 8,688 104,869 - - - - - 38,823 2,157 40,980
2303 City of Woodburn 16,230,093 536,962 3,461,489 3,206,385 104,763 7,309,599 - - - 768,377 768,377 2,908,224 (147,880) 2,760,344
2304 City of Gladstone 5,602,675 185,361 1,194,916 1,106,854 253,151 2,740,282 - - - - - 1,003,927 60,890 1,064,817
2305 City of Elkton 49,631 1,642 10,585 9,805 - 22,032 - - - 27,199 27,199 8,893 (6,342) 2,551
2306 City of Imbler - - - - - - - - - - - - - -
2307 City of Yoncalla 267,335 8,845 57,016 52,814 5,729 124,404 - - - 22,078 22,078 47,903 (3,449) 44,454
2308 City of North Powder 106,876 3,536 22,794 21,114 1,661 49,105 - - - 1,763 1,763 19,151 79 19,230
2309 City of Gearhart 764,061 25,278 162,956 150,946 - 339,180 - - - 16,026 16,026 136,910 (3,943) 132,967
2501 Port of The Dalles 139,637 4,620 29,781 27,586 11,365 73,352 - - - 344 344 25,021 3,262 28,283
2504 Oak Lodge Water District 2,005,038 66,335 427,626 396,111 - 890,072 - - - 91,101 91,101 359,277 (21,272) 338,005
2507 Port of Astoria 1,578,471 52,223 336,650 311,840 - 700,713 - - - 37,365 37,365 282,842 (9,879) 272,963
2508 Multnomah Drainage 2,243,652 74,230 478,517 443,251 94,035 1,090,033 - - - - - 402,034 23,325 425,359
2510 Horsefly Irrigation District 122,516 4,053 26,130 24,204 33,297 87,684 - - - 6,536 6,536 21,953 5,822 27,775
2511 Grants Pass Irrigation District 854,657 28,276 182,278 168,844 - 379,398 - - - 46,100 46,100 153,144 (10,987) 142,157
2512 Port of Portland 103,193,124 3,414,080 22,008,614 20,386,632 3,216,269 49,025,595 - - - 111,129 111,129 18,490,884 715,284 19,206,168
2513 Port of Coos Bay 2,212,496 73,199 471,872 437,096 - 982,167 - - - 125,963 125,963 396,451 (29,474) 366,977
2515 Klamath County Fire District 1 14,919,047 493,587 3,181,874 2,947,378 - 6,622,839 - - - 683,486 683,486 2,673,302 (169,736) 2,503,566
2518 Clackamas County Housing Authority 4,224,032 139,749 900,885 834,492 18,267 1,893,393 - - - 109,535 109,535 756,892 (20,101) 736,791
2519 Portland Housing Authority 23,852,957 789,160 5,087,262 4,712,343 195,260 10,784,025 - - - 79,330 79,330 4,274,144 22,077 4,296,221
2521 League of Oregon Cities 8,933,154 295,548 1,905,227 1,764,816 - 3,965,591 - - - 390,207 390,207 1,600,707 (91,131) 1,509,576
2522 Lane Council of Governments 18,408,381 609,030 3,926,065 3,636,724 594,500 8,766,319 - - - 202,079 202,079 3,298,546 78,821 3,377,367
2524 Oak Lodge Sanitary District 3,165,958 104,744 675,223 625,460 - 1,405,427 - - - 121,940 121,940 567,299 (29,182) 538,117
2526 Clatskanie PUD 5,937,351 196,434 1,266,294 1,172,971 - 2,635,699 - - - 255,665 255,665 1,063,897 (65,022) 998,875
2527 Deschutes Valley Water District 3,597,665 119,026 767,296 710,748 - 1,597,070 - - - 216,662 216,662 644,655 (50,400) 594,255
2528 Columbia River Fire & Rescue 7,084,126 234,374 1,510,874 1,399,526 47,050 3,191,824 - - - 95,758 95,758 1,269,384 (8,431) 1,260,953
2529 East Fork Irrigation District 206,984 6,848 44,145 40,891 667 92,551 - - - 6,199 6,199 37,089 (1,246) 35,843
2530 River Road Water District 570,782 18,884 121,734 112,763 - 253,381 - - - 46,928 46,928 102,277 (10,971) 91,306
2531 Oregon School Boards Association 5,605,589 185,457 1,195,537 1,107,429 46,455 2,534,878 - - - 163,303 163,303 1,004,450 (24,315) 980,135
2533 Owyhee Irrigation District 3,013,131 99,688 642,628 595,268 - 1,337,584 - - - 332,126 332,126 539,914 (79,025) 460,889
2535 Athena Cemetery Maintenance District 1 - - - - - - - - - - - - - -
2536 Valley View Cemetery - - - - - - - - - - - - - -
2538 Clackamas Vector Control 637,075 21,077 135,873 125,859 1,730 284,539 - - - 2,281 2,281 114,156 (22) 114,134
2540 West Extension Irrigation District 450,102 14,891 95,996 88,921 2,057 201,865 - - - 17,406 17,406 80,653 (3,443) 77,210
2541 Jackson County Vector Control District 109,025 3,607 23,253 21,539 13,444 61,843 - - - 109,790 109,790 19,536 (21,579) (2,043)
The accompanying notes are an integral part of this schedule.21

Employer
Number Employer Name Net Pension Liability
Differences between
Expected and
Actual Experience
Changes in
Assumptions
Net Differences
between Projected and
Actual Investment
Earnings
Changes in Employer
Proportion
Total Deferred
Outflows of
Resources
Differences between
Expected and
Actual Experience
Changes in
Assumptions
Net Differences
between Projected and
Actual Investment
Earnings
Changes in Employer
Proportion
Total Deferred
Inflows of Resources
Proportionate Share of
Plan Pension Expense
Net Amortization of
Deferred Amounts
from Changes in
Proportion Total Pension Expense*
Pension Expense
Oregon Public Employees Retirement System
Cost-Sharing Multiple-Employer Defined Benefit Pension Plan
Schedule of Pension Amounts by Employer
As of and for the Year Ended June 30, 2016
Deferred Outflows of Resources Deferred Inflows of Resources
2542 Rainbow Water District 911,928 30,171 194,492 180,159 4,153 408,975 - - - 55,337 55,337 163,406 (11,647) 151,759
2544 Santa Clara Rural Fire Protection District 505,867 16,736 107,889 99,938 24,056 248,619 - - - 23,166 23,166 90,645 1,689 92,334
2545 Council of Governments 12,490,006 413,224 2,663,818 2,467,501 120,005 5,664,548 - - - 69,976 69,976 2,238,049 19,022 2,257,071
2547 Metzger Water District - - - - - - - - - - - - - -
2549 Rogue River Fire District 1,557,908 51,542 332,264 307,777 34,415 725,998 - - - 56,478 56,478 279,157 (3,012) 276,145
2550 Nyssa Road Assessment District 2 609,200 20,155 129,928 120,352 - 270,435 - - - 65,171 65,171 109,161 (15,539) 93,622
2551 Sandy Fire Department 1,696,490 56,127 361,821 335,155 - 753,103 - - - 99,920 99,920 303,989 (26,791) 277,198
2552 Winston-Dillard Fire District 1,843,037 60,976 393,076 364,107 7,693 825,852 - - - 263,476 263,476 330,249 (59,011) 271,238
2553 Tangent Rural Fire Protection District 377,078 12,475 80,422 74,495 2,185 169,577 - - - 11,418 11,418 67,568 (2,013) 65,555
2555 Monroe Fire Department 100,143 3,313 21,358 19,784 963 45,418 - - - 412 412 17,944 187 18,131
2556 Jackson County Fire District 5 5,893,369 194,978 1,256,914 1,164,282 - 2,616,174 - - - 316,550 316,550 1,056,016 (74,725) 981,291
2557 Estacada Fire Department 976,996 32,323 208,370 193,013 134,742 568,448 - - - - - 175,065 34,618 209,683
2558 Boring Fire Department - - - - 22,244 22,244 - - - 1,316,856 1,316,856 - (299,702) (299,702)
2559 Keizer Fire Department 4,198,465 138,904 895,432 829,440 65,486 1,929,262 - - - 189,297 189,297 752,311 (24,763) 727,548
2561 Jefferson Rural Fire Protection District 463,019 15,319 98,751 91,473 10,377 215,920 - - - 22,372 22,372 82,967 (2,151) 80,816
2562 Odell Rural Fire Protection District 82,718 2,737 17,642 16,342 3,011 39,732 - - - 77,588 77,588 14,822 (17,158) (2,336)
2563 Central Oregon Irrigation District 3,044,242 100,717 649,264 601,415 8,481 1,359,877 - - - 40,992 40,992 545,489 (7,038) 538,451
2564 Illinois Valley Fire District 634,200 20,982 135,260 125,291 98,440 379,973 - - - - - 113,641 25,130 138,771
2567 Charleston Rural Fire Protection District 350,224 11,587 74,694 69,190 - 155,471 - - - 9,512 9,512 62,756 (2,235) 60,521
2568 Molalla Rural Fire Protection District 73 2,145,243 70,974 457,529 423,810 250,487 1,202,800 - - - 11,337 11,337 384,400 54,918 439,318
2569 Central Oregon Intergovernmental Council 4,805,368 158,983 1,024,869 949,339 - 2,133,191 - - - 252,807 252,807 861,060 (62,248) 798,812
2570 Port of St Helens 622,337 20,590 132,730 122,948 13,414 289,682 - - - 2,522 2,522 111,515 2,379 113,894
2571 Crystal Springs Water District 541,161 17,904 115,417 106,911 55,041 295,273 - - - 27,731 27,731 96,969 4,644 101,613
2572 Local Government Personnel Institute 319,471 10,570 68,136 63,114 11,978 153,798 - - - 303,076 303,076 57,245 (66,960) (9,715)
2573 Goshen Fire District 413,057 13,666 88,095 81,603 34,810 218,174 - - - 13,785 13,785 74,014 4,041 78,055
2575 Jefferson County Rural Fire Protection District 1 656,156 21,708 139,942 129,629 7,195 298,474 - - - 5,077 5,077 117,575 935 118,510
2576 Depoe Bay Rural Fire Protection District 1,034,712 34,233 220,679 204,416 81,884 541,212 - - - - - 185,407 19,200 204,607
2578 Washington County Fire District 2 3,164,991 104,712 675,016 625,269 - 1,404,997 - - - 159,237 159,237 567,126 (37,365) 529,761
2579 La Pine Rural Fire Protection District 3,694,840 122,241 788,021 729,945 2,333 1,642,540 - - - 101,678 101,678 662,068 (22,960) 639,108
2580 Marion County Fire District 1 8,586,872 284,091 1,831,374 1,696,406 - 3,811,871 - - - 594,561 594,561 1,538,657 (141,382) 1,397,275
2581 Port of Umatilla 485,799 16,072 103,609 95,973 14,332 229,986 - - - 23,291 23,291 87,049 (1,202) 85,847
2582 Talent Irrigation District 1,065,060 35,237 227,152 210,411 - 472,800 - - - 84,568 84,568 190,845 (19,721) 171,124
2585 Rogue River Valley Irrigation District 567,373 18,771 121,007 112,089 13,811 265,678 - - - 7,733 7,733 101,666 938 102,604
2587 Tualatin Valley Irrigation District 324,718 10,743 69,255 64,151 7,424 151,573 - - - 51,834 51,834 58,185 (9,871) 48,314
2588 Clatskanie Rural Fire Protection District 1,783,742 59,014 380,429 352,392 247,509 1,039,344 - - - - - 319,624 59,334 378,958
2589 West Slope Water District 1,088,476 36,012 232,146 215,037 5,888 489,083 - - - 32,962 32,962 195,041 (5,934) 189,107
2590 Redmond Fire & Rescue 8,570,916 283,563 1,827,970 1,693,253 101,661 3,906,447 - - - 114,692 114,692 1,535,798 3,228 1,539,026
2592 Medford Irrigation District 668,640 22,122 142,605 132,095 - 296,822 - - - 45,663 45,663 119,812 (10,620) 109,192
2594 Metro 82,053,939 2,714,703 17,500,133 16,210,416 480,217 36,905,469 - - - 191,987 191,987 14,703,013 96,593 14,799,606
2595 Canby Fire District 4,336,107 143,457 924,787 856,633 12,415 1,937,292 - - - 118,060 118,060 776,975 (23,804) 753,171
2596 Bend Parks & Recreation 7,950,751 263,046 1,695,704 1,570,735 53,144 3,582,629 - - - 73,680 73,680 1,424,673 (1,505) 1,423,168
2597 Mapleton Water District 61,364 2,030 13,088 12,123 - 27,241 - - - 4,669 4,669 10,996 (1,161) 9,835
2598 Marion County Housing Authority 48,377 1,601 10,318 9,557 17,348 38,824 - - - 27,055 27,055 8,669 (3,923) 4,746
2599 South Suburban Sanitary District 1,333,590 44,121 284,423 263,461 - 592,005 - - - 48,499 48,499 238,962 (11,750) 227,212
2600 Winston-Dillard Water District 737,617 24,404 157,316 145,722 8,423 335,865 - - - 28,832 28,832 132,171 (4,227) 127,944
2601 Baker Valley Irrigation District - - - - 1,996 1,996 - - - 10,438 10,438 - (1,841) (1,841)
2602 Aumsville Rural Fire Protection District 363,794 12,036 77,588 71,870 10,512 172,006 - - - 23,004 23,004 65,187 (2,258) 62,929
2603 Corbett Water District 377,995 12,506 80,617 74,676 2,934 170,733 - - - 20,152 20,152 67,732 (3,824) 63,908
2604 Netarts-Oceanside Sanitary District 454,282 15,030 96,887 89,747 23,520 225,184 - - - - - 81,401 5,928 87,329
2605 Scio Fire District 121,032 4,004 25,813 23,911 43,402 97,130 - - - - - 21,687 10,094 31,781
2606 West Valley Housing Authority 1,136,027 37,585 242,287 224,431 4,861 509,164 - - - 265,938 265,938 203,562 (60,416) 143,146
2607 Hoodland Fire District 74 1,659,738 54,911 353,982 327,895 7,545 744,333 - - - 184,042 184,042 297,404 (40,582) 256,822
2608 Gaston Rural Fire Protection District 194,341 6,430 41,448 38,394 2,036 88,308 - - - 6,719 6,719 34,823 (963) 33,860
2610 Turner Fire District 559,838 18,522 119,400 110,601 75,751 324,274 - - - - - 100,316 17,970 118,286
2612 Community Services Consortium 6,838,375 226,243 1,458,461 1,350,976 - 3,035,680 - - - 365,387 365,387 1,225,349 (87,808) 1,137,541
2613 Polk Soil & Water Conservation District 197,820 6,545 42,190 39,081 - 87,816 - - - 27,157 27,157 35,447 (6,859) 28,588
2614 Mountain Valley Mental Health Program - - - - - - - - - - - - - -
2615 Humanities Council 154,097 5,098 32,865 30,443 - 68,406 - - - 8,931 8,931 27,612 (2,102) 25,510
2616 Alcohol Safety Action Program - - - - - - - - - - - - - -
2617 Clean Water Services 38,730,244 1,281,366 8,260,230 7,651,471 62,914 17,255,981 - - - 179,397 179,397 6,939,963 (23,216) 6,916,747
2618 Estacada Cemetery District - - - - - - - - - - - - - -
2619 Comprehensive Options For Drug Abusers - - - - - - - - - - - - - -
2620 Jackson County Fire District 4 679,013 22,465 144,817 134,145 - 301,427 - - - 54,121 54,121 121,670 (13,287) 108,383
The accompanying notes are an integral part of this schedule.22

Employer
Number Employer Name Net Pension Liability
Differences between
Expected and
Actual Experience
Changes in
Assumptions
Net Differences
between Projected and
Actual Investment
Earnings
Changes in Employer
Proportion
Total Deferred
Outflows of
Resources
Differences between
Expected and
Actual Experience
Changes in
Assumptions
Net Differences
between Projected and
Actual Investment
Earnings
Changes in Employer
Proportion
Total Deferred
Inflows of Resources
Proportionate Share of
Plan Pension Expense
Net Amortization of
Deferred Amounts
from Changes in
Proportion Total Pension Expense*
Pension Expense
Oregon Public Employees Retirement System
Cost-Sharing Multiple-Employer Defined Benefit Pension Plan
Schedule of Pension Amounts by Employer
As of and for the Year Ended June 30, 2016
Deferred Outflows of Resources Deferred Inflows of Resources
2623 Evans Valley Fire District 6 - - - - - - - - - - - - - -
2624 Klamath Vector Control 96,451 3,191 20,571 19,055 236 43,053 - - - 81,887 81,887 17,283 (18,973) (1,690)
2625 Port of Newport 680,933 22,528 145,227 134,524 90,883 393,162 - - - 62,080 62,080 122,015 2,876 124,891
2626 Tillamook Peoples Utility District 13,615,194 450,450 2,903,794 2,689,791 - 6,044,035 - - - 621,163 621,163 2,439,668 (146,032) 2,293,636
2628 McKenzie Fire And Rescue 549,250 18,172 117,142 108,509 8,250 252,073 - - - 30,469 30,469 98,419 (4,659) 93,760
2629 Metropolitan Wastewater Management Commission - - - - - - - - - - - - - -
2630 Sheridan Fire District 520,576 17,223 111,026 102,844 2,875 233,968 - - - 59,039 59,039 93,281 (12,884) 80,397
2631 Arch Cape Water-Sanitary District 160,783 5,319 34,291 31,764 1,281 72,655 - - - 26,204 26,204 28,810 (5,717) 23,093
2632 Umpqua Regional Council of Governments 71,295 2,359 15,206 14,085 6,657 38,307 - - - - - 12,775 1,929 14,704
2633 Port of Cascade Locks 523,867 17,332 111,728 103,494 48,541 281,095 - - - 416 416 93,870 11,166 105,036
2637 Northeast Oregon Housing Authority 1,228,173 40,633 261,940 242,635 15,764 560,972 - - - 67,204 67,204 220,073 (10,992) 209,081
2638 North Douglas County Fire and EMS 451,415 14,935 96,276 89,181 3,148 203,540 - - - 10,901 10,901 80,888 (1,609) 79,279
2641 Suburban East Salem Water District 608,901 20,145 129,864 120,293 - 270,302 - - - 43,418 43,418 109,107 (11,255) 97,852
2642 Dexter Rural Fire Protection District - - - - - - - - - 50,892 50,892 - (11,855) (11,855)
2643 Sweet Home Cemetery 124,680 4,125 26,591 24,632 474 55,822 - - - 24,964 24,964 22,341 (5,667) 16,674
2644 Lakeside Water District 207,604 6,868 44,277 41,014 - 92,159 - - - 10,127 10,127 37,200 (2,441) 34,759
2645 Chiloquin Agency Lake Rural Fire Protection District 118,932 3,935 25,365 23,496 - 52,796 - - - 25,466 25,466 21,311 (5,997) 15,314
2646 Keno Rural Fire Protection District 169,948 5,623 36,246 33,575 720 76,164 - - - 1,004 1,004 30,453 (22) 30,431
2647 Crooked River Ranch Rural Fire Protection District 618,751 20,471 131,965 122,239 - 274,675 - - - 57,908 57,908 110,872 (13,637) 97,235
2648 Black Butte Ranch Rural Fire Protection District 1,397,913 46,249 298,141 276,169 43,417 663,976 - - - - - 250,488 11,351 261,839
2649 Colton Fire Department 167,676 5,547 35,761 33,126 704 75,138 - - - 4,486 4,486 30,045 (836) 29,209
2650 Pleasant Hill Fire Department 121,603 4,023 25,935 24,024 5,992 59,974 - - - - - 21,790 1,487 23,277
2651 Imbler Rural Fire Protection District 54,469 1,802 11,617 10,761 224 24,404 - - - 3,514 3,514 9,760 (751) 9,009
2652 The Oregon Consortium 578,838 19,150 123,452 114,354 14,526 271,482 - - - 20,216 20,216 103,720 (430) 103,290
2653 Umatilla Fire Department 281,738 9,321 60,088 55,660 - 125,069 - - - 12,823 12,823 50,484 (3,242) 47,242
2654 Spring Valley Rural Fire Protection District - - - - - - - - - - - - - -
2655 North Bay Rural Fire Protection District 102,007 3,375 21,756 20,152 189 45,472 - - - 11,311 11,311 18,278 (2,576) 15,702
2657 Mid-Willamette Valley Senior Service Agency 15,811,234 523,105 3,372,156 3,123,636 970,007 7,988,904 - - - - - 2,833,170 228,398 3,061,568
2658 Salem Metropolitan Communication Agency 302,255 10,000 64,464 59,713 15,318 149,495 - - - - - 54,160 3,583 57,743
2659 Silverton Fire District 737,203 24,390 157,228 145,640 5,015 332,273 - - - 80,964 80,964 132,097 (17,354) 114,743
2660 Tualatin Valley Fire & Rescue 91,699,210 3,033,811 19,557,238 18,115,917 855,893 41,562,859 - - - - - 16,431,322 203,564 16,634,886
2661 Lincoln County 911 - - - - - - - - - - - - - -
2662 East Central Oregon Association of Counties 39,966 1,322 8,524 7,896 1,666 19,408 - - - 236 236 7,161 317 7,478
2663 Metropolitan Area Communications Commission 1,829,867 60,540 390,267 361,505 7,607 819,919 - - - 48,300 48,300 327,889 (8,994) 318,895
2664 Applegate Valley Rural Fire Protection District 9 684,041 22,631 145,889 135,138 7,461 311,119 - - - 19,120 19,120 122,571 (2,253) 120,318
2665 N NE Community Mental Health Center 195,495 6,468 41,694 38,622 - 86,784 - - - 9,396 9,396 35,030 (2,218) 32,812
2666 Central City Concern - - - - - - - - - - - - - -
2667 Mental Health Services West Inc - - - - - - - - - - - - - -
2668 Southeast Mental Health Network Inc - - - - - - - - - - - - - -
2669 Roseburg Urban Sanitary Authority 1,682,405 55,661 358,817 332,373 12,218 759,069 - - - 33,542 33,542 301,465 (4,208) 297,257
2670 Mt Hood Community Mental Health Ctr 386,740 12,795 82,482 76,404 26 171,707 - - - 32,716 32,716 69,299 (7,601) 61,698
2671 Columbia 911 Communications District 2,241,173 74,148 477,988 442,762 21,155 1,016,053 - - - 123,453 123,453 401,589 (22,488) 379,101
2672 Rockwood Water PUD 2,319,842 76,751 494,767 458,303 - 1,029,821 - - - 260,979 260,979 415,686 (62,626) 353,060
2673 Port Orford Library - - - - - - - - - 1,309 1,309 - (385) (385)
2674 Nestucca Rural Fire District 415,154 13,735 88,542 82,017 13,920 198,214 - - - - - 74,390 4,017 78,407
2675 Salmon Harbor-Douglas County 388,225 12,844 82,799 76,697 29,700 202,040 - - - - - 69,565 7,595 77,160
2676 Woodburn Fire District 2,901,265 95,987 618,770 573,168 30,000 1,317,925 - - - 146,272 146,272 519,869 (25,194) 494,675
2677 Portland Private Industry Council Inc - - - - - - - - - - - - - -
2678 Central Oregon Regional Housing Authority 620,632 20,533 132,366 122,611 51,363 326,873 - - - - - 111,209 13,771 124,980
2679 Columbia River Public Utility District 6,035,704 199,687 1,287,271 1,192,402 - 2,679,360 - - - 118,275 118,275 1,081,521 (29,415) 1,052,106
2681 Cloverdale Rural Fire Protection District 282,494 9,346 60,249 55,809 10,922 136,326 - - - 14,751 14,751 50,619 (218) 50,401
2684 Parkdale Fire District 258,766 8,561 55,189 51,121 403 115,274 - - - 6,853 6,853 46,368 (1,476) 44,892
2685 Oregon Community College Association 263,791 8,727 56,260 52,114 80,726 197,827 - - - - - 47,268 18,789 66,057
2686 Weston Cemetery 47,999 1,588 10,237 9,483 - 21,308 - - - 1,565 1,565 8,601 (384) 8,217
2687 Columbia Drainage Vector Control District 115,224 3,812 24,575 22,763 6,883 58,033 - - - 94,167 94,167 20,647 (19,874) 773
2688 Polk County Fire District 1 1,956,775 64,739 417,333 386,577 - 868,649 - - - 65,925 65,925 350,629 (15,804) 334,825
2689 Redmond Area Park & Recreation District 479,036 15,849 102,167 94,637 - 212,653 - - - 9,750 9,750 85,837 (2,850) 82,987
2692 Siuslaw Public Library 667,750 22,092 142,415 131,919 33,906 330,332 - - - 12,355 12,355 119,652 4,251 123,903
2694 Philomath Fire Department 830,444 27,475 177,114 164,061 - 368,650 - - - 29,776 29,776 148,805 (7,274) 141,531
2695 Washington County Consolidated Communications Agency 12,785,026 422,985 2,726,739 2,525,785 - 5,675,509 - - - 336,877 336,877 2,290,913 (80,387) 2,210,526
2696 Stayton Fire District 1,076,514 35,616 229,595 212,674 4,143 482,028 - - - 43,785 43,785 192,898 (8,963) 183,935
2697 Oregon Museum Park - - - - - - - - - - - - - -
2698 Halsey Shedd Rural Fire Protection District 102,464 3,390 21,853 20,243 11,059 56,545 - - - - - 18,360 2,581 20,941
The accompanying notes are an integral part of this schedule.23

Employer
Number Employer Name Net Pension Liability
Differences between
Expected and
Actual Experience
Changes in
Assumptions
Net Differences
between Projected and
Actual Investment
Earnings
Changes in Employer
Proportion
Total Deferred
Outflows of
Resources
Differences between
Expected and
Actual Experience
Changes in
Assumptions
Net Differences
between Projected and
Actual Investment
Earnings
Changes in Employer
Proportion
Total Deferred
Inflows of Resources
Proportionate Share of
Plan Pension Expense
Net Amortization of
Deferred Amounts
from Changes in
Proportion Total Pension Expense*
Pension Expense
Oregon Public Employees Retirement System
Cost-Sharing Multiple-Employer Defined Benefit Pension Plan
Schedule of Pension Amounts by Employer
As of and for the Year Ended June 30, 2016
Deferred Outflows of Resources Deferred Inflows of Resources
2699 Chetco Library Board 388,977 12,869 82,959 76,845 - 172,673 - - - 34,307 34,307 69,700 (8,355) 61,345
2700 Lowell Rural Fire Protection District - - - - - - - - - - - - - -
2701 Sisters-Camp Sherman Rural Fire Protection District 2,158,518 71,413 460,360 426,433 - 958,206 - - - 143,134 143,134 386,779 (35,225) 351,554
2702 Banks Fire District 13 443,943 14,688 94,682 87,704 48,425 245,499 - - - 135 135 79,549 11,222 90,771
2703 Westport Sewer District - - - - - - - - - - - - - -
2704 Clatsop County 4-H District - - - - - - - - - 33,960 33,960 - (9,988) (9,988)
2705 Lebanon Fire District 6,166,076 204,001 1,315,076 1,218,158 34,324 2,771,559 - - - 273,765 273,765 1,104,882 (53,571) 1,051,311
2706 Stanfield Fire District - - - - - - - - - 59,444 59,444 - (13,860) (13,860)
2707 Clatskanie Library 143,814 4,758 30,672 28,412 997 64,839 - - - 12,017 12,017 25,770 (2,502) 23,268
2708 Milton-Freewater Cemetery District 3 25,197 834 5,374 4,978 - 11,186 - - - 40,731 40,731 4,515 (9,486) (4,971)
2709 Scappoose Public Library 207,111 6,852 44,172 40,917 14,268 106,209 - - - - - 37,112 3,339 40,451
2710 Klamath County Emergency Communications District 1,197,992 39,635 255,503 236,673 - 531,811 - - - 51,414 51,414 214,665 (12,574) 202,091
2712 Jefferson County EMS 682,652 22,585 145,593 134,863 50,503 353,544 - - - 12,088 12,088 122,323 8,189 130,512
2713 Port of Tillamook Bay 1,173,365 38,820 250,250 231,808 35,423 556,301 - - - 38,308 38,308 210,252 (3,029) 207,223
2714 Winchester Bay Sanitary District 174,770 5,782 37,274 34,527 - 77,583 - - - 14,187 14,187 31,317 (3,456) 27,861
2715 Jackson County Fire District 3 11,317,893 374,445 2,413,835 2,235,941 248,963 5,273,184 - - - 241,873 241,873 2,028,021 16,975 2,044,996
2716 Neskowin Water District 396,507 13,118 84,565 78,333 - 176,016 - - - 3,340 3,340 71,049 (939) 70,110
2717 Ice Fountain Water District 285,784 9,455 60,951 56,459 13,775 140,640 - - - 3,360 3,360 51,209 2,215 53,424
2718 Curry Library - - - - - - - - - - - - - -
2719 Human Solutions, Inc - - - - - - - - - - - - - -
2720 Tri-Met - - - - - - - - - - - - - -
2721 Klamath Housing Authority 680,696 22,520 145,176 134,477 116 302,289 - - - 115,496 115,496 121,972 (26,826) 95,146
2722 Tillamook 9-1-1 245,638 8,127 52,389 48,528 88,086 197,130 - - - 2,239 2,239 44,015 19,827 63,842
2723 Oregon Coastal Zone Management Association - - - - - - - - - - - - - -
2724 Nehalem Bay Wastewater Agency 357,612 11,831 76,270 70,649 18,796 177,546 - - - - - 64,079 4,436 68,515
2725 West Valley Fire District 960,709 31,784 204,896 189,796 66,407 492,883 - - - - - 172,147 16,188 188,335
2726 Yamhill Communications Agency 1,697,542 56,162 362,045 335,363 - 753,570 - - - 202,355 202,355 304,178 (48,883) 255,295
2728 Baker County Library District 767,274 25,385 163,641 151,581 3,596 344,203 - - - 46,352 46,352 137,486 (9,723) 127,763
2729 Douglas County Fire District 2 18,458,042 610,673 3,936,657 3,646,535 - 8,193,865 - - - 704,719 704,719 3,307,444 (167,542) 3,139,902
2731 Canby Utility Board 3,265,221 108,028 696,393 645,071 39,830 1,489,322 - - - 191,428 191,428 585,086 (32,803) 552,283
2732 Umatilla County Special Library District 149,841 4,957 31,957 29,602 2,117 68,633 - - - 1,478 1,478 26,850 58 26,908
2733 Wiard Memorial Park District 277,072 9,167 59,093 54,738 1,740 124,738 - - - 26,638 26,638 49,648 (5,683) 43,965
2734 Seal Rock Water District 698,307 23,103 148,932 137,956 13,960 323,951 - - - - - 125,128 3,745 128,873
2736 Wasco 9-1-1 - - - - - - - - - - - - - -
2737 Portland Energy Conservation Inc 108,983 3,606 23,244 21,531 8,966 57,347 - - - - - 19,528 2,168 21,696
2739 Scappoose Rural Fire Protection District 3,240,896 107,223 691,205 640,265 46,014 1,484,707 - - - 151,379 151,379 580,727 (21,670) 559,057
2740 Neskowin Regional Sanitary Authority 82,608 2,733 17,618 16,320 - 36,671 - - - 7,850 7,850 14,802 (1,864) 12,938
2741 Port of Garibaldi 302,348 10,003 64,484 59,731 8,454 142,672 - - - 73,214 73,214 54,177 (14,539) 39,638
2742 Amity Fire District 186,162 6,159 39,704 36,778 832 83,473 - - - 4,427 4,427 33,358 (785) 32,573
2743 Douglas Soil & Water Conservation District - - - - - - - - - 93 93 - (28) (28)
2745 Clackamas County Fire District 51,988,825 1,720,018 11,087,967 10,270,811 1,165,191 24,243,987 - - - - - 9,315,730 276,673 9,592,403
2746 Marion-Salem Data Center - - - - - - - - - - - - - -
2747 Salem Housing Authority 3,915,632 129,546 835,110 773,565 - 1,738,221 - - - 111,649 111,649 701,631 (28,734) 672,897
2749 Black Butte Ranch Police 729,588 24,138 155,604 144,136 19,116 342,994 - - - 43,830 43,830 130,733 (4,571) 126,162
2750 Eastern Oregon Human Services Consortium - - - - - - - - - - - - - -
2752 Mist-Birkenfeld Rural Fire Protection District 116,764 3,863 24,903 23,068 41,872 93,706 - - - 30,060 30,060 20,923 897 21,820
2753 Linn-Benton Housing Authority 1,561,628 51,665 333,058 308,512 79,853 773,088 - - - - - 279,824 21,177 301,001
2754 Western Lane Ambulance District 1,969,815 65,170 420,114 389,153 - 874,437 - - - 123,853 123,853 352,966 (30,125) 322,841
2756 Sandy Area Sch Trans Agency - - - - - - - - - - - - - -
2757 City of Stayton 2,004,319 66,312 427,473 395,969 2,484 892,238 - - - 21,180 21,180 359,148 (4,194) 354,954
2758 Mohawk Valley Rural Fire District 159,976 5,293 34,119 31,605 18,674 89,691 - - - - - 28,666 4,815 33,481
2760 Knappa Svensen Burnside Rural Fire Protection District 163,432 5,407 34,856 32,287 9,623 82,173 - - - - - 29,285 2,323 31,608
2761 Clackamas River Water 5,381,562 178,046 1,147,758 1,063,171 - 2,388,975 - - - 191,022 191,022 964,307 (45,036) 919,271
2763 Junction City Fire Department 423,396 14,008 90,300 83,645 18,327 206,280 - - - 61,429 61,429 75,867 (8,895) 66,972
2765 Green Sanitary 505,857 16,736 107,887 99,936 2,425 226,984 - - - 15,927 15,927 90,643 (2,991) 87,652
2766 Southwest Lincoln County Water District 446,621 14,776 95,254 88,234 - 198,264 - - - 8,881 8,881 80,029 (2,583) 77,446
2767 Springfield Utility Board 88,290 2,921 18,830 17,442 6,027 45,220 - - - - - 15,821 1,518 17,339
2768 Lake County Library District 205,164 6,788 43,757 40,532 4,329 95,406 - - - 25,970 25,970 36,763 (4,765) 31,998
2771 Harbor Water PUD 195,605 6,471 41,718 38,643 15,273 102,105 - - - 4,002 4,002 35,050 2,375 37,425
2772 Umatilla County Soil & Water District 175,401 5,803 37,409 34,652 10,380 88,244 - - - 6,659 6,659 31,430 456 31,886
2773 Housing Authority of Jackson County 4,852,694 160,548 1,034,963 958,689 37,290 2,191,490 - - - 162,849 162,849 869,540 (26,904) 842,636
2774 Oregon Trail Library District 211,022 6,982 45,006 41,689 617 94,294 - - - 5,523 5,523 37,812 (1,103) 36,709
2776 Rainier Cemetery District 14,127 467 3,013 2,791 2,752 9,023 - - - 16,966 16,966 2,531 (3,136) (605)
The accompanying notes are an integral part of this schedule.24

Employer
Number Employer Name Net Pension Liability
Differences between
Expected and
Actual Experience
Changes in
Assumptions
Net Differences
between Projected and
Actual Investment
Earnings
Changes in Employer
Proportion
Total Deferred
Outflows of
Resources
Differences between
Expected and
Actual Experience
Changes in
Assumptions
Net Differences
between Projected and
Actual Investment
Earnings
Changes in Employer
Proportion
Total Deferred
Inflows of Resources
Proportionate Share of
Plan Pension Expense
Net Amortization of
Deferred Amounts
from Changes in
Proportion Total Pension Expense*
Pension Expense
Oregon Public Employees Retirement System
Cost-Sharing Multiple-Employer Defined Benefit Pension Plan
Schedule of Pension Amounts by Employer
As of and for the Year Ended June 30, 2016
Deferred Outflows of Resources Deferred Inflows of Resources
2777 City of Newberg 12,499,882 413,551 2,665,925 2,469,452 80,555 5,629,483 - - - 350,355 350,355 2,239,818 (57,785) 2,182,033
2778 Mulino Water District 23 114,176 3,777 24,351 22,556 1,845 52,529 - - - 4,444 4,444 20,459 (492) 19,967
2779 Brownsville Rural Fire Protection District 198,518 6,568 42,339 39,219 39,715 127,841 - - - 3,283 3,283 35,572 8,271 43,843
2780 Nehalem Bay Health District 72,034 2,383 15,363 14,231 5,276 37,253 - - - 1,585 1,585 12,908 761 13,669
2781 North Bend Coos-Curry Housing Authority 982,085 32,492 209,455 194,019 3,901 439,867 - - - 24,819 24,819 175,977 (6,393) 169,584
2782 Millington Rural Fire Protection District 4,525 150 965 894 1,623 3,632 - - - - - 811 377 1,188
2783 Tillamook Fire District 340,352 11,260 72,589 67,239 - 151,088 - - - 6,715 6,715 60,987 (1,684) 59,303
2784 Eisenschmidt Pool 298,535 9,877 63,670 58,978 7,660 140,185 - - - 30,501 30,501 53,494 (4,840) 48,654
2785 Fern Ridge Community Library 55,034 1,821 11,737 10,872 10,107 34,537 - - - 17,991 17,991 9,861 (2,941) 6,920
2786 Seal Rock Rural Fire Protection District 91,682 3,033 19,554 18,112 2,269 42,968 - - - - - 16,428 622 17,050
2788 Port of Hood River 1,189,375 39,350 253,665 234,971 - 527,986 - - - 26,675 26,675 213,121 (6,729) 206,392
2789 Farmers Irrigation District 745,507 24,665 158,999 147,281 - 330,945 - - - 12,951 12,951 133,585 (3,790) 129,795
2790 Silver Falls Library District 550,051 18,198 117,313 108,667 3,128 247,306 - - - 95,021 95,021 98,562 (21,178) 77,384
2792 North Wasco County Parks And Recreation District 622,417 20,592 132,747 122,963 2,718 279,020 - - - 55,547 55,547 111,529 (12,119) 99,410
2793 North Lincoln Fire & Rescue District 1 1,198,672 39,657 255,648 236,807 34,076 566,188 - - - - - 214,787 9,923 224,710
2794 Siuslaw Rural Fire Protection District 1 1,318,917 43,636 281,293 260,563 86,310 671,802 - - - 12,309 12,309 236,333 16,451 252,784
2796 West Side Rural Fire Protection District 138,628 4,586 29,566 27,387 17,737 79,276 - - - 1,079 1,079 24,840 3,807 28,647
2797 Vernonia Fire 78,376 2,593 16,716 15,484 971 35,764 - - - - - 14,044 244 14,288
2798 Fairview Water District 158,850 5,255 33,879 31,382 9,693 80,209 - - - 51,051 51,051 28,464 (9,021) 19,443
2799 Sublimity Fire District 158,039 5,229 33,706 31,222 4,330 74,487 - - - 79,349 79,349 28,319 (17,180) 11,139
2801 Coburg Rural Fire Protection District 230,721 7,633 49,207 45,581 988 103,409 - - - 590 590 41,342 153 41,495
2802 Rural Road Assessment District 3 389,199 12,876 83,007 76,889 7,948 180,720 - - - 40,807 40,807 69,739 (7,152) 62,587
2803 Southwestern Polk County Rural Fire Protection District 18,016 596 3,842 3,559 787 8,784 - - - 134 134 3,228 143 3,371
2804 Aurora Rural Fire Protection District 529,010 17,502 112,825 104,510 8,544 243,381 - - - 93 93 94,792 2,491 97,283
2806 Multnomah County Rural Fire Protection District 14 80,571 2,666 17,184 15,917 273 36,040 - - - 5,931 5,931 14,437 (1,298) 13,139
2808 Lifeways - - - - - - - - - - - - - -
2809 Juntura Road District 4 28,610 947 6,102 5,652 - 12,701 - - - 2,224 2,224 5,127 (517) 4,610
2810 Sutherlin Water Control District 93,666 3,099 19,977 18,505 570 42,151 - - - 1,094 1,094 16,784 (88) 16,696
2811 Mid-Columbia Center For Living 8,995,115 297,598 1,918,442 1,777,057 366,889 4,359,986 - - - 9,963 9,963 1,611,809 82,393 1,694,202
2812 Workforce Development Board - - - - - - - - - - - - - -
2814 The Job Council 3,764,292 124,539 802,833 743,666 25,919 1,696,957 - - - 137,423 137,423 674,513 (24,335) 650,178
2815 Hermiston Rural Fire Protection District 4,117,182 136,214 878,096 813,382 152,177 1,979,869 - - - 28,483 28,483 737,746 27,013 764,759
2816 Odell Sanitary District 315,236 10,429 67,232 62,277 7,514 147,452 - - - 68,747 68,747 56,486 (13,778) 42,708
2817 Wickiup Water District 183,442 6,069 39,124 36,240 1,563 82,996 - - - 1,789 1,789 32,870 44 32,914
2818 Netarts Water District 182,389 6,034 38,899 36,032 4,318 85,283 - - - 28,946 28,946 32,682 (5,462) 27,220
2819 Harrisburg Fire and Rescue 186,283 6,163 39,730 36,802 593 83,288 - - - 68,657 68,657 33,380 (15,793) 17,587
2820 Central Oregon Coast Fire & Rescue District 521,722 17,261 111,271 103,070 7,608 239,210 - - - 36,919 36,919 93,486 (6,349) 87,137
2821 Tillamook County Soil And Water Conservation District 212,746 7,039 45,374 42,030 39,101 133,544 - - - - - 38,121 9,224 47,345
2822 Deschutes County Rural Fire Protection District 2 205,202 6,789 43,765 40,539 578 91,671 - - - 6,727 6,727 36,770 (1,395) 35,375
2823 Lyons Fire District 80,283 2,656 17,122 15,861 - 35,639 - - - 3,507 3,507 14,386 (818) 13,568
2824 Glide Fire Department 110,614 3,660 23,591 21,853 7,647 56,751 - - - - - 19,821 1,796 21,617
2825 Northern Oregon Corrections 5,348,544 176,953 1,140,716 1,056,648 204,192 2,578,509 - - - - - 958,390 55,817 1,014,207
2826 Wasco County Soil-Water Conservation District 491,745 16,269 104,877 97,148 - 218,294 - - - 47,248 47,248 88,114 (11,075) 77,039
2828 Deschutes Public Library District 4,257,811 140,867 908,089 841,165 - 1,890,121 - - - 336,173 336,173 762,945 (81,074) 681,871
2829 Hubbard Rural Fire Protection District - - - - - - - - - 32,772 32,772 - (7,673) (7,673)
2830 Netarts-Oceanside Rural Fire Protection District 248,532 8,223 53,006 49,099 354 110,682 - - - 8,007 8,007 44,534 (1,758) 42,776
2831 Oregon Advanced Technology Consortium, Inc - - - - - - - - - - - - - -
2832 CareOregon - - - - - - - - - - - - - -
2833 Boardman Rural Fire Protection District 519,985 17,203 110,900 102,727 2,379 233,209 - - - 30,064 30,064 93,175 (6,292) 86,883
2834 Crescent Rural Fire Protection District 158,092 5,230 33,717 31,232 3,816 73,995 - - - 173,309 173,309 28,328 (39,182) (10,854)
2835 North Clackamas County Water Commission 392,862 12,998 83,788 77,613 - 174,399 - - - 32,132 32,132 70,396 (7,565) 62,831
2837 NORCOM 1,826,408 60,426 389,529 360,822 48,313 859,090 - - - 10,443 10,443 327,269 11,780 339,049
2838 High Desert Parks & Recreation District 12,043 398 2,568 2,379 191 5,536 - - - 14,436 14,436 2,158 (3,301) (1,143)
2839 North Morrow Vector Control District 213,857 7,075 45,610 42,249 1,303 96,237 - - - 6,343 6,343 38,320 (1,091) 37,229
2840 Cannon Beach Rural Fire Protection District 332,058 10,986 70,820 65,601 10,712 158,119 - - - - - 59,500 2,704 62,204
2841 Jefferson County Soil & Water Conservation District 154,115 5,099 32,869 30,447 13,589 82,004 - - - 6,508 6,508 27,615 1,246 28,861
2842 Tualatin Valley Water District 15,179,892 502,217 3,237,506 2,998,910 152,540 6,891,173 - - - 454,723 454,723 2,720,042 (60,886) 2,659,156
2843 Yachats Rural Fire Protection District 400,614 13,254 85,441 79,145 10,488 188,328 - - - 8,223 8,223 71,785 1,173 72,958
2844 Crook County Rural Fire Protection District 1 3,545,897 117,314 756,255 700,520 153,910 1,727,999 - - - - - 635,379 39,035 674,414
2845 Sunrise Water Authority 1,839,622 60,863 392,347 363,432 - 816,642 - - - 125,666 125,666 329,637 (30,676) 298,961
2846 Jefferson County Library District 316,871 10,483 67,581 62,600 858 141,522 - - - 36,298 36,298 56,779 (8,188) 48,591
2847 Sweet Home Fire and Ambulance District 1,944,569 64,335 414,730 384,165 - 863,230 - - - 54,811 54,811 348,442 (14,713) 333,729
2848 Lane Transit District - - - - - - - - - - - - - -
The accompanying notes are an integral part of this schedule.25

Employer
Number Employer Name Net Pension Liability
Differences between
Expected and
Actual Experience
Changes in
Assumptions
Net Differences
between Projected and
Actual Investment
Earnings
Changes in Employer
Proportion
Total Deferred
Outflows of
Resources
Differences between
Expected and
Actual Experience
Changes in
Assumptions
Net Differences
between Projected and
Actual Investment
Earnings
Changes in Employer
Proportion
Total Deferred
Inflows of Resources
Proportionate Share of
Plan Pension Expense
Net Amortization of
Deferred Amounts
from Changes in
Proportion Total Pension Expense*
Pension Expense
Oregon Public Employees Retirement System
Cost-Sharing Multiple-Employer Defined Benefit Pension Plan
Schedule of Pension Amounts by Employer
As of and for the Year Ended June 30, 2016
Deferred Outflows of Resources Deferred Inflows of Resources
2849 Lebanon Aquatic District 317,925 10,518 67,806 62,809 - 141,133 - - - 23,965 23,965 56,968 (6,065) 50,903
2850 Lake County 4-H & Extension Service 86,798 2,872 18,512 17,148 4,260 42,792 - - - - - 15,553 1,162 16,715
2851 East Umatilla County Rural Fire Protection District 107,725 3,564 22,975 21,282 4,051 51,872 - - - 8,508 8,508 19,303 (787) 18,516
2852 Ochoco Irrigation District 557,697 18,451 118,943 110,178 10,621 258,193 - - - - - 99,932 2,471 102,403
2853 Mill City Rural Fire Protection District 80,323 2,657 17,131 15,869 1,646 37,303 - - - - - 14,393 464 14,857
2854 Sunset Empire Transportation District - - - - - - - - - - - - - -
2855 Harney Hospital 13,793,167 456,338 2,941,751 2,724,951 518,750 6,641,790 - - - - - 2,471,558 136,743 2,608,301
2856 Mid-Columbia Council Of Governments 25,578 846 5,455 5,053 48 11,402 - - - 4,029 4,029 4,583 (923) 3,660
2857 Sunriver Service District 3,356,982 111,064 715,964 663,199 - 1,490,227 - - - 115,005 115,005 601,528 (27,441) 574,087
2858 Nesika Beach-Ophir Water District 168,494 5,575 35,936 33,287 6,402 81,200 - - - 3,086 3,086 30,192 581 30,773
2859 South Lane County Fire and Rescue 4,454,073 147,360 949,947 879,938 - 1,977,245 - - - 181,942 181,942 798,113 (42,752) 755,361
2860 Coos County Airport District 1,008,544 33,367 215,098 199,246 17,428 465,139 - - - - - 180,718 4,687 185,405
2861 Mt Angel Fire District 52,777 1,746 11,256 10,427 10,726 34,155 - - - - - 9,457 2,542 11,999
2864 Tri-City Water and Sanitary Authority 611,782 20,240 130,478 120,862 11,548 283,128 - - - 6,220 6,220 109,624 1,950 111,574
2865 Tri-County Cooperative Weed Management Area 54,062 1,789 11,530 10,680 - 23,999 - - - 10,330 10,330 9,687 (2,469) 7,218
2866 Jefferson Behavioral Health 7,228 239 1,542 1,428 728 3,937 - - - 362 362 1,295 130 1,425
2867 West Multnomah Soil And Water Conservation District 938,713 31,057 200,205 185,450 23,079 439,791 - - - 62,408 62,408 168,205 (7,726) 160,479
2869 Nehalem Bay Fire & Rescue 346,238 11,455 73,844 68,402 13,797 167,498 - - - 12,957 12,957 62,041 (602) 61,439
2870 Clackamas River Water Providers 102,100 3,378 21,776 20,171 - 45,325 - - - 8,487 8,487 18,295 (1,996) 16,299
2872 Emergency Communications of Southern Oregon 5,709 189 1,218 1,128 - 2,535 - - - 423 423 1,023 (99) 924
2873 Mosier Fire District 53,045 1,755 11,313 10,479 - 23,547 - - - 4,748 4,748 9,505 (1,144) 8,361
2874 Umatilla-Morrow Radio and Data District 123,744 4,094 26,392 24,447 13,943 68,876 - - - 879 879 22,173 2,983 25,156
2876 Oregon Municipal Electric Utilities Association 63,379 2,097 13,517 12,521 - 28,135 - - - 8,289 8,289 11,357 (1,947) 9,410
2877 Mid-Columbia Fire And Rescue V1-801 2,487,467 82,296 530,517 491,419 246,897 1,351,129 - - - 187,564 187,564 445,722 28,996 474,718
2878 Yamhill Fire Protection District 152,755 5,054 32,579 30,178 16,368 84,179 - - - - - 27,372 4,157 31,529
2879 LaGrande Rural Fire Protection District 101,546 3,360 21,657 20,061 36,415 81,493 - - - - - 18,196 8,468 26,664
2880 Oregon Health & Science University 526,199,522 17,408,980 112,225,713 103,954,948 - 233,589,641 - - - 29,210,549 29,210,549 94,288,202 (7,027,553) 87,260,649
2881 Lake Chinook Fire and Rescue District 47,996 1,588 10,236 9,482 17,211 38,517 - - - - - 8,600 4,003 12,603
2883 Lane Fire Authority 5,314,161 175,816 1,133,383 1,049,855 65,819 2,424,873 - - - 69,033 69,033 952,229 3,305 955,534
2884 North Central Public Health District 2,262,250 74,845 482,484 446,926 811,244 1,815,499 - - - - - 405,366 188,662 594,028
2885 Siletz Rural Fire Protection District 182,293 6,031 38,879 36,013 65,370 146,293 - - - - - 32,665 15,202 47,867
2886 Idanha-Detroit Rural Fire Protection District - - - - - - - - - - - - - -
2900 Clatsop Community College 5,738,026 189,839 1,223,783 1,133,593 56,953 2,604,168 - - - 42,634 42,634 1,028,181 6,836 1,035,017
2901 Blue Mountain Community College 11,953,830 395,485 2,549,465 2,361,575 - 5,306,525 - - - 190,066 190,066 2,141,973 (46,512) 2,095,461
2902 Treasure Valley Community College 10,526,017 348,247 2,244,947 2,079,499 568,857 5,241,550 - - - - - 1,886,127 135,370 2,021,497
2903 Umpqua Community College 16,513,216 546,329 3,521,872 3,262,319 182,240 7,512,760 - - - - - 2,958,956 42,946 3,001,902
2904 Lane Community College 58,029,106 1,919,856 12,376,214 11,464,117 58,460 25,818,647 - - - 44,016 44,016 10,398,071 6,958 10,405,029
2905 Mt Hood Community College 26,674,405 882,506 5,689,010 5,269,743 1,510,007 13,351,266 - - - 211,852 211,852 4,779,711 288,854 5,068,565
2906 Klamath Community College 6,989,709 231,250 1,490,737 1,380,873 42,199 3,145,059 - - - 1,110,499 1,110,499 1,252,466 (245,843) 1,006,623
2908 Clackamas Community College 32,492,090 1,074,980 6,929,782 6,419,074 1,362,517 15,786,353 - - - 321,390 321,390 5,822,166 222,337 6,044,503
2910 Linn-Benton Community College 30,576,620 1,011,608 6,521,258 6,040,657 142,245 13,715,768 - - - 197,858 197,858 5,478,938 (25,114) 5,453,824
2918 Portland Community College 166,854,312 5,520,270 35,586,015 32,963,411 2,680,977 76,750,673 - - - - - 29,898,152 653,401 30,551,553
2919 Chemeketa Community College 49,919,857 1,651,567 10,646,706 9,862,069 1,770,168 23,930,510 - - - - - 8,944,998 413,338 9,358,336
2922 Rogue Community College 25,241,640 835,104 5,383,435 4,986,689 158,026 11,363,254 - - - 31,458 31,458 4,522,978 27,498 4,550,476
2995 Oregon Coast Community College 2,709,625 89,646 577,898 535,308 66,148 1,269,000 - - - 102,824 102,824 485,530 (4,456) 481,074
2996 Columbia Gorge Community College 8,045,162 266,169 1,715,840 1,589,386 82,401 3,653,796 - - - 68,952 68,952 1,441,590 8,200 1,449,790
2997 Tillamook Bay Community College 2,053,968 67,954 438,062 405,778 182,676 1,094,470 - - - 48,621 48,621 368,045 28,182 396,227
2998 Southwestern Community College 11,528,202 381,403 2,458,689 2,277,489 248,263 5,365,844 - - - - - 2,065,706 59,641 2,125,347
2999 Central Oregon Community College 36,737,387 1,215,433 7,835,202 7,257,766 199,244 16,507,645 - - - 110,207 110,207 6,582,868 32,972 6,615,840
3003 Baker School District 5J 13,981,777 462,578 2,981,977 2,762,213 320,676 6,527,444 - - - - - 2,505,355 77,838 2,583,193
3008 Huntington School District 16J 1,106,333 36,602 235,954 218,565 - 491,121 - - - 139,626 139,626 198,241 (32,738) 165,503
3016 Burnt River High School 865,822 28,645 184,659 171,050 14,271 398,625 - - - 79,287 79,287 155,144 (14,242) 140,902
3027 Pine-Eagle School District 61 2,796,003 92,504 596,320 552,373 - 1,241,197 - - - 26,368 26,368 501,008 (6,986) 494,022
3037 Alsea School 2,294,970 75,928 489,462 453,390 - 1,018,780 - - - 180,538 180,538 411,229 (42,117) 369,112
3039 Corvallis School District 509J 46,665,408 1,543,896 9,952,610 9,219,127 1,009,064 21,724,697 - - - 374,573 374,573 8,361,842 124,498 8,486,340
3043 Philomath School District 17J 9,826,257 325,096 2,095,704 1,941,256 - 4,362,056 - - - 222,199 222,199 1,760,739 (57,765) 1,702,974
3049 Monroe Elementary School - - - - - - - - - - - - - -
3075 West Linn School District 78,384,174 2,593,291 16,717,461 15,485,424 1,726,202 36,522,378 - - - 232,551 232,551 14,045,438 333,045 14,378,483
3083 Welches Elementary School - - - - - - - - - - - - - -
3094 Damascus-Union School District 26 - - - - - - - - - - - - - -
3102 Molalla Elementary School 35 - - - - - - - - - - - - - -
3109 Boring School District - - - - - - - - - - - - - -
3111 Sandy Elementary School District 46 - - - - - - - - - - - - - -
The accompanying notes are an integral part of this schedule.26

Employer
Number Employer Name Net Pension Liability
Differences between
Expected and
Actual Experience
Changes in
Assumptions
Net Differences
between Projected and
Actual Investment
Earnings
Changes in Employer
Proportion
Total Deferred
Outflows of
Resources
Differences between
Expected and
Actual Experience
Changes in
Assumptions
Net Differences
between Projected and
Actual Investment
Earnings
Changes in Employer
Proportion
Total Deferred
Inflows of Resources
Proportionate Share of
Plan Pension Expense
Net Amortization of
Deferred Amounts
from Changes in
Proportion Total Pension Expense*
Pension Expense
Oregon Public Employees Retirement System
Cost-Sharing Multiple-Employer Defined Benefit Pension Plan
Schedule of Pension Amounts by Employer
As of and for the Year Ended June 30, 2016
Deferred Outflows of Resources Deferred Inflows of Resources
3116 Colton School District 53 7,009,189 231,895 1,494,891 1,384,722 26,348 3,137,856 - - - 770,030 770,030 1,255,957 (171,327) 1,084,630
3122 Oregon City School District 62 67,183,006 2,222,707 14,328,521 13,272,543 1,295,751 31,119,522 - - - - - 12,038,333 333,864 12,372,197
3138 Canby Elementary School District 86 - - - - - - - - - - - - - -
3160 Gladstone School District 115 4,872,962 161,219 1,039,286 962,693 1,747,449 3,910,647 - - - - - 873,172 406,383 1,279,555
3174 Canby Union High School - - - - - - - - - - - - - -
3175 Sandy Union High School - - - - - - - - - - - - - -
3176 Molalla Union High School - - - - - - - - - - - - - -
3179 Clatsop County School District 1C 6,820,203 225,642 1,454,585 1,347,386 2,251,209 5,278,822 - - - - - 1,222,093 527,126 1,749,219
3186 Jewell School District 8 4,261,061 140,975 908,782 841,807 72,810 1,964,374 - - - 276,786 276,786 763,528 (42,954) 720,574
3187 Seaside Schools 14,446,035 477,938 3,080,992 2,853,930 - 6,412,860 - - - 307,327 307,327 2,588,544 (82,268) 2,506,276
3195 Warrenton-Hammond School District 7,856,175 259,917 1,675,533 1,552,051 4,810 3,492,311 - - - 382,118 382,118 1,407,726 (87,450) 1,320,276
3230 Vernonia School District 7,444,010 246,280 1,587,628 1,470,624 - 3,304,532 - - - 431,336 431,336 1,333,871 (109,972) 1,223,899
3241 Coquille School District 8 9,958,065 329,456 2,123,816 1,967,296 - 4,420,568 - - - 884,659 884,659 1,784,357 (209,096) 1,575,261
3242 Coos Bay School District 9 24,747,181 818,745 5,277,979 4,889,005 - 10,985,729 - - - 750,925 750,925 4,434,377 (176,000) 4,258,377
3245 North Bend Public Schools 17,484,320 578,458 3,728,985 3,454,168 476,897 8,238,508 - - - - - 3,132,966 115,721 3,248,687
3252 Powers School District 1,913,843 63,318 408,177 378,095 - 849,590 - - - 168,155 168,155 342,936 (40,065) 302,871
3257 Myrtle Point School District 41 8,660,419 286,525 1,847,059 1,710,935 43,343 3,887,862 - - - 389,044 389,044 1,551,836 (77,727) 1,474,109
3264 Bandon School District 7,976,372 263,893 1,701,169 1,575,797 - 3,540,859 - - - 855,906 855,906 1,429,264 (205,921) 1,223,343
3274 Crook County School District 12,807,407 423,725 2,731,512 2,530,206 1,747,345 7,432,788 - - - - - 2,294,923 424,342 2,719,265
3275 Port Orford-Langlois School District 2Cj 3,845,792 127,236 820,215 759,767 43,891 1,751,109 - - - 113,072 113,072 689,117 (23,049) 666,068
3277 Curry County School District 3C - - - - - - - - - - - - - -
3281 Ophir School - - - - - - - - - - - - - -
3282 Pistol River School District 16 - - - - - - - - - - - - - -
3283 Brookings-Harbor School District 17C 8,187,479 270,878 1,746,192 1,617,502 577,794 4,212,366 - - - - - 1,467,091 136,498 1,603,589
3288 Central Curry School District 1 5,699,590 188,567 1,215,586 1,126,000 - 2,530,153 - - - 267,405 267,405 1,021,293 (67,692) 953,601
3291 Bend-La Pine Public Schools 142,785,408 4,723,965 30,452,696 28,208,406 1,178,503 64,563,570 - - - - - 25,585,313 326,286 25,911,599
3296 Sisters School District 5,834,221 193,022 1,244,299 1,152,597 266,404 2,856,322 - - - 10,922 10,922 1,045,417 58,741 1,104,158
3307 Oakland School District 6,629,739 219,341 1,413,964 1,309,758 - 2,943,063 - - - 300,884 300,884 1,187,964 (70,218) 1,117,746
3310 Roseburg Public Schools 34,168,364 1,130,439 7,287,291 6,750,235 213,324 15,381,289 - - - - - 6,122,532 49,960 6,172,492
3316 Glide School District 12 5,296,422 175,229 1,129,600 1,046,351 - 2,351,180 - - - 59,447 59,447 949,051 (15,411) 933,640
3318 Days Creek School District 15 2,535,224 83,876 540,702 500,854 - 1,125,432 - - - 359,586 359,586 454,280 (89,351) 364,929
3319 South Umpqua School District 1,106,156 36,596 235,916 218,530 396,669 887,711 - - - - - 198,209 92,248 290,457
3320 Camas Valley School District 21 2,445,294 80,901 521,522 483,088 - 1,085,511 - - - 48,184 48,184 438,165 (11,280) 426,885
3321 North Douglas School District 22 4,217,742 139,541 899,543 833,249 - 1,872,333 - - - 289,964 289,964 755,765 (71,050) 684,715
3324 Yoncalla School District 32 3,862,097 127,775 823,692 762,988 43,299 1,757,754 - - - 19,441 19,441 692,038 4,352 696,390
3325 Elkton School District 34 2,822,488 93,380 601,969 557,605 - 1,252,954 - - - 75,453 75,453 505,754 (18,924) 486,830
3331 Umpqua School District - - - - - - - - - - - - - -
3335 Riddle School District 4,364,139 144,385 930,766 862,171 - 1,937,322 - - - 256,532 256,532 781,998 (60,947) 721,051
3338 Glendale 77 3,648,466 120,707 778,130 720,784 - 1,619,621 - - - 479,706 479,706 653,758 (116,400) 537,358
3349 Winston-Dillard Schools 162,552 5,378 34,668 32,113 58,292 130,451 - - - - - 29,127 13,556 42,683
3353 Sutherlin School District 130 5,635,725 186,454 1,201,965 1,113,383 329,917 2,831,719 - - - - - 1,009,850 78,269 1,088,119
3361 Arlington Public Schools 2,481,022 82,083 529,142 490,146 - 1,101,371 - - - 239,266 239,266 444,567 (55,794) 388,773
3364 Condon Admin School District 25J 1,957,021 64,747 417,386 386,625 839 869,597 - - - 172,768 172,768 350,673 (39,932) 310,741
3370 Prairie City School District 4 2,200,898 72,815 469,399 434,805 - 977,019 - - - 94,175 94,175 394,373 (22,553) 371,820
3372 Monument School District 8 1,271,734 42,075 271,230 251,241 8,651 573,197 - - - 88,195 88,195 227,878 (17,966) 209,912
3375 Dayville School District 16J 1,443,777 47,766 307,923 285,230 24,089 665,008 - - - 8,307 8,307 258,706 3,159 261,865
3376 Long Creek Schools 808,352 26,744 172,402 159,696 24,021 382,863 - - - 42,143 42,143 144,846 (2,736) 142,110
3392 Burns-Slater School District - - - - - - - - - - - - - -
3394 Crane Elementary School 579,848 19,184 123,668 114,554 34,028 291,434 - - - 44,343 44,343 103,901 (5,129) 98,772
3395 Pine Creek School 77,337 2,559 16,494 15,279 741 35,073 - - - 4,100 4,100 13,858 (736) 13,122
3396 Diamond School District 7 279,094 9,234 59,524 55,137 7,800 131,695 - - - 60,686 60,686 50,010 (11,819) 38,191
3397 Suntex School District 289,951 9,593 61,840 57,282 4,432 133,147 - - - 1,999 1,999 51,955 443 52,398
3398 Drewsey School - - - - - - - - - 36,751 36,751 - (10,809) (10,809)
3399 Frenchglen School District 287,304 9,505 61,275 56,759 3,555 131,094 - - - 30,283 30,283 51,481 (5,996) 45,485
3405 Fields-Trout Creek 33 237,175 7,847 50,584 46,856 2,991 108,278 - - - 51,381 51,381 42,499 (11,069) 31,430
3407 Crane Union High School 1,782,167 58,962 380,093 352,081 - 791,136 - - - 145,033 145,033 319,341 (34,497) 284,844
3408 Burns Union High School - - - - - - - - - - - - - -
3409 Hood River County School District 36,608,838 1,211,180 7,807,785 7,232,370 - 16,251,335 - - - 1,174,289 1,174,289 6,559,834 (285,494) 6,274,340
3414 City of Phoenix School District 15,813,144 523,168 3,372,564 3,124,014 - 7,019,746 - - - 764,569 764,569 2,833,512 (189,551) 2,643,961
3415 Ashland Public Schools 34,567,392 1,143,640 7,372,394 6,829,066 - 15,345,100 - - - 1,913,036 1,913,036 6,194,033 (445,120) 5,748,913
3416 Central Point School District 6 49,369,235 1,633,350 10,529,271 9,753,289 70,352 21,986,262 - - - 2,075,248 2,075,248 8,846,333 (461,925) 8,384,408
3417 Eagle Point School District 9 42,429,378 1,403,749 9,049,167 8,382,265 - 18,835,181 - - - 1,959,979 1,959,979 7,602,800 (470,382) 7,132,418
3424 Rogue River School District 8,350,472 276,270 1,780,955 1,649,703 - 3,706,928 - - - 702,676 702,676 1,496,297 (170,834) 1,325,463
The accompanying notes are an integral part of this schedule.27

Employer
Number Employer Name Net Pension Liability
Differences between
Expected and
Actual Experience
Changes in
Assumptions
Net Differences
between Projected and
Actual Investment
Earnings
Changes in Employer
Proportion
Total Deferred
Outflows of
Resources
Differences between
Expected and
Actual Experience
Changes in
Assumptions
Net Differences
between Projected and
Actual Investment
Earnings
Changes in Employer
Proportion
Total Deferred
Inflows of Resources
Proportionate Share of
Plan Pension Expense
Net Amortization of
Deferred Amounts
from Changes in
Proportion Total Pension Expense*
Pension Expense
Oregon Public Employees Retirement System
Cost-Sharing Multiple-Employer Defined Benefit Pension Plan
Schedule of Pension Amounts by Employer
As of and for the Year Ended June 30, 2016
Deferred Outflows of Resources Deferred Inflows of Resources
3432 Prospect School District 2,718,858 89,952 579,867 537,132 18,708 1,225,659 - - - 271,181 271,181 487,184 (57,563) 429,621
3439 Butte Falls School District 2,825,714 93,487 602,657 558,242 10,480 1,264,866 - - - 74,180 74,180 506,332 (14,168) 492,164
3440 Pinehurst School 460,116 15,223 98,132 90,900 9,902 214,157 - - - 20,183 20,183 82,447 (1,782) 80,665
3445 Culver School District 4 8,279,537 273,923 1,765,826 1,635,689 45,595 3,721,033 - - - 126,738 126,738 1,483,587 (16,063) 1,467,524
3446 Ashwood School 89,190 2,951 19,022 17,620 31,984 71,577 - - - - - 15,982 7,438 23,420
3447 Madras School District 31,406,929 1,039,078 6,698,343 6,204,691 - 13,942,112 - - - 942,475 942,475 5,627,719 (233,681) 5,394,038
3451 Black Butte School District 504,283 16,684 107,552 99,625 - 223,861 - - - 3,522 3,522 90,361 (909) 89,452
3453 Josephine County School District Cu - - - - - - - - - - - - - -
3454 Grants Pass School District 77,998,913 2,580,545 16,635,294 15,409,313 - 34,625,152 - - - 3,456,687 3,456,687 13,976,404 (806,956) 13,169,448
3455 Klamath Falls School District 1 - - - - - - - - - - - - - -
3456 Klamath County School District 73,238,507 2,423,050 15,620,014 14,468,856 264,864 32,776,784 - - - 4,745,744 4,745,744 13,123,401 (1,025,761) 12,097,640
3457 Klamath Falls City Schools 39,639,152 1,311,436 8,454,079 7,831,033 - 17,596,548 - - - 2,718,359 2,718,359 7,102,827 (643,037) 6,459,790
3460 Union School District 5 - - - - - - - - - - - - - -
3461 Lake County School District 7 9,591,595 317,332 2,045,657 1,894,897 14,458 4,272,344 - - - 444,721 444,721 1,718,691 (99,172) 1,619,519
3462 Paisley School District 1,837,963 60,808 391,993 363,104 722 816,627 - - - 41,328 41,328 329,339 (9,398) 319,941
3463 North Lake School District 14 3,230,119 106,866 688,907 638,136 - 1,433,909 - - - 341,319 341,319 578,796 (80,867) 497,929
3464 Plush School District 230,137 7,614 49,083 45,465 2,191 104,353 - - - 14,325 14,325 41,238 (2,688) 38,550
3465 Adel School District 21 216,035 7,147 46,075 42,679 - 95,901 - - - 14,140 14,140 38,711 (3,371) 35,340
3470 Pleasant Hill School District 9,536,285 315,502 2,033,860 1,883,970 35,835 4,269,167 - - - 666,405 666,405 1,708,780 (144,438) 1,564,342
3473 Eugene School District 4J 171,972,020 5,689,586 36,677,499 33,974,456 - 76,341,541 - - - 6,050,990 6,050,990 30,815,179 (1,453,216) 29,361,963
3487 Springfield School District 19 86,349,181 2,856,808 18,416,205 17,058,975 - 38,331,988 - - - 110,825 110,825 15,472,665 (28,923) 15,443,742
3494 Fern Ridge School District 8,941,587 295,827 1,907,026 1,766,482 456,022 4,425,357 - - - 63,530 63,530 1,602,218 87,367 1,689,585
3498 Mapleton School District 3,325,857 110,034 709,325 657,050 - 1,476,409 - - - 308,877 308,877 595,951 (73,950) 522,001
3502 Creswell School District 40 12,903,169 426,893 2,751,936 2,549,125 - 5,727,954 - - - 398,326 398,326 2,312,082 (93,397) 2,218,685
3506 South Lane School District 15,908,640 526,327 3,392,931 3,142,880 915,421 7,977,559 - - - - - 2,850,624 235,350 3,085,974
3510 Bethel School District 64,047,150 2,118,960 13,659,718 12,653,030 - 28,431,708 - - - 1,025,598 1,025,598 11,476,427 (270,178) 11,206,249
3517 Crow-Applegate-Lorane District 66 3,986,888 131,904 850,307 787,642 - 1,769,853 - - - 269,119 269,119 714,399 (63,732) 650,667
3519 McKenzie School District 3,726,168 123,278 794,702 736,134 - 1,654,114 - - - 309,416 309,416 667,681 (72,489) 595,192
3520 Junction City School District 69 19,757,459 653,663 4,213,791 3,903,245 31,857 8,802,556 - - - 1,003,583 1,003,583 3,540,283 (224,023) 3,316,260
3522 Lowell School District 3,939,871 130,348 840,280 778,353 25,286 1,774,267 - - - 118,054 118,054 705,974 (20,018) 685,956
3524 Oakridge School District 6,829,680 225,956 1,456,607 1,349,258 - 3,031,821 - - - 224,815 224,815 1,223,791 (54,957) 1,168,834
3527 Marcola School District 79 2,872,908 95,048 612,722 567,566 - 1,275,336 - - - 128,823 128,823 514,788 (36,351) 478,437
3533 Triangle Lake Schools 3,724,377 123,219 794,320 735,781 46,459 1,699,779 - - - 219,456 219,456 667,361 (37,371) 629,990
3537 Siuslaw School District 97J 9,733,661 322,032 2,075,956 1,922,963 180,964 4,501,915 - - - 37,315 37,315 1,744,147 31,110 1,775,257
3579 Lincoln County School District - - - - - - - - - - - - - -
3582 Linn County School District 5 - - - - - - - - - - - - - -
3610 Harrisburg Elementary School District 42J - - - - - - - - - - - - - -
3613 Harris School - - - - - - - - - - - - - -
3615 Central Linn School District 552C 8,590,683 284,217 1,832,186 1,697,158 20,664 3,834,225 - - - 450,044 450,044 1,539,340 (98,584) 1,440,756
3618 Sweet Home School District 55 7,463,185 246,915 1,591,718 1,474,412 1,048,699 4,361,744 - - - - - 1,337,307 246,694 1,584,001
3626 Wyatt School District 63Cj - - - - - - - - - - - - - -
3647 Scio School District 95C 8,956,485 296,320 1,910,203 1,769,426 - 3,975,949 - - - 302,435 302,435 1,604,887 (73,684) 1,531,203
3665 Santiam Canyon School District 2,045,642 67,679 436,286 404,133 303,290 1,211,388 - - - 177,945 177,945 366,553 18,195 384,748
3676 Harrisburg High School - - - - - - - - - - - - - -
3684 Ontario School District 8C 21,559,605 713,286 4,598,146 4,259,273 15,933 9,586,638 - - - 651,392 651,392 3,863,205 (146,801) 3,716,404
3687 Juntura Grade School 140,069 4,634 29,873 27,672 11,385 73,564 - - - 26,185 26,185 25,099 (2,741) 22,358
3689 Vale School District 15 - - - - - - - - - - - - - -
3694 Nyssa School District 26 14,513,868 480,182 3,095,459 2,867,331 - 6,442,972 - - - 1,205,289 1,205,289 2,600,699 (284,067) 2,316,632
3696 Annex Elementary School 581,300 19,232 123,977 114,840 - 258,049 - - - 101,149 101,149 104,161 (23,527) 80,634
3707 Adrian School District 61 3,472,919 114,899 740,690 686,103 1,100 1,542,792 - - - 152,787 152,787 622,303 (35,209) 587,094
3709 Harper School District 66 1,671,188 55,290 356,424 330,157 21,136 763,007 - - - 139,769 139,769 299,455 (26,287) 273,168
3712 W W Jones School 252,329 8,348 53,816 49,850 154 112,168 - - - 13,742 13,742 45,214 (3,150) 42,064
3715 Vale High School - - - - - - - - - - - - - -
3720 Silverton RFD - - - - - - - - - - - - - -
3727 Aumsville Elementary - - - - - - - - - - - - - -
3729 Jefferson School District 14Cj 5,377,729 177,919 1,146,940 1,062,414 421,165 2,808,438 - - - - - 963,620 98,283 1,061,903
3730 North Marion School District 15 13,271,705 439,086 2,830,536 2,621,932 672,325 6,563,879 - - - 31,738 31,738 2,378,119 147,021 2,525,140
3732 Marion Elementary School - - - - - - - - - - - - - -
3735 Salem-Keizer Public Schools 330,485,474 10,933,904 70,484,610 65,290,064 3,687,109 150,395,687 - - - 4,696,793 4,696,793 59,218,756 (523,943) 58,694,813
3750 St Paul School District 4,049,789 133,985 863,723 800,068 - 1,797,776 - - - 358,582 358,582 725,670 (85,795) 639,875
3759 Eldriedge Elementary - - - - - - - - - - - - - -
3760 West Stayton School District - - - - - - - - - - - - - -
3761 Bethany Elementary - - - - - - - - - - - - - -
The accompanying notes are an integral part of this schedule.28

Employer
Number Employer Name Net Pension Liability
Differences between
Expected and
Actual Experience
Changes in
Assumptions
Net Differences
between Projected and
Actual Investment
Earnings
Changes in Employer
Proportion
Total Deferred
Outflows of
Resources
Differences between
Expected and
Actual Experience
Changes in
Assumptions
Net Differences
between Projected and
Actual Investment
Earnings
Changes in Employer
Proportion
Total Deferred
Inflows of Resources
Proportionate Share of
Plan Pension Expense
Net Amortization of
Deferred Amounts
from Changes in
Proportion Total Pension Expense*
Pension Expense
Oregon Public Employees Retirement System
Cost-Sharing Multiple-Employer Defined Benefit Pension Plan
Schedule of Pension Amounts by Employer
As of and for the Year Ended June 30, 2016
Deferred Outflows of Resources Deferred Inflows of Resources
3769 Scotts Mills School - - - - - - - - - - - - - -
3771 Gervais Elementary School - - - - - - - - - - - - - -
3772 Stayton School District 77J - - - - - - - - - - - - - -
3780 Mt Angel School District 91 9,402,412 311,073 2,005,309 1,857,522 834 4,174,738 - - - 189,050 189,050 1,684,792 (43,719) 1,641,073
3781 Silver Crest School District 93 - - - - - - - - - - - - - -
3786 Woodburn School District 74,095,772 2,451,412 15,802,848 14,638,216 - 32,892,476 - - - 2,850,531 2,850,531 13,277,012 (680,615) 12,596,397
3794 Detroit School District 123J - - - - - - - - - - - - - -
3804 Monitor School District 142J - - - - - - - - - - - - - -
3806 Cloverdale School District 144 - - - - - - - - - - - - - -
3809 Morrow County Schools 17,982,291 594,933 3,835,190 3,552,546 - 7,982,669 - - - 439,431 439,431 3,222,196 (110,427) 3,111,769
3818 Portland Public Schools 207,202,551 6,855,166 44,191,325 40,934,531 58,792,706 150,773,728 - - - - - 37,128,038 13,709,875 50,837,913
3820 Parkrose School District 41,925,383 1,387,075 8,941,677 8,282,697 - 18,611,449 - - - 2,911,929 2,911,929 7,512,491 (706,807) 6,805,684
3821 Gresham Grade School District 4 - - - - - - - - - - - - - -
3823 Orient School - - - - - - - - - - - - - -
3824 Reynolds School District 82,744,959 2,737,565 17,647,511 16,346,932 4,495,080 41,227,088 - - - 132,824 132,824 14,826,835 1,006,301 15,833,136
3842 Corbett School District 39 12,928,284 427,724 2,757,292 2,554,087 770,715 6,509,818 - - - - - 2,316,583 185,111 2,501,694
3843 David Douglas School Dist 148,520,503 4,913,707 31,675,854 29,341,420 1,171,832 67,102,813 - - - 4,274,734 4,274,734 26,612,968 (649,467) 25,963,501
3847 Riverdale School 6,095,584 201,669 1,300,042 1,204,232 333,665 3,039,608 - - - - - 1,092,250 78,146 1,170,396
3848 Barlow-Gresham Uhs District U2-20Jt - - - - - - - - - - - - - -
3850 Dallas School Dist 34,801,961 1,151,401 7,422,422 6,875,407 36,670 15,485,900 - - - 1,221,602 1,221,602 6,236,065 (273,308) 5,962,757
3859 Central School District 13J 17,619,721 582,937 3,757,863 3,480,918 1,127,219 8,948,937 - - - - - 3,157,228 271,026 3,428,254
3865 Perrydale School District 21 3,965,051 131,181 845,650 783,328 - 1,760,159 - - - 162,407 162,407 710,486 (42,515) 667,971
3887 Falls City School District 360,700 11,934 76,929 71,259 56,859 216,981 - - - - - 64,633 13,576 78,209
3894 Sherman County School District 9 - - - - - - - - - - - - - -
3902 Tillamook Public Schools 6,815,443 225,485 1,453,570 1,346,445 1,152,992 4,178,492 - - - - - 1,221,240 270,542 1,491,782
3920 Neah-Kah-Nie School District 13,953,452 461,641 2,975,936 2,756,617 - 6,194,194 - - - 834,929 834,929 2,500,280 (197,390) 2,302,890
3927 Echo School District 2,315,280 76,600 493,794 457,402 78,492 1,106,288 - - - 22,424 22,424 414,868 11,658 426,526
3928 Umatilla School District 6R 13,135,426 434,577 2,801,471 2,595,009 21,294 5,852,351 - - - 384,581 384,581 2,353,700 (83,174) 2,270,526
3929 Ferndale School District 10 - - - - - - - - - - - - - -
3931 Pendleton School District 16R 12,016,664 397,564 2,562,866 2,373,989 1,467,213 6,801,632 - - - - - 2,153,232 361,874 2,515,106
3935 Athena-Weston School District 29Rj 7,787,848 257,656 1,660,961 1,538,552 24,716 3,481,885 - - - 214,220 214,220 1,395,482 (42,550) 1,352,932
3936 Milton-Freewater Elementary School District 31 - - - - - - - - - - - - - -
3942 Stanfield School District 2,982,087 98,660 636,007 589,135 245,152 1,568,954 - - - 47,537 47,537 534,352 43,030 577,382
3944 Ukiah School 953,712 31,553 203,404 188,413 - 423,370 - - - 75,014 75,014 170,893 (19,135) 151,758
3957 Helix School District 2,220,758 73,472 473,634 438,729 - 985,835 - - - 38,637 38,637 397,931 (9,856) 388,075
3958 Pilot Rock School District 2R 2,617,669 86,604 558,286 517,141 69,316 1,231,347 - - - - - 469,053 19,163 488,216
3959 Mcloughlin Union High School District - - - - - - - - - - - - - -
3965 La Grande Public Schools 14,014,689 463,667 2,988,996 2,768,714 133,634 6,355,011 - - - 89,033 89,033 2,511,252 4,892 2,516,144
3966 Union County School District 2,230,010 73,778 475,608 440,556 99,285 1,089,227 - - - 95,409 95,409 399,589 (4,971) 394,618
3967 North Powder School District 3,187,629 105,461 679,845 629,742 - 1,415,048 - - - 204,711 204,711 571,182 (50,925) 520,257
3969 Imbler School District 3,887,309 128,609 829,070 767,969 - 1,725,648 - - - 208,509 208,509 696,556 (50,402) 646,154
3970 Cove School District 3,058,720 101,196 652,351 604,275 - 1,357,822 - - - 381,539 381,539 548,083 (88,973) 459,110
3973 Elgin School District 23 4,310,824 142,621 919,395 851,638 - 1,913,654 - - - 249,200 249,200 772,444 (64,866) 707,578
3986 Joseph School District 6 3,773,580 124,847 804,814 745,501 - 1,675,162 - - - 153,840 153,840 676,177 (36,176) 640,001
3990 Wallowa School 3,040,876 100,605 648,546 600,750 5,934 1,355,835 - - - 411,560 411,560 544,886 (93,967) 450,919
3993 Enterprise School District 21 4,426,329 146,442 944,030 874,457 - 1,964,929 - - - 406,927 406,927 793,141 (97,768) 695,373
4003 Troy School District 54 121,246 4,011 25,859 23,953 12,054 65,877 - - - 6,223 6,223 21,726 2,098 23,824
4008 Chenowith School District - - - - - - - - - - - - - -
4012 Dufur Schools 4,094,423 135,461 873,242 808,886 - 1,817,589 - - - 90,093 90,093 733,668 (21,517) 712,151
4022 Maupin Grade School 84 - - - - - - - - - - - - - -
4025 West Union School District 1 - - - - - - - - - - - - - -
4030 Hillsboro Elementary School District 7 - - - - - - - - - - - - - -
4034 Gaston Public Schools 3,454,313 114,284 736,722 682,427 805,014 2,338,447 - - - 21,655 21,655 618,969 180,843 799,812
4035 Banks School District 8,670,228 286,849 1,849,151 1,712,873 - 3,848,873 - - - 76,149 76,149 1,553,594 (17,849) 1,535,745
4047 Reedville School District 29 - - - - - - - - - - - - - -
4055 Groner School - - - - - - - - - - - - - -
4062 Beaverton School District 336,425,374 11,130,422 71,751,448 66,463,539 10,017,386 159,362,795 - - - 8,835,901 8,835,901 60,283,110 (269,169) 60,013,941
4080 North Plains School District 70 - - - - - - - - - - - - - -
4105 Hillsboro Union High School - - - - - - - - - - - - - -
4109 Spray School District 1 1,243,092 41,127 265,122 245,583 - 551,832 - - - 29,937 29,937 222,746 (8,544) 214,202
4114 Fossil School District 21J 2,105,510 69,659 449,055 415,960 - 934,674 - - - 84,109 84,109 377,280 (19,844) 357,436
4128 Yamhill Grade School - - - - - - - - - - - - - -
4135 Newberg School District 29Jt 29,584,266 978,777 6,309,613 5,844,610 1,444,910 14,577,910 - - - - - 5,301,121 349,335 5,650,456
The accompanying notes are an integral part of this schedule.29

Employer
Number Employer Name Net Pension Liability
Differences between
Expected and
Actual Experience
Changes in
Assumptions
Net Differences
between Projected and
Actual Investment
Earnings
Changes in Employer
Proportion
Total Deferred
Outflows of
Resources
Differences between
Expected and
Actual Experience
Changes in
Assumptions
Net Differences
between Projected and
Actual Investment
Earnings
Changes in Employer
Proportion
Total Deferred
Inflows of Resources
Proportionate Share of
Plan Pension Expense
Net Amortization of
Deferred Amounts
from Changes in
Proportion Total Pension Expense*
Pension Expense
Oregon Public Employees Retirement System
Cost-Sharing Multiple-Employer Defined Benefit Pension Plan
Schedule of Pension Amounts by Employer
As of and for the Year Ended June 30, 2016
Deferred Outflows of Resources Deferred Inflows of Resources
4142 McMinnville Schools 61,102,578 2,021,540 13,031,712 12,071,306 7,760 27,132,318 - - - 714,915 714,915 10,948,798 (163,977) 10,784,821
4144 Sheridan School District 48J 11,150,657 368,912 2,378,167 2,202,902 - 4,949,981 - - - 803,059 803,059 1,998,055 (187,600) 1,810,455
4166 Yamhill-Carlton School District 1 3,233,657 106,984 689,661 638,835 827,288 2,262,768 - - - 3,938 3,938 579,430 191,234 770,664
4185 Lebanon School District Uh-1 - - - - - - - - - - - - - -
4189 Wasco County High School - - - - - - - - - - - - - -
4203 Victor Point School - - - - - - - - - - - - - -
4218 Curry County Education Service District - - - - - - - - - - - - - -
4219 Grant County Education Service District 1,793,575 59,339 382,526 354,335 16,383 812,583 - - - 71,117 71,117 321,386 (11,720) 309,666
4220 Jefferson County Education Service District 2,133,008 70,569 454,919 421,393 - 946,881 - - - 214,001 214,001 382,208 (51,454) 330,754
4221 Marion Education Service District - - - - - - - - - - - - - -
4223 InterMountain Education Service District 13,466,117 445,518 2,871,999 2,660,340 - 5,977,857 - - - 973,566 973,566 2,412,955 (238,838) 2,174,117
4224 Wallowa County Region 18 2,535,503 83,886 540,762 500,909 9,140 1,134,697 - - - 147,892 147,892 454,330 (31,705) 422,625
4225 Washington County Education Service District - - - - - - - - - - - - - -
4226 North Central Education Service District 1,901,467 62,909 405,537 375,650 - 844,096 - - - 76,484 76,484 340,718 (17,797) 322,921
4227 Cascade School District Uh5 - - - - - - - - - - - - - -
4230 Mari-Linn School District - - - - - - - - - - - - - -
4232 South Coast Education Service District Region 7 10,892,869 360,384 2,323,187 2,151,974 - 4,835,545 - - - 882,598 882,598 1,951,862 (219,324) 1,732,538
4237 Douglas Education Service District 18,625,043 616,198 3,972,274 3,679,527 - 8,267,999 - - - 414,000 414,000 3,337,369 (99,978) 3,237,391
4238 Multnomah Education Service District 19,559,260 647,106 4,171,520 3,864,089 - 8,682,715 - - - 2,626,541 2,626,541 3,504,768 (772,029) 2,732,739
4251 Clatsop County Education Service District - - - - - - - - - - - - - -
4252 High Desert Education Service District 18,048,172 597,112 3,849,241 3,565,562 - 8,011,915 - - - 290,266 290,266 3,234,001 (77,790) 3,156,211
4254 Willamette Education Service District 14,129,940 467,480 3,013,577 2,791,483 774,665 7,047,205 - - - 459,202 459,202 2,531,904 45,096 2,577,000
4258 Hermiston School District 8R 35,017,593 1,158,535 7,468,411 6,918,007 188,820 15,733,773 - - - 1,330,945 1,330,945 6,274,703 (253,986) 6,020,717
4259 Clackamas Education Service District 22,315,470 738,293 4,759,353 4,408,601 150,649 10,056,896 - - - 1,487,004 1,487,004 3,998,646 (301,507) 3,697,139
4260 Greater Albany School District 8J 77,545,566 2,565,546 16,538,606 15,319,750 183,166 34,607,068 - - - 115,850 115,850 13,895,170 8,524 13,903,694
4268 Lake Oswego School District 46,194,321 1,528,310 9,852,139 9,126,060 885,729 21,392,238 - - - 75,142 75,142 8,277,430 183,884 8,461,314
4270 Silver Falls School District 29,036,255 960,646 6,192,735 5,736,346 80,734 12,970,461 - - - 17,309 17,309 5,202,924 19,720 5,222,644
4271 Malheur Education Service District Region 14 4,207,064 139,188 897,266 831,139 - 1,867,593 - - - 326,161 326,161 753,852 (76,328) 677,524
4272 Linn-Benton-Lincoln Education Service District 27,291,643 902,927 5,820,652 5,391,684 - 12,115,263 - - - 1,152,057 1,152,057 4,890,312 (275,596) 4,614,716
4273 Double O School District 91,093 3,014 19,428 17,996 - 40,438 - - - 4,062 4,062 16,323 (966) 15,357
4275 Tillamook County Education Service District - - - - - - - - - - - - - -
4276 Lane County Education Service District 12,789,725 423,140 2,727,741 2,526,713 - 5,677,594 - - - 1,189,466 1,189,466 2,291,755 (330,262) 1,961,493
4277 Mitchell School 1,428,334 47,256 304,629 282,179 - 634,064 - - - 88,785 88,785 255,939 (21,371) 234,568
4279 St Helens School District 502 11,541,722 381,851 2,461,572 2,280,160 1,851,623 6,975,206 - - - - - 2,068,129 435,344 2,503,473
4280 Northwest Regional Education Service District 61,372,959 2,030,486 13,089,377 12,124,722 - 27,244,585 - - - 5,410,300 5,410,300 10,997,247 (1,278,689) 9,718,558
4286 Southern Oregon Education Service District 27,066,071 895,464 5,772,543 5,347,120 - 12,015,127 - - - 2,825,053 2,825,053 4,849,893 (671,016) 4,178,877
4288 Medford School District 549C 115,808,845 3,831,463 24,699,244 22,878,969 601,880 52,011,556 - - - 3,220,341 3,220,341 20,751,459 (571,894) 20,179,565
4291 Dayton Public Schools 5,145,781 170,245 1,097,471 1,016,590 197,256 2,481,562 - - - 142,854 142,854 922,058 3,857 925,915
4293 Lake County Education Service District 1,357,674 44,918 289,559 268,219 26,621 629,317 - - - - - 243,278 7,194 250,472
4294 Harney Education Service District Region XVII 2,839,542 93,944 605,606 560,974 - 1,260,524 - - - 81,779 81,779 508,809 (21,888) 486,921
4295 Wasco County Education Service District 2,943,124 97,371 627,698 581,438 10,867 1,317,374 - - - 51,959 51,959 527,370 (8,888) 518,482
4297 Yamhill Education Service District - - - - - - - - - - - - - -
4306 Amity School District 3,067,831 101,497 654,295 606,075 613,289 1,975,156 - - - - - 549,716 142,886 692,602
4307 Columbia School District 5J - - - - - - - - - - - - - -
4309 Scappoose School District 23,160,153 766,239 4,939,504 4,575,475 - 10,281,218 - - - 1,409,630 1,409,630 4,150,002 (328,164) 3,821,838
4311 Redmond School District 2J 56,753,427 1,877,651 12,104,142 11,212,096 543,406 25,737,295 - - - - - 10,169,486 138,491 10,307,977
4312 Reedsport School District 3,607,698 119,358 769,435 712,730 360,090 1,961,613 - - - 144,933 144,933 646,453 41,114 687,567
4313 Forest Grove School District 54,217,010 1,793,736 11,563,185 10,711,006 876,144 24,944,071 - - - 225,833 225,833 9,714,992 137,332 9,852,324
4314 Willamina School District 30J 7,978,145 263,952 1,701,547 1,576,147 - 3,541,646 - - - 274,706 274,706 1,429,581 (63,929) 1,365,652
4315 John Day School District 4,806,022 159,004 1,025,009 949,468 - 2,133,481 - - - 95,368 95,368 861,178 (26,646) 834,532
4316 Tigard-Tualatin School District 23J 126,576,120 4,187,691 26,995,645 25,006,131 - 56,189,467 - - - 5,649,594 5,649,594 22,680,817 (1,364,475) 21,316,342
4317 Sherwood School District 88J 48,808,318 1,614,792 10,409,641 9,642,476 - 21,666,909 - - - 1,825,641 1,825,641 8,745,824 (445,929) 8,299,895
4320 Rainier School District 13 6,440,696 213,086 1,373,646 1,272,411 276,061 3,135,204 - - - 82,931 82,931 1,154,090 39,809 1,193,899
4321 North Clackamas School District 12 94,982,200 3,142,426 20,257,421 18,764,497 4,943,006 47,107,350 - - - 111,067 111,067 17,019,591 1,116,869 18,136,460
4323 Estacada School District 108 12,964,943 428,937 2,765,111 2,561,329 - 5,755,377 - - - 718,418 718,418 2,323,151 (194,123) 2,129,028
4324 Centennial School District 28 88,118,509 2,915,345 18,793,560 17,408,520 75,667 39,193,092 - - - 4,338,246 4,338,246 15,789,706 (986,640) 14,803,066
4326 Harney County School District 3 - - - - - - - - - - - - - -
4327 Jordan Valley School District 3 1,120,682 37,077 239,015 221,400 - 497,492 - - - 206,804 206,804 200,812 (50,800) 150,012
4329 Gervais School District 1 5,209,686 172,359 1,111,101 1,029,215 311,775 2,624,450 - - - 13,787 13,787 933,509 68,451 1,001,960
4330 Vale School District 84 12,734,478 421,312 2,715,958 2,515,799 - 5,653,069 - - - 468,154 468,154 2,281,855 (110,643) 2,171,212
4331 Molalla River School District 4,353,052 144,018 928,401 859,981 1,561,009 3,493,409 - - - - - 780,011 363,025 1,143,036
4332 Gresham-Barlow School District 10 80,413,921 2,660,444 17,150,357 15,886,417 198,908 35,896,126 - - - 237,029 237,029 14,409,143 (23,456) 14,385,687
4333 Canby School District 18,511,014 612,425 3,947,954 3,657,000 771,531 8,988,910 - - - 842,429 842,429 3,316,936 (68,347) 3,248,589
The accompanying notes are an integral part of this schedule.30

Employer
Number Employer Name Net Pension Liability
Differences between
Expected and
Actual Experience
Changes in
Assumptions
Net Differences
between Projected and
Actual Investment
Earnings
Changes in Employer
Proportion
Total Deferred
Outflows of
Resources
Differences between
Expected and
Actual Experience
Changes in
Assumptions
Net Differences
between Projected and
Actual Investment
Earnings
Changes in Employer
Proportion
Total Deferred
Inflows of Resources
Proportionate Share of
Plan Pension Expense
Net Amortization of
Deferred Amounts
from Changes in
Proportion Total Pension Expense*
Pension Expense
Oregon Public Employees Retirement System
Cost-Sharing Multiple-Employer Defined Benefit Pension Plan
Schedule of Pension Amounts by Employer
As of and for the Year Ended June 30, 2016
Deferred Outflows of Resources Deferred Inflows of Resources
4334 Cascade School District 5 11,166,021 369,421 2,381,444 2,205,937 1,030,885 5,987,687 - - - - - 2,000,808 242,604 2,243,412
4335 Milton-Freewater Unified School District 7 7,970,088 263,685 1,699,828 1,574,555 630,788 4,168,856 - - - 151,462 151,462 1,428,138 102,148 1,530,286
4336 Nestucca Valley School District 101 5,600,204 185,279 1,194,389 1,106,365 82,076 2,568,109 - - - 354,382 354,382 1,003,485 (58,275) 945,210
4337 Sherman County School District 3,444,358 113,954 734,599 680,461 - 1,529,014 - - - 201,214 201,214 617,185 (51,595) 565,590
4338 Three Rivers U J School District 36,591,868 1,210,619 7,804,166 7,229,018 137,155 16,380,958 - - - 368,605 368,605 6,556,793 (76,518) 6,480,275
4339 Lebanon Community School District 41,360,281 1,368,379 8,821,154 8,171,056 - 18,360,589 - - - 3,441,597 3,441,597 7,411,232 (826,289) 6,584,943
4340 Monroe School District 1J 3,873,160 128,141 826,052 765,174 - 1,719,367 - - - 271,642 271,642 694,020 (66,566) 627,454
4341 Hillsboro School District 1J 167,229,488 5,532,682 35,666,031 33,037,530 3,434,567 77,670,810 - - - 4,478,166 4,478,166 29,965,378 (518,370) 29,447,008
4342 North Santiam School District 29J 11,491,769 380,198 2,450,918 2,270,291 544,094 5,645,501 - - - 270,444 270,444 2,059,178 46,990 2,106,168
4343 Harrisburg School District 7 10,875,728 359,817 2,319,531 2,148,587 2,348 4,830,283 - - - 537,702 537,702 1,948,791 (124,356) 1,824,435
4344 South Wasco County School District 1 3,610,719 119,458 770,080 713,327 8,515 1,611,380 - - - 197,918 197,918 646,994 (43,522) 603,472
4345 Oregon Trail School District 46 47,886,698 1,584,301 10,213,082 9,460,402 - 21,257,785 - - - 2,464,640 2,464,640 8,580,682 (578,162) 8,002,520
4346 Knappa School District 4 6,284,132 207,907 1,340,254 1,241,481 - 2,789,642 - - - 232,473 232,473 1,126,036 (59,144) 1,066,892
4347 Clatskanie School District 6J 9,484,115 313,776 2,022,734 1,873,663 - 4,210,173 - - - 778,019 778,019 1,699,432 (181,561) 1,517,871
4348 Lourdes Charter School 392,820 12,996 83,779 77,605 3,147 177,527 - - - 22,639 22,639 70,388 (4,339) 66,049
4350 Ridgeline Montessori 1,837,890 60,805 391,978 363,090 2,757 818,630 - - - 41,003 41,003 329,326 (8,725) 320,601
4351 The Village School 428,976 14,192 91,490 84,748 - 190,430 - - - 97,489 97,489 76,867 (28,494) 48,373
4352 Armadillo Technical Institute 1,093,768 36,187 233,274 216,083 113,937 599,481 - - - 43,671 43,671 195,989 13,652 209,641
4354 Opal Charter School 441,801 14,617 94,225 87,281 14,785 210,908 - - - 26,003 26,003 79,165 (4,210) 74,955
4355 Three Rivers Charter School 1,307,671 43,263 278,895 258,341 4,381 584,880 - - - 88,906 88,906 234,318 (19,387) 214,931
4358 Detroit Lake Charter School - - - - - - - - - - - - - -
4360 Luckiamute Valley Charter School 1,736,942 57,466 370,448 343,147 46,543 817,604 - - - 88,994 88,994 311,238 (7,007) 304,231
4361 Rimrock Expeditionary Alternative Learning 1,541,567 51,002 328,779 304,549 1,232 685,562 - - - 22,010 22,010 276,229 (4,756) 271,473
4362 Kings Valley Charter School 95,666 3,165 20,403 18,900 4,547 47,015 - - - 4,602 4,602 17,142 (296) 16,846
4363 Multisensory Learning Academy 2,334,770 77,244 497,950 461,253 49,711 1,086,158 - - - - - 418,361 12,388 430,749
4365 Mitch Charter School 1,486,963 49,195 317,133 293,761 419 660,508 - - - 70,011 70,011 266,445 (16,159) 250,286
4366 Sand Ridge Charter School 1,945,183 64,355 414,861 384,286 - 863,502 - - - 69,126 69,126 348,552 (17,798) 330,754
4367 Arthur Academy Charter School 911,982 30,172 194,504 180,169 - 404,845 - - - 2,072,776 2,072,776 163,415 (482,982) (319,567)
4369 Trillium Charter School 1,841,547 60,926 392,758 363,812 9,917 827,413 - - - 121,890 121,890 329,982 (25,429) 304,553
4370 Howard Street Charter School, Inc. 409,370 13,544 87,309 80,874 14,069 195,796 - - - 41,489 41,489 73,354 (5,510) 67,844
4371 The Lighthouse School 1,592,554 52,689 339,653 314,622 - 706,964 - - - 133,457 133,457 285,365 (31,039) 254,326
4373 Sheridan Japanese School Foundation 583,307 19,298 124,405 115,237 10,704 269,644 - - - 111,011 111,011 104,521 (22,669) 81,852
4374 Ione School District 3,475,216 114,975 741,180 686,557 19,463 1,562,175 - - - 45,117 45,117 622,714 (4,768) 617,946
4375 Eddyville Charter School 1,701,911 56,307 362,977 336,226 25,294 780,804 - - - 115,937 115,937 304,961 (19,523) 285,438
4376 Four Rivers Community School 2,399,293 79,379 511,712 474,000 - 1,065,091 - - - 46,791 46,791 429,923 (12,707) 417,216
4378 Mosier Community School 1,550,979 51,313 330,786 306,408 - 688,507 - - - 72,240 72,240 277,915 (17,027) 260,888
4379 Siletz Valley School 2,044,106 67,628 435,959 403,830 7,394 914,811 - - - 33,014 33,014 366,278 (7,990) 358,288
4380 The Emerson School 1,009,244 33,390 215,247 199,384 11,809 459,830 - - - 76,834 76,834 180,844 (14,395) 166,449
4381 North Wasco County School District 21 21,031,777 695,823 4,485,573 4,154,997 163,193 9,499,586 - - - 214,280 214,280 3,768,624 (25,072) 3,743,552
4382 Self Enhancement Inc 859,597 28,439 183,331 169,820 8,315 389,905 - - - 132,493 132,493 154,029 (28,367) 125,662
4383 City View Charter School 1,497,300 49,537 319,338 295,804 - 664,679 - - - 7,881 7,881 268,297 (2,098) 266,199
4386 Nixyaawii Community School 922,573 30,523 196,763 182,262 23,934 433,482 - - - 120,726 120,726 165,313 (21,037) 144,276
4388 West Lane Tech 745,248 24,656 158,943 147,230 4,224 335,053 - - - 16,721 16,721 133,539 (2,645) 130,894
4390 Oregon Connections Academy 15,715,745 519,946 3,351,791 3,104,772 209,863 7,186,372 - - - - - 2,816,060 55,965 2,872,025
4392 Eagleridge High School 1,402,541 46,402 299,128 277,083 - 622,613 - - - 226,670 226,670 251,317 (54,309) 197,008
4393 Cascade Heights Public Charter School 1,384,770 45,814 295,338 273,572 - 614,724 - - - 139,699 139,699 248,133 (33,820) 214,313
4395 Siletz Valley Early College Academy 642,187 21,246 136,963 126,869 - 285,078 - - - 58,260 58,260 115,072 (14,806) 100,266
4396 Sweet Home Charter School 1,147,736 37,972 244,784 226,744 - 509,500 - - - 56,469 56,469 205,659 (14,380) 191,279
4397 Springwater Environmental Sciences School 1,872,780 61,960 399,419 369,983 33,227 864,589 - - - - - 335,578 7,966 343,544
4398 LEP High 3,982,745 131,767 849,424 786,823 20,729 1,788,743 - - - 71,939 71,939 713,657 (10,633) 703,024
4400 Phoenix School 61,121 2,022 13,036 12,075 9,330 36,463 - - - - - 10,952 2,423 13,375
4401 Ballston Community School 556,986 18,428 118,792 110,037 13,567 260,824 - - - 45,224 45,224 99,805 (6,526) 93,279
4402 Sage Community School 613,762 20,306 130,901 121,254 57,693 330,154 - - - 14,004 14,004 109,978 13,711 123,689
4403 Portland Village School 2,618,418 86,629 558,446 517,289 48,669 1,211,033 - - - 81,217 81,217 469,187 (4,573) 464,614
4404 Alliance Charter Academy 3,503,435 115,909 747,198 692,132 37,908 1,593,147 - - - 27,842 27,842 627,771 4,675 632,446
4405 Forest Grove Community School 1,591,710 52,661 339,473 314,455 69,179 775,768 - - - 6,227 6,227 285,214 14,256 299,470
4407 Madrone Trail Public Charter School 1,726,683 57,126 368,260 341,120 73,496 840,002 - - - - - 309,399 17,157 326,556
4408 Muddy Creek Charter School 645,839 21,367 137,742 127,591 72,237 358,937 - - - - - 115,726 17,144 132,870
4409 Southwest Charter School 1,190,374 39,383 253,878 235,168 35,458 563,887 - - - 128,148 128,148 213,300 (19,373) 193,927
4410 Ace Academy 966,761 31,985 206,187 190,991 25,211 454,374 - - - 26,641 26,641 173,231 (1,972) 171,259
4411 Sherwood Charter School 1,110,544 36,742 236,852 219,397 25,416 518,407 - - - 29,332 29,332 198,995 654 199,649
4412 Estacada Web Academy 3,412,538 112,902 727,812 674,174 - 1,514,888 - - - 34,020 34,020 611,483 (8,712) 602,771
4418 Lewis And Clark Montessori Charter School 1,764,885 58,390 376,407 348,667 85,163 868,627 - - - 232,772 232,772 316,245 (29,085) 287,160
The accompanying notes are an integral part of this schedule.31

Employer
Number Employer Name Net Pension Liability
Differences between
Expected and
Actual Experience
Changes in
Assumptions
Net Differences
between Projected and
Actual Investment
Earnings
Changes in Employer
Proportion
Total Deferred
Outflows of
Resources
Differences between
Expected and
Actual Experience
Changes in
Assumptions
Net Differences
between Projected and
Actual Investment
Earnings
Changes in Employer
Proportion
Total Deferred
Inflows of Resources
Proportionate Share of
Plan Pension Expense
Net Amortization of
Deferred Amounts
from Changes in
Proportion Total Pension Expense*
Pension Expense
Oregon Public Employees Retirement System
Cost-Sharing Multiple-Employer Defined Benefit Pension Plan
Schedule of Pension Amounts by Employer
As of and for the Year Ended June 30, 2016
Deferred Outflows of Resources Deferred Inflows of Resources
4419 Silvies River Web Academy 406,702 13,455 86,740 80,347 - 180,542 - - - 29,304 29,304 72,876 (6,852) 66,024
4420 Oregon Virtual Academy 6,195,839 204,985 1,321,424 1,224,038 358,259 3,108,706 - - - - - 1,110,215 88,468 1,198,683
4421 Home Scholars Academy of Oakridge and Westfir 59,410 1,966 12,671 11,737 21,304 47,678 - - - - - 10,645 4,955 15,600
4422 Redmond Proficiency Academy 5,429,146 179,620 1,157,906 1,072,571 62,619 2,472,716 - - - - - 972,833 18,156 990,989
4423 Molalla River Academy 1,238,902 40,988 264,228 244,755 24,893 574,864 - - - 51,277 51,277 221,995 (4,604) 217,391
4424 The Ivy School 796,794 26,361 169,937 157,413 3,931 357,642 - - - 22,715 22,715 142,775 (4,126) 138,649
4429 Clackamas Web Academy 45,797 1,515 9,767 9,047 - 20,329 - - - 7,170 7,170 8,206 (1,715) 6,491
4430 Clackamas Charter Alliance 2 184,917 6,118 39,438 36,532 2,066 84,154 - - - 22,921 22,921 33,135 (4,724) 28,411
4431 Corbett Charter School 1,856,856 61,433 396,023 366,837 4,989 829,282 - - - 504,134 504,134 332,725 (115,772) 216,953
4432 Renaissance Public Academy 285,531 9,447 60,897 56,409 18,527 145,280 - - - 273,032 273,032 51,164 (58,047) (6,883)
4433 Powell Butte Community Charter School 1,443,453 47,756 307,854 285,166 48,293 689,069 - - - - - 258,648 12,169 270,817
4434 Logos Public Charter School 6,367,383 210,661 1,358,010 1,257,928 134,015 2,960,614 - - - - - 1,140,953 37,956 1,178,909
4435 Sunny Wolf Charter School 642,334 21,251 136,994 126,898 33,772 318,915 - - - 51,539 51,539 115,098 (2,053) 113,045
4436 Academy Of Arts & Academics 1,222,706 40,452 260,774 241,555 27,707 570,488 - - - - - 219,093 7,366 226,459
4437 Center for Advance Learning 1,543,861 51,078 329,268 305,002 - 685,348 - - - 62,958 62,958 276,640 (14,893) 261,747
4439 Homesource Family Charter - - - - - - - - - 138,387 138,387 - (39,431) (39,431)
4440 Sheridan Allprep Academy 485,084 16,049 103,457 95,832 16,980 232,318 - - - 51,864 51,864 86,921 (7,068) 79,853
4441 Baker Web Academy 3,992,347 132,084 851,472 788,720 387,585 2,159,861 - - - - - 715,377 93,778 809,155
4443 Knova Learning Oregon 2,025,365 67,008 431,962 400,127 26,631 925,728 - - - 332,190 332,190 362,919 (69,422) 293,497
4444 Bennett Pearson Academy, Inc. 957,220 31,669 204,152 189,107 80,462 505,390 - - - 20,569 20,569 171,522 12,662 184,184
4446 Coburg Community Charter School 1,262,550 41,771 269,272 249,427 11,769 572,239 - - - 22,880 22,880 226,233 (1,859) 224,374
4447 Arco Iris Spanish Immersion Charter School 1,175,956 38,906 250,803 232,320 - 522,029 - - - 68,134 68,134 210,716 (16,780) 193,936
4448 Gresham Barlow Web Academy 2,665,902 88,200 568,573 526,670 178,980 1,362,423 - - - - - 477,695 45,956 523,651
4449 Mosier Middle School 703,680 23,281 150,078 139,018 16,949 329,326 - - - - - 126,090 4,574 130,664
4450 Sauvie Island Academy 2,147,933 71,063 458,102 424,341 67,131 1,020,637 - - - 23,510 23,510 384,882 14,276 399,158
4451 River's Edge Academy Charter School 1,026,954 33,976 219,025 202,883 55,343 511,227 - - - - - 184,017 14,167 198,184
4452 South Columbia Family School 252,408 8,351 53,833 49,865 - 112,049 - - - 9,441 9,441 45,228 (2,355) 42,873
4453 Woodland Educational Initiative 825,382 27,307 176,034 163,061 161,391 527,793 - - - - - 147,898 39,560 187,458
4454 Le Monde Immersion Charter School 1,090,530 36,079 232,584 215,443 94,355 578,461 - - - 66,467 66,467 195,409 12,295 207,704
4455 Hope Chinese Charter School 1,169,203 38,682 249,363 230,985 198,960 717,990 - - - - - 209,506 50,028 259,534
4456 Insight School of Oregon Charter 2,029,228 67,136 432,785 400,890 316,184 1,216,995 - - - - - 363,612 81,815 445,427
4457 Oregon Virtual Education East 138,709 4,589 29,583 27,403 19,775 81,350 - - - - - 24,855 5,091 29,946
4458 Oregon Virtual Education West 83,066 2,748 17,716 16,410 - 36,874 - - - 18,392 18,392 14,884 (4,388) 10,496
4459 Crater Lake Charter Academy 689,484 22,811 147,050 136,213 247,249 553,323 - - - - - 123,547 57,500 181,047
4460 Kairos PDX 95,004 3,143 20,262 18,769 34,068 76,242 - - - - - 17,023 7,923 24,946
4461 Mountain View Academy 252,426 8,351 53,836 49,869 90,520 202,576 - - - - - 45,232 21,051 66,283
4462 Bend International School - - - - - - - - - - - - - -
4463 Dallas Community School-Community Innovation Partners - - - - - - - - - - - - - -
4464 The Valley School Of Southern Oregon - - - - - - - - - - - - - -
Total for All Entities 15,012,321,925$ 496,673,216$ 3,201,767,517$ 2,965,804,936$ 274,599,936$ 6,938,845,605$ -$ -$ -$ 274,599,936$ 274,599,936$ 2,690,015,452$ -$ 2,690,015,452$
* Excludes employer specific amounts due to contributions subsequent to the measurement date and differences between actual employer contributions and the employer's proportionate share of contributions. Proper treatment of such amounts is the responsibility of the employer.
The accompanying notes are an integral part of this schedule.32

Oregon Public Employees Retirement System Cost-Sharing Multiple-Employer Defined Benefit Pension Plan
Notes to the Schedules of Employer Allocations and Pension Amounts by Employer
As of and for the Year Ended June 30, 2016
33
Note 1 - Description of Plan
A. Organization
Oregon Public Employees Retirement System (PERS or the System) administers a cost-sharing,
multiple-employer defined benefit pension plan (the Plan) for units of state government, political
subdivisions, community colleges, and school districts, containing multiple actuarial pools. Plan
assets may be used to pay the benefits of the employees of any employer that provides pensions
through the Plan. Participation by state government units, school districts, and community
colleges is mandatory. Participation by most political subdivisions is optional, but irrevocable
after election. As of June 30, 2016, there were 921 participating employers and State Agencies.
PERS is administered in accordance with Oregon Revised Statutes (ORS) Chapter 238, Chapter
238A, and Internal Revenue Code Section 401(a). The Oregon Legislature has delegated
authority to the Public Employees Retirement Board (Board) to administer and manage the
System. All members of the Board are appointed by the governor and confirmed by the State
Senate. The governor designates the chairperson. One member must be a public employer
manager or a local elected official, one member must be a union-represented public employee or
retiree, and three members must have experience in business management, pension management,
or investing.
B. Plan Membership
The 1995 Legislature enacted Chapter 654, Section 3, Oregon Laws 1995, which has been
codified into ORS 238.435. This legislation created a second tier of benefits for those who
established membership on or after January 1, 1996. The second tier does not have the Tier One
assumed earnings rate guarantee and has a higher normal retirement age of 60, compared to 58
for Tier One. As of June 30, 2016, there were 28,605 active plan members, 121,585 inactive plan
members or their beneficiaries currently receiving benefits, 15,106 inactive plan members
entitled to but not yet receiving benefits, and 10 inactive plan members not eligible for refund or
retirement, for a total of 165,306 Tier One members. As of June 30, 2016, there were 39,205
active plan members, 12,336 inactive plan members or their beneficiaries currently receiving
benefits, 15,291 inactive plan members entitled to but not yet receiving benefits, and 718
inactive plan members not eligible for refund or retirement, for a total of 67,550 Tier Two
members in the System.
The 2003 Legislature enacted HB 2020, codified as ORS 238A, which created the Oregon Public
Service Retirement Plan (OPSRP). OPSRP consists of the Pension Program (defined benefit) and
the Individual Account Program. Membership includes public employees hired on or after
August 29, 2003. As of June 30, 2016, there were 103,866 active plan members, 2,514 inactive
plan members or their beneficiaries currently receiving benefits, 4,775 inactive plan members
entitled to but not yet receiving benefits, and 10,025 inactive plan members not eligible for
refund or retirement, for a total of 121,180 OPSRP Pension Program members.

Oregon Public Employees Retirement System Cost-Sharing Multiple-Employer Defined Benefit Pension Plan
Notes to the Schedules of Employer Allocations and Pension Amounts by Employer
As of and for the Year Ended June 30, 2016
34
Beginning January 1, 2004, PERS active Tier One and Tier Two members became members of
the Individual Account Program (IAP) of OPSRP. PERS members retain their existing Plan
accounts, but member contributions are now deposited into the member’s IAP account, not into
the member’s Defined Benefit Plan account. Accounts are credited with earnings and losses net
of administrative expenses. OPSRP is part of PERS and is administered by the Board. The PERS
Board is directed to adopt any rules necessary to administer OPSRP, and such rules are to be
considered part of the plan for IRS purposes.
Note 2 - Summary of Significant Accounting Policies
Governmental Accounting Standards Board (GASB) Statement No. 68 Employers participating in the Plan are required to report pension information in their financial
statements in accordance with Governmental Accounting Standards Board (GASB) Statement
No. 68, Accounting and Financial Reporting for Pensions. The requirements of this Statement
incorporate provisions intended to reflect the effects of transactions and events related to
pensions in the measurement of employer liabilities for pensions and the recognition of pension
expense and deferred outflows of resources and deferred inflows of resources related to pensions.
The Schedule of Employer Allocations and the Schedule of Pension Amounts by Employer (the
Schedules), along with PERS audited financial statements and the Schedule of Pension Amounts
under GASB 68 report prepared by PERS’ third-party actuaries provide employers with the
required information for financial reporting related to PERS pensions provided through the Plan
as of and for the year ended June 30, 2016 (the measurement period).
The accompanying Schedules were prepared in accordance with U.S. generally accepted
accounting principles as applicable to governmental organizations. In doing so, PERS, adheres to
the reporting requirements established by the GASB.
Employers are presented in order by PERS assigned employer number in the Schedules. Certain
employers have a secondary relationship with primary employers. Amounts related to secondary
employers are included in the primary employers’ pension amounts and actuarial valuations.
The primary employers are responsible for determining the secondary employers’ proportionate
share of pension amounts. In addition, certain employers no longer have payroll subject to
pension contributions and are considered “non-reporting”. PERS does not have a policy to
collect contributions for employers that have an existing Unfunded Actuarial Liability (UAL).
However, a proportionate share of the net pension liability has been assigned to non-reporting
employers with a UAL.
Basis of Accounting
Contributions for employers are recognized on the accrual basis of accounting. Employer
contributions to PERS are calculated based on creditable compensation for active members
reported by employers. Employer contributions are accrued when due pursuant to legal
requirements and generally represent amounts included in the employer statements cut off as of
the fifth of the following month. The Schedule of Pension Amounts by Employer does not
reflect deferred outflows of resources or deferred inflows of resources related to differences
between actual employer contributions and the employer’s proportionate share of contributions

Oregon Public Employees Retirement System Cost-Sharing Multiple-Employer Defined Benefit Pension Plan
Notes to the Schedules of Employer Allocations and Pension Amounts by Employer
As of and for the Year Ended June 30, 2016
35
or contributions made by employers after the measurement date. Employer-paid member
contributions and contributions from members other than judges are reported in the IAP and are
not part of the Plan. Appropriate treatment of such amounts is the responsibility of the employer.
The Schedule of Employer Allocations reflects employer allocation percentages calculated by
PERS for the year ended June 30, 2016 (the measurement date). Consistent with GASB
Statement No. 68, paragraph 50, employer proportions are actuarially determined at December
31, 2014, the date of the actuarial valuation used to measure the collective net pension liability.
Proportionate Share Allocation Methodology
The basis for the employer’s proportion is actuarially determined by calculating the employer’s
projected long-term contribution effort to the Plan as a percentage of the total projected long-
term contribution effort of all employers. The contribution rate for every employer has at least
two major components; Normal Cost Rate and Unfunded Actuarial Liability (UAL) Rate.
The projected long-term contribution effort is equal to the sum of the present value of all future
Normal Cost Rate Contributions (PVFNC) and the UAL. The PVFNC represents the portion of
the projected long-term contribution effort related to future service. The UAL represents the
portion of the projected long-term contribution effort related to past service.
An employer’s PVFNC depends on both the Normal Cost Rates charged on the employer’s
payrolls, and on the underlying demographics of the respective payrolls. For PERS funding,
employers have three different payrolls, each with a different Normal Cost Rate:
Tier 1/Tier 2 payroll
OPSRP General Service payroll
OPSRP Police & Fire payroll
A UAL exists when Plan assets are less than the actuarial liability as measured by the Plan’s
actuarial funding valuations. UAL can arise when an event such as experience differing from the
assumptions used in the actuarial valuation occurs. An amortization schedule is established to
eliminate the UAL over a fixed period of time if future experience follows assumption. The UAL
Rate is the upcoming year’s component of the cumulative amortization schedules, stated as a
percent of payroll. In determining the employer’s projected long-term contribution effort to the
Plan, the UAL component was adjusted for supplemental lump-sum payments made during the
measurement period, if applicable.
After the employer’s projected long-term contribution effort is calculated, that amount is reduced
by the value of the employer’s supplemental lump-sum payments, known as side accounts,
transition surpluses and pre-SLGRP (State and Local Government Rate Pool) surpluses as of the
valuation date. Side accounts decrease the employer’s projected long-term contribution effort
because side accounts are effectively pre-paid contributions.
The employer’s projected long-term contribution effort does not include contributions toward the
current value of transition liabilities and pre-SLGRP (State and Local Government Rate Pool)

Oregon Public Employees Retirement System Cost-Sharing Multiple-Employer Defined Benefit Pension Plan
Notes to the Schedules of Employer Allocations and Pension Amounts by Employer
As of and for the Year Ended June 30, 2016
36
liabilities, which PERS has determined meet the definition of separately financed employer
liabilities.
If the calculation of the employer’s projected long-term contribution effort yields a negative
number, the employer’s portion of the projected long-term contribution effort will be set to zero
and the employer will be allocated no proportionate share of pension amounts.
As reflected in the December 31, 2014 actuarial valuation, the system-wide actuarial accrued
liability has increased primarily due to the Moro decision and assumption changes, along with
interest on the liability as current active members get closer to retirement. The Oregon Supreme
Court decision in Moro v. State of Oregon, issued on April 30, 2015, reversed a significant
portion of the reductions passed by the 2013 Oregon Legislature, which increased the benefits
projected to be paid by Employers compared to those previously developed and consequently
increased Plan liabilities. The employers’ projected long-term contribution effort reflects the
estimated impact of the Moro Decision. Following the completion of the December 31, 2014
actuarial valuation, the PERS Board adopted several assumption changes, including lowering the
investment return assumption from 7.75% to 7.50%.
Use of Estimates in the Preparation of the Schedules
The preparation of the Schedules in conformity with accounting principles generally accepted in
the U.S. requires management to make estimates and assumptions that affect certain amounts and
disclosures. Actual results could differ from those estimates.
Note 3 - Net Pension Liability and Actuarial Assumptions and Methods
The components of the employers’ net pension liability are as follows (dollars in millions):
The actuarial measurement of the total pension liability and other pension amounts does not
include the IAP.
Total Pension Liability $ 77,094.4
Plan Fiduciary Net Position 62,082.1
Employers' Net Pension Liability $ 15,012.3

Oregon Public Employees Retirement System Cost-Sharing Multiple-Employer Defined Benefit Pension Plan
Notes to the Schedules of Employer Allocations and Pension Amounts by Employer
As of and for the Year Ended June 30, 2016
37
Actuarial methods and assumptions used to determine the Total Pension Liability
Actuarial valuations of an ongoing plan involve estimates of the value of projected benefits and
assumptions about the probability of events far into the future. Actuarially determined amounts are
subject to continual revision as actual results are compared to past expectations and new estimates
are made about the future. Experience studies are performed as of December 31 of even numbered
years. The methods and assumptions shown above are based on the 2014 Experience Study, which
reviewed experience for the four-year period ended on December 31, 2014.
Discount Rate
The discount rate used to measure the total pension liability of the Plan was 7.50 percent. The
projection of cash flows used to determine the discount rate assumed that contributions from plan
members and those of the contributing employers are made at the contractually required rates, as
actuarially determined. Based on those assumptions, the Plan’s fiduciary net position was
projected to be available to make all projected future benefit payments of current Plan members.
Valuation date December 31, 2014
Measurement date June 30, 2016
Experience Study 2014, published September 2015
Actuarial assumptions:
Inflation rate 2.50 percent (reduced from 2.75%)
Long-term expected rate of return1 7.50 percent (reduced from 7.75%)
Discount rate 7.50 percent (reduced from 7.75%)
Projected salary increases 3.50 percent (reduced from 3.75%)
Cost of living adjustments (COLA) Blend of 2.00% COLA and graded COLA
(1.25%/0.15%) in accordance with Moro
decision; blend based on service.
Mortality Healthy retirees and beneficiaries:
RP-2000 Sex-distinct, generational per Scale
BB, with collar adjustments and set-backs as
described in the valuation.
Active members:
Mortality rates are a percentage of healthy
retiree rates that vary by group, as described in
the valuation.
Disabled retirees:
Mortality rates are a percentage (70% for males,
95% for females) of the RP-2000 Sex-distinct,
generational per Scale BB, disabled mortality table.
1 At its September 25, 2015 meeting, the PERS Board reduced the assumed rate of return on
investments from 7.75 percent to 7.50 percent.

Oregon Public Employees Retirement System Cost-Sharing Multiple-Employer Defined Benefit Pension Plan
Notes to the Schedules of Employer Allocations and Pension Amounts by Employer
As of and for the Year Ended June 30, 2016
38
Therefore, the long-term expected rate of return on Plan investments was applied to all periods of
projected benefit payments to determine the total pension liability.
Long-Term Expected Rate of Return
To develop an analytical basis for the selection of the long-term expected rate of return
assumption, in July 2015 the PERS Board reviewed long-term assumptions developed by both
Milliman’s capital market assumptions team and the Oregon Investment Council’s (OIC)
investment advisors. Each asset class assumption is based on a consistent set of underlying
assumptions, and includes adjustment for the inflation assumption. These assumptions are not
based on historical returns, but instead are based on a forward-looking capital market economic
model. For more information on the Plan’s portfolio, assumed asset allocation, and the long-term
expected rate of return for each major asset class, calculated using both arithmetic and geometric
means, see PERS’ audited financial statements at:
http://www.oregon.gov/pers/docs/financial_reports/2016_cafr.pdf
Depletion Date Projection
GASB 68 generally requires that a blended discount rate be used to measure the Total Pension
Liability (the Actuarial Accrued Liability calculated using the Individual Entry Age Normal Cost
Method). The long-term expected return on plan investments may be used to discount liabilities
to the extent that the plan’s Fiduciary Net Position is projected to cover benefit payments and
administrative expenses. A 20-year high quality (AA/Aa or higher) municipal bond rate must be
used for periods where the Fiduciary Net Position is not projected to cover benefit payments and
administrative expenses. Determining the discount rate under GASB 68 will often require that
the actuary perform complex projections of future benefit payments and pension plan
investments. GASB 68 (paragraph 67) does allow for alternative evaluations of projected
solvency, if such evaluation can reliably be made. GASB does not contemplate a specific method
for making an alternative evaluation of sufficiency; it is left to professional judgment.
The following circumstances justify an alternative evaluation of sufficiency for PERS:
PERS has a formal written policy to calculate an Actuarially Determined Contribution
(ADC), which is articulated in the actuarial valuation report.
The ADC is based on a closed, layered amortization period, which means that payment of
the full ADC each year will bring the plan to a 100% funded position by the end of the
amortization period if future experience follows assumption.
GASB 68 specifies that the projections regarding future solvency assume that plan assets
earn the assumed rate of return and there are no future changes in the plan provisions or
actuarial methods and assumptions, which means that the projections would not reflect
any adverse future experience which might impact the plan’s funded position.
Based on these circumstances, it is PERS’ independent actuary’s opinion that the detailed
depletion date projections outlined in GASB 68 would clearly indicate that the Fiduciary Net
Position is always projected to be sufficient to cover benefit payments and administrative
expenses.

Oregon Public Employees Retirement System Cost-Sharing Multiple-Employer Defined Benefit Pension Plan
Notes to the Schedules of Employer Allocations and Pension Amounts by Employer
As of and for the Year Ended June 30, 2016
39
Deferred Inflows of Resources and Deferred Outflows of Resources
Deferred inflows of resources and deferred outflows of resources are calculated at the Plan level
and are allocated to employers based on their proportionate share. For the measurement period
ended June 30, 2016, employers will report the following deferred inflows of resources and/or
deferred outflows of resources:
Difference between expected and actual experience
Changes in assumptions
Changes in employer proportion since the prior measurement date
Difference between projected and actual earnings
Differences between expected and actual experience, changes in assumptions and changes in
employer proportion are amortized over the average remaining service lives of all plan
participants, including retirees, determined as of the beginning of the respective measurement
period. Employers are required to recognize pension expense based on the balance of the closed
period “layers” attributable to each measurement period. The average remaining service lives
determined as of the beginning of each measurement period are described below:
Year ended June 30, 2016 – 5.3 years
Year ended June 30, 2015 – 5.4 years
Year ended June 30, 2014 – 5.6 years
The difference between projected and actual earnings attributable to each measurement period is
amortized over a closed five-year period.
In addition, employers may need to recognize a difference between their actual employer
contributions and their proportionate share of contributions, which is not reflected in the
Schedule of Pension Amounts by Employer. GASB 68 requires employers to amortize that
difference over the remaining service lives of all plan participants, including retirees, determined
as of the beginning of the respective measurement period. Employer contributions made after the
measurement date are also excluded from the Schedule of Pension Amounts by Employer.
Appropriate treatment of such amounts is the responsibility of the employer.
If you have questions about this report or need additional financial information, please contact
the Financial and Administrative Services Division Administrator at P.O. Box 23700, Tigard,
Oregon 97281-3700.