Embed Size (px)
Citation preview
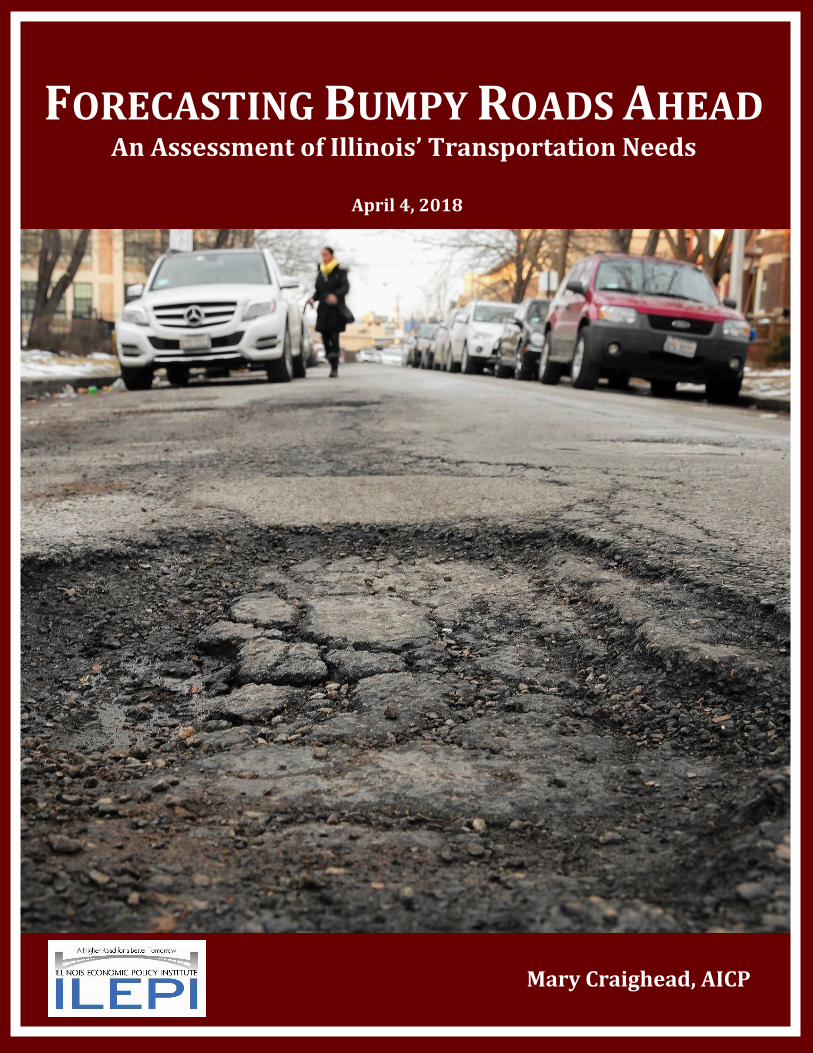
FORECASTING BUMPY ROADS AHEAD An Assessment of Illinois’ Transportation Needs
April 4, 2018
Mary Craighead, AICP
i
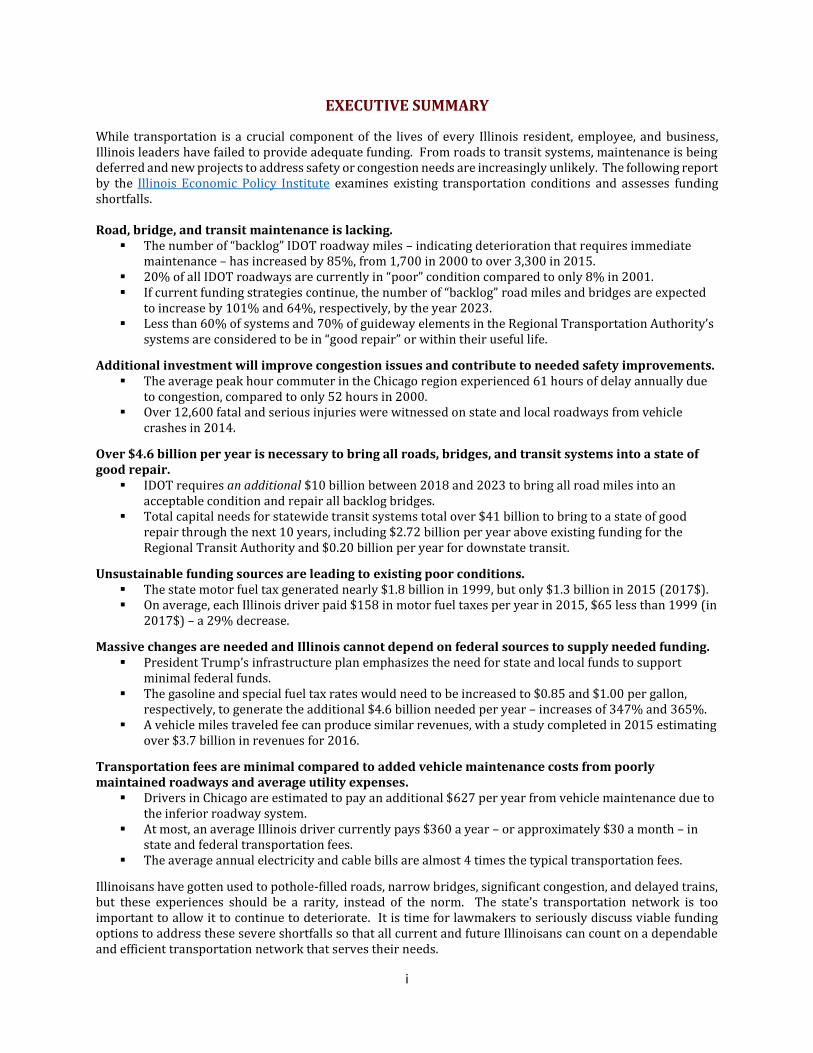
EXECUTIVE SUMMARY
While transportation is a crucial component of the lives of every Illinois resident, employee, and business, Illinois leaders have failed to provide adequate funding. From roads to transit systems, maintenance is being deferred and new projects to address safety or congestion needs are increasingly unlikely. The following report by the Illinois Economic Policy Institute examines existing transportation conditions and assesses funding shortfalls. Road, bridge, and transit maintenance is lacking.
▪ The number of “backlog” IDOT roadway miles – indicating deterioration that requires immediate maintenance – has increased by 85%, from 1,700 in 2000 to over 3,300 in 2015.
▪ 20% of all IDOT roadways are currently in “poor” condition compared to only 8% in 2001. ▪ If current funding strategies continue, the number of “backlog” road miles and bridges are expected
to increase by 101% and 64%, respectively, by the year 2023. ▪ Less than 60% of systems and 70% of guideway elements in the Regional Transportation Authority’s
systems are considered to be in “good repair” or within their useful life.
Additional investment will improve congestion issues and contribute to needed safety improvements. ▪ The average peak hour commuter in the Chicago region experienced 61 hours of delay annually due
to congestion, compared to only 52 hours in 2000. ▪ Over 12,600 fatal and serious injuries were witnessed on state and local roadways from vehicle
crashes in 2014.
Over $4.6 billion per year is necessary to bring all roads, bridges, and transit systems into a state of good repair.
▪ IDOT requires an additional $10 billion between 2018 and 2023 to bring all road miles into an acceptable condition and repair all backlog bridges.
▪ Total capital needs for statewide transit systems total over $41 billion to bring to a state of good repair through the next 10 years, including $2.72 billion per year above existing funding for the Regional Transit Authority and $0.20 billion per year for downstate transit.
Unsustainable funding sources are leading to existing poor conditions. ▪ The state motor fuel tax generated nearly $1.8 billion in 1999, but only $1.3 billion in 2015 (2017$). ▪ On average, each Illinois driver paid $158 in motor fuel taxes per year in 2015, $65 less than 1999 (in
2017$) – a 29% decrease.
Massive changes are needed and Illinois cannot depend on federal sources to supply needed funding. ▪ President Trump’s infrastructure plan emphasizes the need for state and local funds to support
minimal federal funds. ▪ The gasoline and special fuel tax rates would need to be increased to $0.85 and $1.00 per gallon,
respectively, to generate the additional $4.6 billion needed per year – increases of 347% and 365%. ▪ A vehicle miles traveled fee can produce similar revenues, with a study completed in 2015 estimating
over $3.7 billion in revenues for 2016.
Transportation fees are minimal compared to added vehicle maintenance costs from poorly maintained roadways and average utility expenses.
▪ Drivers in Chicago are estimated to pay an additional $627 per year from vehicle maintenance due to the inferior roadway system.
▪ At most, an average Illinois driver currently pays $360 a year – or approximately $30 a month – in state and federal transportation fees.
▪ The average annual electricity and cable bills are almost 4 times the typical transportation fees.
Illinoisans have gotten used to pothole-filled roads, narrow bridges, significant congestion, and delayed trains, but these experiences should be a rarity, instead of the norm. The state’s transportation network is too important to allow it to continue to deteriorate. It is time for lawmakers to seriously discuss viable funding options to address these severe shortfalls so that all current and future Illinoisans can count on a dependable and efficient transportation network that serves their needs.
ii
TABLE OF CONTENTS
Executive Summary …………………………………………………………………………………………………………...…………………….. i
Table of Contents ………………………..………………………………………………………………………………….………………...…….. ii
About the Author ………………………………………………………………………………………..…………………………………….…….. ii
Introduction ………………………………………………………………………………..…………………………………………………………. 1
Illinois’ Transportation Network………………………………………………………………...………………………………………….. 1
Use of Infrastructure ………………………………………………………………………………………..…………………………… 1
Freight Use …….…………………………………………………………………………………………………………….………………. 3
Transportation System Needs ………………..………………………………………………………………………………………………. 5
Roads and Bridges ..…………………………………….……………………………………………………………………………….... 5
Safety ……………………………………………………………………….………………………………………………………………..… 7
Mobility …………………………………………………………………………………..…………………………………………………… 9
Public Transportation ……………………………...……………….…………………………….…………………………………… 10
Funding Needs ...……………………………………………………………………………………..………………………...…………………... 12
IDOT Maintained Highways and Bridges …………………………..……………………………………………………..…..… 12
Chicago Transit Systems ……………………………………………………………………………………………………………… 13
Downstate Transit Systems …………………………….……………….…………………………………………………………… 14
Total Statewide Funding Needs …………………………………………….……………………………………………………… 15
Existing Funding Shortfalls …………………………………………………………………...……………………………………………… 15
Illinois’ Funding Future ...………………………………...……………………………………..……………..…………………….………... 17
Increasing Existing User Fees ……………………..………………………..……………………………………………………..… 18
Implementing New Revenue Sources …...……………………….……………………………………..………………………… 18
Personal Costs ...……………………………………………………………………………………..…………………………………...………... 19
Vehicle Maintenance Costs ……………………………….…..………………………..…………………………………………..… 19
Cost of Annual Transportation Fees …...…………………………………….…………………………………………………… 20
Increased Transportation Fees …………………………………………………….…………………….………………………… 21
Conclusion …………………………………………………………………………………………………………...……………………………….. 22
References …………………………………………………………………………………………………………………………..……………….. 22
ABOUT THE AUTHOR
Mary Craighead, AICP is the Transportation Policy Analyst at the Illinois Economic Policy Institute. Prior to joining ILEPI, she served as the Coordinator for the Victoria, TX Metropolitan Planning Organization and Senior Transportation Planner for the City of Victoria, TX. She earned a Master of Urban Planning and Graduate Certificate in Transportation Planning from Texas A&M University and a Bachelor of Science in Mathematics and Economics from the University of Evansville.
1
INTRODUCTION Transportation is crucial to every Illinois resident, employee, and business. It not only dictates daily decisions of every person, but also serves as the backbone of the economy. The transportation network ensures businesses can deliver their products to markets and that consumers can access those markets, while also guaranteeing the public’s access to their jobs, schools, hospitals, and countless other public services. As crucial as the transportation network is, Illinois’ leaders and policymakers have failed to provide adequate funding. From roads to transit systems, maintenance is being deferred and new projects to address safety or congestion needs are increasingly unlikely. The following report by the Illinois Economic Policy Institute examines existing transportation conditions and assesses funding shortfalls. The state’s transportation network is too important to allow it to continue to deteriorate. It is time for lawmakers to seriously discuss viable funding options to address these severe shortfalls so that all current and future Illinoisans can count on a reliable and efficient transportation network.
ILLINOIS’ TRANSPORTATION NETWORK
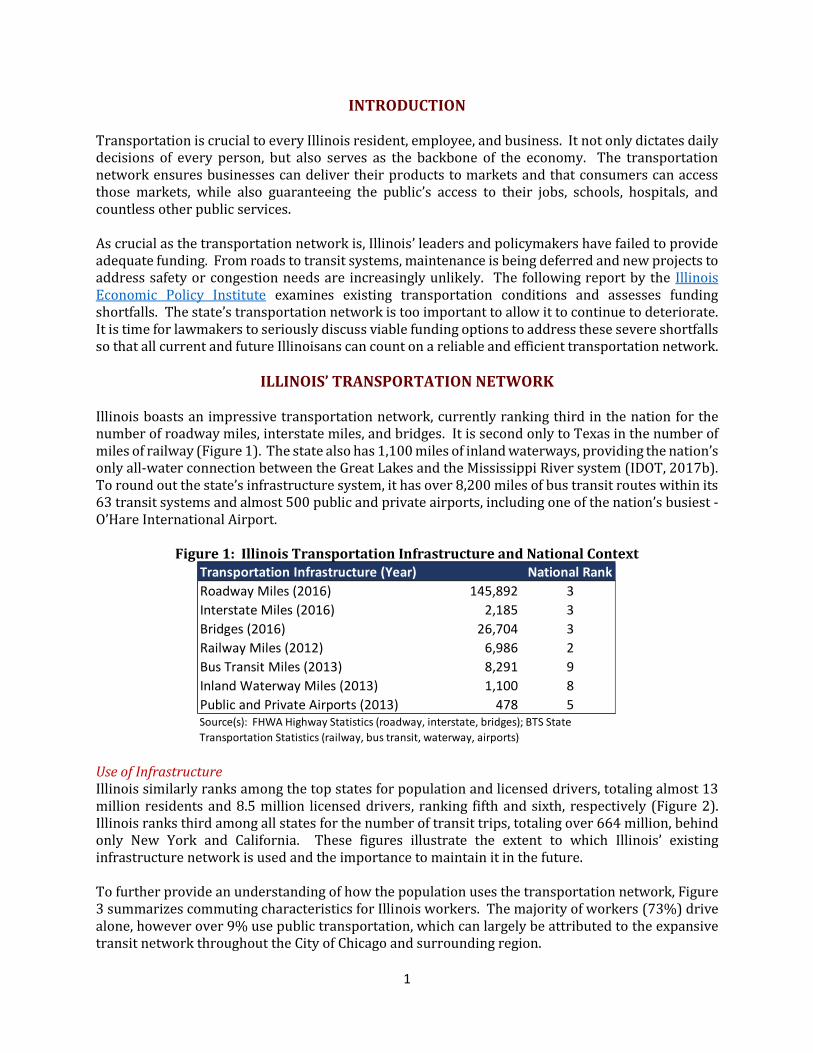
Illinois boasts an impressive transportation network, currently ranking third in the nation for the number of roadway miles, interstate miles, and bridges. It is second only to Texas in the number of miles of railway (Figure 1). The state also has 1,100 miles of inland waterways, providing the nation’s only all-water connection between the Great Lakes and the Mississippi River system (IDOT, 2017b). To round out the state’s infrastructure system, it has over 8,200 miles of bus transit routes within its 63 transit systems and almost 500 public and private airports, including one of the nation’s busiest - O’Hare International Airport.
Figure 1: Illinois Transportation Infrastructure and National Context
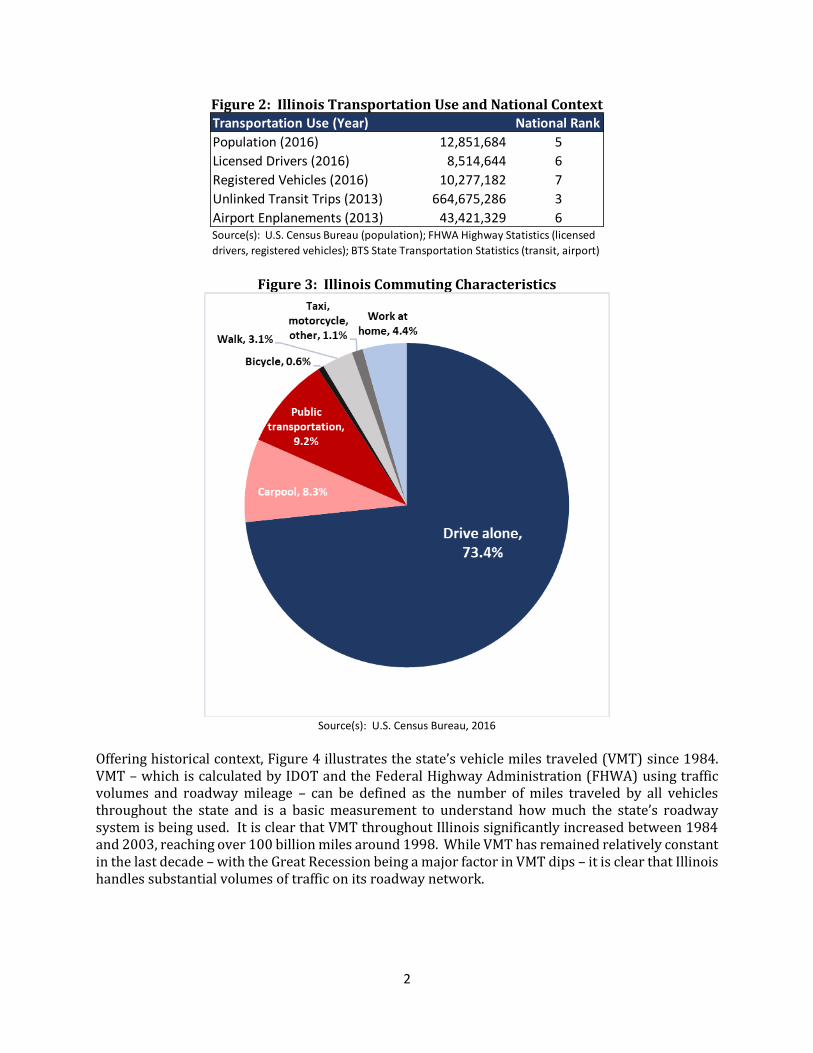
Use of Infrastructure Illinois similarly ranks among the top states for population and licensed drivers, totaling almost 13 million residents and 8.5 million licensed drivers, ranking fifth and sixth, respectively (Figure 2). Illinois ranks third among all states for the number of transit trips, totaling over 664 million, behind only New York and California. These figures illustrate the extent to which Illinois’ existing infrastructure network is used and the importance to maintain it in the future. To further provide an understanding of how the population uses the transportation network, Figure 3 summarizes commuting characteristics for Illinois workers. The majority of workers (73%) drive alone, however over 9% use public transportation, which can largely be attributed to the expansive transit network throughout the City of Chicago and surrounding region.
National Rank
Roadway Miles (2016) 145,892 3
Interstate Miles (2016) 2,185 3
Bridges (2016) 26,704 3
Railway Miles (2012) 6,986 2
Bus Transit Miles (2013) 8,291 9
Inland Waterway Miles (2013) 1,100 8
Public and Private Airports (2013) 478 5Source(s): FHWA Highway Statistics (roadway, interstate, bridges); BTS State
Transportation Statistics (railway, bus transit, waterway, airports)
Transportation Infrastructure (Year)
2
Figure 2: Illinois Transportation Use and National Context
Figure 3: Illinois Commuting Characteristics
Source(s): U.S. Census Bureau, 2016
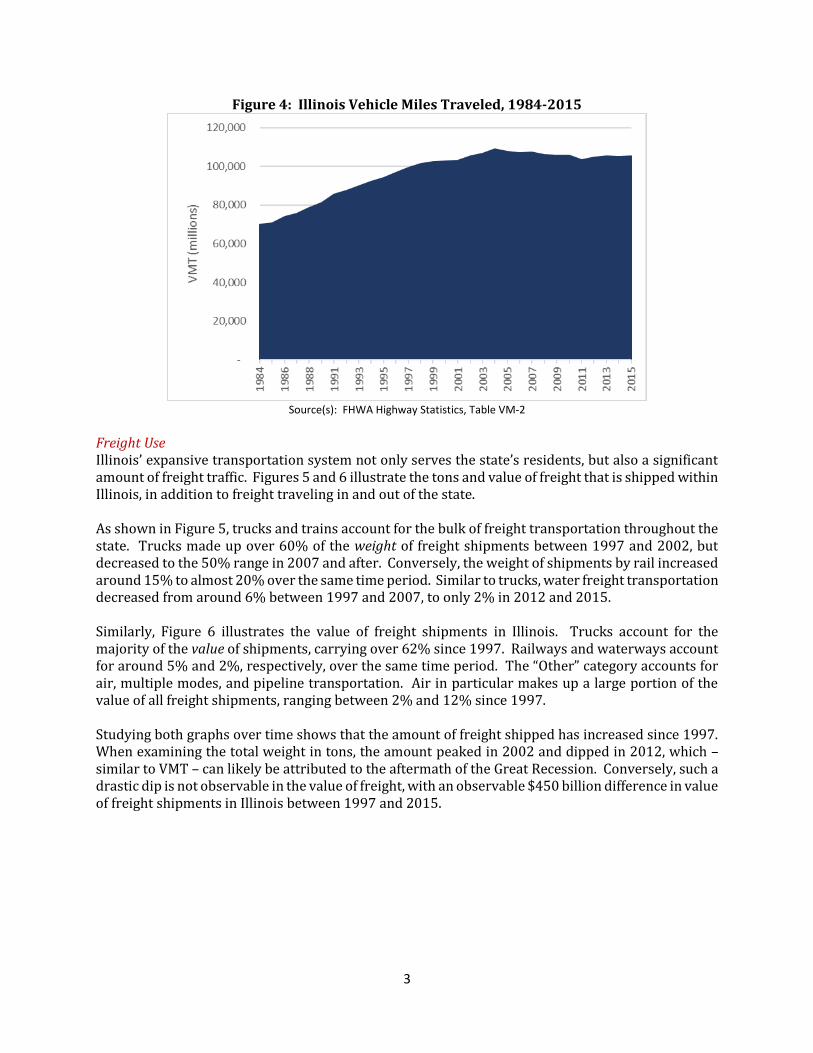
Offering historical context, Figure 4 illustrates the state’s vehicle miles traveled (VMT) since 1984. VMT – which is calculated by IDOT and the Federal Highway Administration (FHWA) using traffic volumes and roadway mileage – can be defined as the number of miles traveled by all vehicles throughout the state and is a basic measurement to understand how much the state’s roadway system is being used. It is clear that VMT throughout Illinois significantly increased between 1984 and 2003, reaching over 100 billion miles around 1998. While VMT has remained relatively constant in the last decade – with the Great Recession being a major factor in VMT dips – it is clear that Illinois handles substantial volumes of traffic on its roadway network.
National Rank
Population (2016) 12,851,684 5
Licensed Drivers (2016) 8,514,644 6
Registered Vehicles (2016) 10,277,182 7
Unlinked Transit Trips (2013) 664,675,286 3
Airport Enplanements (2013) 43,421,329 6Source(s): U.S. Census Bureau (population); FHWA Highway Statistics (licensed
drivers, registered vehicles); BTS State Transportation Statistics (transit, airport)
Transportation Use (Year)
3
Figure 4: Illinois Vehicle Miles Traveled, 1984-2015
Source(s): FHWA Highway Statistics, Table VM-2
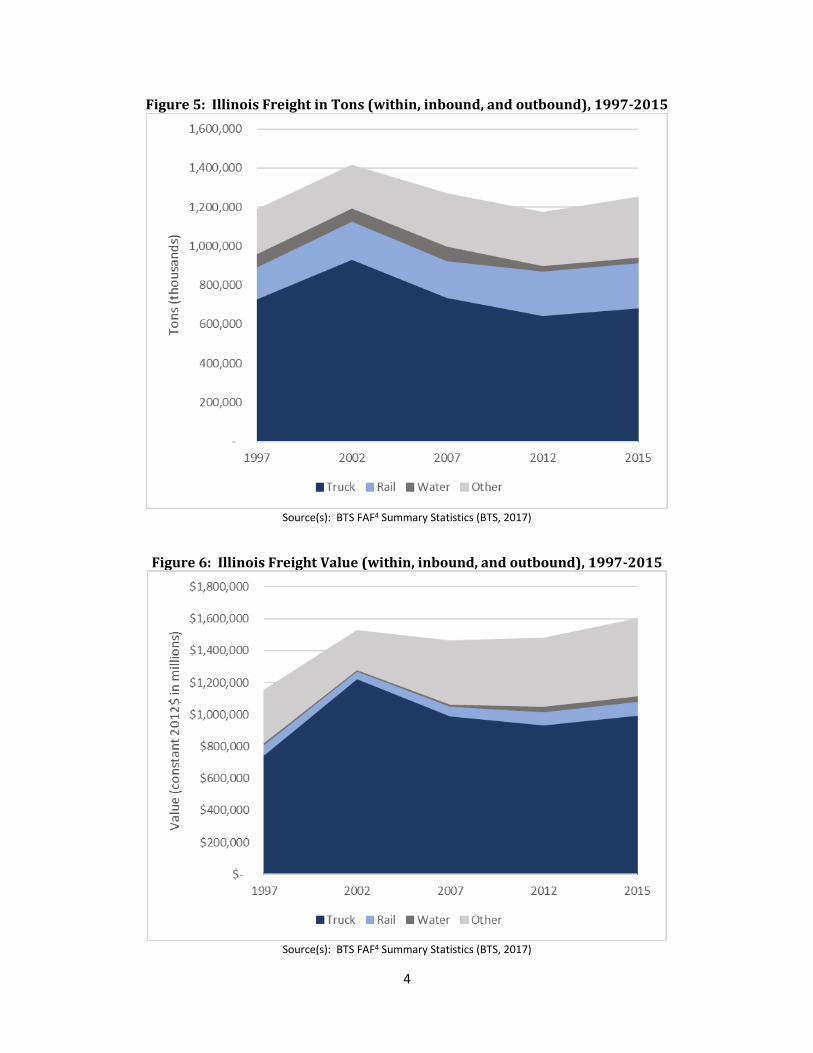
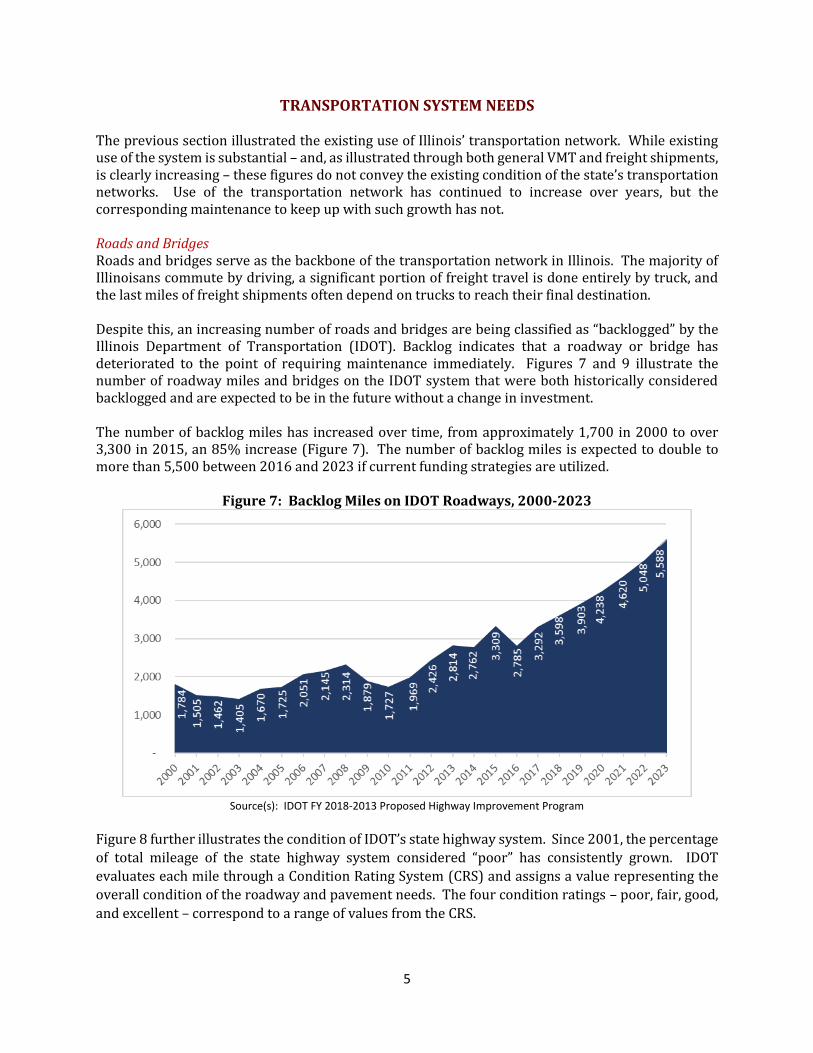
Freight Use Illinois’ expansive transportation system not only serves the state’s residents, but also a significant amount of freight traffic. Figures 5 and 6 illustrate the tons and value of freight that is shipped within Illinois, in addition to freight traveling in and out of the state. As shown in Figure 5, trucks and trains account for the bulk of freight transportation throughout the state. Trucks made up over 60% of the weight of freight shipments between 1997 and 2002, but decreased to the 50% range in 2007 and after. Conversely, the weight of shipments by rail increased around 15% to almost 20% over the same time period. Similar to trucks, water freight transportation decreased from around 6% between 1997 and 2007, to only 2% in 2012 and 2015. Similarly, Figure 6 illustrates the value of freight shipments in Illinois. Trucks account for the majority of the value of shipments, carrying over 62% since 1997. Railways and waterways account for around 5% and 2%, respectively, over the same time period. The “Other” category accounts for air, multiple modes, and pipeline transportation. Air in particular makes up a large portion of the value of all freight shipments, ranging between 2% and 12% since 1997. Studying both graphs over time shows that the amount of freight shipped has increased since 1997. When examining the total weight in tons, the amount peaked in 2002 and dipped in 2012, which – similar to VMT – can likely be attributed to the aftermath of the Great Recession. Conversely, such a drastic dip is not observable in the value of freight, with an observable $450 billion difference in value of freight shipments in Illinois between 1997 and 2015.
4
Figure 5: Illinois Freight in Tons (within, inbound, and outbound), 1997-2015
Source(s): BTS FAF4 Summary Statistics (BTS, 2017)
Figure 6: Illinois Freight Value (within, inbound, and outbound), 1997-2015
Source(s): BTS FAF4 Summary Statistics (BTS, 2017)
5
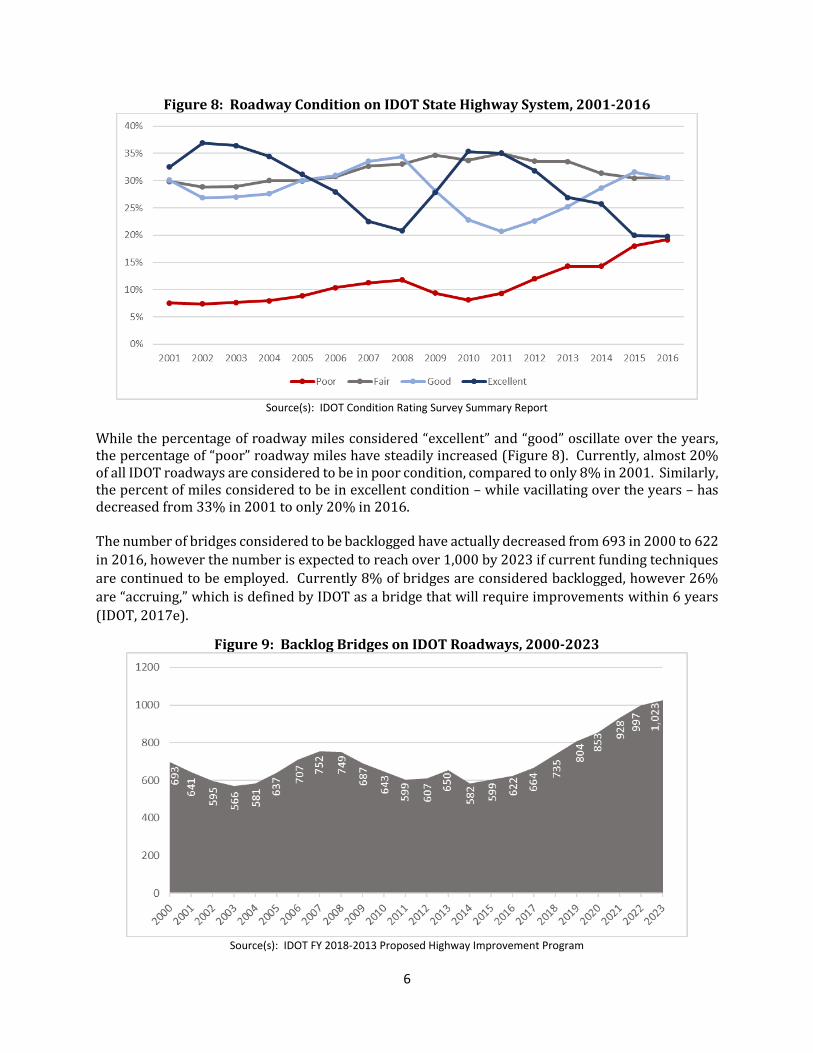
TRANSPORTATION SYSTEM NEEDS The previous section illustrated the existing use of Illinois’ transportation network. While existing use of the system is substantial – and, as illustrated through both general VMT and freight shipments, is clearly increasing – these figures do not convey the existing condition of the state’s transportation networks. Use of the transportation network has continued to increase over years, but the corresponding maintenance to keep up with such growth has not. Roads and Bridges Roads and bridges serve as the backbone of the transportation network in Illinois. The majority of Illinoisans commute by driving, a significant portion of freight travel is done entirely by truck, and the last miles of freight shipments often depend on trucks to reach their final destination. Despite this, an increasing number of roads and bridges are being classified as “backlogged” by the Illinois Department of Transportation (IDOT). Backlog indicates that a roadway or bridge has deteriorated to the point of requiring maintenance immediately. Figures 7 and 9 illustrate the number of roadway miles and bridges on the IDOT system that were both historically considered backlogged and are expected to be in the future without a change in investment. The number of backlog miles has increased over time, from approximately 1,700 in 2000 to over 3,300 in 2015, an 85% increase (Figure 7). The number of backlog miles is expected to double to more than 5,500 between 2016 and 2023 if current funding strategies are utilized.
Figure 7: Backlog Miles on IDOT Roadways, 2000-2023
Source(s): IDOT FY 2018-2013 Proposed Highway Improvement Program
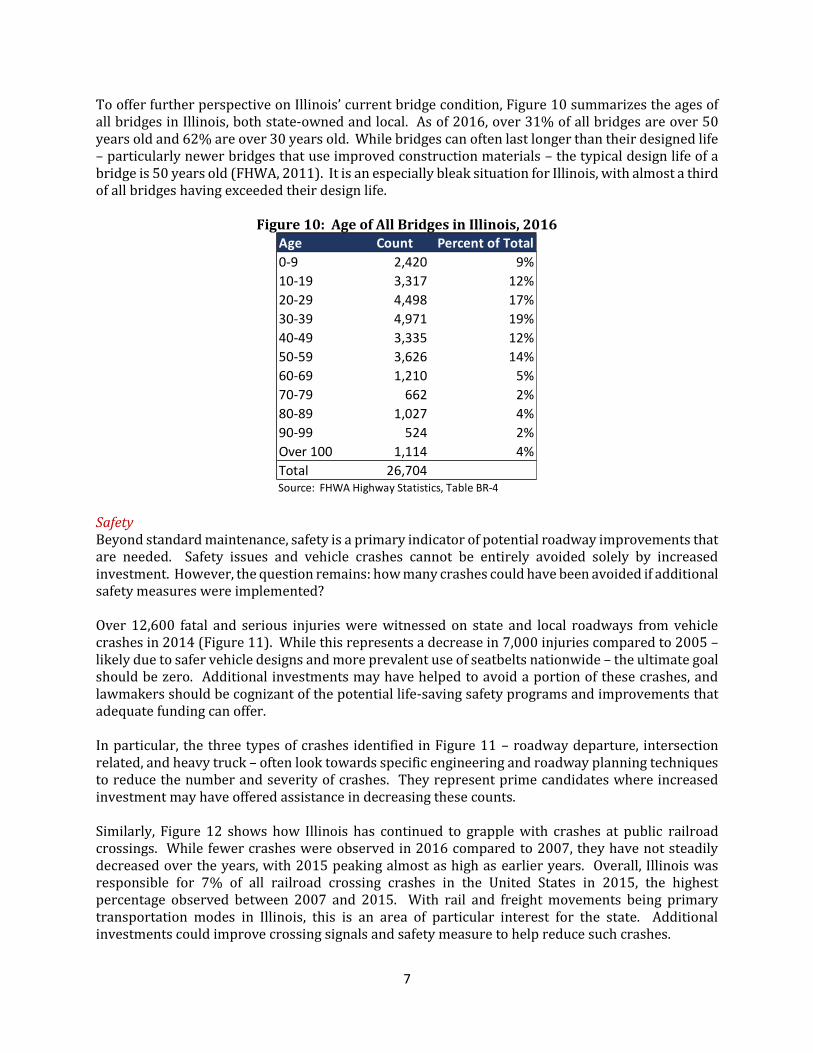
Figure 8 further illustrates the condition of IDOT’s state highway system. Since 2001, the percentage
of total mileage of the state highway system considered “poor” has consistently grown. IDOT
evaluates each mile through a Condition Rating System (CRS) and assigns a value representing the
overall condition of the roadway and pavement needs. The four condition ratings – poor, fair, good,
and excellent – correspond to a range of values from the CRS.
6
Figure 8: Roadway Condition on IDOT State Highway System, 2001-2016
Source(s): IDOT Condition Rating Survey Summary Report
While the percentage of roadway miles considered “excellent” and “good” oscillate over the years, the percentage of “poor” roadway miles have steadily increased (Figure 8). Currently, almost 20% of all IDOT roadways are considered to be in poor condition, compared to only 8% in 2001. Similarly, the percent of miles considered to be in excellent condition – while vacillating over the years – has decreased from 33% in 2001 to only 20% in 2016. The number of bridges considered to be backlogged have actually decreased from 693 in 2000 to 622
in 2016, however the number is expected to reach over 1,000 by 2023 if current funding techniques
are continued to be employed. Currently 8% of bridges are considered backlogged, however 26%
are “accruing,” which is defined by IDOT as a bridge that will require improvements within 6 years
(IDOT, 2017e).
Figure 9: Backlog Bridges on IDOT Roadways, 2000-2023
Source(s): IDOT FY 2018-2013 Proposed Highway Improvement Program
7
To offer further perspective on Illinois’ current bridge condition, Figure 10 summarizes the ages of all bridges in Illinois, both state-owned and local. As of 2016, over 31% of all bridges are over 50 years old and 62% are over 30 years old. While bridges can often last longer than their designed life – particularly newer bridges that use improved construction materials – the typical design life of a bridge is 50 years old (FHWA, 2011). It is an especially bleak situation for Illinois, with almost a third of all bridges having exceeded their design life.
Figure 10: Age of All Bridges in Illinois, 2016
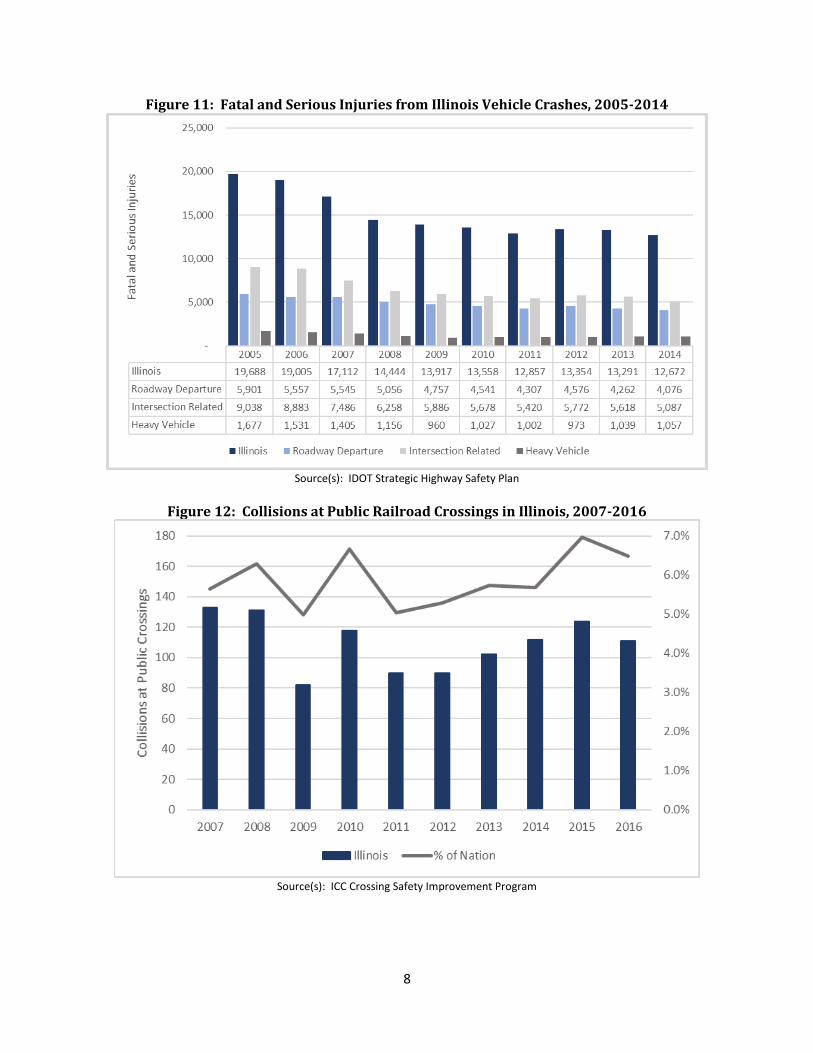
Safety Beyond standard maintenance, safety is a primary indicator of potential roadway improvements that are needed. Safety issues and vehicle crashes cannot be entirely avoided solely by increased investment. However, the question remains: how many crashes could have been avoided if additional safety measures were implemented? Over 12,600 fatal and serious injuries were witnessed on state and local roadways from vehicle crashes in 2014 (Figure 11). While this represents a decrease in 7,000 injuries compared to 2005 – likely due to safer vehicle designs and more prevalent use of seatbelts nationwide – the ultimate goal should be zero. Additional investments may have helped to avoid a portion of these crashes, and lawmakers should be cognizant of the potential life-saving safety programs and improvements that adequate funding can offer. In particular, the three types of crashes identified in Figure 11 – roadway departure, intersection related, and heavy truck – often look towards specific engineering and roadway planning techniques to reduce the number and severity of crashes. They represent prime candidates where increased investment may have offered assistance in decreasing these counts. Similarly, Figure 12 shows how Illinois has continued to grapple with crashes at public railroad crossings. While fewer crashes were observed in 2016 compared to 2007, they have not steadily decreased over the years, with 2015 peaking almost as high as earlier years. Overall, Illinois was responsible for 7% of all railroad crossing crashes in the United States in 2015, the highest percentage observed between 2007 and 2015. With rail and freight movements being primary transportation modes in Illinois, this is an area of particular interest for the state. Additional investments could improve crossing signals and safety measure to help reduce such crashes.
Age Count Percent of Total
0-9 2,420 9%
10-19 3,317 12%
20-29 4,498 17%
30-39 4,971 19%
40-49 3,335 12%
50-59 3,626 14%
60-69 1,210 5%
70-79 662 2%
80-89 1,027 4%
90-99 524 2%
Over 100 1,114 4%
Total 26,704 Source: FHWA Highway Statistics, Table BR-4
8
Figure 11: Fatal and Serious Injuries from Illinois Vehicle Crashes, 2005-2014
Source(s): IDOT Strategic Highway Safety Plan
Figure 12: Collisions at Public Railroad Crossings in Illinois, 2007-2016
Source(s): ICC Crossing Safety Improvement Program
9
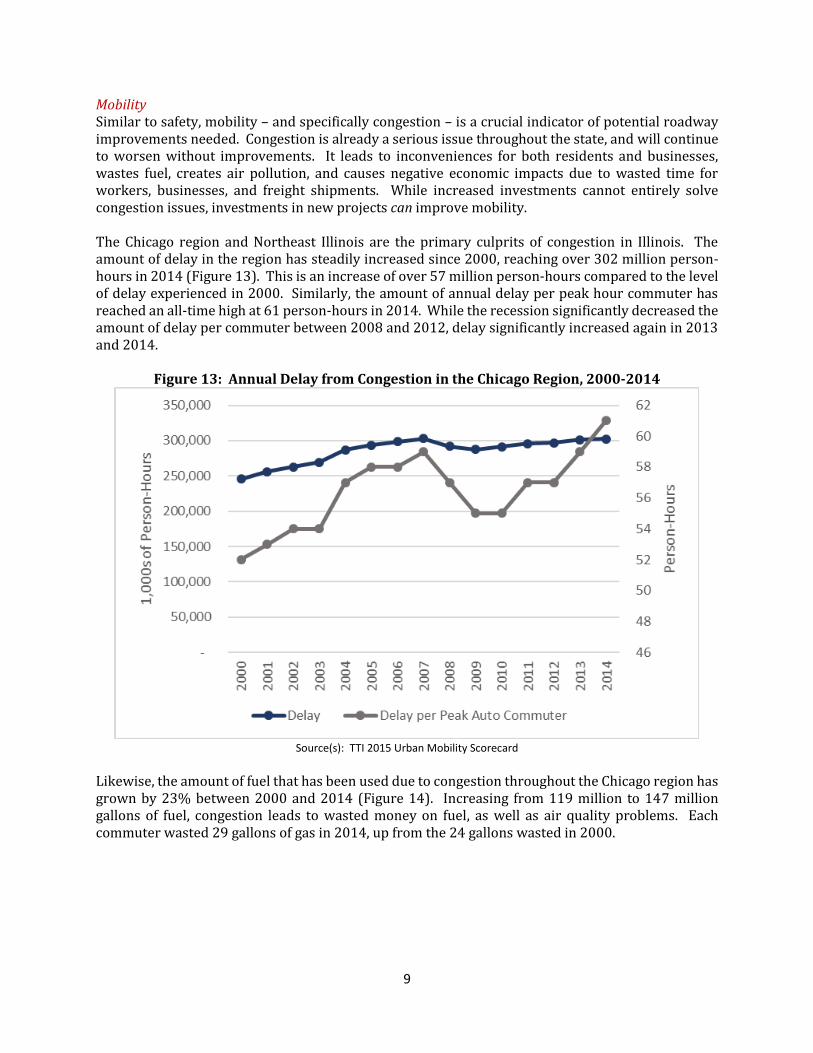
Mobility Similar to safety, mobility – and specifically congestion – is a crucial indicator of potential roadway improvements needed. Congestion is already a serious issue throughout the state, and will continue to worsen without improvements. It leads to inconveniences for both residents and businesses, wastes fuel, creates air pollution, and causes negative economic impacts due to wasted time for workers, businesses, and freight shipments. While increased investments cannot entirely solve congestion issues, investments in new projects can improve mobility. The Chicago region and Northeast Illinois are the primary culprits of congestion in Illinois. The amount of delay in the region has steadily increased since 2000, reaching over 302 million person-hours in 2014 (Figure 13). This is an increase of over 57 million person-hours compared to the level of delay experienced in 2000. Similarly, the amount of annual delay per peak hour commuter has reached an all-time high at 61 person-hours in 2014. While the recession significantly decreased the amount of delay per commuter between 2008 and 2012, delay significantly increased again in 2013 and 2014.
Figure 13: Annual Delay from Congestion in the Chicago Region, 2000-2014
Source(s): TTI 2015 Urban Mobility Scorecard
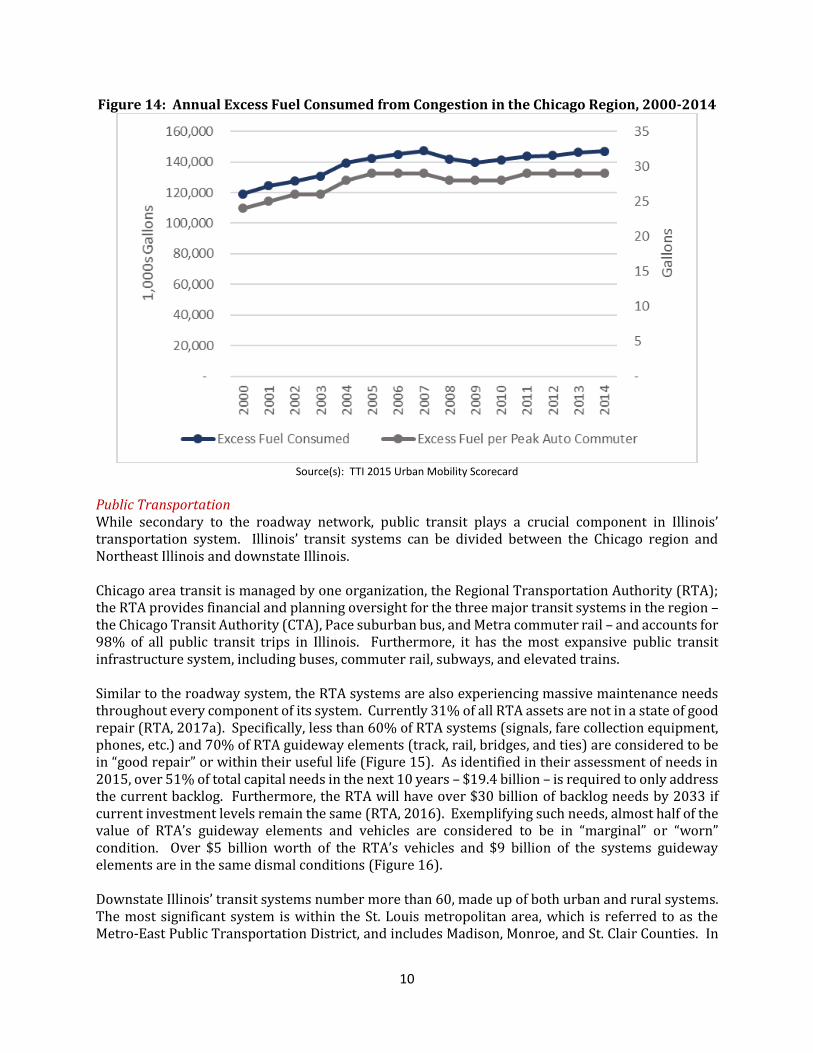
Likewise, the amount of fuel that has been used due to congestion throughout the Chicago region has grown by 23% between 2000 and 2014 (Figure 14). Increasing from 119 million to 147 million gallons of fuel, congestion leads to wasted money on fuel, as well as air quality problems. Each commuter wasted 29 gallons of gas in 2014, up from the 24 gallons wasted in 2000.
10
Figure 14: Annual Excess Fuel Consumed from Congestion in the Chicago Region, 2000-2014
Source(s): TTI 2015 Urban Mobility Scorecard
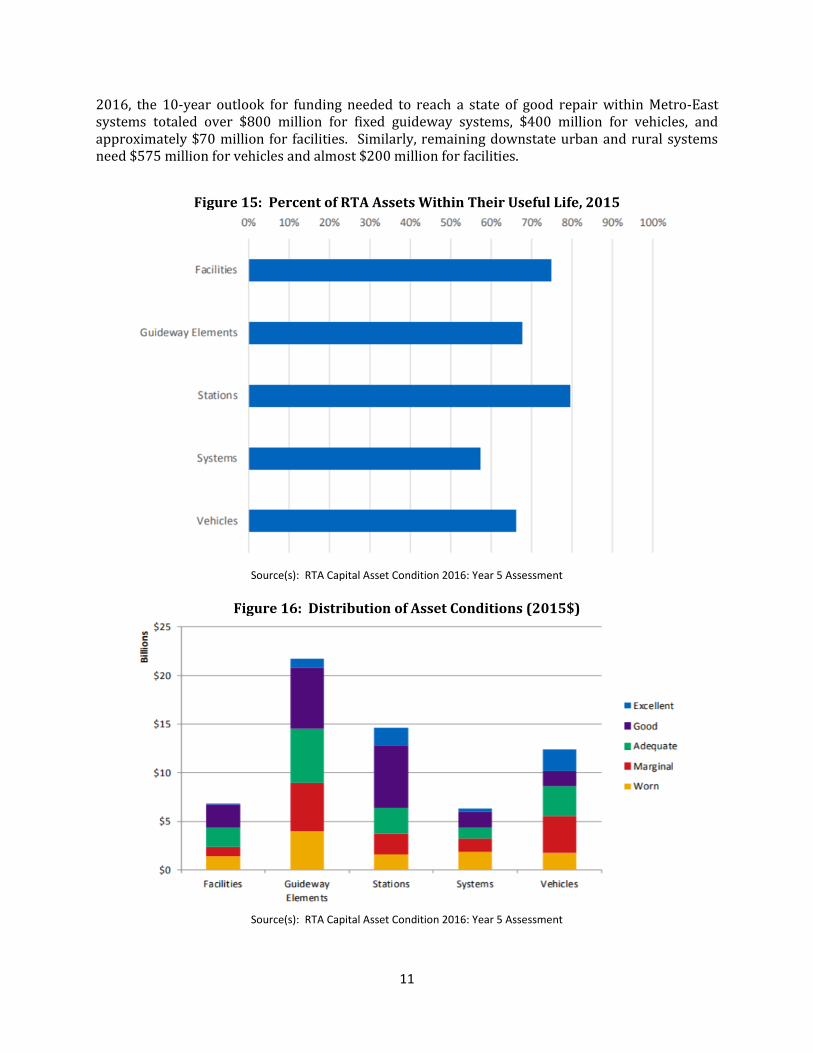
Public Transportation While secondary to the roadway network, public transit plays a crucial component in Illinois’ transportation system. Illinois’ transit systems can be divided between the Chicago region and Northeast Illinois and downstate Illinois. Chicago area transit is managed by one organization, the Regional Transportation Authority (RTA); the RTA provides financial and planning oversight for the three major transit systems in the region – the Chicago Transit Authority (CTA), Pace suburban bus, and Metra commuter rail – and accounts for 98% of all public transit trips in Illinois. Furthermore, it has the most expansive public transit infrastructure system, including buses, commuter rail, subways, and elevated trains. Similar to the roadway system, the RTA systems are also experiencing massive maintenance needs throughout every component of its system. Currently 31% of all RTA assets are not in a state of good repair (RTA, 2017a). Specifically, less than 60% of RTA systems (signals, fare collection equipment, phones, etc.) and 70% of RTA guideway elements (track, rail, bridges, and ties) are considered to be in “good repair” or within their useful life (Figure 15). As identified in their assessment of needs in 2015, over 51% of total capital needs in the next 10 years – $19.4 billion – is required to only address the current backlog. Furthermore, the RTA will have over $30 billion of backlog needs by 2033 if current investment levels remain the same (RTA, 2016). Exemplifying such needs, almost half of the value of RTA’s guideway elements and vehicles are considered to be in “marginal” or “worn” condition. Over $5 billion worth of the RTA’s vehicles and $9 billion of the systems guideway elements are in the same dismal conditions (Figure 16). Downstate Illinois’ transit systems number more than 60, made up of both urban and rural systems. The most significant system is within the St. Louis metropolitan area, which is referred to as the Metro-East Public Transportation District, and includes Madison, Monroe, and St. Clair Counties. In
11
2016, the 10-year outlook for funding needed to reach a state of good repair within Metro-East systems totaled over $800 million for fixed guideway systems, $400 million for vehicles, and approximately $70 million for facilities. Similarly, remaining downstate urban and rural systems need $575 million for vehicles and almost $200 million for facilities.
Figure 15: Percent of RTA Assets Within Their Useful Life, 2015
Source(s): RTA Capital Asset Condition 2016: Year 5 Assessment
Figure 16: Distribution of Asset Conditions (2015$)
Source(s): RTA Capital Asset Condition 2016: Year 5 Assessment
12
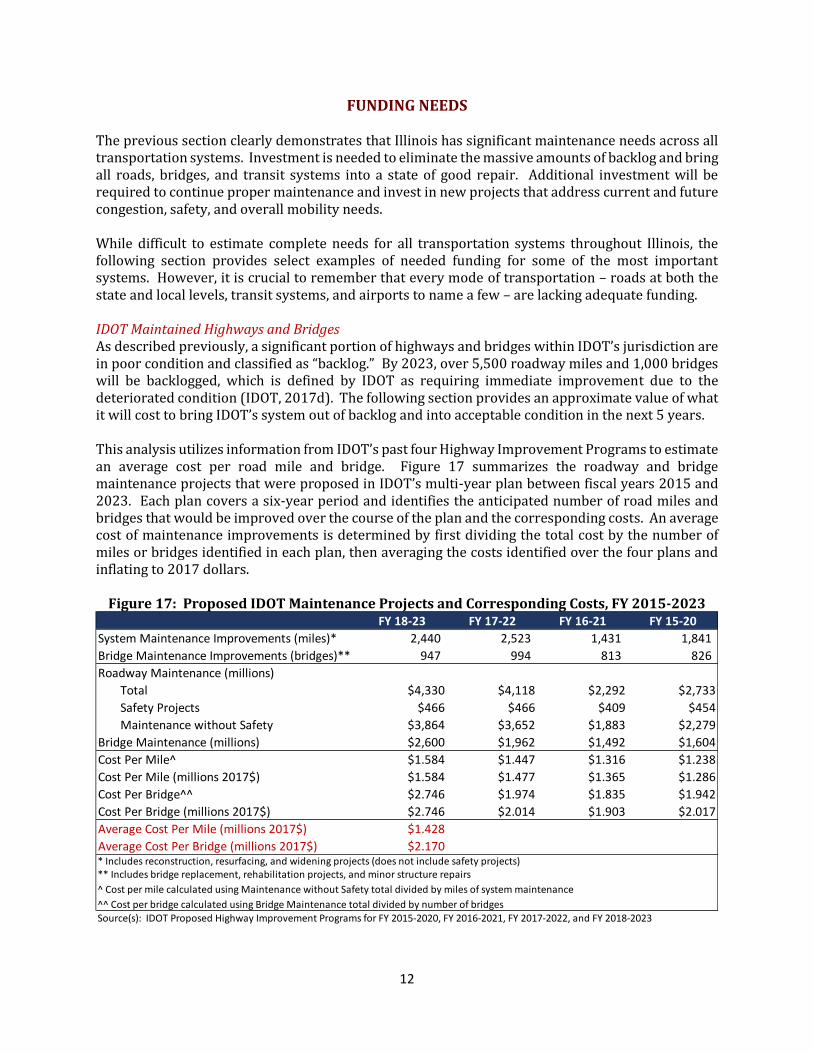
FUNDING NEEDS The previous section clearly demonstrates that Illinois has significant maintenance needs across all transportation systems. Investment is needed to eliminate the massive amounts of backlog and bring all roads, bridges, and transit systems into a state of good repair. Additional investment will be required to continue proper maintenance and invest in new projects that address current and future congestion, safety, and overall mobility needs. While difficult to estimate complete needs for all transportation systems throughout Illinois, the following section provides select examples of needed funding for some of the most important systems. However, it is crucial to remember that every mode of transportation – roads at both the state and local levels, transit systems, and airports to name a few – are lacking adequate funding. IDOT Maintained Highways and Bridges As described previously, a significant portion of highways and bridges within IDOT’s jurisdiction are in poor condition and classified as “backlog.” By 2023, over 5,500 roadway miles and 1,000 bridges will be backlogged, which is defined by IDOT as requiring immediate improvement due to the deteriorated condition (IDOT, 2017d). The following section provides an approximate value of what it will cost to bring IDOT’s system out of backlog and into acceptable condition in the next 5 years. This analysis utilizes information from IDOT’s past four Highway Improvement Programs to estimate an average cost per road mile and bridge. Figure 17 summarizes the roadway and bridge maintenance projects that were proposed in IDOT’s multi-year plan between fiscal years 2015 and 2023. Each plan covers a six-year period and identifies the anticipated number of road miles and bridges that would be improved over the course of the plan and the corresponding costs. An average cost of maintenance improvements is determined by first dividing the total cost by the number of miles or bridges identified in each plan, then averaging the costs identified over the four plans and inflating to 2017 dollars.
Figure 17: Proposed IDOT Maintenance Projects and Corresponding Costs, FY 2015-2023
FY 18-23 FY 17-22 FY 16-21 FY 15-20
System Maintenance Improvements (miles)* 2,440 2,523 1,431 1,841
Bridge Maintenance Improvements (bridges)** 947 994 813 826
Roadway Maintenance (millions)
Total $4,330 $4,118 $2,292 $2,733
Safety Projects $466 $466 $409 $454
Maintenance without Safety $3,864 $3,652 $1,883 $2,279
Bridge Maintenance (millions) $2,600 $1,962 $1,492 $1,604
Cost Per Mile^ $1.584 $1.447 $1.316 $1.238
Cost Per Mile (millions 2017$) $1.584 $1.477 $1.365 $1.286
Cost Per Bridge^^ $2.746 $1.974 $1.835 $1.942
Cost Per Bridge (millions 2017$) $2.746 $2.014 $1.903 $2.017
Average Cost Per Mile (millions 2017$) $1.428
Average Cost Per Bridge (millions 2017$) $2.170
Source(s): IDOT Proposed Highway Improvement Programs for FY 2015-2020, FY 2016-2021, FY 2017-2022, and FY 2018-2023
* Includes reconstruction, resurfacing, and widening projects (does not include safety projects)** Includes bridge replacement, rehabilitation projects, and minor structure repairs
^ Cost per mile calculated using Maintenance without Safety total divided by miles of system maintenance
^^ Cost per bridge calculated using Bridge Maintenance total divided by number of bridges
13
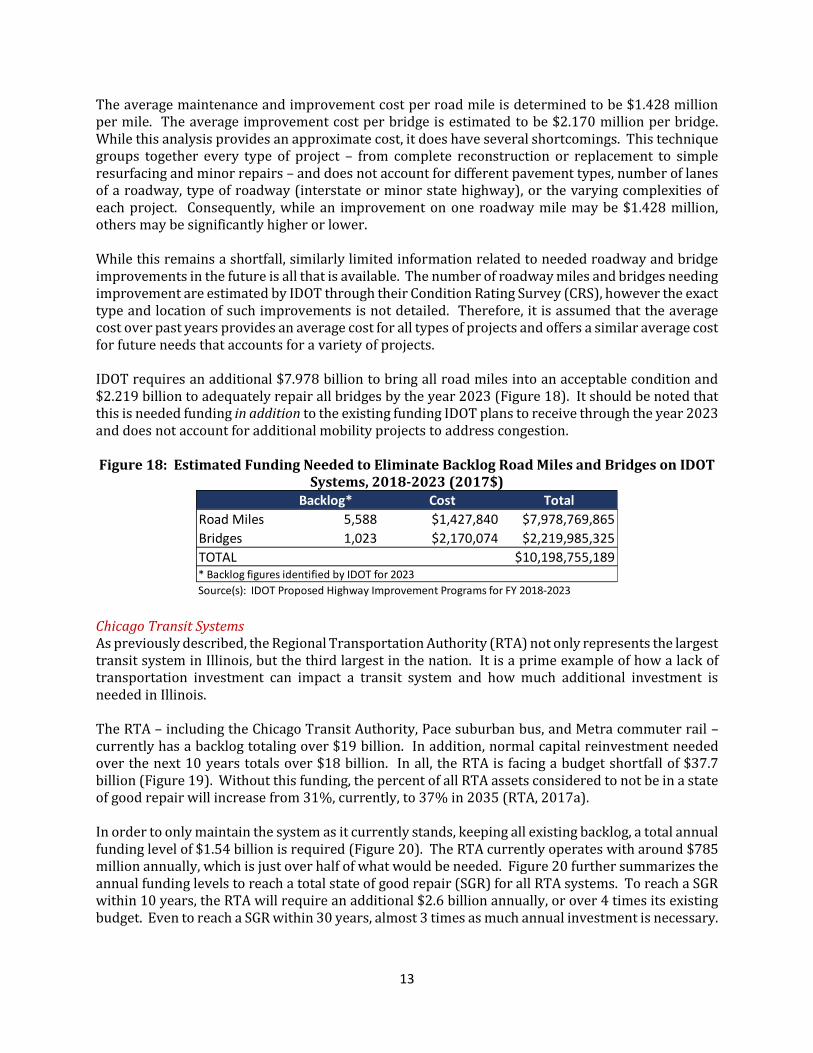
The average maintenance and improvement cost per road mile is determined to be $1.428 million per mile. The average improvement cost per bridge is estimated to be $2.170 million per bridge. While this analysis provides an approximate cost, it does have several shortcomings. This technique groups together every type of project – from complete reconstruction or replacement to simple resurfacing and minor repairs – and does not account for different pavement types, number of lanes of a roadway, type of roadway (interstate or minor state highway), or the varying complexities of each project. Consequently, while an improvement on one roadway mile may be $1.428 million, others may be significantly higher or lower. While this remains a shortfall, similarly limited information related to needed roadway and bridge improvements in the future is all that is available. The number of roadway miles and bridges needing improvement are estimated by IDOT through their Condition Rating Survey (CRS), however the exact type and location of such improvements is not detailed. Therefore, it is assumed that the average cost over past years provides an average cost for all types of projects and offers a similar average cost for future needs that accounts for a variety of projects. IDOT requires an additional $7.978 billion to bring all road miles into an acceptable condition and $2.219 billion to adequately repair all bridges by the year 2023 (Figure 18). It should be noted that this is needed funding in addition to the existing funding IDOT plans to receive through the year 2023 and does not account for additional mobility projects to address congestion. Figure 18: Estimated Funding Needed to Eliminate Backlog Road Miles and Bridges on IDOT
Systems, 2018-2023 (2017$)
Chicago Transit Systems As previously described, the Regional Transportation Authority (RTA) not only represents the largest transit system in Illinois, but the third largest in the nation. It is a prime example of how a lack of transportation investment can impact a transit system and how much additional investment is needed in Illinois. The RTA – including the Chicago Transit Authority, Pace suburban bus, and Metra commuter rail – currently has a backlog totaling over $19 billion. In addition, normal capital reinvestment needed over the next 10 years totals over $18 billion. In all, the RTA is facing a budget shortfall of $37.7 billion (Figure 19). Without this funding, the percent of all RTA assets considered to not be in a state of good repair will increase from 31%, currently, to 37% in 2035 (RTA, 2017a). In order to only maintain the system as it currently stands, keeping all existing backlog, a total annual funding level of $1.54 billion is required (Figure 20). The RTA currently operates with around $785 million annually, which is just over half of what would be needed. Figure 20 further summarizes the annual funding levels to reach a total state of good repair (SGR) for all RTA systems. To reach a SGR within 10 years, the RTA will require an additional $2.6 billion annually, or over 4 times its existing budget. Even to reach a SGR within 30 years, almost 3 times as much annual investment is necessary.
Backlog* Cost Total
Road Miles 5,588 $1,427,840 $7,978,769,865
Bridges 1,023 $2,170,074 $2,219,985,325
TOTAL $10,198,755,189
Source(s): IDOT Proposed Highway Improvement Programs for FY 2018-2023
* Backlog figures identified by IDOT for 2023
14
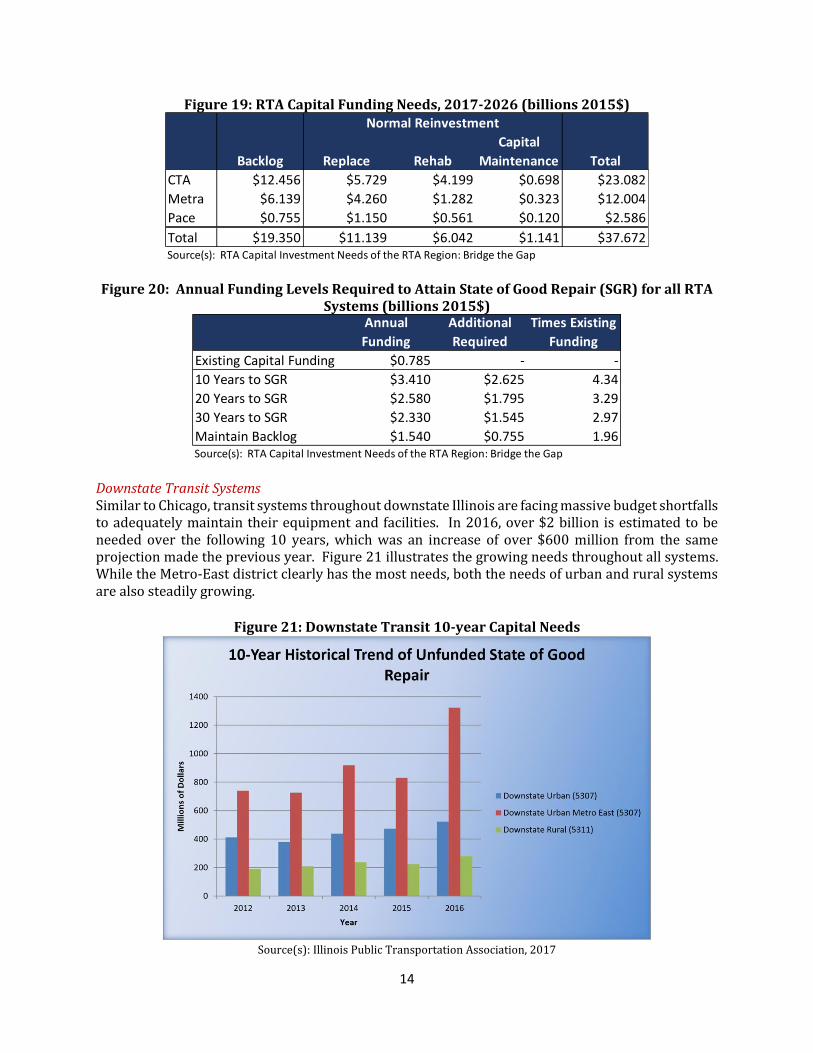
Figure 19: RTA Capital Funding Needs, 2017-2026 (billions 2015$)
Figure 20: Annual Funding Levels Required to Attain State of Good Repair (SGR) for all RTA Systems (billions 2015$)
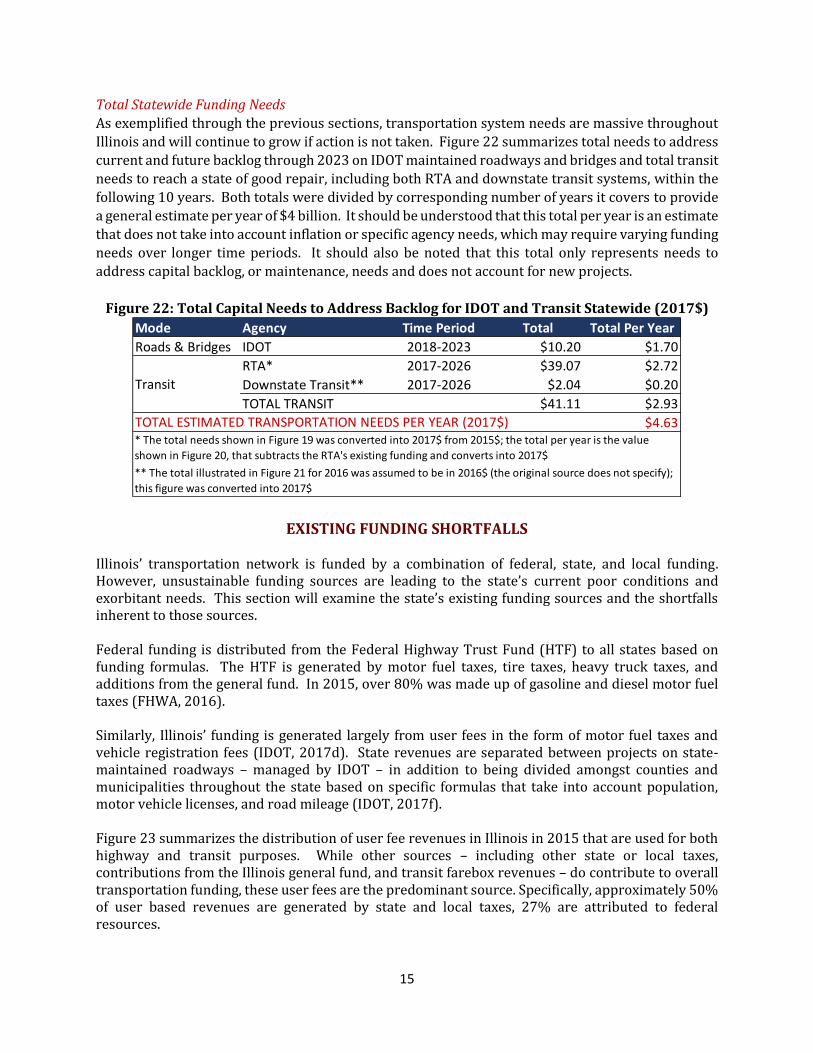
Downstate Transit Systems Similar to Chicago, transit systems throughout downstate Illinois are facing massive budget shortfalls to adequately maintain their equipment and facilities. In 2016, over $2 billion is estimated to be needed over the following 10 years, which was an increase of over $600 million from the same projection made the previous year. Figure 21 illustrates the growing needs throughout all systems. While the Metro-East district clearly has the most needs, both the needs of urban and rural systems are also steadily growing.
Figure 21: Downstate Transit 10-year Capital Needs
Source(s): Illinois Public Transportation Association, 2017
Backlog Replace Rehab
Capital
Maintenance Total
CTA $12.456 $5.729 $4.199 $0.698 $23.082
Metra $6.139 $4.260 $1.282 $0.323 $12.004
Pace $0.755 $1.150 $0.561 $0.120 $2.586
Total $19.350 $11.139 $6.042 $1.141 $37.672
Normal Reinvestment
Source(s): RTA Capital Investment Needs of the RTA Region: Bridge the Gap
Annual
Funding
Additional
Required
Times Existing
Funding
Existing Capital Funding $0.785 - -
10 Years to SGR $3.410 $2.625 4.34
20 Years to SGR $2.580 $1.795 3.29
30 Years to SGR $2.330 $1.545 2.97
Maintain Backlog $1.540 $0.755 1.96Source(s): RTA Capital Investment Needs of the RTA Region: Bridge the Gap
15
Total Statewide Funding Needs
As exemplified through the previous sections, transportation system needs are massive throughout
Illinois and will continue to grow if action is not taken. Figure 22 summarizes total needs to address
current and future backlog through 2023 on IDOT maintained roadways and bridges and total transit
needs to reach a state of good repair, including both RTA and downstate transit systems, within the
following 10 years. Both totals were divided by corresponding number of years it covers to provide
a general estimate per year of $4 billion. It should be understood that this total per year is an estimate
that does not take into account inflation or specific agency needs, which may require varying funding
needs over longer time periods. It should also be noted that this total only represents needs to
address capital backlog, or maintenance, needs and does not account for new projects.
Figure 22: Total Capital Needs to Address Backlog for IDOT and Transit Statewide (2017$)
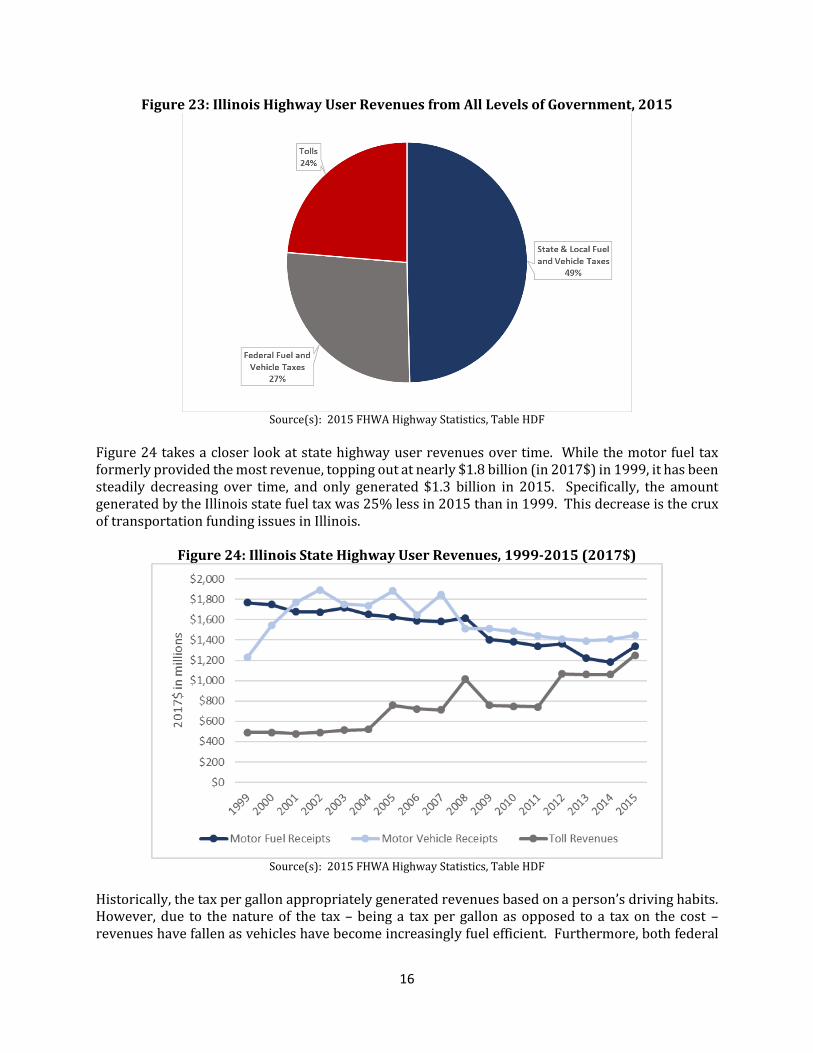
EXISTING FUNDING SHORTFALLS Illinois’ transportation network is funded by a combination of federal, state, and local funding. However, unsustainable funding sources are leading to the state’s current poor conditions and exorbitant needs. This section will examine the state’s existing funding sources and the shortfalls inherent to those sources. Federal funding is distributed from the Federal Highway Trust Fund (HTF) to all states based on funding formulas. The HTF is generated by motor fuel taxes, tire taxes, heavy truck taxes, and additions from the general fund. In 2015, over 80% was made up of gasoline and diesel motor fuel taxes (FHWA, 2016). Similarly, Illinois’ funding is generated largely from user fees in the form of motor fuel taxes and vehicle registration fees (IDOT, 2017d). State revenues are separated between projects on state-maintained roadways – managed by IDOT – in addition to being divided amongst counties and municipalities throughout the state based on specific formulas that take into account population, motor vehicle licenses, and road mileage (IDOT, 2017f). Figure 23 summarizes the distribution of user fee revenues in Illinois in 2015 that are used for both highway and transit purposes. While other sources – including other state or local taxes, contributions from the Illinois general fund, and transit farebox revenues – do contribute to overall transportation funding, these user fees are the predominant source. Specifically, approximately 50% of user based revenues are generated by state and local taxes, 27% are attributed to federal resources.
Mode Agency Time Period Total Total Per Year
Roads & Bridges IDOT 2018-2023 $10.20 $1.70
RTA* 2017-2026 $39.07 $2.72
Downstate Transit** 2017-2026 $2.04 $0.20
TOTAL TRANSIT $41.11 $2.93
$4.63
Transit
TOTAL ESTIMATED TRANSPORTATION NEEDS PER YEAR (2017$)
** The total illustrated in Figure 21 for 2016 was assumed to be in 2016$ (the original source does not specify);
this figure was converted into 2017$
* The total needs shown in Figure 19 was converted into 2017$ from 2015$; the total per year is the value
shown in Figure 20, that subtracts the RTA's existing funding and converts into 2017$
16
Figure 23: Illinois Highway User Revenues from All Levels of Government, 2015
Source(s): 2015 FHWA Highway Statistics, Table HDF
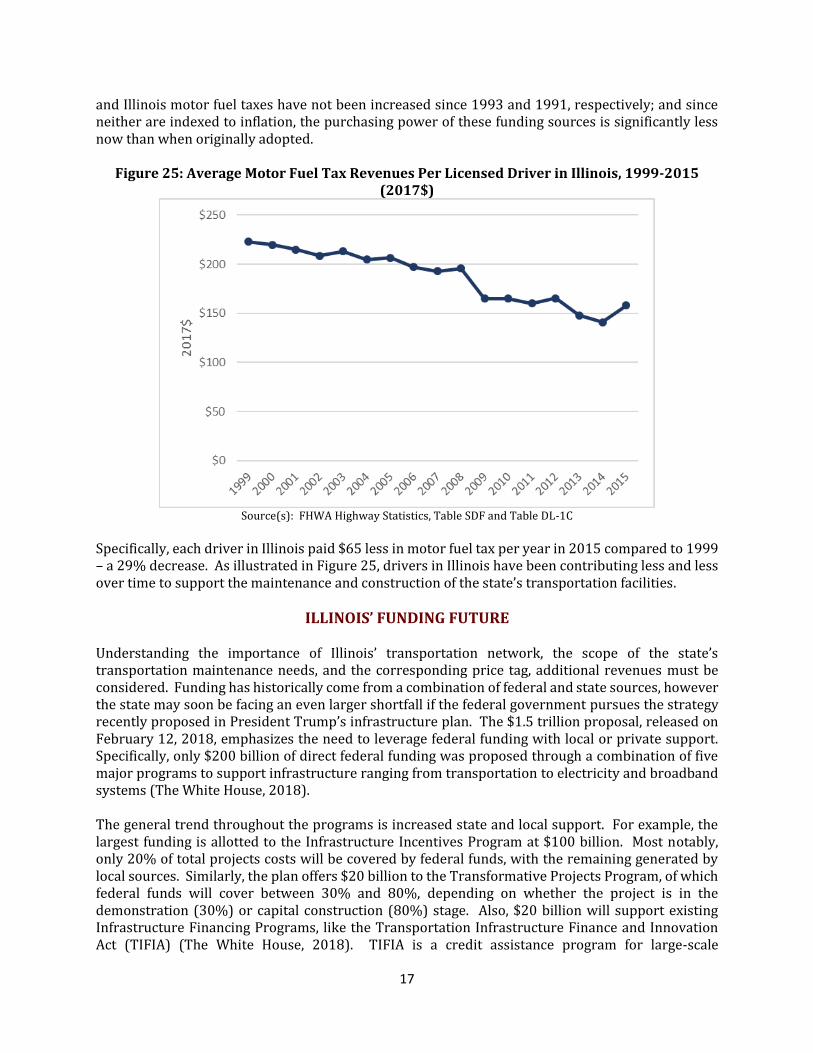
Figure 24 takes a closer look at state highway user revenues over time. While the motor fuel tax formerly provided the most revenue, topping out at nearly $1.8 billion (in 2017$) in 1999, it has been steadily decreasing over time, and only generated $1.3 billion in 2015. Specifically, the amount generated by the Illinois state fuel tax was 25% less in 2015 than in 1999. This decrease is the crux of transportation funding issues in Illinois.
Figure 24: Illinois State Highway User Revenues, 1999-2015 (2017$)
Source(s): 2015 FHWA Highway Statistics, Table HDF
Historically, the tax per gallon appropriately generated revenues based on a person’s driving habits. However, due to the nature of the tax – being a tax per gallon as opposed to a tax on the cost – revenues have fallen as vehicles have become increasingly fuel efficient. Furthermore, both federal
17
and Illinois motor fuel taxes have not been increased since 1993 and 1991, respectively; and since neither are indexed to inflation, the purchasing power of these funding sources is significantly less now than when originally adopted.
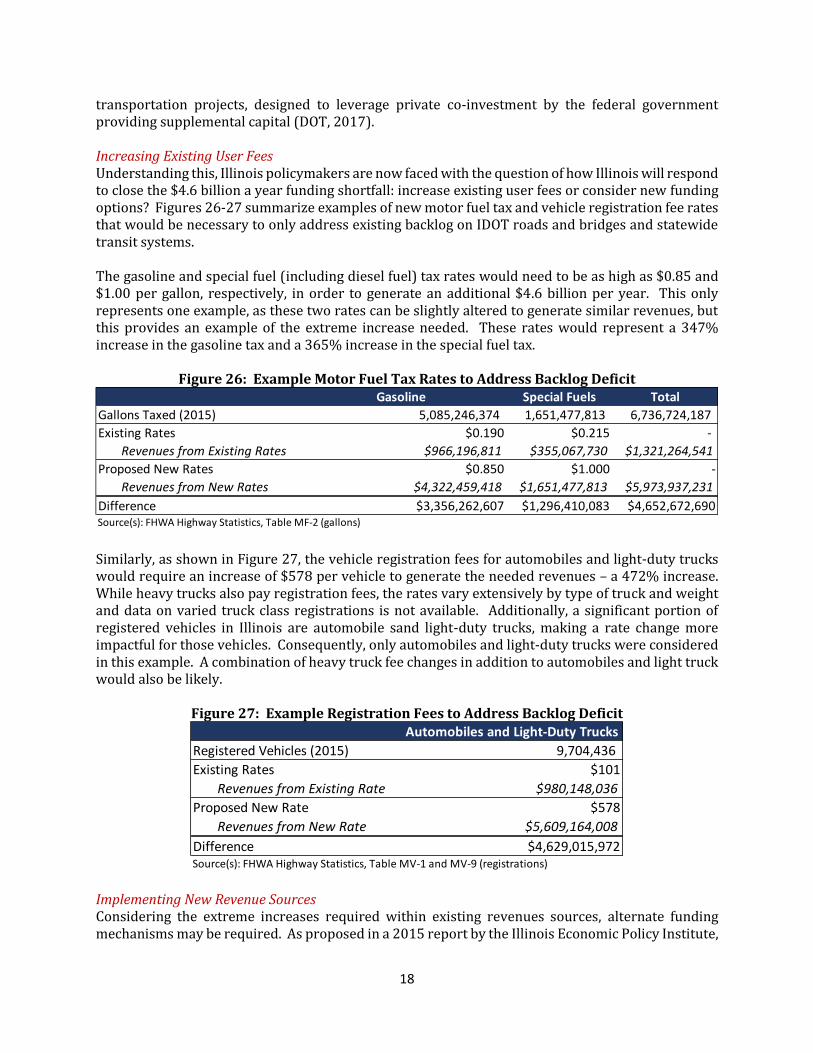
Figure 25: Average Motor Fuel Tax Revenues Per Licensed Driver in Illinois, 1999-2015
(2017$)
Source(s): FHWA Highway Statistics, Table SDF and Table DL-1C
Specifically, each driver in Illinois paid $65 less in motor fuel tax per year in 2015 compared to 1999 – a 29% decrease. As illustrated in Figure 25, drivers in Illinois have been contributing less and less over time to support the maintenance and construction of the state’s transportation facilities.
ILLINOIS’ FUNDING FUTURE
Understanding the importance of Illinois’ transportation network, the scope of the state’s transportation maintenance needs, and the corresponding price tag, additional revenues must be considered. Funding has historically come from a combination of federal and state sources, however the state may soon be facing an even larger shortfall if the federal government pursues the strategy recently proposed in President Trump’s infrastructure plan. The $1.5 trillion proposal, released on February 12, 2018, emphasizes the need to leverage federal funding with local or private support. Specifically, only $200 billion of direct federal funding was proposed through a combination of five major programs to support infrastructure ranging from transportation to electricity and broadband systems (The White House, 2018). The general trend throughout the programs is increased state and local support. For example, the largest funding is allotted to the Infrastructure Incentives Program at $100 billion. Most notably, only 20% of total projects costs will be covered by federal funds, with the remaining generated by local sources. Similarly, the plan offers $20 billion to the Transformative Projects Program, of which federal funds will cover between 30% and 80%, depending on whether the project is in the demonstration (30%) or capital construction (80%) stage. Also, $20 billion will support existing Infrastructure Financing Programs, like the Transportation Infrastructure Finance and Innovation Act (TIFIA) (The White House, 2018). TIFIA is a credit assistance program for large-scale
18
transportation projects, designed to leverage private co-investment by the federal government providing supplemental capital (DOT, 2017). Increasing Existing User Fees Understanding this, Illinois policymakers are now faced with the question of how Illinois will respond to close the $4.6 billion a year funding shortfall: increase existing user fees or consider new funding options? Figures 26-27 summarize examples of new motor fuel tax and vehicle registration fee rates that would be necessary to only address existing backlog on IDOT roads and bridges and statewide transit systems. The gasoline and special fuel (including diesel fuel) tax rates would need to be as high as $0.85 and $1.00 per gallon, respectively, in order to generate an additional $4.6 billion per year. This only represents one example, as these two rates can be slightly altered to generate similar revenues, but this provides an example of the extreme increase needed. These rates would represent a 347% increase in the gasoline tax and a 365% increase in the special fuel tax.
Figure 26: Example Motor Fuel Tax Rates to Address Backlog Deficit
Similarly, as shown in Figure 27, the vehicle registration fees for automobiles and light-duty trucks would require an increase of $578 per vehicle to generate the needed revenues – a 472% increase. While heavy trucks also pay registration fees, the rates vary extensively by type of truck and weight and data on varied truck class registrations is not available. Additionally, a significant portion of registered vehicles in Illinois are automobile sand light-duty trucks, making a rate change more impactful for those vehicles. Consequently, only automobiles and light-duty trucks were considered in this example. A combination of heavy truck fee changes in addition to automobiles and light truck would also be likely.
Figure 27: Example Registration Fees to Address Backlog Deficit
Implementing New Revenue Sources Considering the extreme increases required within existing revenues sources, alternate funding mechanisms may be required. As proposed in a 2015 report by the Illinois Economic Policy Institute,
Gasoline Special Fuels Total
Gallons Taxed (2015) 5,085,246,374 1,651,477,813 6,736,724,187
Existing Rates $0.190 $0.215 -
Revenues from Existing Rates $966,196,811 $355,067,730 $1,321,264,541
Proposed New Rates $0.850 $1.000 -
Revenues from New Rates $4,322,459,418 $1,651,477,813 $5,973,937,231
Difference $3,356,262,607 $1,296,410,083 $4,652,672,690Source(s): FHWA Highway Statistics, Table MF-2 (gallons)
Automobiles and Light-Duty Trucks
Registered Vehicles (2015) 9,704,436
Existing Rates $101
Revenues from Existing Rate $980,148,036
Proposed New Rate $578
Revenues from New Rate $5,609,164,008
Difference $4,629,015,972Source(s): FHWA Highway Statistics, Table MV-1 and MV-9 (registrations)
19
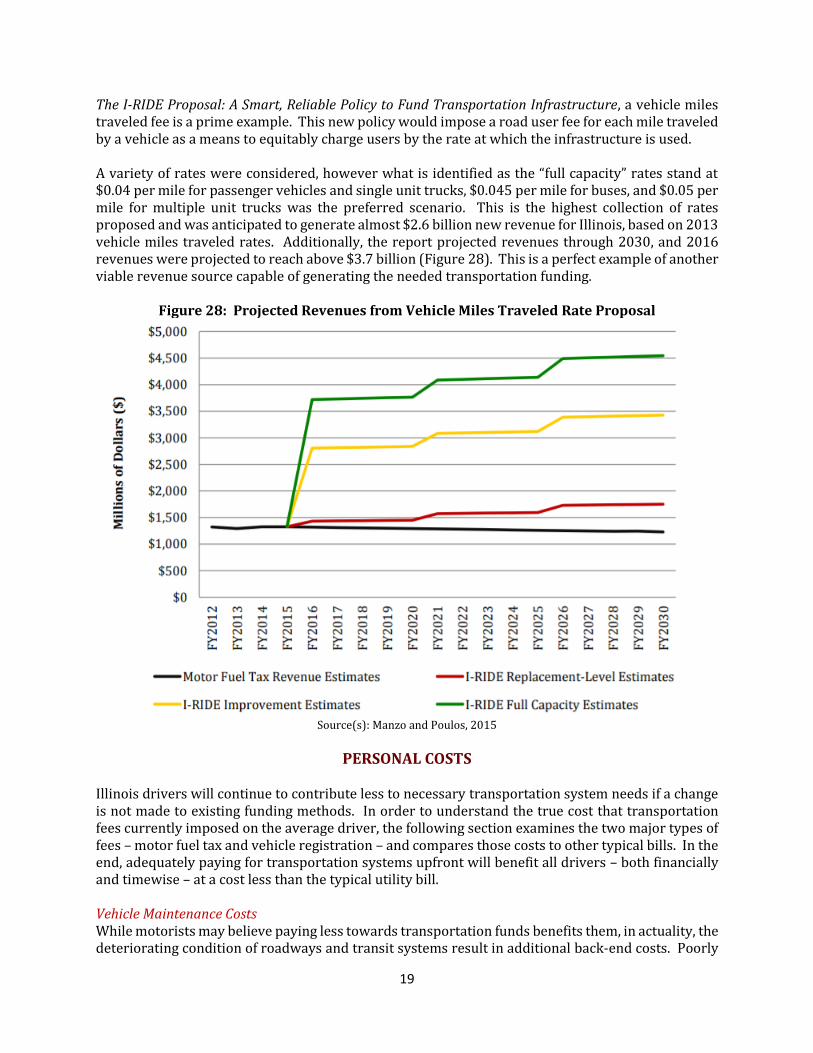
The I-RIDE Proposal: A Smart, Reliable Policy to Fund Transportation Infrastructure, a vehicle miles traveled fee is a prime example. This new policy would impose a road user fee for each mile traveled by a vehicle as a means to equitably charge users by the rate at which the infrastructure is used. A variety of rates were considered, however what is identified as the “full capacity” rates stand at $0.04 per mile for passenger vehicles and single unit trucks, $0.045 per mile for buses, and $0.05 per mile for multiple unit trucks was the preferred scenario. This is the highest collection of rates proposed and was anticipated to generate almost $2.6 billion new revenue for Illinois, based on 2013 vehicle miles traveled rates. Additionally, the report projected revenues through 2030, and 2016 revenues were projected to reach above $3.7 billion (Figure 28). This is a perfect example of another viable revenue source capable of generating the needed transportation funding.
Figure 28: Projected Revenues from Vehicle Miles Traveled Rate Proposal
Source(s): Manzo and Poulos, 2015
PERSONAL COSTS
Illinois drivers will continue to contribute less to necessary transportation system needs if a change is not made to existing funding methods. In order to understand the true cost that transportation fees currently imposed on the average driver, the following section examines the two major types of fees – motor fuel tax and vehicle registration – and compares those costs to other typical bills. In the end, adequately paying for transportation systems upfront will benefit all drivers – both financially and timewise – at a cost less than the typical utility bill. Vehicle Maintenance Costs While motorists may believe paying less towards transportation funds benefits them, in actuality, the deteriorating condition of roadways and transit systems result in additional back-end costs. Poorly
20
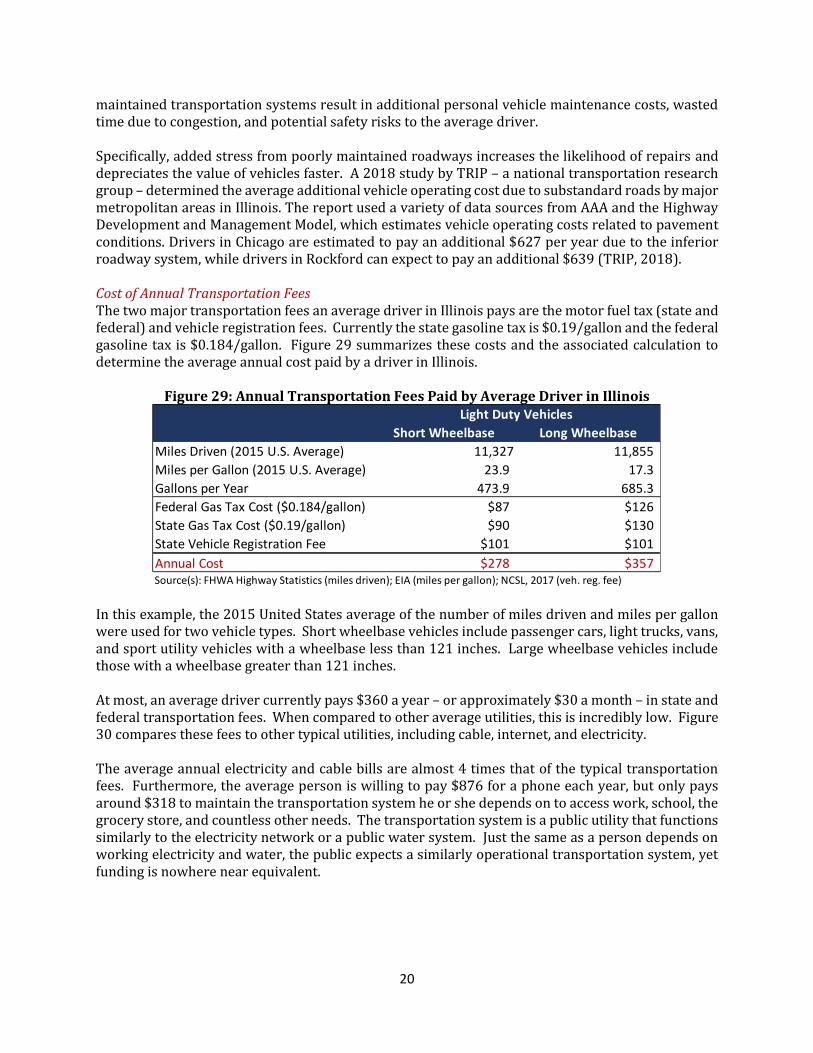
maintained transportation systems result in additional personal vehicle maintenance costs, wasted time due to congestion, and potential safety risks to the average driver. Specifically, added stress from poorly maintained roadways increases the likelihood of repairs and depreciates the value of vehicles faster. A 2018 study by TRIP – a national transportation research group – determined the average additional vehicle operating cost due to substandard roads by major metropolitan areas in Illinois. The report used a variety of data sources from AAA and the Highway Development and Management Model, which estimates vehicle operating costs related to pavement conditions. Drivers in Chicago are estimated to pay an additional $627 per year due to the inferior roadway system, while drivers in Rockford can expect to pay an additional $639 (TRIP, 2018). Cost of Annual Transportation Fees The two major transportation fees an average driver in Illinois pays are the motor fuel tax (state and federal) and vehicle registration fees. Currently the state gasoline tax is $0.19/gallon and the federal gasoline tax is $0.184/gallon. Figure 29 summarizes these costs and the associated calculation to determine the average annual cost paid by a driver in Illinois.
Figure 29: Annual Transportation Fees Paid by Average Driver in Illinois
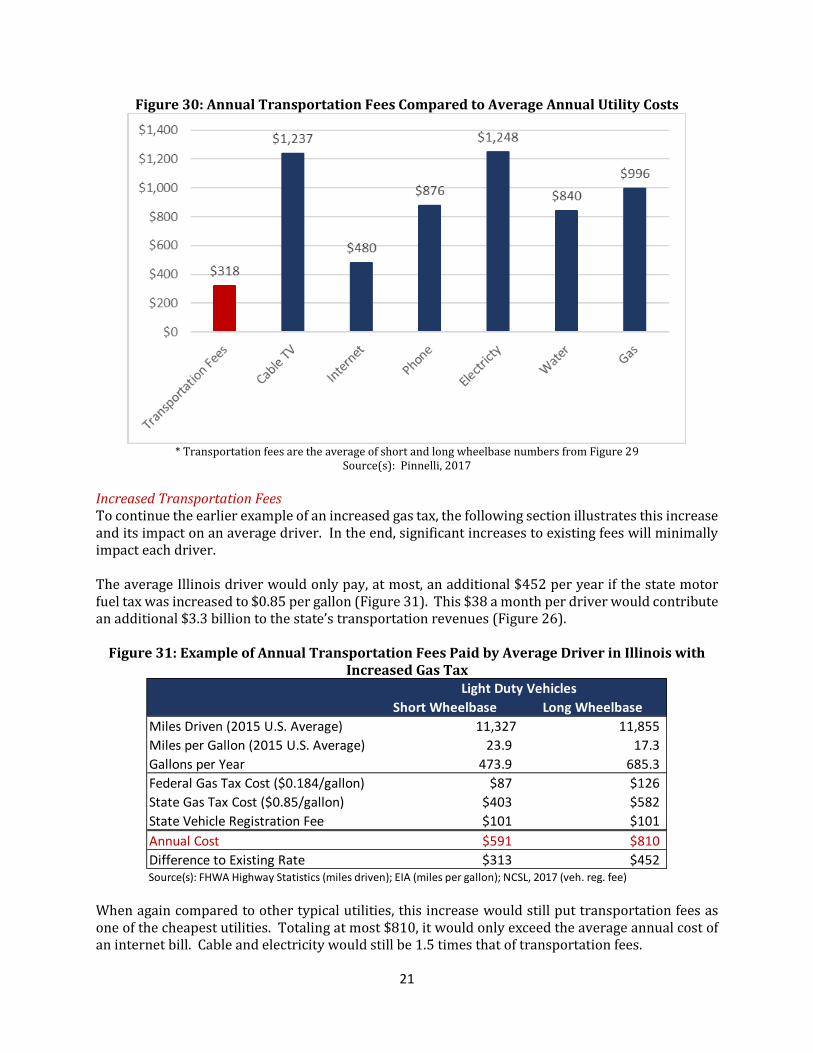
In this example, the 2015 United States average of the number of miles driven and miles per gallon were used for two vehicle types. Short wheelbase vehicles include passenger cars, light trucks, vans, and sport utility vehicles with a wheelbase less than 121 inches. Large wheelbase vehicles include those with a wheelbase greater than 121 inches. At most, an average driver currently pays $360 a year – or approximately $30 a month – in state and federal transportation fees. When compared to other average utilities, this is incredibly low. Figure 30 compares these fees to other typical utilities, including cable, internet, and electricity. The average annual electricity and cable bills are almost 4 times that of the typical transportation fees. Furthermore, the average person is willing to pay $876 for a phone each year, but only pays around $318 to maintain the transportation system he or she depends on to access work, school, the grocery store, and countless other needs. The transportation system is a public utility that functions similarly to the electricity network or a public water system. Just the same as a person depends on working electricity and water, the public expects a similarly operational transportation system, yet funding is nowhere near equivalent.
Short Wheelbase Long Wheelbase
Miles Driven (2015 U.S. Average) 11,327 11,855
Miles per Gallon (2015 U.S. Average) 23.9 17.3
Gallons per Year 473.9 685.3
Federal Gas Tax Cost ($0.184/gallon) $87 $126
State Gas Tax Cost ($0.19/gallon) $90 $130
State Vehicle Registration Fee $101 $101
Annual Cost $278 $357
Light Duty Vehicles
Source(s): FHWA Highway Statistics (miles driven); EIA (miles per gallon); NCSL, 2017 (veh. reg. fee)
21
Figure 30: Annual Transportation Fees Compared to Average Annual Utility Costs
* Transportation fees are the average of short and long wheelbase numbers from Figure 29
Source(s): Pinnelli, 2017
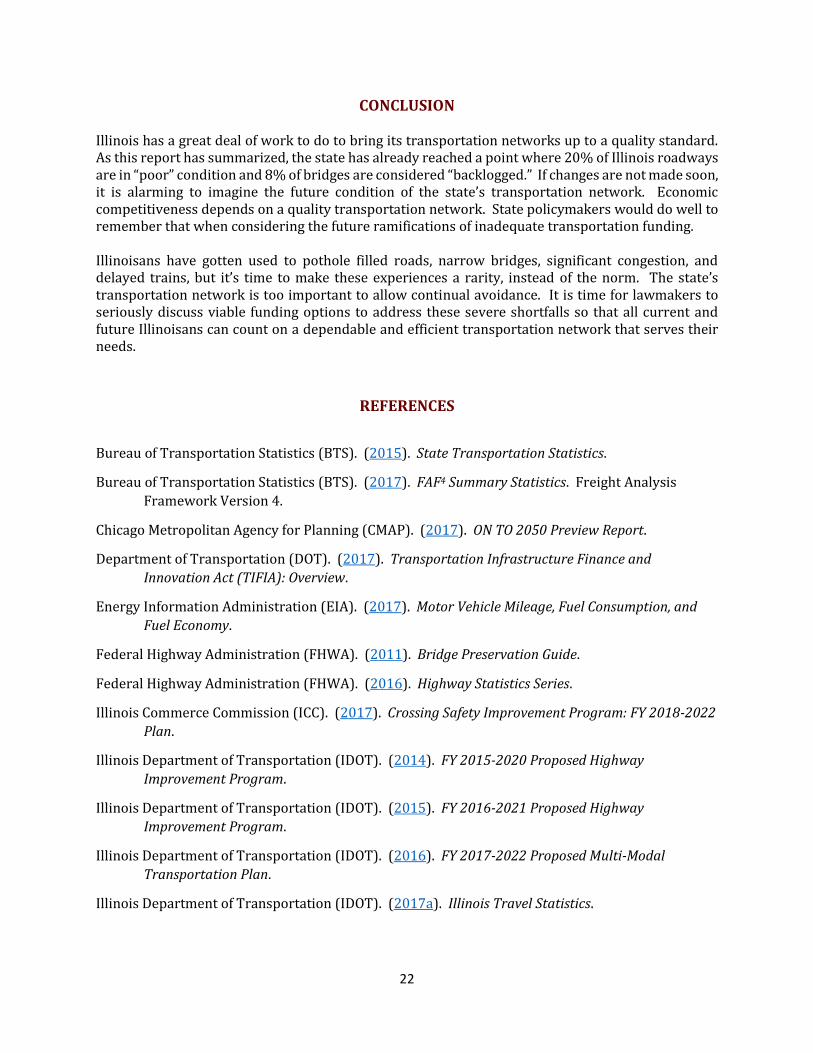
Increased Transportation Fees To continue the earlier example of an increased gas tax, the following section illustrates this increase and its impact on an average driver. In the end, significant increases to existing fees will minimally impact each driver. The average Illinois driver would only pay, at most, an additional $452 per year if the state motor fuel tax was increased to $0.85 per gallon (Figure 31). This $38 a month per driver would contribute an additional $3.3 billion to the state’s transportation revenues (Figure 26).
Figure 31: Example of Annual Transportation Fees Paid by Average Driver in Illinois with
Increased Gas Tax
When again compared to other typical utilities, this increase would still put transportation fees as one of the cheapest utilities. Totaling at most $810, it would only exceed the average annual cost of an internet bill. Cable and electricity would still be 1.5 times that of transportation fees.
Short Wheelbase Long Wheelbase
Miles Driven (2015 U.S. Average) 11,327 11,855
Miles per Gallon (2015 U.S. Average) 23.9 17.3
Gallons per Year 473.9 685.3
Federal Gas Tax Cost ($0.184/gallon) $87 $126
State Gas Tax Cost ($0.85/gallon) $403 $582
State Vehicle Registration Fee $101 $101
Annual Cost $591 $810
Difference to Existing Rate $313 $452
Light Duty Vehicles
Source(s): FHWA Highway Statistics (miles driven); EIA (miles per gallon); NCSL, 2017 (veh. reg. fee)
22
CONCLUSION Illinois has a great deal of work to do to bring its transportation networks up to a quality standard. As this report has summarized, the state has already reached a point where 20% of Illinois roadways are in “poor” condition and 8% of bridges are considered “backlogged.” If changes are not made soon, it is alarming to imagine the future condition of the state’s transportation network. Economic competitiveness depends on a quality transportation network. State policymakers would do well to remember that when considering the future ramifications of inadequate transportation funding. Illinoisans have gotten used to pothole filled roads, narrow bridges, significant congestion, and delayed trains, but it’s time to make these experiences a rarity, instead of the norm. The state’s transportation network is too important to allow continual avoidance. It is time for lawmakers to seriously discuss viable funding options to address these severe shortfalls so that all current and future Illinoisans can count on a dependable and efficient transportation network that serves their needs.
REFERENCES
Bureau of Transportation Statistics (BTS). (2015). State Transportation Statistics.
Bureau of Transportation Statistics (BTS). (2017). FAF4 Summary Statistics. Freight Analysis
Framework Version 4.
Chicago Metropolitan Agency for Planning (CMAP). (2017). ON TO 2050 Preview Report.
Department of Transportation (DOT). (2017). Transportation Infrastructure Finance and
Innovation Act (TIFIA): Overview.
Energy Information Administration (EIA). (2017). Motor Vehicle Mileage, Fuel Consumption, and
Fuel Economy.
Federal Highway Administration (FHWA). (2011). Bridge Preservation Guide.
Federal Highway Administration (FHWA). (2016). Highway Statistics Series.
Illinois Commerce Commission (ICC). (2017). Crossing Safety Improvement Program: FY 2018-2022
Plan.
Illinois Department of Transportation (IDOT). (2014). FY 2015-2020 Proposed Highway
Improvement Program.
Illinois Department of Transportation (IDOT). (2015). FY 2016-2021 Proposed Highway
Improvement Program.
Illinois Department of Transportation (IDOT). (2016). FY 2017-2022 Proposed Multi-Modal
Transportation Plan.
Illinois Department of Transportation (IDOT). (2017a). Illinois Travel Statistics.
23
Illinois Department of Transportation (IDOT). (2017b). Illinois Department of Transportation
Freight Plan.
Illinois Department of Transportation (IDOT). (2017c). Illinois Strategic Highway Safety Plan 2017.
Illinois Department of Transportation (IDOT). (2017d). FY 2018-2023 Proposed Highway
Improvement Program.
Illinois Department of Transportation (IDOT). (2017e). Condition Rating Survey Summary Report.
Illinois Department of Transportation (IDOT). (2017f). Motor Fuel Tax Funds: Source, Distribution
& Uses for County.
Illinois Public Transportation Association (IPTA). (2017). Downstate Transit Needs Presentation.
Manzo, Frank and Marc Poulos. (2015). The I-RIDE Proposal: A Smart, Reliable Policy to Fund
Transportation Infrastructure.
National Conference of State Legislatures (NCSL). (2017). Vehicle Registration Fees by State.
Pinnelli, Kim. (2017). Average Utility Bills Will Shock You. CreditDonkey.
Regional Transportation Authority (RTA). (2016). Capital Asset Condition 2016: Year 5 Assessment.
Regional Transportation Authority (RTA). (2017a). Capital Investment Needs of the RTA Region:
Bridge the Gap.
Regional Transportation Authority (RTA). (2017b). Invest in Transit: The 2018-2023 Regional
Transit Strategic Plan for Chicago and Northeastern Illinois.
Texas A&M Transportation Institute (TTI). (2015). 2015 Urban Mobility Scorecard: Congestion Data
for Your City.
The White House. (2018). Legislative Outline for Rebuilding Infrastructure in America.
TRIP. (2018). Illinois Transportation by the Numbers: Meeting the State’s Need for Safe, Smooth and
Efficient Mobility.
U.S. Census Bureau. (2016). American Fact Finder.
COVER PHOTO CREDITS
Souffle, Anthony. (2016). “Deficit-Laden Illinois’ Infrastructure is Crumbling.” Chicago Tribune.