Embed Size (px)
Citation preview

USER MANUAL

ORCA MANUAL DOCUMENT CONTROL
PAGE 2 OF 30
DOCUMENT CONTROL
.
Revision history
Version Change description Prepared by ORCA version
Issued
1.0 First version RPS 0.8..17.212
03-2009
1.1 RPS 2.0 04-2009
ORCA MANUAL CONTENT
PAGE 3 OF 30
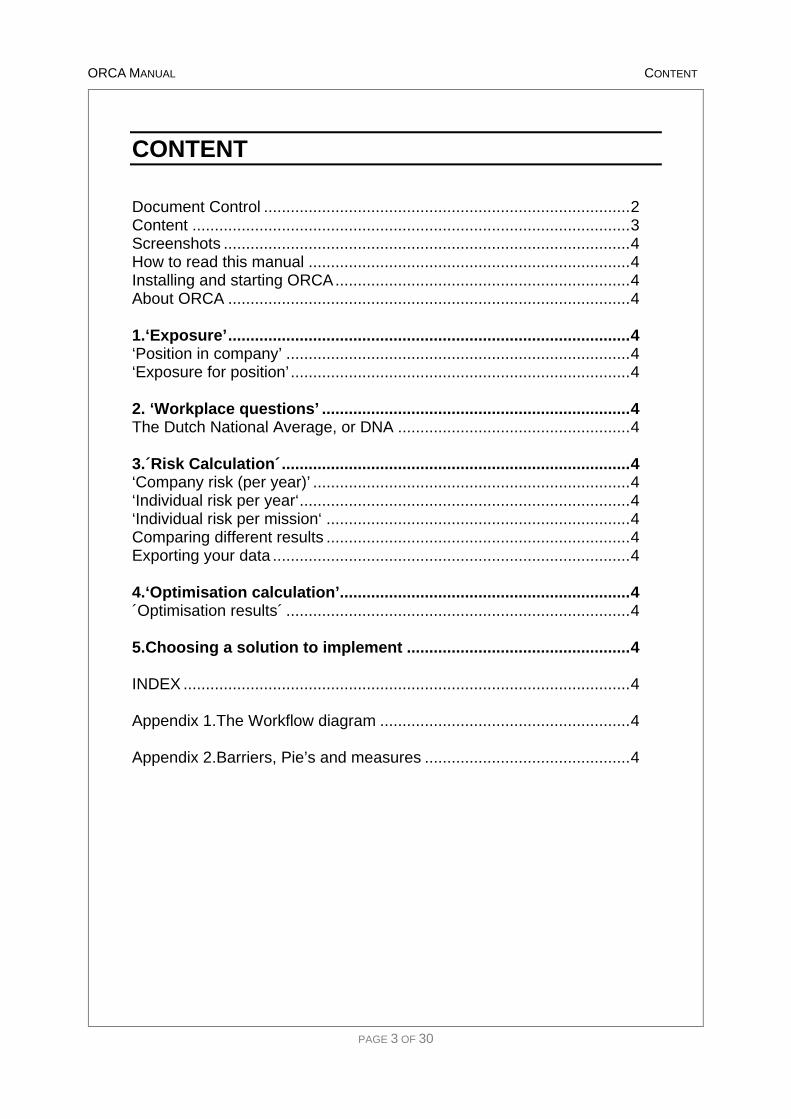
CONTENT
Document Control ..................................................................................2 Content ..................................................................................................3 Screenshots ...........................................................................................4 How to read this manual ........................................................................4 Installing and starting ORCA..................................................................4 About ORCA ..........................................................................................4 1.‘Exposure’....................................... ...................................................4 ‘Position in company’ .............................................................................4 ‘Exposure for position’ ............................................................................4 2. ‘Workplace questions’ ........................... ..........................................4 The Dutch National Average, or DNA ....................................................4 3.´Risk Calculation´............................... ...............................................4 ‘Company risk (per year)’ .......................................................................4 ‘Individual risk per year‘..........................................................................4 ‘Individual risk per mission‘ ....................................................................4 Comparing different results ....................................................................4 Exporting your data ................................................................................4 4.‘Optimisation calculation’....................... ..........................................4 ´Optimisation results´ .............................................................................4 5.Choosing a solution to implement ................. .................................4 INDEX ....................................................................................................4 Appendix 1.The Workflow diagram ........................................................4 Appendix 2.Barriers, Pie’s and measures ..............................................4

ORCA MANUAL
PAGE 4 OF 30
SCREENSHOTS
Screenshot 1 The ORCA tool opening screen........................................................................... 4
Screenshot 2 'Position in Company'........................................................................................... 4
Screenshot 3 Positions in Company in this example ................................................................. 4
Screenshot 4 Choosing a method for identifying hazards ......................................................... 4
Screenshot 5 The hazard list & working context........................................................................ 4
Screenshot 6 Choosing a ‘job:industry’ pair............................................................................... 4
Screenshot 7 Adding activities and their related hazards using the 'activity list' method .......... 4
Screenshot 8 Using the ´advisory activity list` to choose hazards based on these activities. ... 4
Screenshot 9 The 'full activity list' method : picking an activity and agent................................. 4
Screenshot 10 The 'full activity list' method : choosing hazards for the job position ................. 4
Screenshot 11 Exposure for a hazard........................................................................................ 4
Screenshot 12 Workplace questions or PIE's ............................................................................ 4
Screenshot 13 Workplace questions.......................................................................................... 4
Screenshot 14 Answering a typical workplace or 'PIE' question ............................................... 4
Screenshot 15 Calculation of company and DNA risk ............................................................... 4
Screenshot 16 Company risks and thresholds .......................................................................... 4
Screenshot 17 How thresholds determine the coloring of risks................................................. 4
Screenshot 18 The individual risk per year per job position ...................................................... 4
Screenshot 19 The individual risk per mission per job position ................................................. 4
Screenshot 20 Comparing different results................................................................................ 4
Screenshot 21 Example of data export to a text file .................................................................. 4
Screenshot 22 List of measures used in the optimization process............................................ 4
Screenshot 23 Example of a ‘measure’ ..................................................................................... 4
Screenshot 24 PIE Actions for the measure 'guardrails'............................................................ 4
Screenshot 25 Full results for solutions after the optimization process..................................... 4
Screenshot 26 Comparing two different solutions ..................................................................... 4
Screenshot 27 Solution list, showing percentage improvement ................................................ 4
Screenshot 28 Solution list, showing absolute risks .................................................................. 4
Screenshot 29 Comparing and choosing a solution .................................................................. 4

ORCA MANUAL
PAGE 5 OF 30
HOW TO READ THIS MANUAL
This manual can be used as a reference guide while working with the program itself or it can be read as an introductory or learning guide.
By use of a simple example the reader is taught how to use the software tool. The example is a small company that simply builds ‘walls’. To build these wall the company employs bricklayers, forklift drivers and inspectors. Whenever you see this bricklayer symbol, the example is discussed.
Most of the chapter titles refer to the tab-names in the ORCA tool. When the name a chapter refers to a tab it is shown between quotes (e.q. ‘Exposure’).
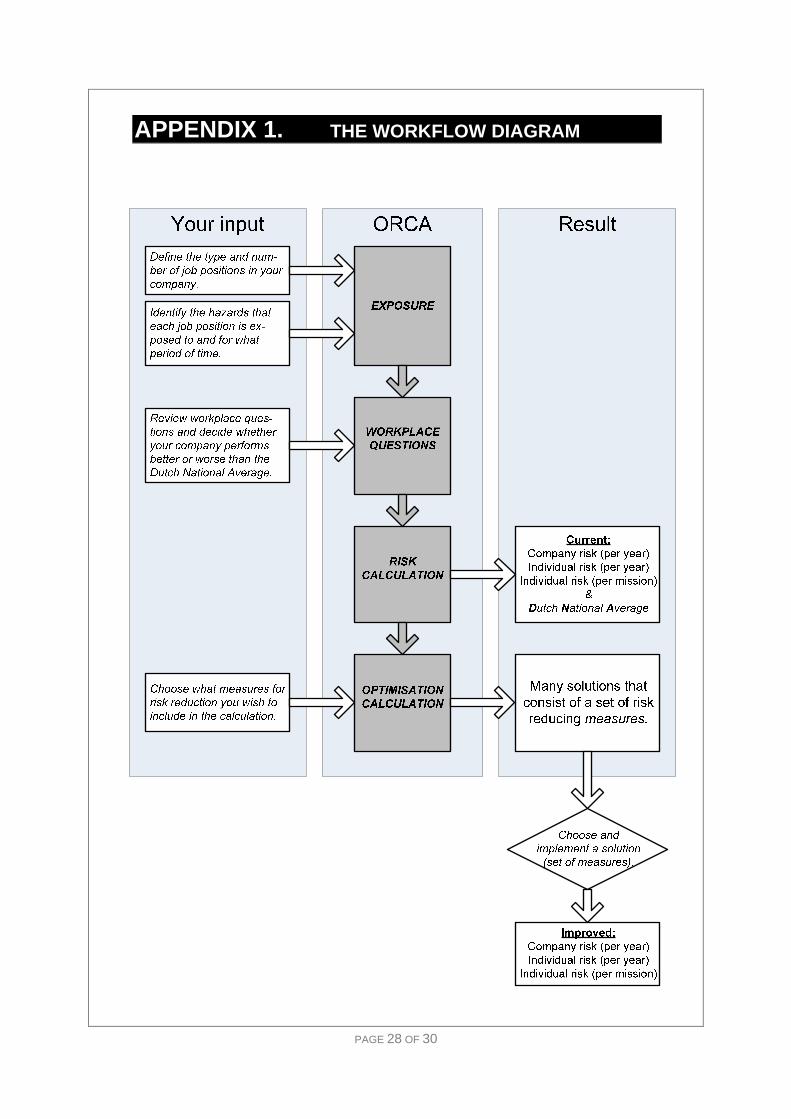
Reading tip: read the manual with the workflow diagram in mind
INSTALLING AND STARTING ORCA
The installation procedure for the ORCA tool is pretty straightforward and resembles most standard installation wizards. After installation has finished, the system does requires a reboot.
After double-clicking the ORCA icon, the tool will start without opening a file. The user is then able to start a new file or open a previously saved file. The file extension used by ORCA is MDB.
Screenshot 1 The ORCA tool opening screen.

ORCA MANUAL
PAGE 6 OF 30
ABOUT ORCA
At the request of the Dutch Ministry of Social Affairs and Employment a model for the calculation of occupational risks has been developed. On a daily basis, workers face the risk of an accident resulting in a fatality, permanent or recoverable injury. These accidents were categorized into 36 scenario’s for each of which a specific bow-tie model has been designed . With the software tool Storybuilder, over 12500 accidents reports made by the Dutch Labour Inspectorate have been analyzed and translated into paths or ‘stories’ through their appropriate bow-tie.
Paths through Storybuilder
Together with Storyfilter and a cost-measure database these efforts have resulted in what is now known as ORCA. The goal of ORCA is to create a company specific risk profile. This profile consists of company risks and individual risks for different job positions. This risk profile also incorporates the actual situation within the company by asking questions about the state of safety barriers. Based on this profile, ORCA is able to present solutions (and their cost) for improving safety. Thereby facilitating an optimal balance between safety and budget.
ORCA, Occupational Risk Calculation

PAGE 7 OF 30
1. ‘EXPOSURE’
Most people who work for a company are exposed to at least one but often several hazards. Each person (or each job position) is also exposed to different hazards for different durations. In ORCA, the first step is to define what job positions in your company you wish include in the process. For each job position you need to define how often these job positions are exposed to different hazards.
‘Position in company’ After you have created a new file, ORCA will immediately present you with a first dialogue box to start off your analysis. This dialogue box asks you to describe a ´Position in Company´. This is simply any job position that is relevant to your analysis. The user can choose between specifiying a ‘position in company’ for each individual (and their unique characteristics) or for a group of people, all performing the same job.
In our example (a small company that constructs walls and employs bricklayers, forklift drivers and inspectors), we have entered the position of ´bricklayer´, thereby specifying an entire group of people and not individuals. Important additional information, which has to be entered on this type of position, is the ´Number in Position´ (in our case there are 60 bricklayers in the company), also the ‘Hours per working week’ and ‘Weeks per working year’ should be entered. In this case bricklayers work for 38 hours every week and 42 weeks in every year.
Screenshot 2 'Position in Company'
Additionally it is possible to incorporate a ´background risk´ into all of the risk calculations. For example, when a bricklayer is working to construct a wall on the premises of a large petrochemical plant this will constitute a background risk, additional to the risk the bricklayer faces because of his construction work.
The example in this manual uses two more positions, that of a forklift driver and an inspector. The table below shows all information for these job positions. To add, edit or delete job positions there are corresponding buttons available in the bottom part of the ORCA tool.
Screenshot 3 Positions in Company in this example

PAGE 8 OF 30
‘Exposure for position’ After clicking on the tab ‘exposure for position’, the first choice which has to be made is on the method you wish to for identifying the hazards for each job position. The choice is between ‘hazard list ’ and ‘activity list ’.The most commonly used method is the ‘hazard list’. For each new job position this choice has to be made.
If, for some reason, you wish to change to the ‘activity list’ method, clicking on the ‘redefine job’ button will clear all hazards and present you with the initial choice between the two methods.
Screenshot 4 Choosing a method for identifying hazards
The ‘hazard list’ method The process of choosing a hazard is relatively easy, just check the hazard(s) of your choice in the checkbox. Added to the hazard list is the ‘working context’. This is merely a description to help choose the appropriated hazard.
Screenshot 5 The hazard list & working context

PAGE 9 OF 30
The ‘activity list’ method This method is a more guided process for selecting appropriate hazards. Although in our example we will select hazards manually (with the ‘hazard list’ method) the ‘activity list’ method also explained in this section. The job position of ‘bricklayer’ is used as an example.
The first step is to add an ‘job:industry’ pair for the bricklayer. For this purpose a classification for jobs and industries (ISCO and NACE) is used. After clicking on the ‘add job:industry’ button you are presented with this list of jobs and industries. For each ‘position’ (in our case a bricklayer’) a job:industry combination has to be chosen. Here we have chosen for the job of ‘Building construction labourers’ in the ‘general construction’ industry.
Screenshot 6 Choosing a ‘job:industry’ pair
After having chosen the appropriate job:industry pair for a job position, the next step is to identify one or more hazards, ORCA helps you to identify activities and their associated hazards. The activity list method has two ways to do this, the ‘advisory activity list’ and the ‘full activity list’.
Screenshot 7 Adding activities and their related hazards using the 'activity list' method

PAGE 10 OF 30
Since activities and hazards are closely associated, ORCA can show you an ‘Advisory activity list’ . You, the user, must then select ‘activity:equipment/location’ pairs.
For example:
Job:Industry = Building construction labourers : General construction Activity:Equipment/location = Handling : building components Hazard = Trapped between
The screenshot below shows the advised Activity:Equipment/location pairs for an industry and the associated hazards. It is up to the user to select one, several or all hazards for a Activity:Equipment/location pair.
Screenshot 8 Using the ´advisory activity list` to choose hazar ds based on these activities.

PAGE 11 OF 30
It’s also possible to select hazards using the ‘Full activity list’ . Here, ORCA will not advise you but instead lets you choose hazards from the entire list. After clicking on the ´Full activity list´ button (Screenshot 7) ORCA will again show you a dialogue box called ‘Choose Activity Equipment Location’ which lets you choose an activity and agent.
Screenshot 9 The 'full activity list' method : picking an activi ty and agent
You are then presented with a second dialogue box: a full list of potential hazards. Obviously, clicking on a checkbox will select a hazard. It is possible to select more than one hazard.
Please note: selected hazards are (again) only for the specified job position.
Screenshot 10 The 'full activity list' method : choosing hazards f or the job position

PAGE 12 OF 30
Choosing the appropriate hazards is an important step in the analysis. Besides performing a desk study, talking with people who actually do the work is often very helpful. They are usually well aware of the hazards they face on a daily basis. They may also be able to provide information on the time they are exposed to these hazards.
For our example, we have chosen several hazards for the bricklayer, forklift driver and inspector. These hazards do not necessarily represent a real-world company, they are meant for illustration purposes only. The chosen hazards are:
Example hazards for the position of ´bricklayer´: � Fall from height - Working on fixed scaffold � Fall on same level � Contact falling object - Manual Handling � Contact handheld tool by self
Example hazards for the position of forklift driver: � Contact falling object - Mechanical lifting � In or on moving vehicle with loss of control
Example hazards for the position of inspector: � Fall from height - Working on fixed scaffold � Fall on same level � Contact falling object – Other
Exposure for hazards When we know what hazards a specific job position is exposed to, it is important to know how often and for how long someone is exposed to this hazard. By picking a hazard and clicking on the ‘edit exposure’ button this information can be put into a dialogue box as shown below.
Screenshot 11 Exposure for a hazard
The exposure dialogue box is divided into two sections: This first section is used to enter how often someone in a job position is exposed to the hazard, that is the ‘Number of occurrences’ per ‘Time unit’. Additionally, information on how long someone is exposed each time can be entered in the second section. Here we have used 3.5 hours per occurrence. An ‘occurrence’ is every moment a hazard is encountered, whether for a minute or several hours.

PAGE 13 OF 30
In our example company we have used these ‘exposure for hazards’:
Bricklayer
“After climbing the scaffolds in the morning, our bricklayers work on scaffolds for 3,5 hours. Around noon they go down for a lunch break of about half an hour and then resume work for another 3,5 hours. Traveling time up and down the scaffolding takes 15 minutes. Each morning and afternoon a 15 minute break on the scaffolding is taken” Working context : Working on fixed scaffold Hazard : Fall from height Exposure : 2 times per day, 3,5 hours each time. Working context : Walking or standing Hazard : Fall on same level Exposure : 4 times per day, 15 minutes each time. Working context : (Being near) manual handling or transport of loads Hazard : Contact falling object Exposure : 2 times per day, 3,25 hours each time. Working context : Working with handheld tool Hazard : Contact handheld tool by self Exposure : 2 times per day, 3,25 hours each time.
Forklift driver
“Our forklift drivers bring bricks to the scaffolding 16 times a day. Lifting the bricks onto the scaffolding takes 10 minutes and driving to and from the scaffolding is a 10 minute trip.”
Working context : Working with or being near mechanical lifting devices Hazard : Contact falling object - Mechanical lifting Exposure : 16 times per day for 10 minutes each time
Working context : Working in or on moving vehicles Hazard : In or on moving vehicle with loss of control Exposure : 32 times per day for 10 minutes each time
Inspector
“The inspectors of the company inspect 4 sites each day on construction and work methods. An entire inspection takes about 1,5 hour. Going to and from these inspections takes 8 trips that last 15 minutes each. During these inspections bricks are delivered by the forklift driver on an average of 12 times a day” Working context : Working on fixed scaffold Hazard : Fall from height Exposure : 4 times per day for 1 hour each time Working context : Walking or standing Hazard : Fall on same level Exposure : 8 times per day for 15 minutes each time Working context : (Being near) manual handling or transport of loads Hazard : Contact falling object Exposure : 12 times per day, 10 minutes each time
PAGE 14 OF 30
2. ‘WORKPLACE QUESTIONS’
The next step in our analysis for improving company safety is answering the so called ‘workplace questions’. The model assumes that an accident is influenced by the unique situation of every individual company. That is, the workplace of every company is different and this fact needs to be taken into account in the analysis.
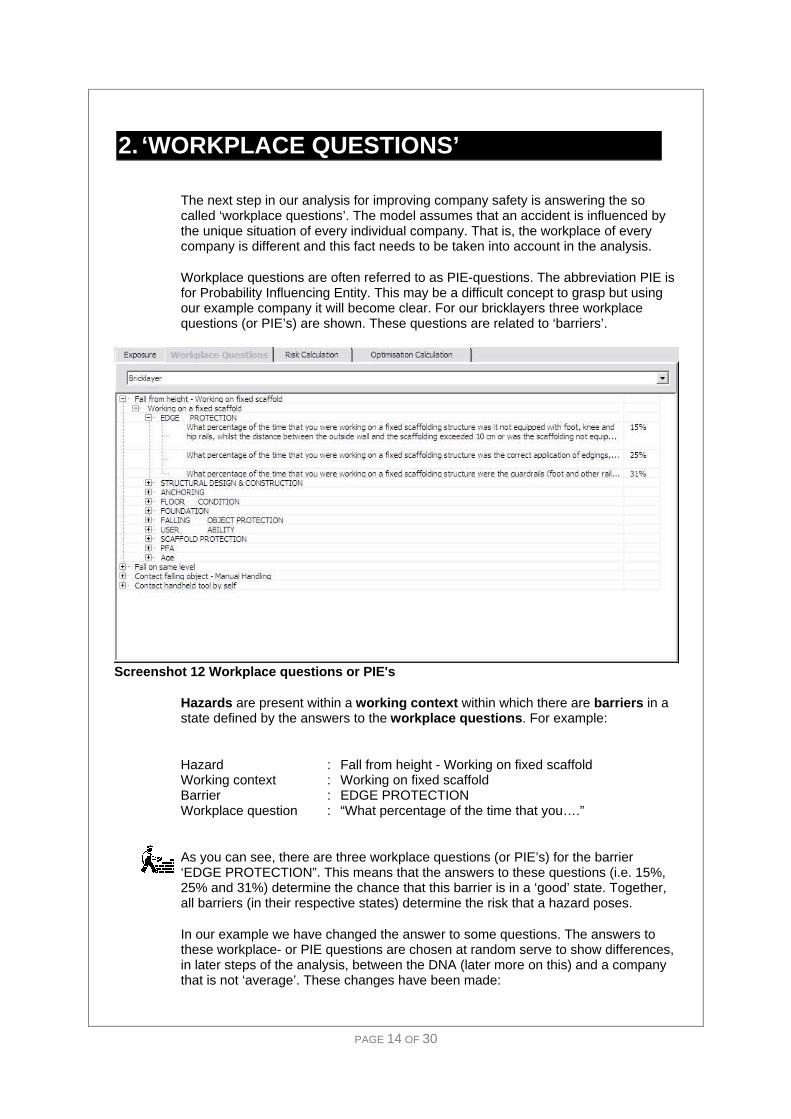
Workplace questions are often referred to as PIE-questions. The abbreviation PIE is for Probability Influencing Entity. This may be a difficult concept to grasp but using our example company it will become clear. For our bricklayers three workplace questions (or PIE’s) are shown. These questions are related to ‘barriers’.
Screenshot 12 Workplace questions or PIE's
Hazards are present within a working context within which there are barriers in a state defined by the answers to the workplace questions . For example:
Hazard : Fall from height - Working on fixed scaffold Working context : Working on fixed scaffold Barrier : EDGE PROTECTION Workplace question : “What percentage of the time that you….”
As you can see, there are three workplace questions (or PIE’s) for the barrier ‘EDGE PROTECTION”. This means that the answers to these questions (i.e. 15%, 25% and 31%) determine the chance that this barrier is in a ‘good’ state. Together, all barriers (in their respective states) determine the risk that a hazard poses.
In our example we have changed the answer to some questions. The answers to these workplace- or PIE questions are chosen at random serve to show differences, in later steps of the analysis, between the DNA (later more on this) and a company that is not ‘average’. These changes have been made:

PAGE 15 OF 30
Screenshot 13 Workplace questions
A word on how the workplace question are phrased is in place: workplace questions are posed in ‘negative’ way. Mostly, they ask for a percentage of time that some form of safety equipment is not present. For example ”what percentage of time did you not wear your safety goggles?“ or “What percentage of the time that you were working on a fixed scaffolding structure were the guardrails missing?”. This means that lower answers are considered to be ‘better’.
The Dutch National Average, or DNA To help answer these (often many) PIE questions with relative ease, ORCA answers them with the Dutch National Average, or DNA. From a population of 52.000 a random sample of 30.000 people from different industries were picked. These people were asked the workplace questions and their answers make up the Dutch National Average to these answers.
This default answer has two advantages. First, the user may accept all answers and then quickly continue with the next step and second, if the answers are adjusted for the typical company workplace circumstances, a comparison with the DNA can be easily made. To adjust the default answer to the PIE questtions, just double-click on the answer (percentage) to show this dialogue box :
Whenever you change your answer, the color of the slide bar will change, depending on whether your answer is ‘better’ or ‘worse’ than the DNA with green being better than red.
Screenshot 14 Answering a typical workplace or 'PIE' question

PAGE 16 OF 30
3. ́ RISK CALCULATION´
In this step ORCA calculates the risk to the entire company, to (groups of) job positions, the risks to individuals and to so called ‘missions’. We will start off with the risk to the company.
‘Company risk (per year)’ The risk calculation step does not need any new information for the user. In the first tab called ´company risk´ the user can instruct ORCA to calculate the risks for his or her company and, for comparison purposes, ask ORCA to calculate the Dutch national average. A simple click on the ´calculate´ button will show the risks to the company, clicking on ´calculate DNA´ will result in the risk to an average Dutch company, comparable to our example company.
The information is shown in several rows and columns. In the rows we recognize the three job positions we have entered in the previous steps and the corresponding amount of job positions.
For both the company risk and the DNA risk, ORCA shows three different risk types. That of the risk for a fatal injury, for permanent injury and for recoverable injury. All risks are shown per year. In our example we can see that the risk for permanent injury for a bricklayer (2,92·10-4) is almost three times higher than the risk for an inspector (1,11·10-4). Comparing the risk to permanent injury that a bricklayer in our example company faces (2,92·10-4) with that of a bricklayer in an ‘average’ company (2,63·10-4) we see that working in our company is slightly more risky. This difference can be explained by the answers to the PIE questions as shown in Screenshot 13. Here some questions were scored lower than the DNA resulting in a higher risk to the bricklayer.
Since no changes were made to the PIE questions for the forkliftdriver or inspector, these risks remain the same as for the DNA.
Screenshot 15 Calculation of company and DNA risk
PAGE 17 OF 30
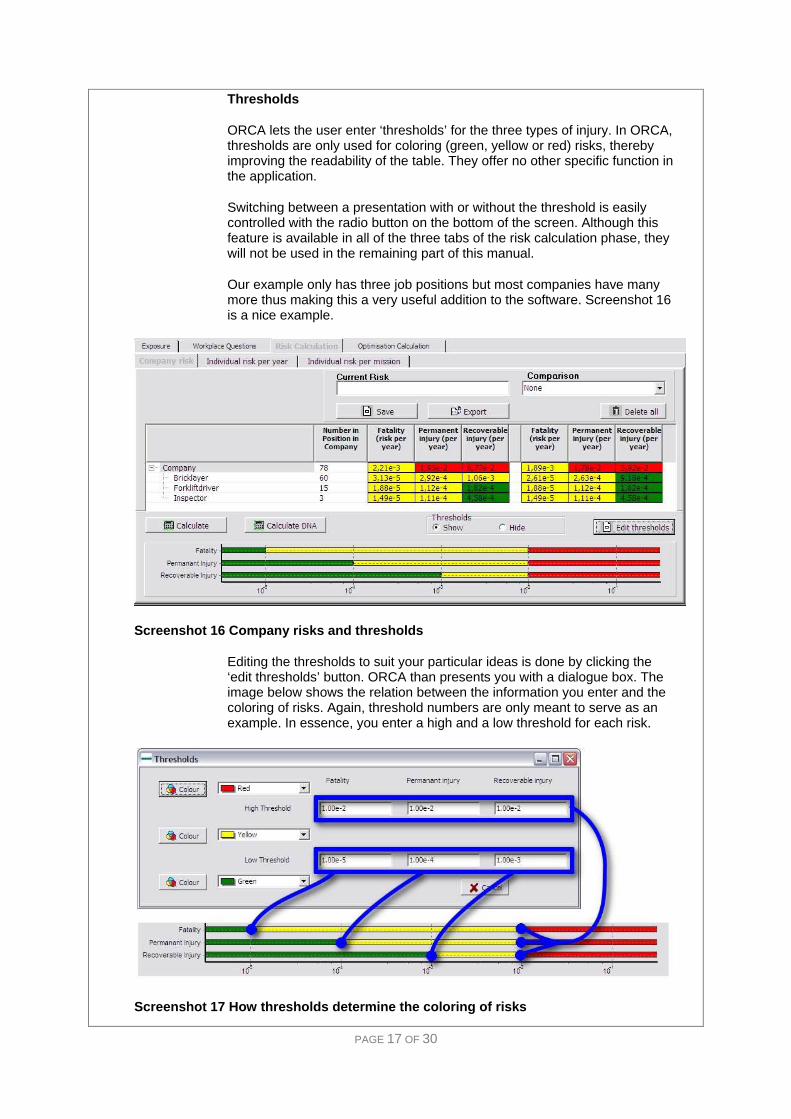
Thresholds
ORCA lets the user enter ‘thresholds’ for the three types of injury. In ORCA, thresholds are only used for coloring (green, yellow or red) risks, thereby improving the readability of the table. They offer no other specific function in the application.
Switching between a presentation with or without the threshold is easily controlled with the radio button on the bottom of the screen. Although this feature is available in all of the three tabs of the risk calculation phase, they will not be used in the remaining part of this manual.
Our example only has three job positions but most companies have many more thus making this a very useful addition to the software. Screenshot 16 is a nice example.
Screenshot 16 Company risks and thresholds
Editing the thresholds to suit your particular ideas is done by clicking the ‘edit thresholds’ button. ORCA than presents you with a dialogue box. The image below shows the relation between the information you enter and the coloring of risks. Again, threshold numbers are only meant to serve as an example. In essence, you enter a high and a low threshold for each risk.
Screenshot 17 How thresholds determine the coloring of risks

PAGE 18 OF 30
‘Individual risk per year‘ This part of the risk calculation step presents more information on the risk individuals face for a specific job position. Again, we will use the position of bricklayer and the risk he faces to permanent injury to illustrate this. The total risk to permanent injury is, again, 2,92·10-5 per year. This risk is the sum of the risks for all 4 hazards that the bricklayer faces (e.g. fall from height, fall on same level, contact falling object and contact handheld tool). In this case we did not use any background risk, therefore it does not show in this example.
Screenshot 18 The individual risk per year per job position
‘Individual risk per mission‘ Next, for each job position a ‘risk per mission’ is shown. The term mission refers back to the exposure step. Here, we assigned the time that the worker is exposed to several hazards. For the bricklayer, our main example, this exposure was:
“After going up in the morning, our bricklayers work on scaffolds for 3,5 hours. Around noon they go down for a lunch break of about half an hour and then resume work for another 3,5 hours. Traveling time up and down the scaffolding is 15 minutes. Each morning and afternoon a 15 minute break on the scaffolding is taken” Working context : Working on fixed scaffold Hazard : Fall from height Exposure : 2 times per day, 3,5 hours each time/mission . Working context : Walking or standing Hazard : Fall on same level Exposure : 4 times per day, 15 minutes each time/mission . Working context : (Being near) manual handling or transport of loads Hazard : Contact falling object Exposure : 2 times per day, 3,25 hours each time/mission .

PAGE 19 OF 30
Working context : Working with handheld tool Hazard : Contact handheld tool by self Exposure : 2 times per day, 3,25 hours each time/mission . The exposures (shown in bold) are presented as ‘missions’ in Screenshot 19 with the risk that they pose to an individual bricklayer over the course of a year.
For example, our bricklayer has a yearly risk of 4,04·10-7 for being permanently injured due to a fall from height when working on a fixed scaffold. Again this is a slightly higher risk than a bricklayer faces in an average Dutch company (3,35·10-7) because of the answers we gave to the PIE questions.
Screenshot 19 The individual risk per mission per job position
Comparing different results In this manual we have only used the DNA to compare the risks of the example company to, but ORCA also has the possibility to make a comparison with previously saved risks. By clicking on the ‘save’ button and entering a name for this set of risks they are saved for later use.
After saving the set of risks it is accessible in the drop-down field under ‘comparison’, providing an easy way to quickly comparing your data.
Screenshot 20 Comparing different results

PAGE 20 OF 30
Exporting your data Next to the save button you will find the export-button. This feature will create a standard text file where the information is separated by a tab. This file can be easiliy imported into for example Microsoft Excel.
The information which is exported into this text file is:
Screenshot 21 Example of data export to a text file

PAGE 21 OF 30
4. ‘OPTIMISATION CALCULATION’
The final step in ORCA, the optimisation process, needs some explanation regarding ‘measures’. The first tab called ‘run optimisation’ initially only has two buttons: ‘Optimiser options’ and ‘Optimise’. By clicking the button ‘optimiser options’ ORCA will show a list of relevant measures:
Screenshot 22 List of measures used in the optimization process
Initially, ORCA selects all measures that can contribute to improving your company safety. By default, all measures are selected for use in the optimization process. Of coarse, it is possible to unselect specific measures. Unselecting specific measures is particularly useful if the company has these measures in place. For example, an anemometer (a tool for measuring wind force) is a standard piece of equipment in the work sites of our company. This equipment is useful because strong winds, when working on heights, can cause harm to an inspector or bricklayer (i.e. falling).
Before unselecting any measure, it is advised to closely look at what the measure actually consists of and decide on how closely the measure matches the situation at your company. There are generally three types of information available for any one measure: a detailed description (for example the goal, implementation, effectiveness of the measure), associated costs and the corresponding ‘PIE actions’ . This information is accessed by clicking the ‘Edit Measure’ button.
Please note: the options ‘new measures”, “measure library” and “calculation options” are advanced options. They are not discussed at this moment.

PAGE 22 OF 30
Screenshot 23 Example of a ‘measure’
The measures in ORCA are supplied ‘as is’ and any changes made in the description fields and PIE actions are not saved. Costs however may be changed by the user because they can change over time or addition costs have to be made according to company specification. Clicking the ´Cost´ button reveals this information. The user can change information regarding the:
Hardware measure: O number of purchases, O cost to purchase.
Time and costs for workmen, supervisors and managers to use the measure: O number of hours to perform tasks, O number for this task, O hourly wage, O yearly Frequency of Task.
Training people to effectively use the measure:
O number of persons training, O daily costs of training, O yearly frequency of training.
All information is then automatically added together and divided by the years the measure is expected to be in service (durability).

PAGE 23 OF 30
Screenshot 24 PIE Actions for the measure 'guardrails'
Finally, the button ‘PIE actions’ will present a pop-up with information on how this measure influences safety. The example above shows the PIE actions for another measure besides the anemometer: guardrails. Let’s have a look at the job position of Bricklayer:
Hazard : Fall from height – Working on fixed scaffold Working context : Working on a fixed scaffold Corresponding bowtie : 01.1.2.2 Fall from height–Working on fixed scaffold Barrier in this bowtie : EDGE PROTECTION The Workplace question : “What percentage of the time that you were…” The answer to this workplace question should be familiar as they have been given in one of the previous steps. Often these answers will be the default DNA value but here, the last answer of 50% is not equal to the DNA because it has been changed by the user.
This information is particularly useful to get more insight in how different parts of the model influence each other. In this case how a measure influences safety or what barriers are influenced (improved) by what measures.
Note: Appendix 2 may help understand how barriers, PIE actions and measures are interrelated.
´Optimisation results´ Now that we have given ORCA all the necessary information it requires, it is time for the optimization step. In this step ORCA will try out many different combinations of measures and calculate their combined effect on company risks. Please note that this optimization step will take some time, all depending on the capacity of your computers system.
The result is a graph presenting the many possible solutions. A solution is defined as a combination of one or more measures. The first screen will show all three types of risks: fatal (color red), permanent (color brown) and recoverable injury (color yellow). These risks can also be shown individually by clicking on the corresponding tab.

PAGE 24 OF 30
Screenshot 25 Full results for solutions after the optimization process
The image above shows the results produced by ORCA. As said, each square represents a set of measures and is plotted in a graph according to the estimated cost for implementing the measures and for the expected new company risk (or number or occupational casualties per year).
Comparing solutions After clicking on a square (=solution), ORCA will show the associated measures in the right-hand list. This is a nice feature but ORCA also lets you compare two different sets of measures, two solutions. Comparing solutions is a little tricky and requires some practice. This is how is works:
O Clicking on a solution (box) will show the associated measures (check-boxes are checked). The square will turn white for all three risk types.
O Clicking on a second solution will turn the first solution into yellow and the second solution will turn white.
O The measures associated with the white solutions are checked. O The measures associated with the yellow solutions are shown on a grey
shaded background.
Screenshot 26 Comparing two different solutions

PAGE 25 OF 30
Zoom and drag function Using the zoom function also requires some persistence to master and is not quite as intuitive as it could be. Here is how the zoom function works:
O Dragging a box with the left mouse button from left-to-right enables a user to zoom-in
O Dragging a box from right-to-left will show the entire graph.
When you are zoomed in on several solutions, the user can drag the screen by holding the right mouse button.
Note: dragging when ‘Logarithmic Risk Axis ‘ is checked may result in losing focus of your position. Dragging is best used in a non-logarithmic scale.
Solution list The ‘solution list’ tab is a complete overview of the measures that make up the solutions. Risks can be shown in absolute risks or in they can show the percentage they improve the risk for fatal, permanent and recoverable injury, compared to the original risk.
Screenshot 27 Solution list, showing percentage improvement
Screenshot 28 Solution list, showing absolute risks
This table can be very, very large. Therefore ORCA lets you export these results into a text file for easy use in, for example, Microsoft Excel.

PAGE 26 OF 30
5. CHOOSING A SOLUTION TO IMPLEMENT
The process of choosing a solution which is to be implemented is different for each and every company. The choice is determined by many factors like costs and feasibility. But there is a rule-of-thumb which can be used to interpret the many solutions presented by ORCA. When we look at the red, brown and yellow solutions, we see that at some point costs show a strong rise while risk reduction is getting smaller. In other words, at some point reducing risks will get more and more costly. Each company has to make it’s own choice on what amount of buget they wish to invest to improve safety.
Once a region has been identified, specific solutions can be compared. How this works was discussed in the previous chapter. In the screenshot below we see two solutions that are selected for comparing: the white and (bright) yellow solutions. The list of measures shows the corresponding measures (measures for the white solution are checked, measures for the bright yellow solution are shaded).
Besides looking into the measures for each solution we can also look at the expected improvement for the three injury classes (fatal, permanent and recoverable injury). As we can see, the two solutions score equally for reduction of the risk for fatal injury. But the first (white) solution scores better for permanent and recoverable injury.
Screenshot 29 Comparing and choosing a solution
If you wish to look into the solutions with even greater, ORCA offers you the possibility to export the data to a text file that can be easily imported into Microsoft Excel. Using the functionality of Excel, it is not hard to sort the data, for example by cost, risk for fatal, permanent or recoverable injury. Lets presume we implement the measures of first solution (the white square). Looking at the solution list we see the improved company risk.
Fatality Permanent Recoverable
Initial company risk 2.21·10-3 1.95·10-2 6.77·10-2
Improved company risk 5.63·10-4 3.98·10-3 1.37·10-2

PAGE 27 OF 30
INDEX
A activity list, 8 Advisory activity list , 10
B background risk, 18
C calculate, 16 calculate DNA, 16 calculation options, 21 company risk, 16 Comparing different results, 19 Cost to purchase, 22
D daily costs of training, 22 durability, 22
E edit exposure, 12 Edit Measure, 21 export-button, 20 exposure for hazards, 13 exposure for position’, 8
F fatal injury, 16 file extension, 5 Full activity list , 11
H hazard list, 8 Hourly wage, 22 Hours per working week, 7
J job:industry pair, 9
M measure library, 21 Microsoft Excel, 20, 25
N new measures, 21 Number for this task, 22 Number in Position, 7 Number of hours to perform tasks, 22 number of persons training, 22 Number of purchases, 22
O Optimise, 21 Optimiser options, 21
P permanent injury, 16 PIE actions , 21, 23 PIE-questions, 14 Position in Company, 7
R recoverable injury, 16 redefine job, 8 run optimisation, 21
T text file, 20
U unselect specific measures, 21
W Weeks per working year, 7 working context, 8, 13 workplace questions, 14 Workplace questions, 14
Y Yearly Frequency of Task, 22 yearly frequency of training, 22
PAGE 28 OF 30
APPENDIX 1. THE WORKFLOW DIAGRAM

PAGE 29 OF 30
APPENDIX 2. BARRIERS, PIE’S AND MEASURES

PAGE 30 OF 30
Page intentionally left blank
ORCA User manual, 2009


![This is an Open Access document downloaded from ORCA ...made available in ORCA are retained by the copyright holders. Submitted to Bernoulli arXiv: 1504.00813 [math.SP] Non-CentralLimitTheoremsforRandom](https://img.dokumen.tips/doc/110x75/60498cf4290b0500160c7b8f/this-is-an-open-access-document-downloaded-from-orca-made-available-in-orca.jpg)


