Embed Size (px)
Citation preview

2013
Orbit.com User Guide
www.orbit.com
IP Business Intelligence Gold and Platinum Versions

User Guide 2013 IP Business Intelligence v. Gold & Platinum - 2 -
Table of Contents
1 – Introduction ................................................................................................................................................................... 3 2 Access to IP Business Intelligence tool .......................................................................................................................... 5 3 – Analysis - Documents Publication years .............................................................................................................................................. 10 Priority years ..................................................................................................................................................... 11 Earliest priority year .......................................................................................................................................... 11 Earliest publication year .................................................................................................................................... 11 Earliest application year .................................................................................................................................... 11 Publication country ........................................................................................................................................... 11 Priority country .................................................................................................................................................. 11 World map ........................................................................................................................................................ 12 Kind Codes ....................................................................................................................................................... 13 Earliest priority year / Publication country ......................................................................................................... 13 Earliest priority year / Priority country ................................................................................................................ 14 4 – Analysis - Assignees or Owners Assignees or Owners ........................................................................................................................................ 15 Acceleration ...................................................................................................................................................... 16 Assignees or owners/ Earliest priority year........................................................................................................ 17 5 – Analysis - Inventors or Representatives Inventors ........................................................................................................................................................... 18 Representative ................................................................................................................................................. 19 6 – Analysis - Technologies Classification ................................................................................................................................................... 20 Classification / Earliest priority year .................................................................................................................. 21 7 – Analysis - Legal Status Legal Status...................................................................................................................................................... 23 Legal State ....................................................................................................................................................... 24 Litigation - US .................................................................................................................................................. 25 8 – Analysis - Concepts Cloud concepts ................................................................................................................................................. 26 Treemap rectangle ............................................................................................................................................ 27 Treemap circle .................................................................................................................................................. 29 9 – Analysis - Citations ..................................................................................................................................................... 35 10 – Analysis - User defined fields ................................................................................................................................... 37 11 – Chart Control Chart size ......................................................................................................................................................... 38 Analysis axis ..................................................................................................................................................... 38 Filter ................................................................................................................................................................. 42 Title .................................................................................................................................................................. 42 Coloring ............................................................................................................................................................ 42 Save in “My Graphs” ......................................................................................................................................... 45 12 – Selection, display and search with a graph Selection in a graph .......................................................................................................................................... 47 Display selection ............................................................................................................................................... 49 Selection search ............................................................................................................................................... 51 Further analysis of the selection........................................................................................................................ 53 Tab Icon ........................................................................................................................................................... 54 13 – Saved Analysis and Rule Creation Saving an analysis ............................................................................................................................................ 55 Creating rules ................................................................................................................................................... 57 Rules Lists ........................................................................................................................................................ 63 14 – Topographical map Reading the map .............................................................................................................................................. 66 Map manipulation ............................................................................................................................................. 67

User Guide 2013 IP Business Intelligence v. Gold & Platinum - 3 -
1 – Introduction
Orbit.com is Questel’s patent and design search portal. 1 - Search module:
Patents: perform patent searches using our the FamPat collection, which covers close to 100 intellectual property offices
Designs & drawings: perform design searches in the collections of 14 intellectual property offices
Order a search: use our expert searching service for prior art searches 2 - Monitor module:
Patents & design: view the result of the SDI (selective dissemination of information) profiles or alerts you've set up through Questel (via Imagination, QPAT, Orbit, or QWEB) on QPAT or Orbit. Alerts remain stored for one year
Legal status: lets you set up and view alerts specifically related to legal status 3 - Search Xpress module: allows you to perform simple patent searches in the FamPat collection 4 - Workfile module: allows you to store documents of your choice in folders in order to analyze and share them 5 - Download module:
Patent copies: download patents in PDF format and keep them stored for one month
File histories: order file histories through Digipat, Questel’s file provider service 6 - Legal services module:
Validation of European patents: through our partner, Valipat, order validation of your European patents in each EP Member Valipat service state
Legal status: lets you set up and view alerts specifically related to legal status
File histories: order file histories through Digipat, Questel’s file provider service
IP litigation: allows you to access US patent litigation information via our partner MaxVal Results from both the Patents Search and Workfiles modules can be integrated in the IP Business Intelligence analysis module.
This manual is an annex to the Patents and Workfiles module manuals. It is focused on the analysis module, IP Business Intelligence (Gold and Platinum versions).

User Guide 2013 IP Business Intelligence v. Gold & Platinum - 4 -
IP Business Intelligence tool analysis Orbit IP Business Intelligence is an analysis and mapping patents Orbit.com fully integrated portal and boasting the latest technology solution. This solution is made unique by several factors, including: • Names of standard companies • Technical Concepts Standard • Standardized Legal Information • unprecedented volumes (up to 2 million patent families can be analyzed) • Instant Processing • Customizable graphs (axes, title, values, filters, ranks ...) • Filters and exclusive areas that may contain research steps • Graphs "stacked" with several color values • Selecting multiple values from all the graphs, the colored subsections of graphs "stacked" • Direct access to selected references from the graphs • direct and immediate interaction with the search • Graphs depth (second level) from an initial selection • Creation and administration of rules for grouping / exclusion: - Companies - Inventors - Agents - IPC codes - ECLA codes - Concepts • Rules of dynamic grouping regular expressions • Mapping based on very precise positioning algorithms Orbit IP Business Intelligence is available in three versions: • Platinum: Full service with ability to analyze up to 2 million documents and save analyzes containing up to 30 000 documents • Gold: Service without mapping or the axis of the graph customization - Ability to analyze up to 50,000 documents and analyzes save up to 15 000 documents • Silver: Service without concepts, maps or graphs management - Ability to analyze up to 15,000 records with backup analyzes up to 15 000 documents
The recommended system configuration is:
Internet Explorer 8 or Firefox 3.5 browsers with pop-ups allowed
Screen resolution 1280 x 1024
Acrobat Reader 9
Java 1.6 Orbit IP Business Intelligence is available on complimentary subscription, please contact your sales representative for information on access and price.

User Guide 2013 IP Business Intelligence v. Gold & Platinum - 5 -
2 – Access to IP Business Intelligence tool
To access the IP Business Intelligence tool, select the documents from the list of results searched in the FamPat collection. The selection limits are 50 000 documents if you have the Gold version, and 2 million documents if you have the Platinum version.
Then click the Analyze button available in the toolbar.
It is also possible to request an analysis of records from the workfiles module if you are connected as an expert (readers cannot access the analysis module from the workfiles). You will then need to save the analysis to access the IP Business Intelligence tool. In the Folders Module, your selection should not exceed 15 000 documents if you have the Gold version, 30,000 documents if you have the Platinum version.
Note: The Analyse button can only be used if you have made a selection of documents.

User Guide 2013 IP Business Intelligence v. Gold & Platinum - 6 -
You will automatically go to the IP Orbit Business Intelligence main page. Here the types of graphs are displayed. Icons on all pages provide access to online helps.
From here you have two options to start an analysis: • Select the type of graph by clicking on the image of the desired graph • Select the data to be analyzed using the dropdown menus The analysis results will be displayed in the graphics tab.
The graphs Eleven graphs are available. Each graph is associated with a given default.
Histogram horizontal Assignees or owners
Histogramme vertical Earliest priority year
Pie chart Legal Status
Bubble chart Assignees or Owners / Earliest priority year
Heatmap Assignees or Owners / Earliest priority year
Treemap rectangle Concepts

User Guide 2013 IP Business Intelligence v. Gold & Platinum - 7 -
As soon as the result of the analysis is displayed, you can modify the data to analyze.
The data to be analyzed You have eight drop menus to analyze your data:
Documents
Assignees or owners
Inventors
Representative A 9th menu, User Defined Fields, is available for records moved from the workfiles module. In each pop-up menu, several options are available. An icon in front of each option tells you the type of graph associated with that analysis.
Histogram vertical Histogram horizontal
World map Pie chart
Bubble chart Heatmap
Cloud Treemap rectangle
Treemap circle Relational graph
Treemap circle Concepts
World map Priority countries
Topographic Map Concepts This analysis is also available using the MAP tab Platinum version only
Cloud Concepts
Relational graph Citations
Technologies
Legal Status
Concepts
Citations

User Guide 2013 IP Business Intelligence v. Gold & Platinum - 8 -
Display and Export of graphs When analysis is requested, the page is automatically divided into two parts. The graph is displayed in the left pane under Hitlist graphs. The right pane displays the Chart control tab. You can view the graph in full screen by clicking the button to the right of the tab bar.
To return to the double windows, click the button again .

User Guide 2013 IP Business Intelligence v. Gold & Platinum - 9 -
For all graphs (except Relational and map), two icons allow you to export the graph: Export in JPEG image format
Export data in CSV
Navigation between IPBI Patent Search and Workfiles Modules
Once in the IPBI module, click on the Back button to return to the previous module, Patent Search or Workfiles.
.

User Guide 2013 IP Business Intelligence v. Gold & Platinum - 10 -
3 – Documents - Analysis
The dropdown menu offers eleven options
PUBLICATION YEARS
PRIORITY YEARS
EARLIEST PRIORITY YEAR
EARLIEST PUBLICATION YEAR
EARLIEST APPLICATION YEAR
PUBLICATION COUNTRY
PRIORITY COUNTRY
WORLD MAP CONTENT
KIND CODES
PUBLICATION YEAR / PUBLICATION COUNTRY
EARLIEST PRIORITY YEAR / PRIORITY COUNTRY
Publication years
The distribution of families according to their year of publication is presented in a vertical bar graph. You will find a family in several bars in the histogram if it contains published on different dates. By default, the graph is presented for a 20 year period, beginning with the most recent publication, and working backward. Mousing over a bar will present you with a tag indicating the year of publication and the number of families with documents published that year. The analysis is done on the PD field.

User Guide 2013 IP Business Intelligence v. Gold & Platinum - 11 -
Priority years
The distribution of families according to their priority years is presented in a vertical bar graph. You will find a family in several bars in the histogram if it contains multiple priority dates. By default, the graph is presented for a 20 year period, beginning with the most recent publication and working backward. Mousing over a bar will present you with a tag indicating the priority year and number of relevant families. The analysis is done on the PR field.
Earliest priority year
The distribution of families following their first year of priority claimed is presented in a vertical bar graph. A family will appear in only one bar. By default, the graph is presented for a 20 year period, beginning with the most recent publication and working backward. Mousing over a bar will present you with a tag indicating the priority year and number of relevant families. The analysis is done on the PRD1 field.
Earliest publication year
The distribution of families following their first year of publication is presented in a vertical bar graph. A family will appear in only one bar. By default, the graph is presented for a 20 year period, beginning with the most recent publication and working backward. Mousing over a bar will present you with a tag indicating the earliest publication year and number of relevant families. The analysis is done on the PDA field.
Earliest application year
The distribution of families following their first year of publication is presented in a vertical bar graph. A family will appear in only one bar. By default, the graph is presented for a 20 year period, beginning with the most recent publication and working backward. Mousing over a bar will present you with a tag indicating the earliest publication year and number of relevant families. The analysis is done on the EAPD field.
Publication country
The distribution of families according to their country of publication is presented in a vertical bar graph. You can find a family in several bars in the graph if it contains several members published in different countries. By default, the top 30 countries are displayed. Mousing over a ar will present you with a tag indicating the country code of the publication country and the number of families with members published this year. The analysis is done on the PN field.
Priority country
The distribution of families according to the first priority country is presented in a vertical bar graph. One family is shown in each bar of the histogram. By default, the top 30 countries are displayed. Mousing over a bubble will present you with a tag indicating the country code of the priority countries and the number of families with members published this year. The analysis is done on the PR field
World map
On this graph, you can see the distribution of families according to their priority countries. You can replace the priority countries by publication country. This graph complements the Publication Country and Priority Country graphs.

User Guide 2013 IP Business Intelligence v. Gold & Platinum - 12 -
By default, the top 30 countries are displayed. Mousing over a country will present you with a tag indicating the name of the country and the number of families claiming priority or published in this country. Beneath the map is a bar graph displaying the priority or publication countries. EP and WO publications will not be displayed on the World Map, but will be presented in the histogram graph.

User Guide 2013 IP Business Intelligence v. Gold & Platinum - 13 -
Kind Codes
The distribution of families according to their publication status code is presented in a pie chart. By default, the top 30 is presented. Each code has a color and mousing over part of the pie will display a bubble indicating the type of document (status code) and the percentage of families with members published with this code. In each part of the pie, you will find an arrow indicating the status code and the number of families with members published with this code. A family can be represented many times depending on the publication stages of its members. The field is used for analysis is PN.
Publication year / Publication country
The distribution of families according to their country of publication and date is presented in two graphs: a bubble graph and a heat map. By default, the graph is presented for a period of twenty years from the date of the most recent and one of the top 30 countries of publication. Mousing over a bubble or rectangle displays the first priority year, the country code and Publication the number of families. A family is present in only one bubble. The field used for analysis is PN. Bubble chart example :

User Guide 2013 IP Business Intelligence v. Gold & Platinum - 14 -
Earliest priority year / Priority country
The distribution of families according to their priority countries and their first priority date is presented in two graphs: a bubble graph and a heat map. By default, the graph is presented for a period of twenty years from the date of the most recent and a top 30 priority countries. Mousing over a bubble or rectangle displays the first priority year, the country code and priority the number of families. The fields used for analysis are PR and PRD1. Heatmap example :

User Guide 2013 IP Business Intelligence v. Gold & Platinum - 15 -
4 – Assignee or Owners Analysis
The dropdown menu presents four options: PATENT ASSIGNEE ACCELERATION ASSIGNEE / EARLIEST PRIORITY YEAR CO-ASSIGNMENT Note: Individuals who are both applicant and inventor are excluded from the assignee analysis.
Patent Assignee
The distribution of families grouped by assignee is presented in a horizontal bar graph. You may find a family in several of the bars if it contains several assignees. By default, the graph shows the top 30 assignees. Hovering over the bars with your cursor will display a text tag indicating the name of the assignee and the number of associated families. The analysis is done on the NPAN field.
User Guide 2013 IP Business Intelligence v. Gold & Platinum - 16 -
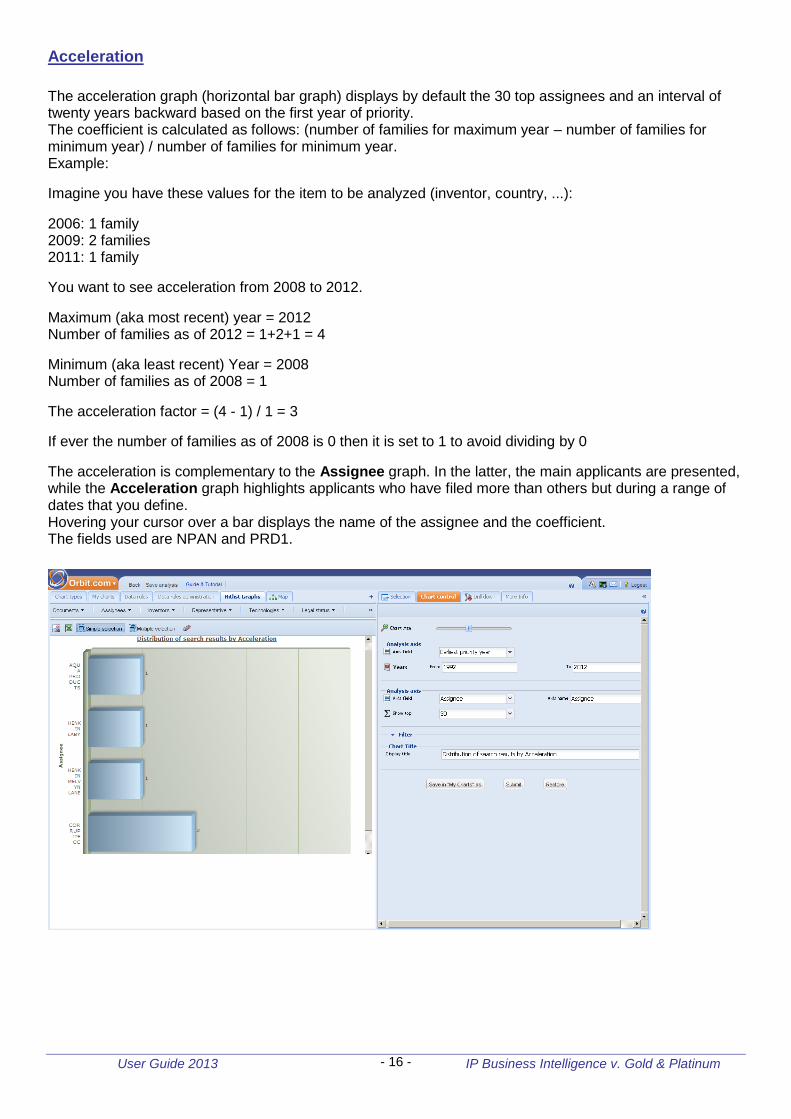
Acceleration
The acceleration graph (horizontal bar graph) displays by default the 30 top assignees and an interval of twenty years backward based on the first year of priority. The coefficient is calculated as follows: (number of families for maximum year – number of families for minimum year) / number of families for minimum year. Example:
Imagine you have these values for the item to be analyzed (inventor, country, ...):
2006: 1 family 2009: 2 families 2011: 1 family
You want to see acceleration from 2008 to 2012.
Maximum (aka most recent) year = 2012 Number of families as of 2012 = 1+2+1 = 4
Minimum (aka least recent) Year = 2008 Number of families as of 2008 = 1
The acceleration factor = (4 - 1) / 1 = 3
If ever the number of families as of 2008 is 0 then it is set to 1 to avoid dividing by 0
The acceleration is complementary to the Assignee graph. In the latter, the main applicants are presented, while the Acceleration graph highlights applicants who have filed more than others but during a range of dates that you define. Hovering your cursor over a bar displays the name of the assignee and the coefficient. The fields used are NPAN and PRD1.

User Guide 2013 IP Business Intelligence v. Gold & Platinum - 17 -
Assignees or owners/ Earliest priority year
The distribution of families grouped by assignee is presented in two ways: as a bubble graph and as a heat map. By default, the graph is presented for an interval of twenty years from the most recent date backward and for the top 30 applicants. Hovering your cursor over a bubble or a rectangle displays the earliest priority year, the name of the assignee and the number of families. A patent family will appear in only one bubble. The fields used are NPAN and PRD1.

User Guide 2013 IP Business Intelligence v. Gold & Platinum - 18 -
Co-assignments
This graph displays the connections between applicants for the set of records analyzed. By default, each group is unfolded to see their connections. Under each purple square, the name of the applicant is shown. Click on the circle to view the following features:
Center: displays only the connection with the selected applicant
Information: indicates the number of families for the applicant
Delete: removal of the applicant from the graph
Explore/Collapse: rearranges the graph
The connections between the applicants are symbolized by a line. When you hover your mouse over the line, a black dot appears. If you click it, you display the number of co-assignments. The following options are present at the top of the graph and allow you to customize it. Options for nodes (connections) are available (green buttons with icons) only if purple squares have been selected and are highlighted in red.

User Guide 2013 IP Business Intelligence v. Gold & Platinum - 19 -
5 – Inventor and Representative Analysis
The menu offers three options Inventors
Acceleration
Inventors / Earliest priority year
INVENTORS The distribution of families according to the inventors is presented in a horizontal histogram graph. You can find a family in several histogram bars if it contains several inventors. By default, the chart shows the top 30 inventors. Bubble overview shows the name of the inventor and the number of families involved. The analysis is done on INN field. INVENTOR / EARLIEST PRORITY DATE The distribution of families by inventor name and the earliest priority date is presented in a bubble graph. By default, the graph is presented for a period of twenty years, backwards, from most recent priority date, and the top 30 inventors. By default, the graph is presented for an interval of twenty years from the most recent date backward and for the top 30 inventors. Hovering your cursor over a bubble displays the earliest priority year, the name of the inventor and the number of families. A patent family will appear in only one bubble. The fields used are INN and PRD1. ACCELERATION By default displays the 30 top inventors and an interval of twenty years backward based on the first priority year. The coefficient is calculated as follows: (number of families for max year – number of families for min year) / number of families for min year. The acceleration is complementary to the Patent Inventor. In the latter, the main inventors are presented, while theAcceleration graph highlights inventors who have filed more than others, in a range of dates defined by the user. Hovering your cursor over a bar displays the name of the inventor and the coefficient. The fields used are INN and PRD1.

User Guide 2013 IP Business Intelligence v. Gold & Platinum - 20 -
Representative Analysis
Two options are offered for analysis:
Representative
Representative / Earliest priority year Attorney data is not comprehensive, and should be present from the following patenting authorities: U.S. since 1971, to EP since 1978, WO since 1978 and GB documents since 1966.
REPRESENTATIVE The distribution of families with agent information is presented in a horizontal histogram graph. If a family has multiple agents, the record will display in several bars of the histogram.
By default, the chart shows the top 30 agents. Placing your cursor over the bars will display a bubble overview with the name of agents and the number of families. The analysis is done on the RPN (Representative Name) field. CORPORATE / FIRST YEAR OF PRIORITY A bubble graph showing the distribution of families by agent name, and the first priority date of the family is displayed.
By default, the graph is presented for a period of twenty years from the most recent priority date, and the top 30 agents. Placing your cursor over a bubble displays the priority year, the agent and the number of families. A family is represented in only one bubble
The analysis is done of the RPN (Representative Name) and PRD1(First Priority Date) fields.

User Guide 2013 IP Business Intelligence v. Gold & Platinum - 21 -
6 – Technologies Analysis
Analysis may be conducted on the following classification schemes: IPC (International), CPC (Cooperation Patent Classification) ECLA (European), PCL (US) and FI (Japanese).
Classification Analysis
For IPC, CPC and ECLA classifications, the analysis can be performed on the complete code, sub-groups and sub-classes.
For the U.S. classification PCL, the analysis can be performed on the complete codes, sub-classes and classes.
For JP FI classification, analysis is performed on the complete code.
For these three classifications, two graphs are available: Pie chart and horizontal Histogram.
By default, the top 30 are presented.
The overview of a portion of Pie chart or a bar in the Histogram shows a bubble classification code and the percentage (for Pie chart) or number (for Histogram) of families with members published with this code.
The analysis is made on the field for the IC IPC classification, the EC field to ECLA, the CPC field for CPC , the PCL field for the U.S. classification and the FI field for JP classification. Example of ECLA codes using the Pie chart :

User Guide 2013 IP Business Intelligence v. Gold & Platinum - 22 -
Example of JP FI terms using the Histogram chart :
Classification / Earliest priority year
For four classifications, IPC (International), ECLA (European), CPC (Cooperative Patent Classifications) PCL (U.S.) and FI (Japanese), it is possible to perform an analysis on the earliest priority year.
Two graphs are available: Bubble chart and heatmap.
By default, the graph is presented for a period of twenty years from the latest date for a top 30 classification codes.
The overview of a bubble or a box displays the first priority year for the classification code and the number of families.
A family can only be present in a single bubble or box.
The analysis is conducted PRD1 field and IC fields IPC classification, EC for ECLA, CPC for Cooperative Patent Classes, PCL for the U.S. classification and FI for JP classification.

User Guide 2013 IP Business Intelligence v. Gold & Platinum - 23 -
Example of IPC groups by earliest priority year with a Bubble Chart :
Example of analysis with US classes by earliest priority year, displayed with a Heatmap Chart:

User Guide 2013 IP Business Intelligence v. Gold & Platinum - 24 -
7 – Analysis - Legal Status
The dropdown menu presents three options:
Legal Status
Legal State
Litigation - US
If you do not see the Legal Status option, click the button available in the menu bar.
Legal Status
Seven statuses are available depending on the publication: Expired: Patent expired, reached the end of the term of protection, associated with Dead/Not in Force Lapsed: Patent did not reached the end of the term of protection, associated with Dead/Not in Force Revoked: Patent revoked, associated with Not in Force Granted: Patent issued, associated with Alive Pending: Patent application in progress, associated with Alive Restored: Patent restored, associated with Alive Unpublished: Associated with Alive The distribution of families according to their legal status is displayed in a pie chart. Statuses are related to States: Dead or Alive (see next paragraph). Each status displays in a different color. Hovering your mouse over a slice of the chart will bring up a tag indicating the state and the percentage of families with corresponding members to that state. A family can be represented in many parts of the pie, if its members have varying statuses. The analysis is conducted on the ACT field.

User Guide 2013 IP Business Intelligence v. Gold & Platinum - 25 -
Legal State
In addition to the statuses (previous paragraph), families can be divided according to their states. There are two possible states, Dead or Alive, which are displayed in different colors. The distribution of families according to their legal state is displayed in a pie chart. Hovering your mouse over a slice of the chart will bring up a tag indicating the state and the percentage of families with corresponding members to that state. A family is considered as being in force/alive when it has at least one member in force (Status: pending, restored, and unpublished). A family is considered not in force/dead when ll its members are dead (Status: expired, lapsed, and revoked). A family cannot be represented in more than one part of the pie chart. The analysis is done on the STATE sub-field of the ACT field.

User Guide 2013 IP Business Intelligence v. Gold & Platinum - 26 -
Litigation - US
If your selection of documents contains US family members that have been the subject of litigation in the United States, a pie chart graph displays. Records with US litigation and records without US litigation are displayed in different colors. Hovering your mouse over a slice of the chart will bring up a tag indicating the presence or absence of litigation. A family will be counted in the Present section if one of its members has litigation. The analysis is done on the CID field.

User Guide 2013 IP Business Intelligence v. Gold & Platinum - 27 -
8 – Analysis - Concepts
The concepts are extracted with linguistic technology from the full text and reflect the semantic content of the patent. Concepts are available for the following publications with an official English language version: EP (except euro-PCT) applications since 1988, PCT applications since mid-2001, US documents since 1971, and GB applications since 1993. Three options are available from the dropdown menu.:
Concept cloud
Treemap rectangle
Treemap circle
If you do not see the Concepts option, click the button available in the menu bar.
Concepts cloud
The key concepts are presented as a cloud. By default, the graph shows the top 75 key concepts. The number in parentheses indicates the number of families with this concept and the size of the characters in the name of the concept is directly related to the importance of the concept in the families analyzed. Families may contain many concepts and will be reflected in more than one part of the cloud. The analysis is done on the KEYW field.
.

User Guide 2013 IP Business Intelligence v. Gold & Platinum - 28 -
Treemap rectangle
The key concepts are presented in a rectangular treemap, organized into clusters and viewable by shades of color. An algorithm determines the shortest distance between concepts and regroups them into clusters. Concepts in a cluster share classification codes.
.
When you hover over a rectangle associated with a concept, the cluster title and the name of the concept are displayed at the bottom of treemap.
User Guide 2013 IP Business Intelligence v. Gold & Platinum - 29 -
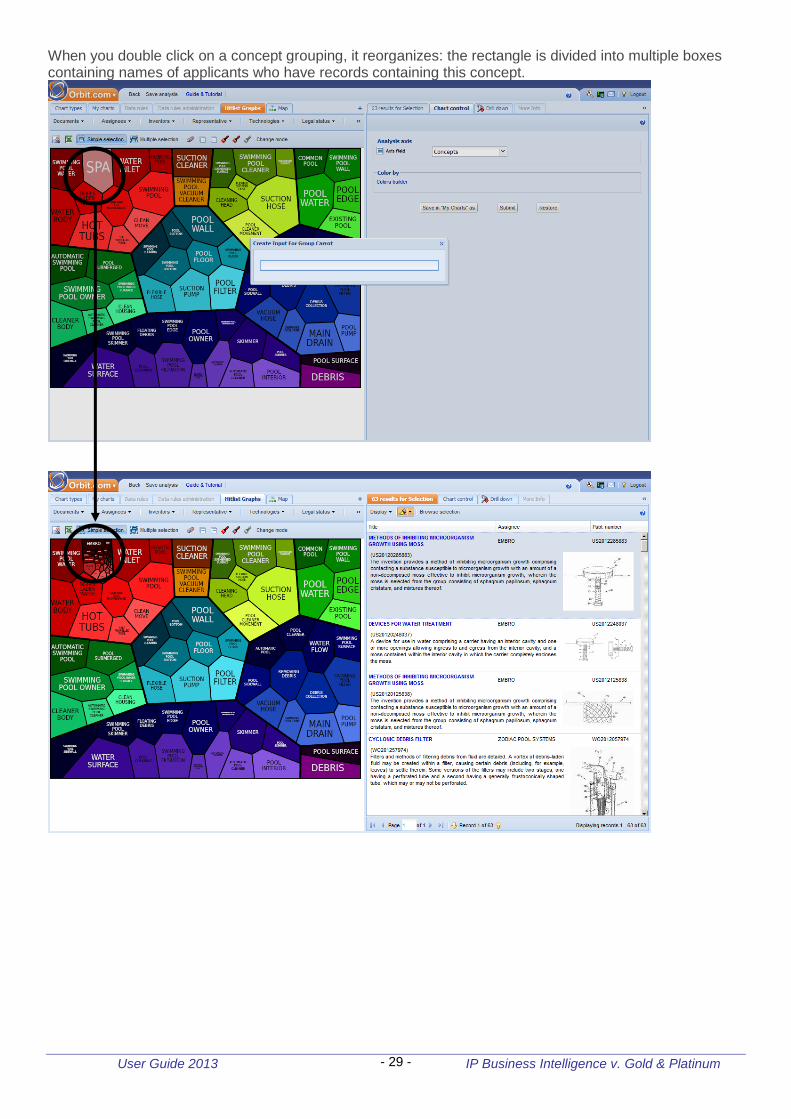
When you double click on a concept grouping, it reorganizes: the rectangle is divided into multiple boxes containing names of applicants who have records containing this concept.

User Guide 2013 IP Business Intelligence v. Gold & Platinum - 30 -
Hovering your cursor over a box will display the name of the concept and the name of the applicant at the bottom of the treemap. The size of the box reflects the number of records sharing the applicant and the concept
Treemap circle
The key concepts are presented as a circular treemap, organized into clusters and viewable by shades of color. An algorithm determines the shortest distance between concepts and regroups them into clusters. Concepts in a cluster share classification codes. On the inner wheel, you view the names of the clusters; on the outer wheel, the concepts contained in each cluster. The arrows in the inner wheel allow the display of additional clusters and the arrows at the level on the outer wheel display all of the concepts in a cluster.

User Guide 2013 IP Business Intelligence v. Gold & Platinum - 31 -
The name of a single cluster is displayed in the central portion of the treemap; it will display alone or followed by the name of a concept as you hover over the inner and outer wheels.
On the inner wheel, you view the names of the clusters; on the outer wheel, the concepts contained in each cluster. The arrows in the inner wheel allow the display of additional clusters and the arrows at the level on the outer wheel display all of the concepts in a cluster.

User Guide 2013 IP Business Intelligence v. Gold & Platinum - 32 -
When you double-click on the name of a cluster, the inner and outer wheels are reorganized to display the cluster and the concepts on a greater area of the graph. To redisplay the original graph, double click on the name of the cluster.
Example double click on the Swimming Pool Cleaning cluster:
When you double-click on the name of a concept, a third wheel appears with the names of applicants who have families containing this concept. Hovering your cursor over the name of an applicant will display the name of the concept and the name of the applicant. Example double click on the concept SWIMMING POOL CLEANER and the cluster CLEANING HEAD

User Guide 2013 IP Business Intelligence v. Gold & Platinum - 33 -
The size of the box reflects the number of families sharing the applicant and the concept.
To redisplay the original graph, double click on the name of the cluster.
User Guide 2013 IP Business Intelligence v. Gold & Platinum - 34 -
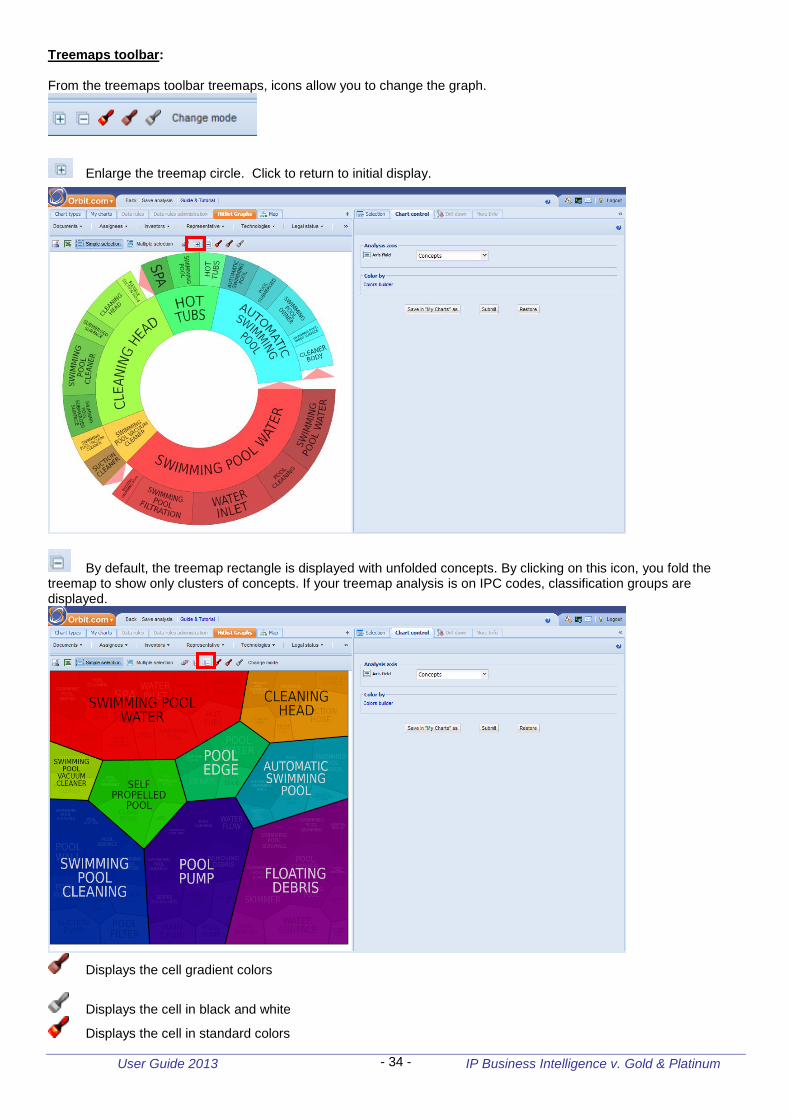
Treemaps toolbar: From the treemaps toolbar treemaps, icons allow you to change the graph.
Enlarge the treemap circle. Click to return to initial display.
By default, the treemap rectangle is displayed with unfolded concepts. By clicking on this icon, you fold the treemap to show only clusters of concepts. If your treemap analysis is on IPC codes, classification groups are displayed.
Displays the cell gradient colors
Displays the cell in black and white
Displays the cell in standard colors

User Guide 2013 IP Business Intelligence v. Gold & Platinum - 35 -
This button displays the treemap cells as a rectangle with rectangular boxes. Click again to return to the default display.

User Guide 2013 IP Business Intelligence v. Gold & Platinum - 36 -
9 – Analysis - Citations
The dropdown menu displays the relational graph of citations between applicants and (for saved analyses only) citing patents. INTER-APPLICANT CITATIONS
This graph displays the connections between applicants for the set of records analyzed. With the Chart Control tab you may filter the results by minimum number of co-assignments and minimum number of families per applicant.
Citations between families are symbolized by an arrow. The direction of the arrow indicates whether the family is cited or citing. When the arrows are pointing to families: these are the cited. In the reverse case, they are the citing.
Each applicant is represented by a blue bubble. When you click on a bubble, it becomes yellow and all the bubbles which are related are also yellow. The number on the bubble indicates the number of families that contain the name of the applicant.
The figure on the line indicates the number of families cited in common between the two applicants.

User Guide 2013 IP Business Intelligence v. Gold & Platinum - 37 -
CITING PATENTS (WITH SAVED ANALYSES ONLY)
You can view horizonal histograms (bar graphs) on the basis of citing patents and other values (see below). By default the top 30 are shown.
-by family: Each histogram reflects the number of families who cite the specified publication number. This gives you the most-cited documents within your batch of analyzed families.
-by applicant: Each histogram reflects the number of families who cite the applicant indicated. So you have most cited applicants within your batch of analyzed families.
-by concepts (only for Gold and Platinum subscriptions): Each histogram reflects the number of families order according to the concepts. So you have these concepts in the most cited documents within your batch of analyzed families.
-by IPC code: Each histogram reflects the number of families order according to the IPC codes. So you have the IPC codes present in most cited documents within your batch of analysed families.
-by inventor: Each histogram reflects the number of families order according to inventors. So you have the inventors in the most cited documents within your batch of analysed families.

User Guide 2013 IP Business Intelligence v. Gold & Platinum - 38 -
10 – Analysis - User defined fields
All custom fields created in your workfiles are parsed fields except "text" types. The custom user-defined fields are indicated by their name and code in parentheses. For each custom field, four graphs are available.
PIE CHART
The distribution of families according to their assigned values is displayed in a pie chart. By default, the top 30 are displayed. Each custom field displays in a different color. Hovering your mouse over a slice of the chart will bring up a tag indicating the custom field and the percentage of families with members correspondings indexed with that value. A family can be represented in many parts of the pie, if multiple FI classifications are used. VERTICAL BAR GRAPH The distribution of families according to the custom fields is displayed in a bar graph. Hovering your mouse over a bar in the graph will bring up a tag indicating the assigned value and percentage of families assigned that value. A family can be represented in many parts of the graph, if multiple classifications are used.
HORIZONTAL BAR GRAPH The distribution of families according to the custom fields is displayed in a bar graph. Hovering your mouse over a bar in the graph will bring up a tag indicating the assigned value and percentage of families assigned that value. A family can be represented in many parts of the graph, if multiple classifications are used.
CUSTOM USER FIELD / EARLIEST PRIORITY YEAR
The distribution of families according to complete FIs is displayed in a bubble graph or a heat map.
By default, the graph is presented for a 20 year period, beginning with the most recent date and working backward. Hovering your mouse over a bubble or a square indicates the Earliest Priority Year and the assigned value and number of families assigned that value. A family will be counted multiple times in the graph based on each classification it has. The analysis is conducted on the PRD1 field.

User Guide 2013 IP Business Intelligence v. Gold & Platinum - 39 -
11 – Chart Control
When a graph is displayed, the right pane automatically opens the Chart control tab. This tab offers several features to customize the graph.
Chart size
Available for all chart types except the treemap and topographical map. The default is 100%. You may reduce charts to 25% or increase to 200%.
Analysis axis

User Guide 2013 IP Business Intelligence v. Gold & Platinum - 40 -
The value of the axis, the name of the axis, the year range and the top are set by default, dependent on the type of graph or analysis chosen. The value of the analysis axis can be changed, shown below are the options available. Publication years Priority years Earliest priority year Earliest publication year Earliest filing year Publication country Priority country Publication kind codes Applicants Inventors Agents IPC group IPC subclass ECLA group ECLA subclass PCL class PCL subclass CPC group CPC subclass JP Classifications (FI) Legal state (Dead or Alive) Legal status U.S. Litigation Concepts User fields
For treemaps and the topographical map, only two options are available:
• Concepts, IPC codes for treemaps
• Publication country, Priority country for the World map
Custom value - in Platinum version only
Not available for saved analysis

User Guide 2013 IP Business Intelligence v. Gold & Platinum - 41 -
If you choose Custom in axis value, a drop down menu is automatically added. By clicking on the + sign, you can add up to eight new menu lines.
Select the data and then “Click to select items”.
A window opens automatically in which you can make selections.
To clear a selection, click on the eraser .

User Guide 2013 IP Business Intelligence v. Gold & Platinum - 42 -
If, in the additional menu items, you choose Custom again, you must enter the contents of the value in Questel command line form.
To clear a selection, click on the eraser . Each value is an axis name that appears in the graph. You can change this name in the text box Axis Label. Years :
A date range can be specified when analyzing dates (publication, priority, earliest publication or earliest priority years). By default, the display is 20 years backwards from the most recent date. Top :
You can also change the value of the top menu: 10, 20, 30, 50, 75, 90 or 100. Top is not available for the date graphs (publication, priority, earliest publication or earliest priority years),
For graphs in which there are two types of data analyzed (Assignee and Earliest Priority Year for example), you can change the value, name, date interval and the top axis. The OK button commits the changes: the graph is updated. The Cancel button removes unsaved changes. The values of the Control chart tab of the graph will be the last defined and validated by the OK button. If you have made and saved changes, the Cancel button does not allow you to redisplay the default graph.

User Guide 2013 IP Business Intelligence v. Gold & Platinum - 43 -
Filter Not available for saved analysis
Available for all chart types except for the treemap, relational and topograhical maps. By default, the Filter is folded. By clicking on the arrow, you unfold the window and you have access to the Filter. The OK button commits the changes: the graph is updated. The Cancel button removes unsaved changes. The values of the Control chart tab of the graph will be the last defined and validated by the OK button. If you have made and saved changes, the Cancel button does not allow you to redisplay the default graph.
Title
The default title of the graph is determined by the values of the graph. This can be changed. The OK button commits the changes: the graph is updated. The Cancel button removes unsaved changes. The values of the Control chart tab of the graph will be the last defined and validated by the OK button. If you have made and saved changes, the Cancel button does not allow you to redisplay the default graph.
Coloring
The Color feature is available for histograms, treemaps and topograhical maps.
User Guide 2013 IP Business Intelligence v. Gold & Platinum - 44 -
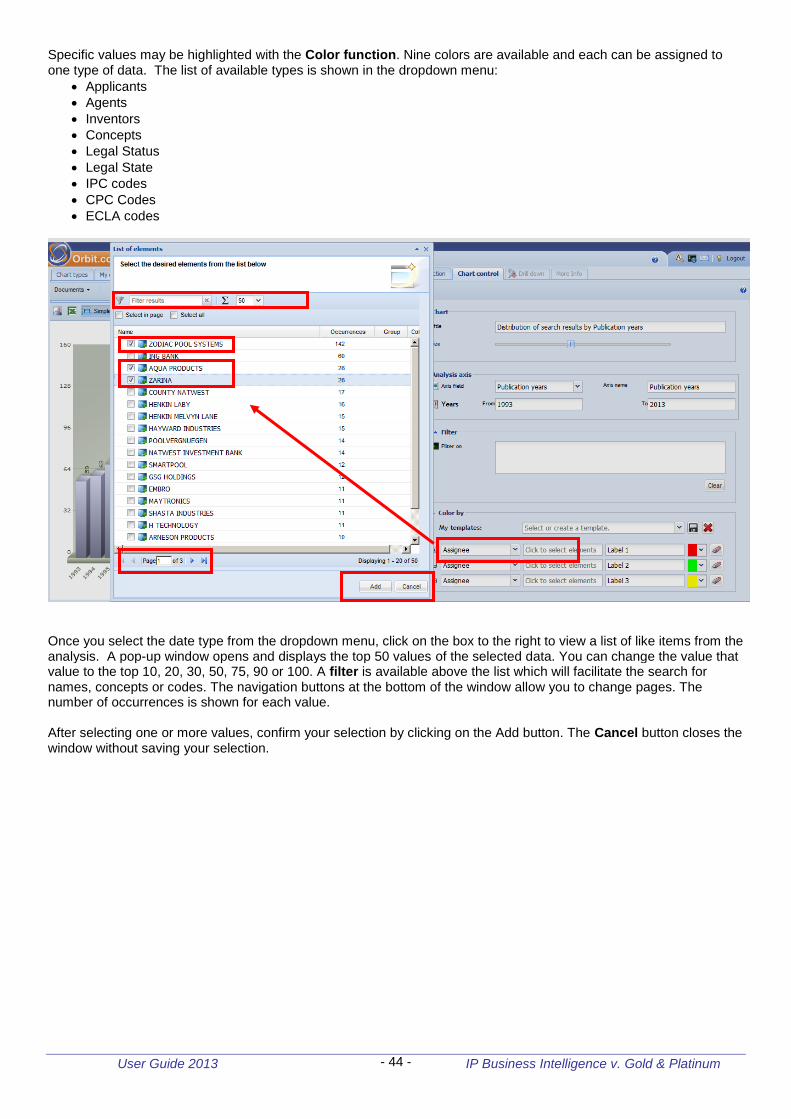
Specific values may be highlighted with the Color function. Nine colors are available and each can be assigned to one type of data. The list of available types is shown in the dropdown menu:
Applicants
Agents
Inventors
Concepts
Legal Status
Legal State
IPC codes
CPC Codes
ECLA codes
Once you select the date type from the dropdown menu, click on the box to the right to view a list of like items from the analysis. A pop-up window opens and displays the top 50 values of the selected data. You can change the value that value to the top 10, 20, 30, 50, 75, 90 or 100. A filter is available above the list which will facilitate the search for names, concepts or codes. The navigation buttons at the bottom of the window allow you to change pages. The number of occurrences is shown for each value. After selecting one or more values, confirm your selection by clicking on the Add button. The Cancel button closes the window without saving your selection.

User Guide 2013 IP Business Intelligence v. Gold & Platinum - 45 -
Click the Easer icon to delete the value (s) added. . The OK button commits the changes: the graph is updated. The Cancel button removes unsaved changes. The values of the Control chart tab of the graph will be the last defined and validated by the OK button. If you have made and saved changes, the Cancel button does not allow you to redisplay the default graph. Color functionality is available for vertical and horizontal graphs and histograms as well as for rectangular and circular treemaps. After submitting the color values, the overview updates. Hovering your cursor over the color will display the value

User Guide 2013 IP Business Intelligence v. Gold & Platinum - 46 -
Example: Three assignees with a color for each
Save in “My Graphs” Changes to the graph can be saved and reused. To do so, you must click “Save in My Charts as”. Name the profile there is a 30 character limit.

User Guide 2013 IP Business Intelligence v. Gold & Platinum - 47 -
"My Charts" Tab :
The My charts tab will display all saved graphs for all analyzes.
If you have saved a graph for analysis 1, the display of the graph for analysis 2 will be conducted on the data from analysis 2; however the specifics of the graph will be as defined in analysis 1. Each saved graph is presented by a vertical bar graph, pie chart etc. The graph style reflects the type of graph displayed when saving. Each graph title will display below the graph representation. Clicking on the chart will open the graph. Clicking delete will remove the graph analysis, use with caution, you will not be prompted to confirm. Click on Rename to change the same of the graph.

User Guide 2013 IP Business Intelligence v. Gold & Platinum - 48 -
12 – Selection, display and search with a graph
Selection in a graph From the graph, you can select one or a set of records. In the Selection tab the corresponding list of records will be displayed.
Enabled by default. By clicking on a part of the graph, the selection appears in green in the graph and the selected documents are automatically displayed in the Selection tab.

User Guide 2013 IP Business Intelligence v. Gold & Platinum - 49 -
If you want to select several parts of a graph, first click on the button and make your selection by clicking on the different sections you want in the graph. The selection appears in green in the graph.
Then click the button to display the documents Selection tab.
To clear a selection, click on the eraser .

User Guide 2013 IP Business Intelligence v. Gold & Platinum - 50 -
Display selection The records are displayed as a list, with 25 family records per page. Three columns are shown: Title, Applicant and Publication Number. The Title and Applicant columns may be alphabetically sorted in ascending or descending order. Click on the column header to sort. The sort function is limited to 5000 records or fewer. At the bottom of the list of documents, the total number of pages and total number of documents is displayed. The yellow arrows navigate from one document to another and will display the position of the document with respect to the record set. The blue arrows are used to change page.
With the Display button, the following options are available:
Short list: title, applicant, and representaive publication number

User Guide 2013 IP Business Intelligence v. Gold & Platinum - 51 -
Click on a Title from the list, you can view all patent family information from the Patent search module.the information of the family in the search Patents. To return to the analysis, click the Back to List button.
Enables or disable highlighting of terms used in the initial search. Clicking on the arrow to the right of the button opens the highlight wizard which allows you to change the contents of the highlighted terms. This tool is also found in the Patent and Workfiles Modules.

User Guide 2013 IP Business Intelligence v. Gold & Platinum - 52 -
Selection search
The Browse Selection button exports the selected results to the Patent Search module. In this way you can build new search criteria for analysis. To return to the analysis you will need to either reload results from the Search module into the analysis or go to your Saved Analysis page and select one to display. Using the Browse feature creates a new query in your search history which includes the publication numbers in the Selection list. Once in the Patent Search Module you can search for citations, similar patents, or using the query in combination with other search steps.

User Guide 2013 IP Business Intelligence v. Gold & Platinum - 53 -
NOTE: Similar to clicking a Title in the Selection tab, use the Browse function selection creates a query in your search history. This query is automatically generated in your search history. You may use this as a basis for a new analysis.
To return to the analysis, click the orange Orbit.com tab and select the Analysis option.

User Guide 2013 IP Business Intelligence v. Gold & Platinum - 54 -
Further analysis of the selection Once documents are displayed in the Selection tab, the Drill down tab is active. By clicking on the Drill down tab, you get only valid complementary graphs for selected documents.
The choice of data to be analyzed is done from the Display menu of the selection for the following options:
IPC Codes
ECLA Codes
CPC Codes
US PCL Codes
Assignees or owners
Inventors
Representative
Concepts
Legal State
Legal Status
Litigation - US Four tyeps of graphs are available:
Cloud
Histogram horizontal
Histogram vertical
Pie chart

User Guide 2013 IP Business Intelligence v. Gold & Platinum - 55 -
More Info Tab When using the classification analysis, the More Info tab is enabled. By clicking the classification in the graph the corresponding definition may be displayed. For ECLA and U.S. PCL, the definition is displayed directly in the tab, click the + sign to unfold the entire definition. For IPC, CPC and JP FI classifications, a link is available to the WIPO (World Intellectual Property Organization) and IPDL (Industrial Property Digital Library) EPO (European Patent Office) websites.

User Guide 2013 IP Business Intelligence v. Gold & Platinum - 56 -
13 – Saved Analysis and Rule Creation
Saving an analysis The Save analysis button allows you to save the current analysis.Saved analyzes are available in the Patent search Module under Previous Sessions / Saved Analysis. Load a saved analysis to display any preset or personal graph. With saved analysis the rules features are available.
In the window that opens, name the analysis (30 alphanumeric characters maximum). The description is optional. The Ok button saves the anayslis. Cancel closes the window without saving.

User Guide 2013 IP Business Intelligence v. Gold & Platinum - 57 -
Once the graph is saved, you return to the chart types page. The Data rules and Data rules administration tabs are now active.
Limitations and Restrictions
• For an analysis of records from the worfiles module, you must save the analysis.
• The Platinum version allows you to save analyzes based on maximum 30,000 documents. The limit is 15,000 documents for the Gold version.
• The Custom axes, and filters are not available with the saved analysis. Access saved analysis :
Statistical analysis saved in the IP Business Intelligence module from searches conducted in the Patent Search module or workfiles in the Workfile module are displayed and available in the Saved Analyses section.
The Name column indicates the name of the analysis as it was entered when the analysis was saved. The Description column displays the (optional) description entered when the analysis was saved. The Date column shows the date in the format YYYY MM/DD. The NB column indicates the number of analyzed families. The Source column indicates if your analysis has been run on results from the Patent search module or from the Workfiles module.
From the Actions column, you can:
View: reopen the analysis. Analyses are only recalled, not executed again. If documents
have been updated in the interim, the requested analysis will not show these changes
Rename: change the name of your analysis
Delete: erase the analysis
User Guide 2013 IP Business Intelligence v. Gold & Platinum - 58 -
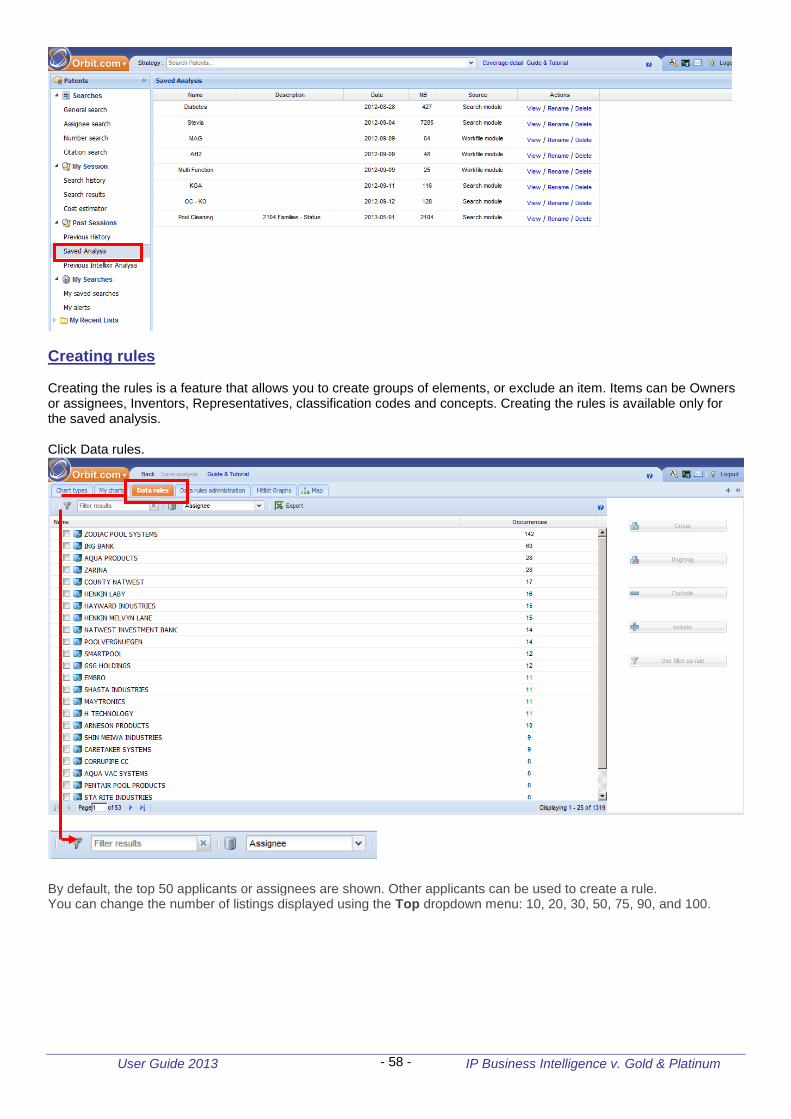
Creating rules Creating the rules is a feature that allows you to create groups of elements, or exclude an item. Items can be Owners or assignees, Inventors, Representatives, classification codes and concepts. Creating the rules is available only for the saved analysis. Click Data rules.
By default, the top 50 applicants or assignees are shown. Other applicants can be used to create a rule. You can change the number of listings displayed using the Top dropdown menu: 10, 20, 30, 50, 75, 90, and 100.

User Guide 2013 IP Business Intelligence v. Gold & Platinum - 59 -
On the list and for each data type, there are two columns:
Name column: you will find the names or codes (depending on what you have chosen in the drop-down menu) as well as the selection box.
Occurrences column: for each data listing, there is the corresponding number of relevant families.
By default, the list is organized according to a descending sort of the occurrences. You can change the sorting by clicking on the column header or by clicking on the black arrow (visible at the far right of the header field when you hover over the column header). After displaying the data you want and make your selection, you can create rules.
Once you have checked items in the list, the Group and Exclude in the right panel buttons are active. Grouping : Clicking the button opens the Save Rule window Enter a name for the new rule (Group) or select a rule already created if you want to add new elements this group. The description is optional. Specify whether you want the rule available for this analysis only or saved on your ID. Then click Save rule.

User Guide 2013 IP Business Intelligence v. Gold & Platinum - 60 -
. Once a group is created, (blue for this analysis only, grey for user scope) it is visible in your list: the given name is indicated in bold and a number in parentheses indicates how many names or codes are grouped together. Click on the arrow next to the name to unfold the grouping and view the names or codes.
If you have grouped the names of assignees in the assignee analysis graphs, it is the group name which will be shown on the graph as well as in the assignee column in the Selection tab. Ungrouping :
If you wish to cancel your grouping, select the group. All the names or codes are then checked: If you want to delete only certain data from the grouping, select the individual items from the list contained in the group. Then click the Ungroup button. One of the following messages will display: -‘ Are you sure you want to remove the selected elements from the rule «rule name?’ Yes/No: If you certain members of the Group -‘ Are you sure you want to remove the rule «rule name’ Yes/No: If you want to delete your group entirely
All changes will be taken into account the next time you display a chart or graph.

User Guide 2013 IP Business Intelligence v. Gold & Platinum - 61 -
Exclude/Include :
The exclusion function allows you to leave some data off your displayed graphs. The data excluded are not included in the analysis until you include them again. When you have selected the data to exclude, click the Exclude button. The excluded data appears in red in the list.
To reinclude data, select the data and click the Include button. The data will reappear in black.
All changes will be taken into account the next time you display a chart or graph.
Filter : A filter is available to search for assignees beginning with a certain name, codes beginning with a certain class, and more. A minimum of three characters is required. Unlimited truncation is automatically added to the left and right of the term. The filter allows you to display a number of data greater than 100. The X allows you to clear the filter and display the full list again. The Select All option allows you to quickly select all listings while the Deselect All option will undo your entire set of selections. From the filtered data, you can select all names to exclude or group. Through the filter, you can also create dynamic groups (see Dynamic Group section below). Example group created under the name BANKS

User Guide 2013 IP Business Intelligence v. Gold & Platinum - 62 -
DYNAMIC GROUPING
A dynamic group will group names or codes automatically based on your definition. From the filter, enter a template name or code using an entire name or code or a partial name or code. For example, if you want to automatically group all applicant names that contain BANK, enter BANK in the filter. All Banks related to your analysis will be displayed as one group. To save the group click on the button Use filter as rule located on the right side of the screen. A pop up window opens with option to specify whether you want the grouping applied universally or only to the specific analysis. With the classic grouping procedure, you determine what specific Bank variations you want to group, while with an automatic dynamic grouping, all Banks are grouped. If you choose to use your dynamic rule for all your analyses, all Banks will be grouped without requiring you to intervene (even if those used to create the rule are missing).
Once your group is created, it is visible in your list: the given name is indicated in bold and a number in parentheses indicates how many names or codes are grouped together. Click on the arrow to unfold the grouping and view the names or codes. If you have grouped the names of assignees in the assignee analysis graphs, it is the group name which will be shown as well as in the assignee column in the Selection tab.
All changes will be taken into account the next time you display a chart or graph.
User Guide 2013 IP Business Intelligence v. Gold & Platinum - 63 -
Export :
A CSV export function is also available which will export the currently displayed list (data and number of listings). The list generated by the filter is not exportable.
On the list and for each data type, there are two columns:
Name column: you will find the names or codes (depending on what you have chosen in the drop-down menu) as well as the selection box.
Occurrences column: for each data listing, there is the corresponding number of relevant families.
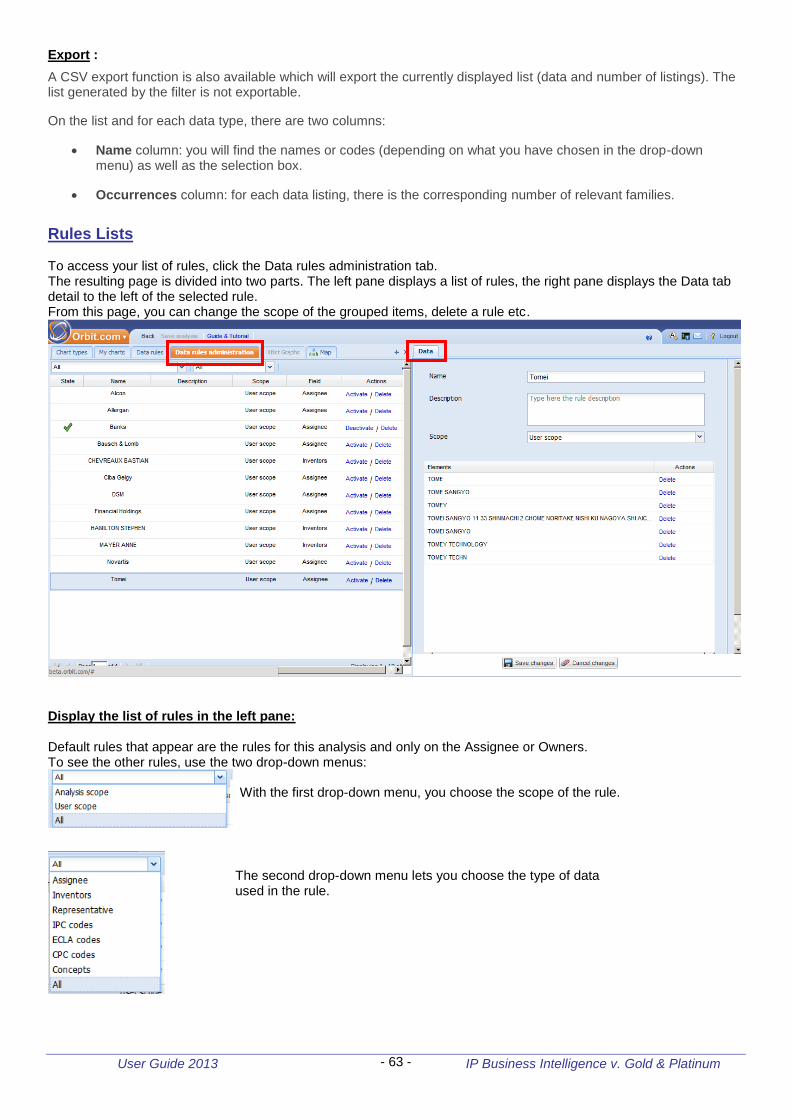
Rules Lists To access your list of rules, click the Data rules administration tab. The resulting page is divided into two parts. The left pane displays a list of rules, the right pane displays the Data tab detail to the left of the selected rule. From this page, you can change the scope of the grouped items, delete a rule etc.
Display the list of rules in the left pane: Default rules that appear are the rules for this analysis and only on the Assignee or Owners. To see the other rules, use the two drop-down menus:
With the first drop-down menu, you choose the scope of the rule.
The second drop-down menu lets you choose the type of data used in the rule.

User Guide 2013 IP Business Intelligence v. Gold & Platinum - 64 -
Four columns are present: • Name: Name of the rule and the selection box • Description: Description of the rule given at its creation • Scope: Scope set to rule • Actions: Delete Button You can disable the use of a rule without deleting it. Uncheck to disable the rule and click the Apply Changes button. If you want to reactivate the use of a rule, select the rule to activate and click again on the Apply Changes button.
From the left pane, you can also delete a rule. For a rule to this analysis only, click the Delete button and confirm. For a rule applicable to all analyzes, you must first disable its use in all of your saved analyses before deleting.
"Data" tab details: Details of the selected rule are displayed: Name: Displays the name of the rule can be changed. Description: Displays the description (optional) provided when creating the rule. You can add or supliment this description Scope: Displays the scope defined during the creation of the rule. It can be modified to reflect user scope or analysis only. Elements: Displays the names or codes contained in the rule. For dynamic groups, displayed is the name followed by the string used to Filter
Delete one or more items by clicking the button available in the "Actions" column or add an item by clicking on the icon at the bottom of the menu.
Click the Save Changes to save your changes.

User Guide 2013 IP Business Intelligence v. Gold & Platinum - 65 -
14 – Topographical map
Available in Platinum version only, the map is available: • By clicking on the image of a map in the chart types page • By clicking on the Map tab The data displays under the Map Tab/Icon:
Clicking on the available icon to the right of the bar will display the map in full screen.

User Guide 2013 IP Business Intelligence v. Gold & Platinum - 66 -
The map is a graphical representation of the analysis of a group of documents based on the concepts. The concepts are extracted from the full text of the patents and classified by linguistic technologies. They reflect the semantic content of the patent and are available for publications in the official English-language for EP applications (excluding Euro-PCT) since 1988, PCT applications since mid-2001 and U.S. patents since 1971. Once you have selected the map, IP Business Intelligence processes in four steps: 1 - Construction of a vector model 2 - Clustering 3 - Reduced size 4 - Drawing
Reading the map The map shows indentified clusters (groups) of families in different colors. These clusters are built by an algorithm that calculates the number of families for a concept and relationships of similarity and proximity; then include families and positions on the map. Clusters represent technical categories. In this example, we can identify clusters. Each cluster represents an area on the map employed by a number of dots of the same color. Each point corresponds to a family.
For each cluster, the map displayed the same color as the points and shows the names of the three concepts most statistically relevant.

User Guide 2013 IP Business Intelligence v. Gold & Platinum - 67 -
Each point is positioned to show distance. The distance between two points is longer proportionally to show the distance/difference between two semantic concepts and thus inversely proportional to the similarity. A family is represented only once on the map. Hovering your mouse over a point will display the Title of the document and the name of the applicant.
The color shades of base map (some peaks in gray, others brown, shades of blue for water) are interpreted in the same way as a topographic map. The higher the density of patents in this area is displayed as such. The contours of the map have no special meaning and two tests on the same batch of documents can display two maps whose contours are different.
Map manipulation As with other graphs, the Color function is available for the map (see Chapter 11 section "Coloring)" as well as the Save in "My Graphs" function (see Chapter 11 "Saving in 'My graphs'").
The toolbar available between the map and icons allows you to perform certain actions on the map.
The cursor defaults to 50% use the slide to reduce the size of the map to 0% and increase to 100%.
Left click on this button to move the map in the window. Right click to move a label (name of a cluster of three main concepts).

User Guide 2013 IP Business Intelligence v. Gold & Platinum - 68 -
These three icons are the selection tools.
Displays a sub-group within a cluster. Select the area you want, release the mouse and the three concepts of this subgroup appear.
Allows you to select an area on the map to view a list of families in this area under the Selection tab.
User Guide 2013 IP Business Intelligence v. Gold & Platinum - 69 -
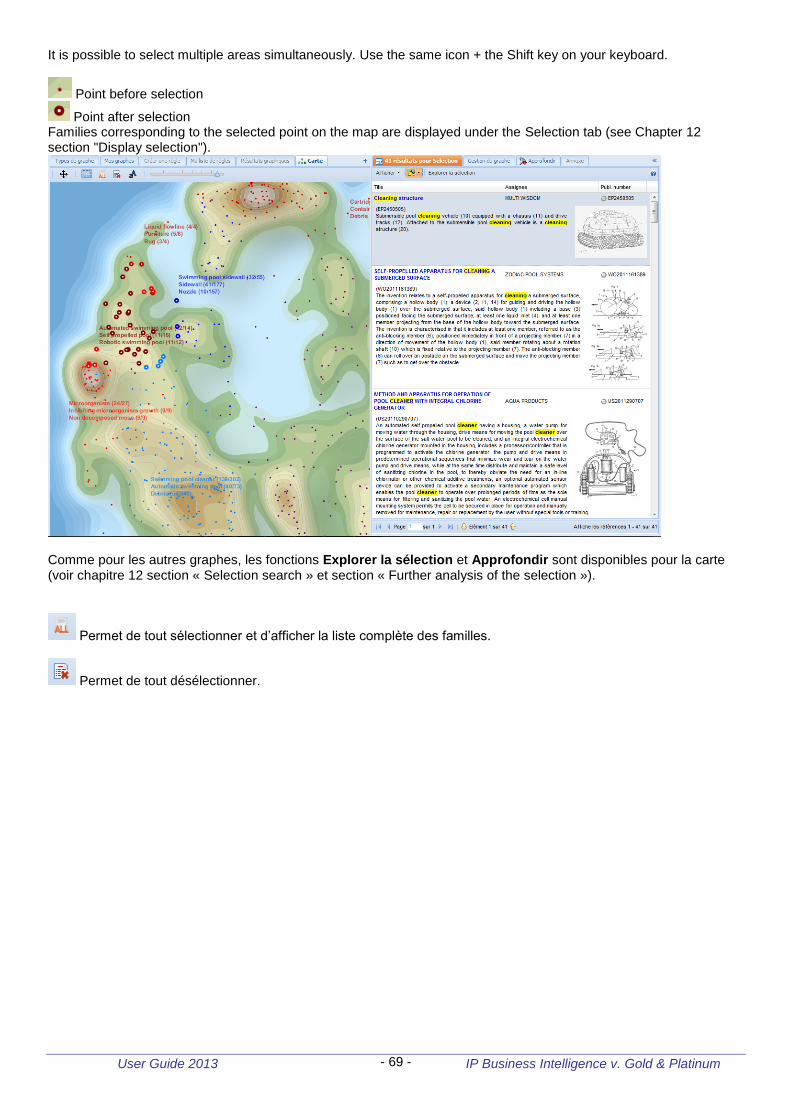
It is possible to select multiple areas simultaneously. Use the same icon + the Shift key on your keyboard.
Point before selection
Point after selection Families corresponding to the selected point on the map are displayed under the Selection tab (see Chapter 12 section "Display selection").
Comme pour les autres graphes, les fonctions Explorer la sélection et Approfondir sont disponibles pour la carte (voir chapitre 12 section « Selection search » et section « Further analysis of the selection »).
Permet de tout sélectionner et d’afficher la liste complète des familles.
Permet de tout désélectionner.

User Guide 2013 IP Business Intelligence v. Gold & Platinum - 70 -
PARIS (Headquarters) WASHINGTON, D.C. Questel SA Questel Inc. 47, rue de la Victoire 1725 Duke St – Suite 625 75009 Paris Alexandria, VA 22314 France USA