Embed Size (px)
Citation preview

The Vega Trap:
Dan PassarelliMarket Taker Mentoring LLC
MarketTaker.com
How Option Volatility Can Make or Break Your Directional Option Trades

In order to simplify the computations, commissions and other costs have not
been included in the examples used in this presentation. These costs will impact the outcome of stock and options transactions and should be considered. Investors considering options should consult their tax advisor as to how taxes may affect the outcome of contemplated options transactions.
Options involve risks and are not suitable for all investors. Prior to buying or selling an option, a person must receive a copy of Characteristics and Risks of Standardized Options (ODD). Copies of the ODD are available from your broker, by calling 1-888-OPTIONS, or from The Options Clearing Corp., One North Wacker
Drive, Suite 500, Chicago, Illinois 60606. The information in this presentation is provided solely for general education and information purposes and therefore should not be considered complete, precise or current. No statement should be construed as a recommendation to buy or sell a security or to provide investment advice.
Copyright ©
2009 Market Taker Mentoring LLC. All rights reserved.
Disclaimer

The Vega TrapBeing RightOption PricingVolatilityLearn to Speak GreekHow Vega Plays Into Directional Trades
Example 1Example 2
Q & A

Being Right

Right … But Wrong
• Forecast =
Buy call
• Stock =
• P&(L) =

Righty Tighty
• Being right is not enough• Play it tight!• Learn how options work!

Option Pricing

Direction
• Rising stock price:
• Falling stock price:
Call price Put price
Call price - Put price

Time
• Each day that passes:
Call price - Put price

Volatility
• “Volatility” rises:
• “Volatility” falls:
Call price Put price
Call price Put price

Volatility

Volatility
• “ I know it when I see it”• Historical data
– Closing prices– Stock charts
(Past) Volatility
Prices not current

Historical Volatility
• Mathematical measure of past volatility of a stock
• Backward looking• Annualized standard deviation• Stock volatility

Implied Volatility (IV)
• Forward looking• Expected future volatility embedded in an
option’s price

Implied Volatility and Option Prices
• Remember: When (implied) volatility rises, so do option prices
• IV is derived from the market
• IV is sometimes more important than directional movement
• Vega measures IV’s effect on option prices

Learn to Speak Greek

The Greeks
• Delta• Gamma• Theta• Vega

Delta
• Option’s price sensitivity to change in underlying price.
• i.e., directional sensitivity
Gamma
• Delta’s sensitivity to change in underlying price.
• Helps option “longs”; hurts option “shorts”
Theta
• Option’s sensitivity to change in time to expiration
• Hurts option “longs”; helps option “shorts”

Vega
• Option’s sensitivity to change in “volatility”• Commonly overlooked risk

Implied Volatility Example
Option IVGS May 110 call 78%
Prices not current

IV, Price and Vega
Option IV Option Px VegaGS May 110 call 78% 12.20 0.15
Prices not current

Rising Implied Volatility
Option IV Option Px VegaGS May 110 call 78% 12.20 0.15
GS May 110 call 79% 12.35 0.15
GS May 110 call 80% 12.50 0.15
Prices not current

Falling Implied Volatility
Option IV Option Px VegaGS May 110 call 78% 12.20 0.15
GS May 110 call 77% 12.05 0.15
GS May 110 call 76% 11.90 0.15
Prices not current

How Vega Plays Into Directional Trades

Monitoring Risk
• Three primary risks– Underlying price– Time– Implied volatility
• Monitor greeks

Example 1

Example 1 – Long SPY Call• Forecast: Trader Tom believes “the
market” will rebound strongly in the near future. Specifically, he believes SPY will rise sharply from its current value of $83.90 by June.
• Trade:Buy 10 SPY June 84 calls at 6
Prices not current. Example is for illustrative purposes only.

Example 1 – Trade Risks
1. (Directional) forecast is wrong2. Implied volatility falls

Example 1 – Greeks
Long 10 SPY June 84 calls
Delta Theta Vega IV0.53 0.04 0.16 40
SPY at $83.90, 79 days till June expiration. Values are rounded.

Example 1 – Scenario 1
• 10 SPY June 84 calls worth 7.90• Profit
7.90 – 6 = 1.901.90 X 10 contracts X $100 = $1,900
(Value generated using option calculator)
SPY Rises to $89 in One Month, IV Unchanged

Example 1 – Scenario 2
• 10 SPY June 84 calls worth 6.20• Profit
6.20 – 6 = .200.20 X 10 contracts X $100 = $200
(Value generated using option calculator)
SPY Rises to $89 in One Month, IV Falls 15 Points

Example 1 – Observations
• After volatility change in Scenario 2 nearly all profit was erased
• Must account for volatility changes when trading options!
Example 2
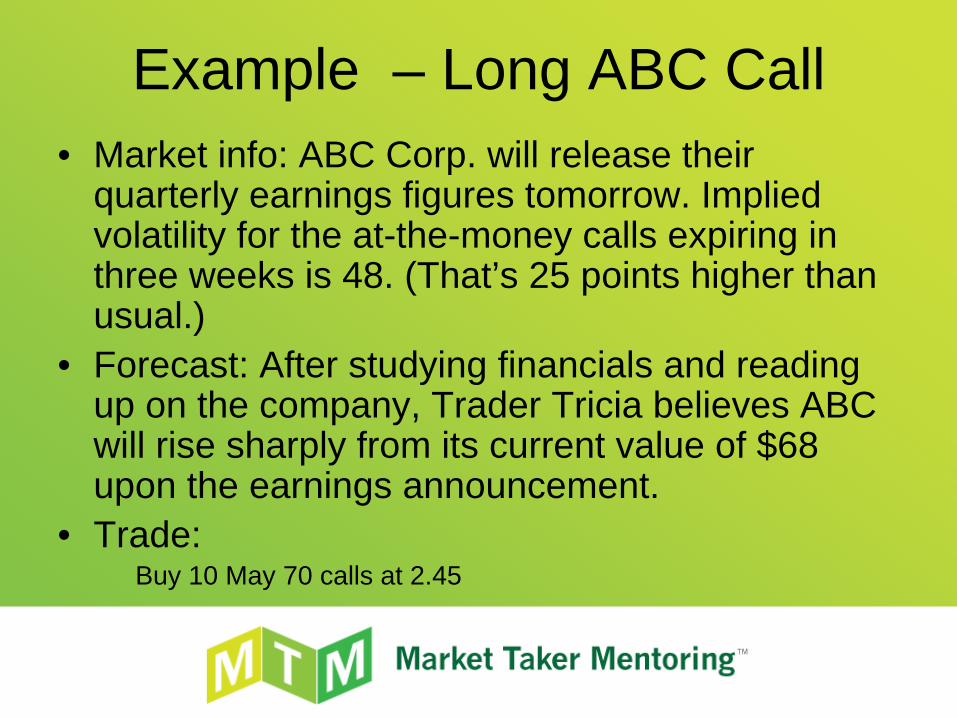
Example – Long ABC Call• Market info: ABC Corp. will release their
quarterly earnings figures tomorrow. Implied volatility for the at-the-money calls expiring in three weeks is 48. (That’s 25 points higher than usual.)
• Forecast: After studying financials and reading up on the company, Trader Tricia believes ABC will rise sharply from its current value of $68 upon the earnings announcement.
• Trade:Buy 10 May 70 calls at 2.45
Example 2 – Trade Risks
1. (Directional) forecast is wrong2. Implied volatility falls after earnings

Example 2 – Greeks
Long 10 May 70 calls
Delta Theta Vega IV
ABC at $68, 3 weeks till May expiration. Values are rounded.
0.43 0.07 0.07 48

Example 2 – Scenario 1
• 10 ABC May 70 calls worth 3.90• Profit
3.90 – 2.45 = 1.451.45 X 10 contracts X $100 = $1,450
(Value generated using option calculator)
ABC Rises to $71 Post Earnings, IV Unchanged

Example 2 – Scenario 2
• 10 ABC May 70 calls worth 2.15• Loss
2.15 – 2.45 = (.30)(0.30) X 10 contracts X $100 = ($300)
(Value generated using option calculator)
ABC Rises to $71 in Post Earnings, IV Falls 25 Points
Example 2 – Observations
• Volatility was “crushed” following earnings• After volatility change in Scenario 2 loss
incurred• Must account for volatility changes when
trading around expiration!
Red Flags
• Periods of “abnormal” volatility• Earnings• Implied and historical volatility are
significantly different• Anticipated potential directional move is
less significant than anticipated potential volatility move

Market Taker Mentoring LLCMarket Taker Mentoring Program:
– Initial assessment/consultation– Eight one-hour, one-on-one mentoring sessions – Weekly customized homework– Copy of Trading Option Greeks– Access to proprietary MTM educational
material– Lifetime alumni status– … and more!

This has been a presentation of … Market Taker Mentoring LLC MarketTaker.com
(815) 922-3329