Embed Size (px)
Citation preview
We thank the referee for the helpful advice. This research has benefited from numerous conversations withSöhnke Bartram, and the assistance of Aris Bikos with data collection is gratefully acknowledged. We areindebted to the seminar participants at the European Finance Association 2004 Annual Meeting, theConference on the Theories and Practices of Securities and Financial Markets 2004, and the NTUInternational Conference on Finance 2004 for the helpful comments and suggestions.
*Correspondence author, Department of Finance, National Taiwan University, No. 1, Sec. 4, Roosevelt Road,Taipei 10617, Taiwan. Tel: �886-2-33661092, Fax: �886-2-83695581, e-mail: [email protected]
Received June 2008; Accepted May 2009
■ Stephen J. Taylor is a Professor of Finance at the Department of Accounting and Finance,Lancaster University, Lancaster, UK.
■ Yaw-Huei Wang is an Associate Professor of Finance at the Department of Finance, NationalTaiwan University, Taipei, Taiwan.
The Journal of Futures Markets, Vol. 30, No. 4, 324–360 (2010)© 2009 Wiley Periodicals, Inc.Published online in Wiley InterScience (www.interscience.wiley.com).DOI: 10.1002/fut.20420
OPTION PRICES AND RISK-NEUTRAL DENSITIES FOR
CURRENCY CROSS RATES
STEPHEN J. TAYLORYAW-HUEI WANG*
The theoretical relationship between the risk-neutral density (RND) of the euro/pound cross rate and the bivariate RND of the dollar/euro and the dollar/poundrates is derived; the required bivariate RND is defined by the dollar-rate marginalRNDs and a copula function. The cross-rate RND can be used by banks, interna-tional businesses, and central bankers to assess market expectations, to measurerisks, and to value options, without relying on over-the-counter markets, whichmay be either non-existent or illiquid. Empirical comparisons are made betweencross-rate RNDs estimated from several data sets. Five one-parameter copulafunctions are evaluated and it is found that the Gaussian copula is the only one-parameter copula function that is ranked highly in all of the comparisons we havemade. © 2009 Wiley Periodicals, Inc. Jrl Fut Mark 30:324–360, 2010
Option Prices and Risk-Neutral Densities 325
Journal of Futures Markets DOI: 10.1002/fut
INTRODUCTION
Option markets provide important information about market expectationsfor foreign exchange rates. The future volatility of rates can be predicted byinverting a pricing formula and these predictions are known to be generallysuperior to forecasts obtained by estimating time series models from historicalrates (Jorion, 1995; Pong, Shackleton, Taylor, & Xu, 2004). Risk managers andpolicy makers use implied volatilities but they are also interested in the addi-tional information provided by probability densities for future rates. In particu-lar, the most prominent users of option-based density expectations are centralbanks (Bliss & Panigirtzoglou, 2002; Söderlind & Svensson, 1997).
Many numerical methods can be used to convert a set of option prices intoa univariate risk-neutral density (RND) and these are routinely applied to dol-lar exchange rates (Campa, Chang, & Reider, 1998; Jondeau & Rockinger,2000; Malz, 1996, 1997). A manager, a trader, or a central banker concernedabout the euro/pound cross rate may find, however, that these univariate meth-ods are infeasible. The estimation and analysis of RNDs for exchange crossrates is a difficult problem because cross-rate options have low liquidity and aretraded over-the-counter (OTC), at prices that are not usually available toresearchers. The contrast between the abundance of dollar option prices andthe paucity of non-dollar option prices suggests that the most constructive wayto learn about market expectations for cross rates may involve exploiting thetriangular relationship between cross rates and a pair of dollar rates (Bennett &Kennedy, 2004).
The primary contribution of this study is a complete methodology for esti-mating cross-rate RNDs from which cross-rate options can be priced. Ourmethods are illustrated for options on the euro/pound rate and they rely onprices from the highly liquid option markets for the dollar/pound and the dol-lar/euro rates. We are the first to use the triangular relationship between threecurrencies to infer the correct cross-rate RND from the bivariate density of the two dollar exchange rates. This bivariate density is given by the product of three terms: the two marginal densities for the dollar rates and a copulafunction that quantifies their dependence.
The second contribution of this study is advice about selecting the copulafunction, which is based upon comparing our derived cross-rate RNDs withthose implied by OTC RNDs. The cross-rate RNDs that we derive can be usedby banks, international businesses, and central bankers to assess market expec-tations, to measure risks, and to value options, without relying on OTC mar-kets, which may be either non-existent or illiquid.
Bikos (2000), Rosenberg (2003), and Bennett and Kennedy (2004) alsoinvestigate cross-rate densities, their option prices, and the implied dependence
326 Taylor and Wang
Journal of Futures Markets DOI: 10.1002/fut
between dollar exchange rates. Bikos (2000) uses option prices for all threeexchange rates to estimate the dependence between dollar rates. Rosenberg(2003) shows how the bivariate density can be estimated non-parametrically,using a copula function that is estimated from historical exchange rates. As weexplain in the following section, his cross-rate density is not risk-neutral becausea required change of numeraire from dollars (for the bivariate density) to a for-eign currency (for the cross-rate density) is overlooked. Bennett and Kennedy(2004) provide some related theoretical results for quanto options, which havedollar payoffs that are contingent upon cross rates.
Our empirical results are all for the dollar, pound, and euro currencies. We compare the option prices for cross rates quoted by a bank with those that wederive from dollar option prices. Our derived prices depend on a source, a cop-ula function, and its dependence parameter. We compare the results for dollaroption prices obtained from two sources: the OTC market and the ChicagoMercantile Exchange (CME). We compare results for five widely used copulafunctions, namely the Clayton, Frank, Gaussian, Gumbel, and Plackett copu-las. For each copula function, we fix the dependence parameter by using eitherthe at-the-money (ATM), OTC cross-rate price or the recent historical recordof exchange rates. We find first that the publicly available CME source givesessentially the same results as the OTC source, second that the Frank,Gaussian, and Gumbel copulas provide the most satisfactory option prices, andthird that historical correlations are on average lower than those implied bycross-rate, OTC option prices.
This article continues with three theoretical sections, followed by threeempirical sections. The following section derives the relationship between theRND for the cross rate and the bivariate RND for two dollar exchange rates,using risk-neutral measures determined by the numeraires of payoffs. An intro-duction to copula functions is then provided; these are used to characterize therelationship between the bivariate RND and the marginal RNDs for the dollarrates. The third theoretical section summarizes three standard methods forestimating marginal RNDs. The empirical framework, the data, and the empir-ical results are then presented. Finally, conclusions are stated.
THE RISK-NEUTRAL DENSITY FORMULA FORCROSS RATES
Our first objective is to produce formulae for the cross-rate RND and the pricesof cross-rate options by using the prices of dollar-denominated assets. Optionpayoffs depend on the rates of exchange between dollars ($, USD), pounds (£, GBP), and euros (€, EUR) in our three-currency framework. We denote thedollar price of one pound at time t by St
$�£ and likewise the dollar price of one
Option Prices and Risk-Neutral Densities 327
Journal of Futures Markets DOI: 10.1002/fut
euro at the same time is denoted by St$�€. The cross-rate price of one pound in
euros is then given by St€�£ � St
$�£�St$�€.
At time zero we assume that there is a complete market for $/£ Europeancall options, priced in dollars, which expire at time T. This implies the exis-tence of a unique RND for St
$�£ that we denote by f$(y); the dollar subscriptemphasizes that the numeraire of asset payoffs is dollars. Likewise, there is anRND for St
$�€ that we denote by f$(z). We also assume that it is possible todefine a bivariate RND for (St
$�£, ST$�€), denoted by f$(y, z), which can be used
to price dollar payoffs that are contingent on these two exchange rates; wedefer discussion of the construction of f$(y, z) until the following section.
Now consider an European option to buy £ 1 for €X at time T. This isidentical to an option to exchange XST
$�£ dollars for ST$�£ dollars at time T. Hence
its dollar payoff equals max(ST$�£ � XST
$�€, 0) and its fair price in dollars at timezero is
(1)
Here Q$ is the risk-neutral measure for the $ numeraire and r$ is the dol-lar risk-free rate. The fair price of the same option in euros is therefore
(2)
This must equal the following discounted expected payoff, which employsthe risk-neutral measure Q
€for the euro numeraire:
(3)
Here r€
is the euro risk-free rate and f€(x) is the RND for one pound
priced in euros.A specific formula for the cross-rate RND defined by Equation (3) is given
by using the well-known result of Breeden and Litzenberger (1978):
in conjunction with Equation (2) to obtain
f€(x) � er
€T
02C€(x)
0x2
� e�r€T�
�
X
(x � X)f€(x) ˛ dx.
C€(X) � e�r
€TEQ
€[max(S€�£T �X, 0)]
� (e�r$T�S$�€
0 ) ��
0�
�
0
max(y � Xz, 0) f$(y, z) ˛ dy ˛dz.
C€(X) � C$(X)�S$�€
0
� e�r$T��
0�
�
0
max (y � Xz, 0) f$(y, z) ˛ dy ˛dz.
C$(X) � e�r$TEQ$[max(S$�£T � XS$�€
T , 0)]
328 Taylor and Wang
Journal of Futures Markets DOI: 10.1002/fut
(4)
where F0$�€ � S0
$�€e(r$�r€)T is the forward price, at time zero, to exchange one
euro for dollars at time T. Equation (4) simplifies, as shown in Appendix A, togive the RND of the cross rate as the following single integral:
(5)
Cross-rate option prices can be calculated either from the two single inte-grals defined by Equations (3) and (5), or from the double integral in Equation(2), which is the same as
(6)
It is easy to check the three necessary conditions for the function in (5) tobe an RND. First, the function is obviously non-negative. Second, the substitu-tion y � xz (with dy � zdx) can be used to show that the function integrates toone and is therefore a density:
(7)
Third, the same substitution establishes that the expectation of the spot crossrate at time T is the forward cross rate, and hence the density is risk-neutral:
(8)
We provide the above checks because our RND for the cross rate is not thesame as the density derived in Rosenberg (2003). His density, in our notation, is
(9)f(x) � ��
0
zf$(xz, z) ˛ dz.
� EQ$[S$�£T ]�F$�€
0 � F$�£0 �F$�€
0 � F€�£0 .
�1
F$�€
0�
�
0�
�
0
yf$(y, z) ˛dy˛ dz
��
0
xf€(x) ˛dx �
1
F$�€
0�
�
0�
�
0
xz2 f$(xz, z) ˛ dx ˛dz
�1
F$�€
0�
�
0�
�
0
z f$(y, z) ˛ dy˛dz � EQ$[S$�€
T ]�F$�€
0 � 1.
��
0
f€(x) ˛dx �
1
F$�€
0�
�
0
z2 c ��
0
f$(xz, z) ˛ dx d ˛ dz
C€(X) � e�r
€T
1
F$�€
0�
�
X
(x � X) c ��
0
z2f$(xz, z) ˛dz d ˛dx.
f€(x) �
1
F$�€
0
��
0
z2f$(xz, z) ˛ dz.
f€(x) �
1
F$�€
0
02
0x2 c ��
0�
�
0
max(y � xz, 0)f$(y, z) ˛dy˛dz d .

Option Prices and Risk-Neutral Densities 329
Journal of Futures Markets DOI: 10.1002/fut
This is the density of the cross rate with respect to the risk-neutral measurefor the dollar numeraire, i.e. Q$. Thus, (9) is only appropriate for the valuationof claims that have dollar payoffs (e.g. the quanto options valued by Bennett &Kennedy, 2004). Consequently, the Rosenberg density is not in general a cross-rate RND and hence it should not be used to price cross-rate options. Indeed, arandom variable whose density is given by (9) has expectation
(10)
whenever CovQ$(ST$�€, ST
$�£�ST$�€) � 0.
THE CONSTRUCTION OF BIVARIATE RNDS
To price cross-rate options, using the cross-rate RND given by (5), we first need toobtain the bivariate RND of the two dollar-denominated exchange rates, denot-ed by f$(y, z). We use copula functions in this article to convert the two mar-ginal densities, f$(y) and f$(z), into the bivariate density f$(y, z).
Copula methods are covered in the textbooks by Joe (1997), Nelsen(1999), and Cherubini, Luciano, and Vecchiato (2004). There are many recentapplications in finance research to subjects such as credit risk (Li, 2000), port-folio allocations (Hennessy & Lapan, 2002), the pricing of multivariate contin-gent claims (Rosenberg, 2003), and the dependence between European markets(Bartram, Taylor, & Wang, 2007).
Definitions
Copula functions, denoted C(u, v), are the bivariate cumulative distributionfunctions (c.d.f.) of random variables U and V whose marginal distributions areuniform from zero to one. Employing a copula function permits modeling ofdependence by using marginal densities to construct bivariate densities that areconsistent with the univariate marginals.
Let H be the bivariate c.d.f. for random variables Y and Z, with respectivemarginal cumulative functions F and G that are both continuous. By Sklar’sTheorem, there exists a unique copula function C such that
H(y, z) � C(F(y), G(z)) for all y and z.
� EQ$ c S$�£T
S$�€
T
d �EQ$[S$�£
T ]
EQ$[S$�€
T ]�
F$�£0
F$�€
0
� F€�£0
��xz f$(xz, z) ˛ dz ˛dx � �� yz f$(y, z) ˛dy ˛dz
330 Taylor and Wang
Journal of Futures Markets DOI: 10.1002/fut
The bivariate density for (Y, Z) is given by
(11)
where is the density corresponding to the c.d.f.C(u, v) and f and g are the marginal densities of Y and Z.
The correlation between the uniform random variables U � F(Y) and V �G(Z) is a useful parameter for measuring the dependence between Y and Z. Thiscorrelation defines Spearman’s “r” for the variables Y and Z, denoted by rS:
Spearman’s r is obviously invariant to increasing transformations of Y andZ. In particular, .
Specific Copula Functions
Although several parametric copula functions have been applied in statisticalliterature, only a few of them have flexible dependence properties and arehence appropriate for financial applications (Joe, 1997). We focus on five cop-ula functions, which include all of the parametric copulas suggested byCherubini et al. (2004) and which permit a wide range of possible dependencestructures between two prices of financial assets. To the best of our knowledge,firstly we consider almost all the single-parameter copulas investigated in priorfinancial applications and secondly each prior application considers at mostthree of our five functions.
Each of the copula functions has a single1 parameter, which determines themagnitude of the dependence. We make empirical comparisons between the Clayton, Frank, Gaussian, Gumbel, and Plackett copulas. All of these cop-ulas can display either positive or negative dependence. The contours of thebivariate densities for Y and Z are shown on the left of Figure 1, whenSpearman’s r equals 0.5 and the marginal distributions are standard normal;then with and representing thedensity and the c.d.f. of the standard normal distribution. The correspondingcopula densities are shown on the right of Figure 1; the plotted variable is
, which characterizes the dependence between Y and Z.The dependence structure is symmetric2 and tail-independent3 for the
Frank, Gaussian, and Plackett copulas. Although the Gumbel copula has asym-metry and upper-tail dependence, the Clayton copula has asymmetry and
c(£(y), £(z))
£(� )f(� )h(y, z) � c(£(y), £(z))f(y)f(z)
rS(Y, Z) � rS(U, V)
rS(Y, Z) � cor(U, V) � (E[UV] � 14)� 1
12.
c(u, v) � 02C(u, v)�(0u0v)
h(y, z) � c(F(y), G(z) ) � f(y) � g(z)
1One parameter is sufficient to model dependence. Multi-parameter copulas, such as the Student copula, arenot investigated in this study because we rely on a single cross-rate option price when option information isused to infer the magnitude of the dependence between two exchange rates.2A copula C is symmetric if (U, V) and (1�U, 1�V) have the same c.d.f.3A copula is tail-independent if P(U � a|V � a) and P(U b|V b) both converge to zero as a S 1 and b S 0.
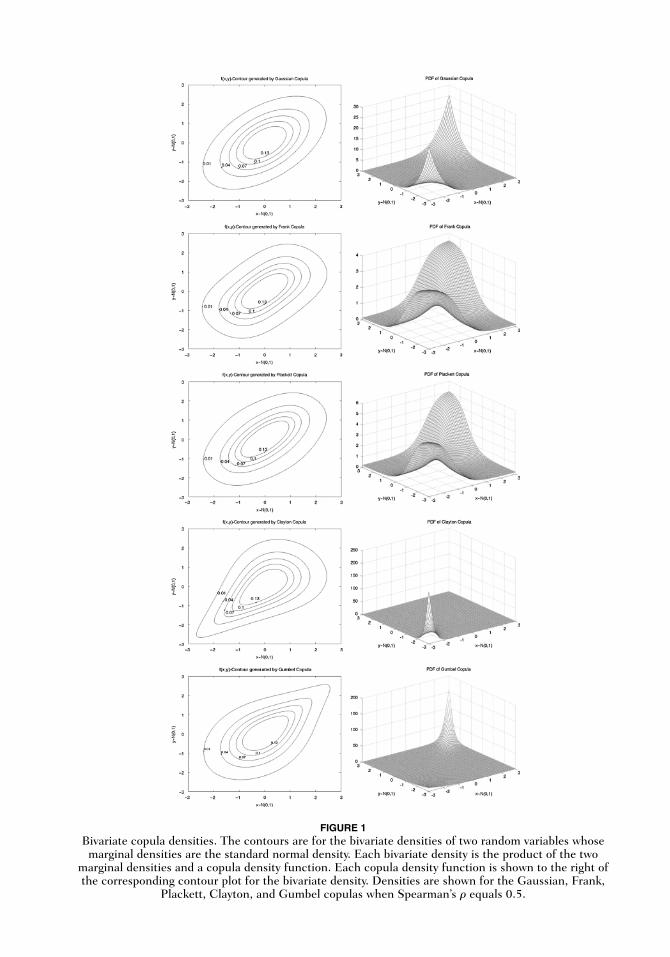
FIGURE 1Bivariate copula densities. The contours are for the bivariate densities of two random variables whosemarginal densities are the standard normal density. Each bivariate density is the product of the two
marginal densities and a copula density function. Each copula density function is shown to the right ofthe corresponding contour plot for the bivariate density. Densities are shown for the Gaussian, Frank,
Plackett, Clayton, and Gumbel copulas when Spearman’s r equals 0.5.
332 Taylor and Wang
Journal of Futures Markets DOI: 10.1002/fut
lower-tail dependence that has been used to model the dependence of equityprices (e.g. Cherubini and Luciano, 2002). Equations for all the copula func-tions are given in Appendix B.
Estimation of the Dependence Parameter
If the market price of one cross-rate option is available, typically the ATMoption, then we can use numerical methods to obtain the implied estimate ofthe dependence parameter by equating the market price with the theoreticalprice given by (6). Otherwise, we can use a historical record of intraday dollar-denominated currency returns for two exchange rates to calculate their realizedcorrelation, using the method of Andersen, Bollerslev, Diebold, and Labys(2001). By assuming that the historical correlation equals the risk-neutral cor-relation in the future, we can estimate Spearman’s r for the risk-neutralGaussian copula (see Appendix B). The dependence parameters for the otherfour copulas can then be obtained by constraining these copulas to have thesame value for Spearman’s r. We discuss the empirical relationship betweenthe historical and risk-neutral correlations in the penultimate section.
When using intraday returns to estimate realized volatility or correlations,the choice of frequency is a tradeoff between selecting a high frequency andavoiding market microstructure effects. For our data, we find that the first-lagautocorrelations of the five-minute returns are significantly negative, whichprobably reflects microstructure effects. Consequently, we use 30-minutereturns instead to calculate realized correlations as their first-lag autocorrela-tions are much lower. Following Andersen et al., the realized correlation coeffi-cient between two sets of 30-minute returns, and , whose latestreturn is at the end of day t, is given by the following formulae:
(12)
where n is the number of 30-minute intervals in one day and m is the numberof days used for estimation.
METHODOLOGY FOR THE MARGINAL RNDS
Marginal RNDs for the dollar prices of one pound and one euro are requiredwhen we construct their bivariate density using (11) and an appropriate copuladensity. Many specifications of univariate RNDs have been proposed, includinglognormal mixtures (Liu, Shackleton, Taylor, & Xu, 2007; Melick & Thomas,1997; Ritchey, 1990), generalized beta densities (Anagnou-Basioudis, Bedendo,
rt �Covt
s1,ts2,t, Covt � a
nm
j�1r1, j r2, j and s2
i,t � anm
j�1r2
i, j
5r2, j65r1, j6
Option Prices and Risk-Neutral Densities 333
Journal of Futures Markets DOI: 10.1002/fut
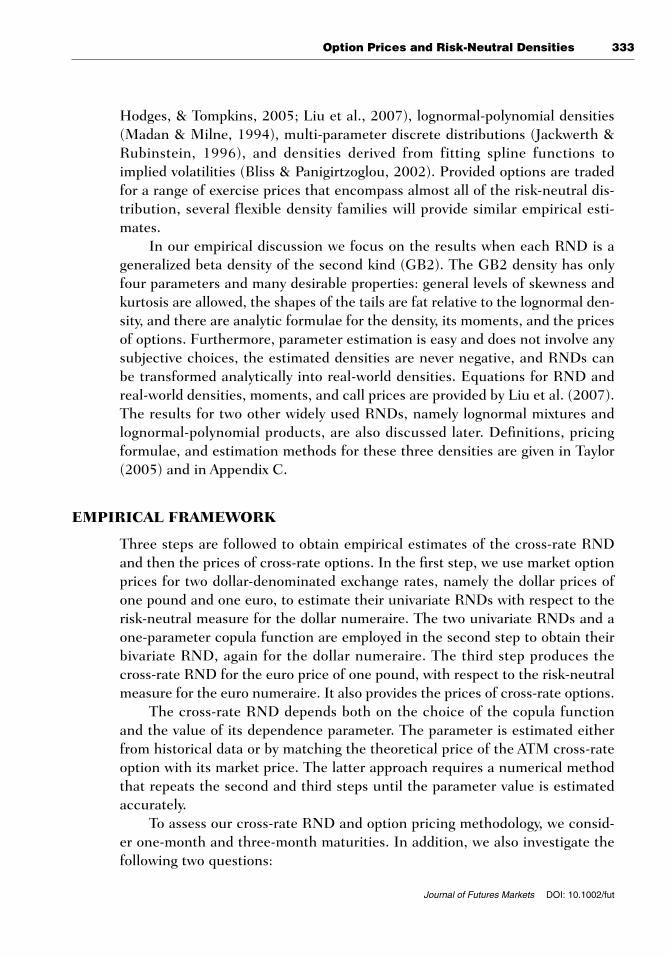
Hodges, & Tompkins, 2005; Liu et al., 2007), lognormal-polynomial densities(Madan & Milne, 1994), multi-parameter discrete distributions (Jackwerth &Rubinstein, 1996), and densities derived from fitting spline functions toimplied volatilities (Bliss & Panigirtzoglou, 2002). Provided options are tradedfor a range of exercise prices that encompass almost all of the risk-neutral dis-tribution, several flexible density families will provide similar empirical esti-mates.
In our empirical discussion we focus on the results when each RND is ageneralized beta density of the second kind (GB2). The GB2 density has onlyfour parameters and many desirable properties: general levels of skewness andkurtosis are allowed, the shapes of the tails are fat relative to the lognormal den-sity, and there are analytic formulae for the density, its moments, and the pricesof options. Furthermore, parameter estimation is easy and does not involve anysubjective choices, the estimated densities are never negative, and RNDs canbe transformed analytically into real-world densities. Equations for RND andreal-world densities, moments, and call prices are provided by Liu et al. (2007).The results for two other widely used RNDs, namely lognormal mixtures andlognormal-polynomial products, are also discussed later. Definitions, pricingformulae, and estimation methods for these three densities are given in Taylor(2005) and in Appendix C.
EMPIRICAL FRAMEWORK
Three steps are followed to obtain empirical estimates of the cross-rate RNDand then the prices of cross-rate options. In the first step, we use market optionprices for two dollar-denominated exchange rates, namely the dollar prices ofone pound and one euro, to estimate their univariate RNDs with respect to therisk-neutral measure for the dollar numeraire. The two univariate RNDs and aone-parameter copula function are employed in the second step to obtain theirbivariate RND, again for the dollar numeraire. The third step produces thecross-rate RND for the euro price of one pound, with respect to the risk-neutralmeasure for the euro numeraire. It also provides the prices of cross-rate options.
The cross-rate RND depends both on the choice of the copula functionand the value of its dependence parameter. The parameter is estimated eitherfrom historical data or by matching the theoretical price of the ATM cross-rateoption with its market price. The latter approach requires a numerical methodthat repeats the second and third steps until the parameter value is estimatedaccurately.
To assess our cross-rate RND and option pricing methodology, we consid-er one-month and three-month maturities. In addition, we also investigate thefollowing two questions:
334 Taylor and Wang
Journal of Futures Markets DOI: 10.1002/fut
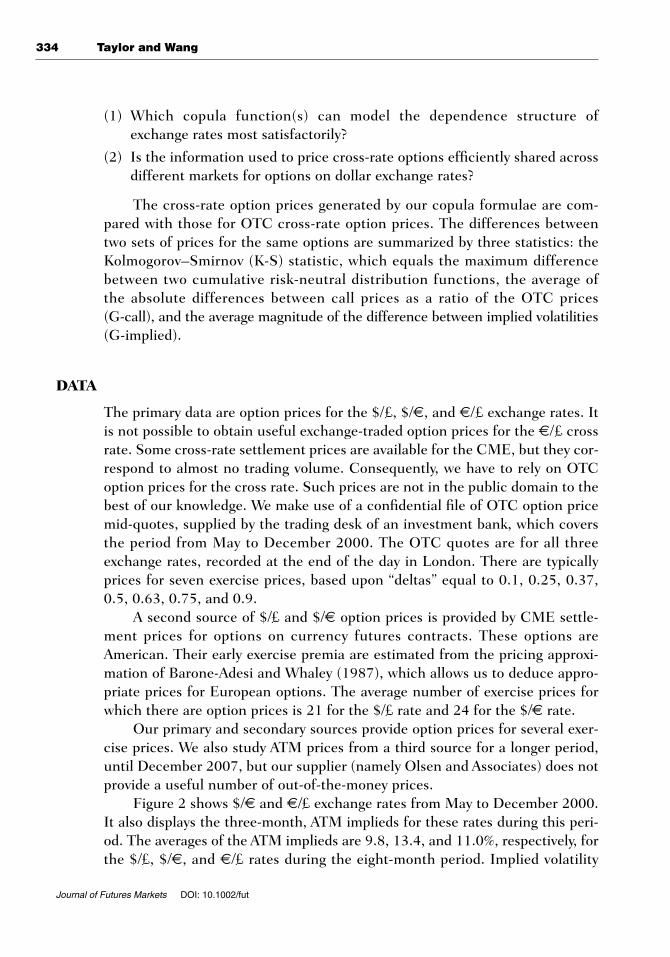
(1) Which copula function(s) can model the dependence structure ofexchange rates most satisfactorily?
(2) Is the information used to price cross-rate options efficiently shared acrossdifferent markets for options on dollar exchange rates?
The cross-rate option prices generated by our copula formulae are com-pared with those for OTC cross-rate option prices. The differences betweentwo sets of prices for the same options are summarized by three statistics: theKolmogorov–Smirnov (K-S) statistic, which equals the maximum differencebetween two cumulative risk-neutral distribution functions, the average of the absolute differences between call prices as a ratio of the OTC prices(G-call), and the average magnitude of the difference between implied volatilities(G-implied).
DATA
The primary data are option prices for the $/£, $/€, and €/£ exchange rates. Itis not possible to obtain useful exchange-traded option prices for the €/£ crossrate. Some cross-rate settlement prices are available for the CME, but they cor-respond to almost no trading volume. Consequently, we have to rely on OTCoption prices for the cross rate. Such prices are not in the public domain to thebest of our knowledge. We make use of a confidential file of OTC option pricemid-quotes, supplied by the trading desk of an investment bank, which coversthe period from May to December 2000. The OTC quotes are for all threeexchange rates, recorded at the end of the day in London. There are typicallyprices for seven exercise prices, based upon “deltas” equal to 0.1, 0.25, 0.37,0.5, 0.63, 0.75, and 0.9.
A second source of $/£ and $/€ option prices is provided by CME settle-ment prices for options on currency futures contracts. These options areAmerican. Their early exercise premia are estimated from the pricing approxi-mation of Barone-Adesi and Whaley (1987), which allows us to deduce appro-priate prices for European options. The average number of exercise prices forwhich there are option prices is 21 for the $/£ rate and 24 for the $/€ rate.
Our primary and secondary sources provide option prices for several exer-cise prices. We also study ATM prices from a third source for a longer period,until December 2007, but our supplier (namely Olsen and Associates) does notprovide a useful number of out-of-the-money prices.
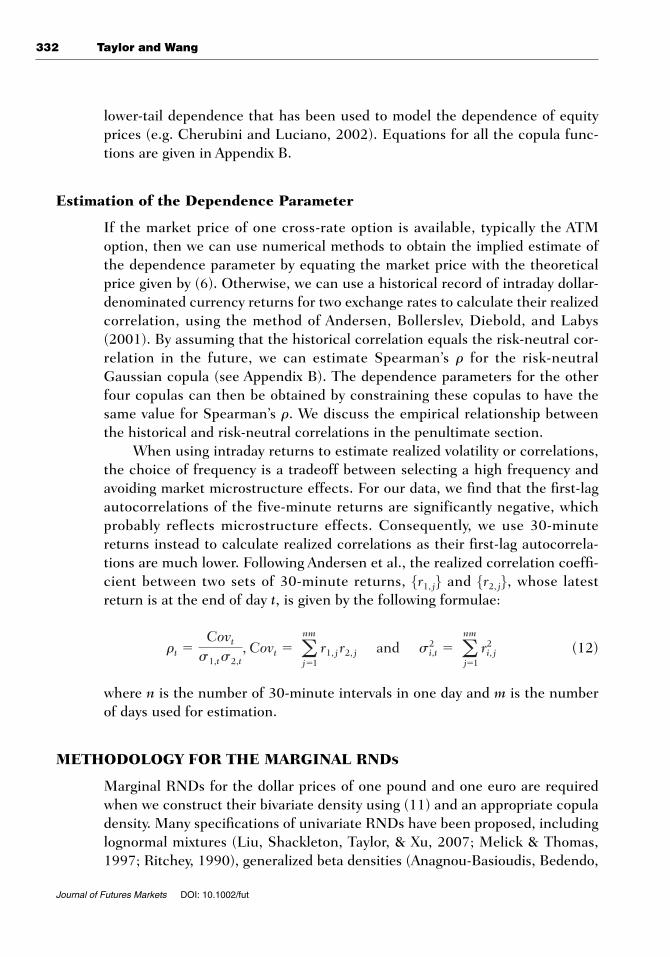
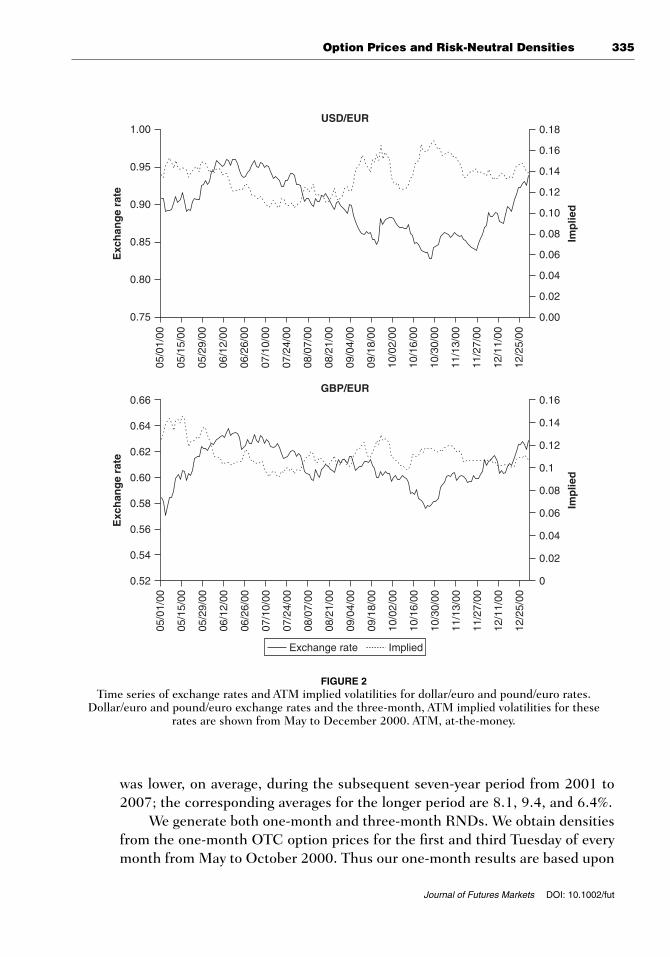
Figure 2 shows $/€ and €/£ exchange rates from May to December 2000.It also displays the three-month, ATM implieds for these rates during this peri-od. The averages of the ATM implieds are 9.8, 13.4, and 11.0%, respectively, forthe $/£, $/€, and €/£ rates during the eight-month period. Implied volatility
Option Prices and Risk-Neutral Densities 335
Journal of Futures Markets DOI: 10.1002/fut
was lower, on average, during the subsequent seven-year period from 2001 to2007; the corresponding averages for the longer period are 8.1, 9.4, and 6.4%.
We generate both one-month and three-month RNDs. We obtain densitiesfrom the one-month OTC option prices for the first and third Tuesday of everymonth from May to October 2000. Thus our one-month results are based upon
USD/EUR
0.75
0.80
0.85
0.90
0.95
1.00
05/0
1/00
05/1
5/00
05/2
9/00
06/1
2/00
06/2
6/00
07/1
0/00
07/2
4/00
08/0
7/00
08/2
1/00
09/0
4/00
09/1
8/00
10/0
2/00
10/1
6/00
10/3
0/00
11/1
3/00
11/2
7/00
12/1
1/00
12/2
5/00
05/0
1/00
05/1
5/00
05/2
9/00
06/1
2/00
06/2
6/00
07/1
0/00
07/2
4/00
08/0
7/00
08/2
1/00
09/0
4/00
09/1
8/00
10/0
2/00
10/1
6/00
10/3
0/00
11/1
3/00
11/2
7/00
12/1
1/00
12/2
5/00
Exc
han
ge
rate
0.00
0.02
0.04
0.06
0.08
0.10
0.12
0.14
0.16
0.18
Imp
lied
GBP/EUR
0.52
0.54
0.56
0.58
0.60
0.62
0.64
0.66
Exc
han
ge
rate
0
0.02
0.04
0.06
0.08
0.1
0.12
0.14
0.16
Imp
lied
Exchange rate Implied
FIGURE 2Time series of exchange rates and ATM implied volatilities for dollar/euro and pound/euro rates.
Dollar/euro and pound/euro exchange rates and the three-month, ATM implied volatilities for these rates are shown from May to December 2000. ATM, at-the-money.

336 Taylor and Wang
Journal of Futures Markets DOI: 10.1002/fut
12 cases. Because options traded at the CME have fixed expiry dates, on theFridays preceding the third Wednesdays of the contract months, it is impossibleto match them with OTC options whose expiry dates are two business daysbefore the forward dates. Therefore, we define matching CME option pricesfrom the prices of the two nearest-to-expiry contracts that are more than oneweek from expiry. These matching prices are obtained by assuming that theimplied volatilities have a linear term structure. 4 There is less usable OTC datafor the generation of the three-month densities. We use the three-monthoption prices on 12 June, 12 September, and 13 December 2000, from boththe OTC source and the CME.
The OTC data and our processing of the CME data provide us withimplied volatilities. The required one- and three-month forward rates, whenthe CME closes a few hours after the OTC quotes are recorded, are providedby the standard no-arbitrage equation that relates forward rates to spot pricesand domestic and foreign interest rates. These forward rates are the expecta-tions of the RNDs.
We also use the prices of $/£ and $/€ recorded every 30 minutes in theOTC markets to calculate one-month and three-month realized correlationcoefficients for their returns from (12). Daily spot exchange rates and risk-freeeuro currency interest rates are obtained from Datastream.
EMPIRICAL RESULTS
Our empirical implementation uses two types of information to estimate thedependence parameter of the copula function. First we use the prices of ATMcross-rate options, then we assess the alternative strategy of relying on histori-cal data to provide correlation estimates. Initially, we assume that all the mar-ginal RNDs have GB2 distributions and subsequently we compare the GB2results with those for other marginal RNDs. We also discuss a practical methodfor selecting the copula function. Finally, we consider possible explanations fora correlation risk premium revealed by our calculations.
When the Prices of ATM Cross-Rate Options Are Used
The properties of €/£ cross-rate RNDs derived from OTC cross-rate optionprices are shown in the first column of Table I and also in the first column of
4The term structure of the implied volatility of FX options is not flat and its slope changes frequently (Xu &Taylor, 1994). For a selected exercise price, we approximate the CME implied volatility for an option thatexpires at time T by where v1 and v2 are the implied volatilities of thetwo near-to-expiry contracts, which have times T1 and T2 until expiry.
v � v1 � (v2 � v1)(T � T1)�(T2 � T1)

Option Prices and Risk-Neutral Densities 337
Journal of Futures Markets DOI: 10.1002/fut
Table II. We refer to these as “vanilla” densities as they merely depend uponcross-rate market prices. Each vanilla density is derived from seven optionprices. The remaining columns of Table I provide summary statistics for furthercross-rate RNDs, each of which is obtained from seven OTC option prices forboth the $/£ and the $/€ rates, a copula function, and the OTC price of theATM €/£ option.5 Likewise, the remaining columns of Table II summarizecross-rate RNDs obtained from CME option prices for the $/£ and the $/€rates, a copula function, and the OTC price of the ATM €/£ option.
The summary statistics are averages across densities. For example, each“Variance” statistic for a set of one-month densities is the average value of 12variances, 1 for each RND. The statistics in Table I are generally similar tothose in Table II.
TABLE I
Summary Statistics for Euro/Pound RNDs Obtained from Over-the-Counter Option Prices, Including One Cross-Rate Option Price
Copula Vanilla Gaussian Frank Plackett Clayton Gumbel
Panel A: Averages for one-month RNDs
N 12 12 12 12 12 12r/u 0.5609 4.2876 6.5994 1.2764 1.5721Mean 1.6399 1.6399 1.6399 1.6399 1.6399 1.6399Variance 0.0030 0.0029 0.0031 0.0032 0.0030 0.0030Skewness 0.2295 0.1089 0.1597 0.1824 �0.1975 0.3467Kurtosis 4.2845 3.7081 4.9407 5.2758 4.5067 4.2712K-Sa 0.0140 0.0156 0.0213 0.0292 0.0119G-callb 0.0436 0.0325 0.0411 0.0645 0.0336G-impliedc 0.0028 0.0026 0.0033 0.0053 0.0024
Panel B: Averages for three-month RNDs
N 3 3 3 3 3 3r/u 0.6580 5.4663 9.2415 1.7650 1.7570Mean 1.6207 1.6207 1.6207 1.6207 1.6207 1.6207Variance 0.0083 0.0079 0.0088 0.0092 0.0085 0.0083Skewness 0.2222 0.2042 0.2990 0.3438 �0.1842 0.5369Kurtosis 4.3982 3.8037 5.4548 5.9379 4.8147 4.7460K-Sa 0.0120 0.0142 0.0219 0.0326 0.0197G-callb 0.0316 0.0356 0.0615 0.0625 0.0433G-impliedc 0.0024 0.0022 0.0036 0.0054 0.0036
Note. Average values of summary statistics for euro/pound risk-neutral densities, for various dependence functions. GB2 densitiesdefine the marginal dollar-rate densities and the vanilla cross-rate densities, all obtained from OTC option prices. The Gaussian,Frank, Plackett, Clayton, and Gumbel copula functions are used when defining the bivariate dollar-rate densities. The dependenceparameters of the copulas are estimated by equating the theoretical at-the-money cross-rate option price with the market price. GB2,generalized beta density of the second kind; OTC, over-the-counter.aK-S: Kolmogorov–Smirnov statistic.bG-call: Average absolute error of call price as a ratio of the vanilla price.cG-implied: Average absolute error of implied volatility.
5ATM refers to options whose deltas equal 0.5.
338 Taylor and Wang
Journal of Futures Markets DOI: 10.1002/fut
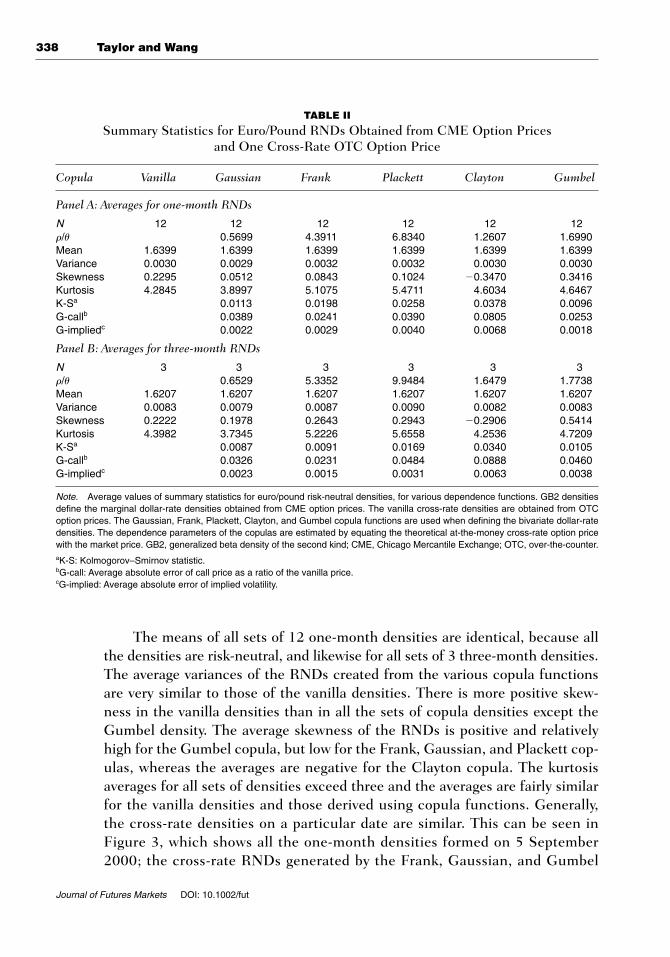
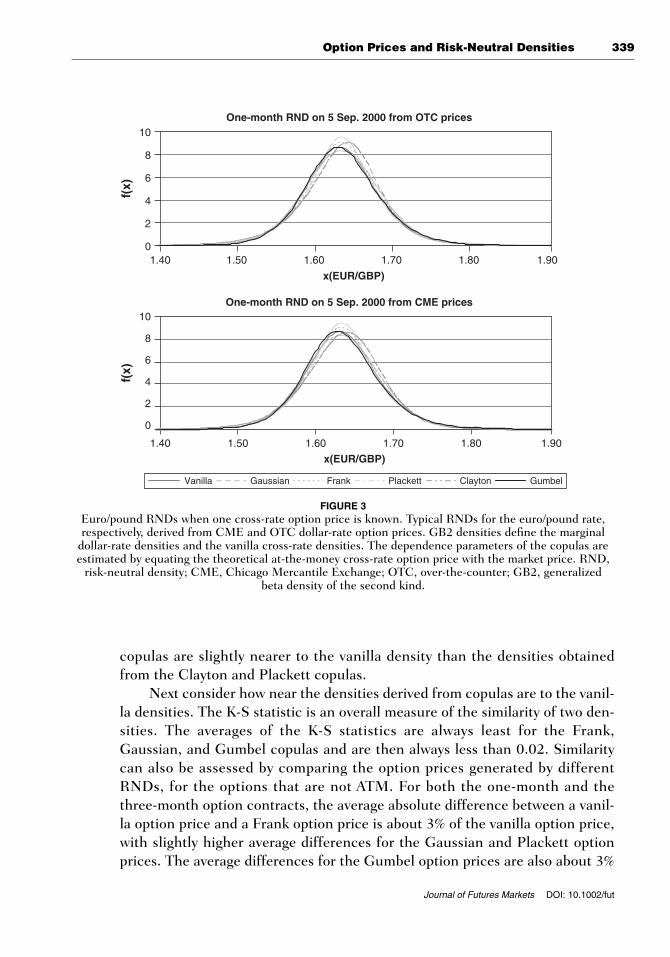
The means of all sets of 12 one-month densities are identical, because allthe densities are risk-neutral, and likewise for all sets of 3 three-month densities.The average variances of the RNDs created from the various copula functionsare very similar to those of the vanilla densities. There is more positive skew-ness in the vanilla densities than in all the sets of copula densities except theGumbel density. The average skewness of the RNDs is positive and relativelyhigh for the Gumbel copula, but low for the Frank, Gaussian, and Plackett cop-ulas, whereas the averages are negative for the Clayton copula. The kurtosisaverages for all sets of densities exceed three and the averages are fairly similarfor the vanilla densities and those derived using copula functions. Generally,the cross-rate densities on a particular date are similar. This can be seen inFigure 3, which shows all the one-month densities formed on 5 September2000; the cross-rate RNDs generated by the Frank, Gaussian, and Gumbel
TABLE II
Summary Statistics for Euro/Pound RNDs Obtained from CME Option Prices and One Cross-Rate OTC Option Price
Copula Vanilla Gaussian Frank Plackett Clayton Gumbel
Panel A: Averages for one-month RNDs
N 12 12 12 12 12 12r/u 0.5699 4.3911 6.8340 1.2607 1.6990Mean 1.6399 1.6399 1.6399 1.6399 1.6399 1.6399Variance 0.0030 0.0029 0.0032 0.0032 0.0030 0.0030Skewness 0.2295 0.0512 0.0843 0.1024 �0.3470 0.3416Kurtosis 4.2845 3.8997 5.1075 5.4711 4.6034 4.6467K-Sa 0.0113 0.0198 0.0258 0.0378 0.0096G-callb 0.0389 0.0241 0.0390 0.0805 0.0253G-impliedc 0.0022 0.0029 0.0040 0.0068 0.0018
Panel B: Averages for three-month RNDs
N 3 3 3 3 3 3r/u 0.6529 5.3352 9.9484 1.6479 1.7738Mean 1.6207 1.6207 1.6207 1.6207 1.6207 1.6207Variance 0.0083 0.0079 0.0087 0.0090 0.0082 0.0083Skewness 0.2222 0.1978 0.2643 0.2943 �0.2906 0.5414Kurtosis 4.3982 3.7345 5.2226 5.6558 4.2536 4.7209K-Sa 0.0087 0.0091 0.0169 0.0340 0.0105G-callb 0.0326 0.0231 0.0484 0.0888 0.0460G-impliedc 0.0023 0.0015 0.0031 0.0063 0.0038
Note. Average values of summary statistics for euro/pound risk-neutral densities, for various dependence functions. GB2 densitiesdefine the marginal dollar-rate densities obtained from CME option prices. The vanilla cross-rate densities are obtained from OTCoption prices. The Gaussian, Frank, Plackett, Clayton, and Gumbel copula functions are used when defining the bivariate dollar-ratedensities. The dependence parameters of the copulas are estimated by equating the theoretical at-the-money cross-rate option pricewith the market price. GB2, generalized beta density of the second kind; CME, Chicago Mercantile Exchange; OTC, over-the-counter.aK-S: Kolmogorov–Smirnov statistic.bG-call: Average absolute error of call price as a ratio of the vanilla price.cG-implied: Average absolute error of implied volatility.
Option Prices and Risk-Neutral Densities 339
Journal of Futures Markets DOI: 10.1002/fut
copulas are slightly nearer to the vanilla density than the densities obtainedfrom the Clayton and Plackett copulas.
Next consider how near the densities derived from copulas are to the vanil-la densities. The K-S statistic is an overall measure of the similarity of two den-sities. The averages of the K-S statistics are always least for the Frank,Gaussian, and Gumbel copulas and are then always less than 0.02. Similaritycan also be assessed by comparing the option prices generated by differentRNDs, for the options that are not ATM. For both the one-month and thethree-month option contracts, the average absolute difference between a vanil-la option price and a Frank option price is about 3% of the vanilla option price,with slightly higher average differences for the Gaussian and Plackett optionprices. The average differences for the Gumbel option prices are also about 3%
One-month RND on 5 Sep. 2000 from OTC prices
0
2
4
6
8
10
1.40 1.50 1.60 1.70 1.80 1.90
x(EUR/GBP)
f(x)
Vanilla Gaussian Frank Plackett Clayton Gumbel
One-month RND on 5 Sep. 2000 from CME prices
1.40 1.50 1.60 1.70 1.80 1.90
x(EUR/GBP)
0
2
4
6
8
10
f(x)
FIGURE 3Euro/pound RNDs when one cross-rate option price is known. Typical RNDs for the euro/pound rate,respectively, derived from CME and OTC dollar-rate option prices. GB2 densities define the marginal
dollar-rate densities and the vanilla cross-rate densities. The dependence parameters of the copulas areestimated by equating the theoretical at-the-money cross-rate option price with the market price. RND,
risk-neutral density; CME, Chicago Mercantile Exchange; OTC, over-the-counter; GB2, generalized beta density of the second kind.
340 Taylor and Wang
Journal of Futures Markets DOI: 10.1002/fut
for the one-month contracts, but are higher for the three-month options. Whenimplied volatilities are compared, the average absolute difference is less thanthe bid–ask spread (typically 0.5%) for all but the Clayton copula. Our compar-isons show that the Frank, Gaussian, and Gumbel copulas are satisfactory, withaverage absolute differences as low as 0.2%; the Plackett copula is fairly satis-factory but the Clayton copula systematically performs less well.
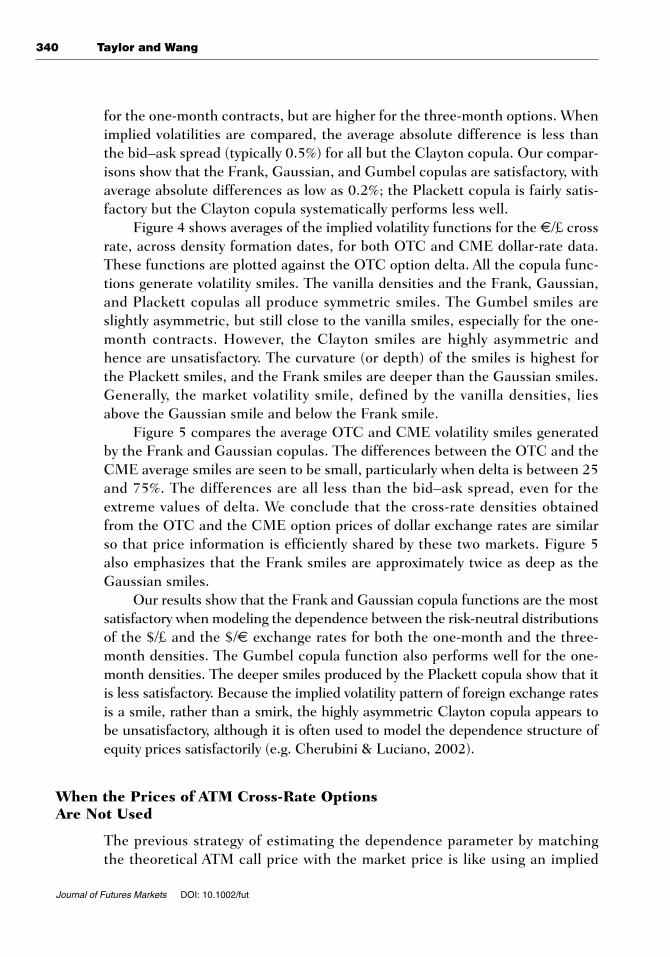
Figure 4 shows averages of the implied volatility functions for the €/£ crossrate, across density formation dates, for both OTC and CME dollar-rate data.These functions are plotted against the OTC option delta. All the copula func-tions generate volatility smiles. The vanilla densities and the Frank, Gaussian,and Plackett copulas all produce symmetric smiles. The Gumbel smiles areslightly asymmetric, but still close to the vanilla smiles, especially for the one-month contracts. However, the Clayton smiles are highly asymmetric andhence are unsatisfactory. The curvature (or depth) of the smiles is highest forthe Plackett smiles, and the Frank smiles are deeper than the Gaussian smiles.Generally, the market volatility smile, defined by the vanilla densities, liesabove the Gaussian smile and below the Frank smile.
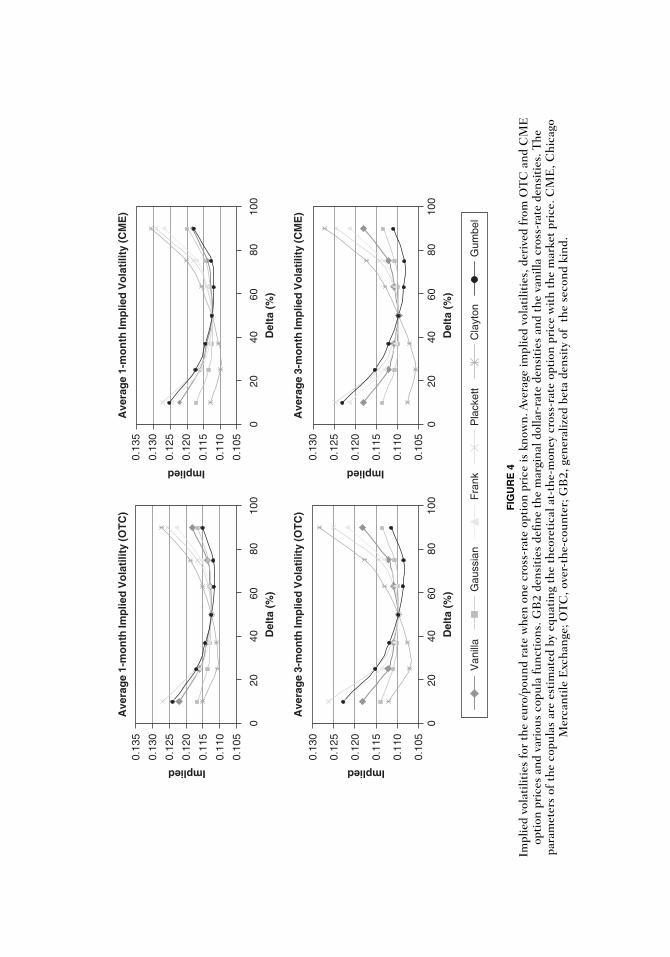
Figure 5 compares the average OTC and CME volatility smiles generatedby the Frank and Gaussian copulas. The differences between the OTC and theCME average smiles are seen to be small, particularly when delta is between 25and 75%. The differences are all less than the bid–ask spread, even for theextreme values of delta. We conclude that the cross-rate densities obtainedfrom the OTC and the CME option prices of dollar exchange rates are similarso that price information is efficiently shared by these two markets. Figure 5also emphasizes that the Frank smiles are approximately twice as deep as theGaussian smiles.
Our results show that the Frank and Gaussian copula functions are the mostsatisfactory when modeling the dependence between the risk-neutral distributionsof the $/£ and the $/€ exchange rates for both the one-month and the three-month densities. The Gumbel copula function also performs well for the one-month densities. The deeper smiles produced by the Plackett copula show that itis less satisfactory. Because the implied volatility pattern of foreign exchange ratesis a smile, rather than a smirk, the highly asymmetric Clayton copula appears tobe unsatisfactory, although it is often used to model the dependence structure ofequity prices satisfactorily (e.g. Cherubini & Luciano, 2002).
When the Prices of ATM Cross-Rate Options Are Not Used
The previous strategy of estimating the dependence parameter by matching the theoretical ATM call price with the market price is like using an implied
Ave
rag
e 1-
mo
nth
Imp
lied
Vo
lati
lity
(OT
C)
0.10
5
020
4060
8010
0
0.11
0
0.11
5
0.12
0
0.12
5
0.13
0
0.13
5
Del
ta (
%)
Implied
020
4060
8010
0
Del
ta (
%)
0.10
5
0.11
0
0.11
5
0.12
0
0.12
5
0.13
0
0.13
5
Implied
Ave
rag
e 1-
mo
nth
Imp
lied
Vo
lati
lity
(CM
E)
020
4060
8010
0
Del
ta (
%)
0.10
5
0.11
0
0.11
5
0.12
0
0.12
5
0.13
0
Implied
Ave
rag
e 3-
mo
nth
Imp
lied
Vo
lati
lity
(OT
C)
020
4060
8010
0
Del
ta (
%)
0.10
5
0.11
0
0.11
5
0.12
0
0.12
5
0.13
0
Implied
Ave
rag
e 3-
mo
nth
Imp
lied
Vo
lati
lity
(CM
E)
Van
illa
Gau
ssia
nF
rank
Pla
cket
tC
layt
onG
umbe
l
FIG
UR
E 4
Impl
ied
vola
tilit
ies
for
the
euro
/pou
nd r
ate
whe
n on
e cr
oss-
rate
opt
ion
pric
e is
kno
wn.
Ave
rage
impl
ied
vola
tilit
ies,
der
ived
fro
m O
TC
and
CM
Eop
tion
pri
ces
and
vari
ous
copu
la f
unct
ions
. GB
2 de
nsit
ies
defin
e th
e m
argi
nal d
olla
r-ra
te d
ensi
ties
and
the
van
illa
cros
s-ra
te d
ensi
ties
. The
para
met
ers
of t
he c
opul
as a
re e
stim
ated
by
equa
ting
the
the
oret
ical
at-
the-
mon
ey c
ross
-rat
e op
tion
pri
ce w
ith
the
mar
ket
pric
e. C
ME
, Chi
cago
Mer
cant
ile E
xcha
nge;
OT
C, o
ver-
the-
coun
ter;
GB
2, g
ener
aliz
ed b
eta
dens
ity
of t
he s
econ
d ki
nd.
342 Taylor and Wang
Journal of Futures Markets DOI: 10.1002/fut
risk-neutral correlation to estimate the dependence parameter. When the ATMcross-rate market price is either unavailable or considered to be an unfair price,we can instead use the realized historical correlation to estimate the depend-ence parameter.
Time series of implied and realized correlation coefficients throughour eight-month sample period in 2000 are shown in Figure 6. These arecorrelations between changes in the logarithms of the $/£ and the $/€ rates.
Average 1-month Implied Volatility with Gaussian andFrank Copulas
Average 3-month Implied Volatility with Gaussian andFrank Copulas
0 20 40 60 80 100
Delta (%)
0 20 40 60 80 100
Delta (%)
0.110
0.115
0.120
0.125
0.130
Imp
lied
0.105
0.110
0.115
0.120
0.125
0.130
Imp
lied
OTC-G
CME-G
OTC-F
CME-F
FIGURE 5Implied volatilities for the euro/pound rate from OTC and CME option prices, when one cross-rateoption price is known. Average implied volatilities, derived from OTC and CME option prices and
various copula functions. GB2 densities define the marginal dollar-rate densities and the vanilla cross-rate densities. The parameters of the copulas are estimated by equating the theoretical at-the-moneycross-rate option price with the market price. CME, Chicago Mercantile Exchange; OTC, over-the-
counter; GB2, generalized beta density of the second kind.
Option Prices and Risk-Neutral Densities 343
Journal of Futures Markets DOI: 10.1002/fut
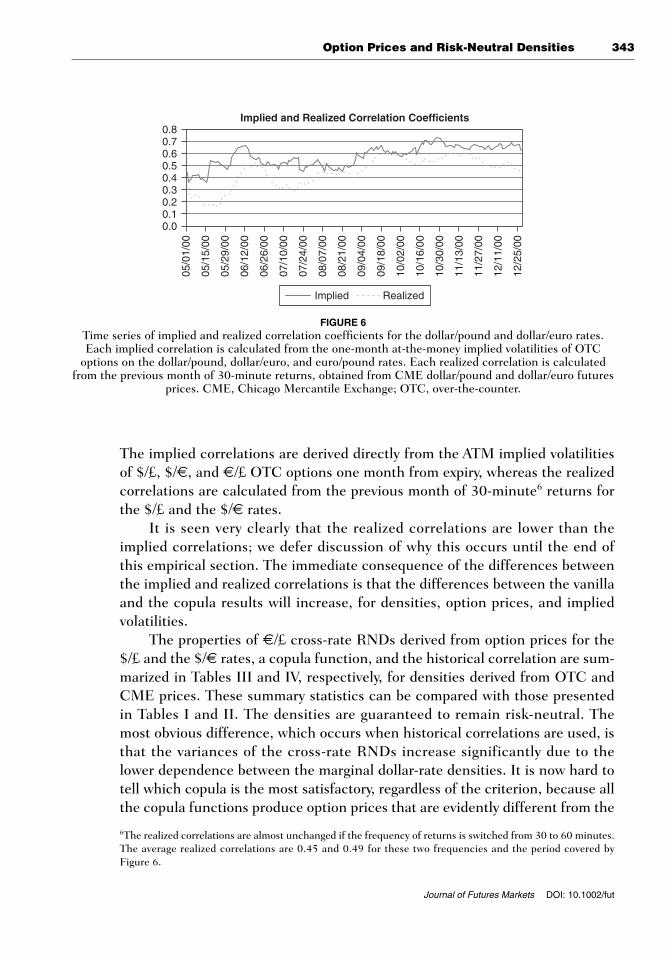
The implied correlations are derived directly from the ATM implied volatilitiesof $/£, $/€, and €/£ OTC options one month from expiry, whereas the realizedcorrelations are calculated from the previous month of 30-minute6 returns forthe $/£ and the $/€ rates.
It is seen very clearly that the realized correlations are lower than theimplied correlations; we defer discussion of why this occurs until the end ofthis empirical section. The immediate consequence of the differences betweenthe implied and realized correlations is that the differences between the vanillaand the copula results will increase, for densities, option prices, and impliedvolatilities.
The properties of €/£ cross-rate RNDs derived from option prices for the$/£ and the $/€ rates, a copula function, and the historical correlation are sum-marized in Tables III and IV, respectively, for densities derived from OTC andCME prices. These summary statistics can be compared with those presentedin Tables I and II. The densities are guaranteed to remain risk-neutral. Themost obvious difference, which occurs when historical correlations are used, isthat the variances of the cross-rate RNDs increase significantly due to thelower dependence between the marginal dollar-rate densities. It is now hard totell which copula is the most satisfactory, regardless of the criterion, because allthe copula functions produce option prices that are evidently different from the
Implied and Realized Correlation Coefficients
0.00.10.20.30.40.50.60.70.8
05/0
1/00
05/1
5/00
05/2
9/00
06/1
2/00
06/2
6/00
07/1
0/00
07/2
4/00
08/0
7/00
08/2
1/00
09/0
4/00
09/1
8/00
10/0
2/00
10/1
6/00
10/3
0/00
11/1
3/00
11/2
7/00
12/1
1/00
12/2
5/00
Implied Realized
FIGURE 6Time series of implied and realized correlation coefficients for the dollar/pound and dollar/euro rates.Each implied correlation is calculated from the one-month at-the-money implied volatilities of OTC
options on the dollar/pound, dollar/euro, and euro/pound rates. Each realized correlation is calculatedfrom the previous month of 30-minute returns, obtained from CME dollar/pound and dollar/euro futures
prices. CME, Chicago Mercantile Exchange; OTC, over-the-counter.
6The realized correlations are almost unchanged if the frequency of returns is switched from 30 to 60 minutes.The average realized correlations are 0.45 and 0.49 for these two frequencies and the period covered byFigure 6.
344 Taylor and Wang
Journal of Futures Markets DOI: 10.1002/fut
vanilla option prices. For example, the average absolute difference between thecopula and vanilla implied volatilities is about 1% for the one-month maturitiesand 2% for the three-month maturities when historical correlations areemployed.
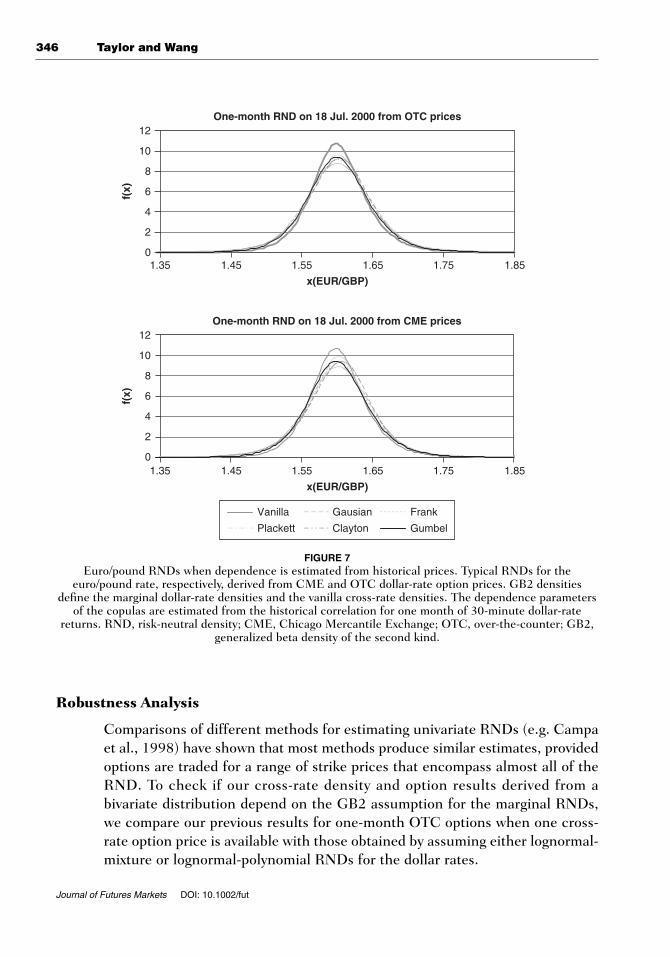
One-month cross-rate RNDs formed on a typical date, 18 July 2000, areshown in Figure 7. The peaks of the copula densities are lower than the vanilladensities because the copula variances exceed the vanilla variances. Figure 8shows the averages of the one-month implied volatility functions. All the copulafunctions again produce volatility smiles, although the general levels of thesesmiles are visibly higher than the vanilla smiles. The previous remarks aboutthe relative depth and the symmetry of the copula smiles remain valid when theimplied correlation is replaced by the historical correlation.
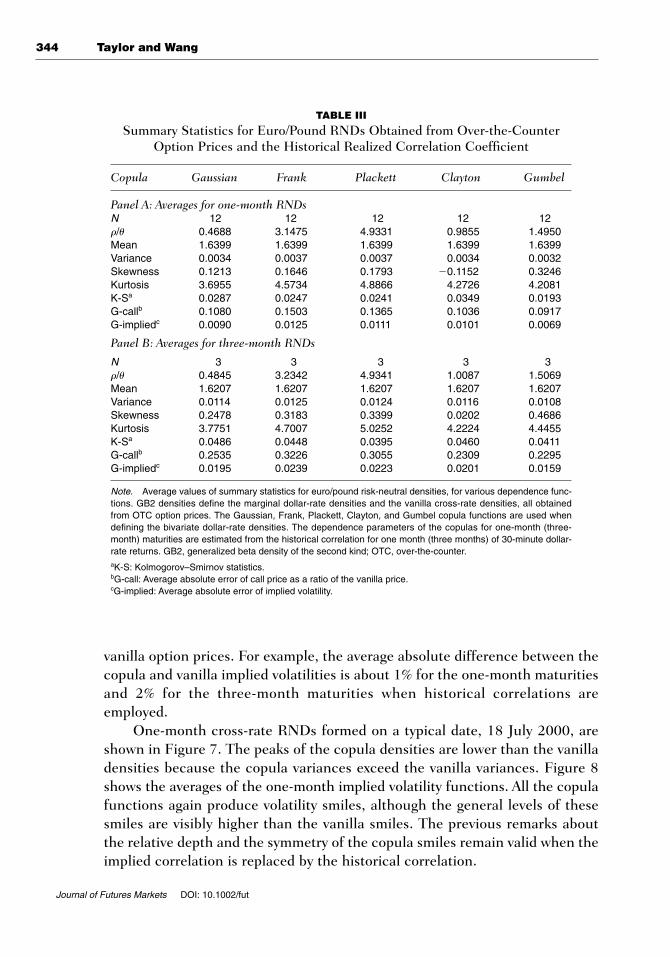
TABLE III
Summary Statistics for Euro/Pound RNDs Obtained from Over-the-CounterOption Prices and the Historical Realized Correlation Coefficient
Copula Gaussian Frank Plackett Clayton Gumbel
Panel A: Averages for one-month RNDsN 12 12 12 12 12r/u 0.4688 3.1475 4.9331 0.9855 1.4950Mean 1.6399 1.6399 1.6399 1.6399 1.6399Variance 0.0034 0.0037 0.0037 0.0034 0.0032Skewness 0.1213 0.1646 0.1793 �0.1152 0.3246Kurtosis 3.6955 4.5734 4.8866 4.2726 4.2081K-Sa 0.0287 0.0247 0.0241 0.0349 0.0193G-callb 0.1080 0.1503 0.1365 0.1036 0.0917G-impliedc 0.0090 0.0125 0.0111 0.0101 0.0069
Panel B: Averages for three-month RNDs
N 3 3 3 3 3r/u 0.4845 3.2342 4.9341 1.0087 1.5069Mean 1.6207 1.6207 1.6207 1.6207 1.6207Variance 0.0114 0.0125 0.0124 0.0116 0.0108Skewness 0.2478 0.3183 0.3399 0.0202 0.4686Kurtosis 3.7751 4.7007 5.0252 4.2224 4.4455K-Sa 0.0486 0.0448 0.0395 0.0460 0.0411G-callb 0.2535 0.3226 0.3055 0.2309 0.2295G-impliedc 0.0195 0.0239 0.0223 0.0201 0.0159
Note. Average values of summary statistics for euro/pound risk-neutral densities, for various dependence func-tions. GB2 densities define the marginal dollar-rate densities and the vanilla cross-rate densities, all obtainedfrom OTC option prices. The Gaussian, Frank, Plackett, Clayton, and Gumbel copula functions are used whendefining the bivariate dollar-rate densities. The dependence parameters of the copulas for one-month (three-month) maturities are estimated from the historical correlation for one month (three months) of 30-minute dollar-rate returns. GB2, generalized beta density of the second kind; OTC, over-the-counter.aK-S: Kolmogorov–Smirnov statistics.bG-call: Average absolute error of call price as a ratio of the vanilla price.cG-implied: Average absolute error of implied volatility.
Option Prices and Risk-Neutral Densities 345
Journal of Futures Markets DOI: 10.1002/fut
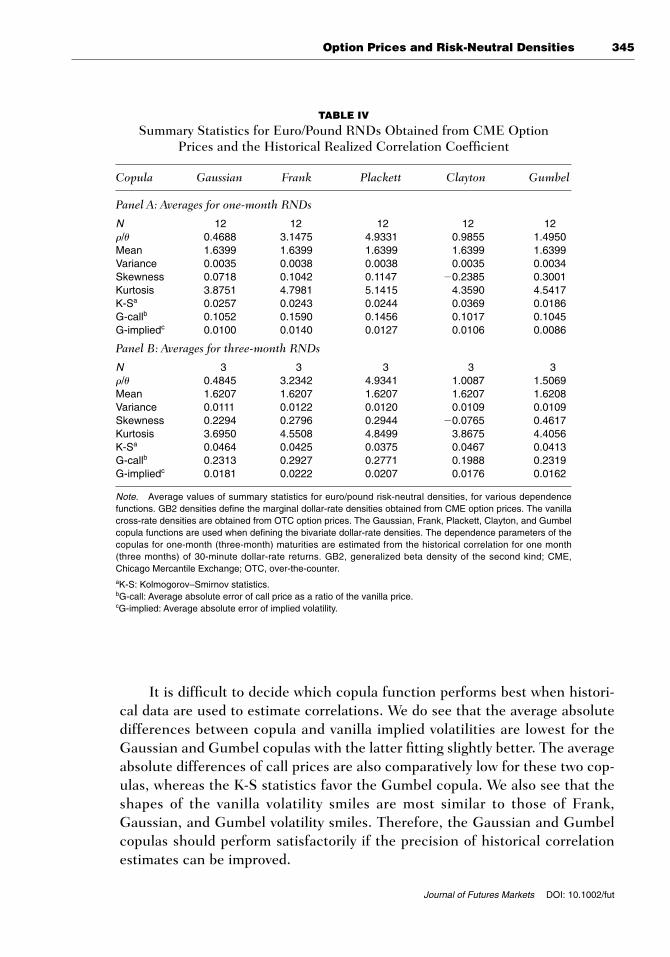
It is difficult to decide which copula function performs best when histori-cal data are used to estimate correlations. We do see that the average absolutedifferences between copula and vanilla implied volatilities are lowest for theGaussian and Gumbel copulas with the latter fitting slightly better. The averageabsolute differences of call prices are also comparatively low for these two cop-ulas, whereas the K-S statistics favor the Gumbel copula. We also see that theshapes of the vanilla volatility smiles are most similar to those of Frank,Gaussian, and Gumbel volatility smiles. Therefore, the Gaussian and Gumbelcopulas should perform satisfactorily if the precision of historical correlationestimates can be improved.
TABLE IV
Summary Statistics for Euro/Pound RNDs Obtained from CME Option Prices and the Historical Realized Correlation Coefficient
Copula Gaussian Frank Plackett Clayton Gumbel
Panel A: Averages for one-month RNDs
N 12 12 12 12 12r/u 0.4688 3.1475 4.9331 0.9855 1.4950Mean 1.6399 1.6399 1.6399 1.6399 1.6399Variance 0.0035 0.0038 0.0038 0.0035 0.0034Skewness 0.0718 0.1042 0.1147 �0.2385 0.3001Kurtosis 3.8751 4.7981 5.1415 4.3590 4.5417K-Sa 0.0257 0.0243 0.0244 0.0369 0.0186G-callb 0.1052 0.1590 0.1456 0.1017 0.1045G-impliedc 0.0100 0.0140 0.0127 0.0106 0.0086
Panel B: Averages for three-month RNDs
N 3 3 3 3 3r/u 0.4845 3.2342 4.9341 1.0087 1.5069Mean 1.6207 1.6207 1.6207 1.6207 1.6208Variance 0.0111 0.0122 0.0120 0.0109 0.0109Skewness 0.2294 0.2796 0.2944 �0.0765 0.4617Kurtosis 3.6950 4.5508 4.8499 3.8675 4.4056K-Sa 0.0464 0.0425 0.0375 0.0467 0.0413G-callb 0.2313 0.2927 0.2771 0.1988 0.2319G-impliedc 0.0181 0.0222 0.0207 0.0176 0.0162
Note. Average values of summary statistics for euro/pound risk-neutral densities, for various dependencefunctions. GB2 densities define the marginal dollar-rate densities obtained from CME option prices. The vanillacross-rate densities are obtained from OTC option prices. The Gaussian, Frank, Plackett, Clayton, and Gumbelcopula functions are used when defining the bivariate dollar-rate densities. The dependence parameters of thecopulas for one-month (three-month) maturities are estimated from the historical correlation for one month(three months) of 30-minute dollar-rate returns. GB2, generalized beta density of the second kind; CME,Chicago Mercantile Exchange; OTC, over-the-counter.aK-S: Kolmogorov–Smirnov statistics.bG-call: Average absolute error of call price as a ratio of the vanilla price.cG-implied: Average absolute error of implied volatility.
346 Taylor and Wang
Journal of Futures Markets DOI: 10.1002/fut
Robustness Analysis
Comparisons of different methods for estimating univariate RNDs (e.g. Campaet al., 1998) have shown that most methods produce similar estimates, providedoptions are traded for a range of strike prices that encompass almost all of theRND. To check if our cross-rate density and option results derived from abivariate distribution depend on the GB2 assumption for the marginal RNDs,we compare our previous results for one-month OTC options when one cross-rate option price is available with those obtained by assuming either lognormal-mixture or lognormal-polynomial RNDs for the dollar rates.
0
2
4
6
8
10
12
1.35 1.45 1.55 1.65 1.75 1.85
x(EUR/GBP)
1.35 1.45 1.55 1.65 1.75 1.85
x(EUR/GBP)
f(x)
0
2
4
6
8
10
12
f(x)
One-month RND on 18 Jul. 2000 from CME prices
One-month RND on 18 Jul. 2000 from OTC prices
Vanilla Gausian Frank
Plackett Clayton Gumbel
FIGURE 7Euro/pound RNDs when dependence is estimated from historical prices. Typical RNDs for the
euro/pound rate, respectively, derived from CME and OTC dollar-rate option prices. GB2 densitiesdefine the marginal dollar-rate densities and the vanilla cross-rate densities. The dependence parameters
of the copulas are estimated from the historical correlation for one month of 30-minute dollar-ratereturns. RND, risk-neutral density; CME, Chicago Mercantile Exchange; OTC, over-the-counter; GB2,
generalized beta density of the second kind.
Option Prices and Risk-Neutral Densities 347
Journal of Futures Markets DOI: 10.1002/fut
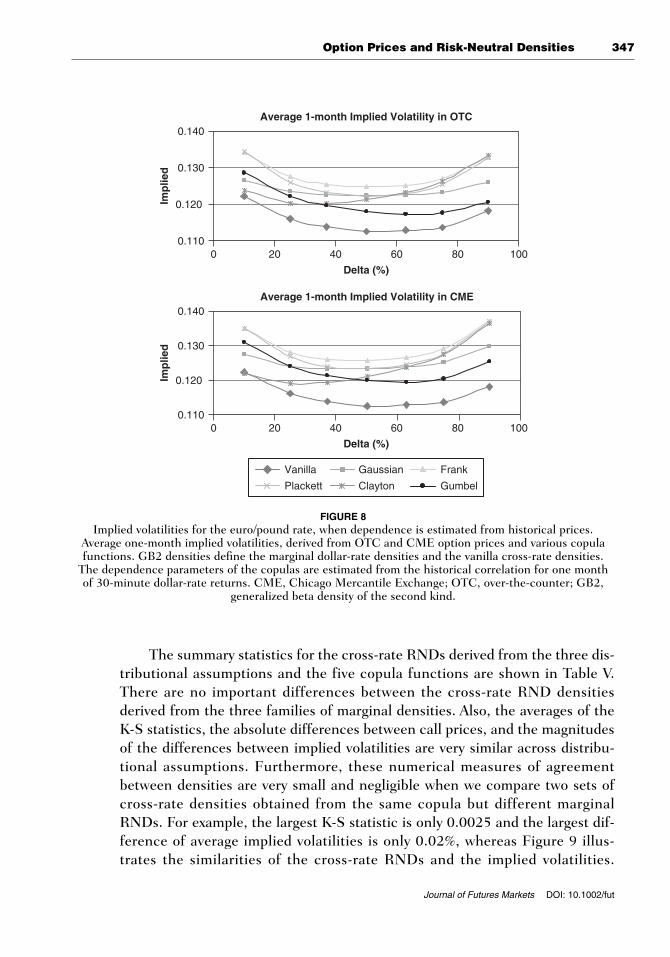
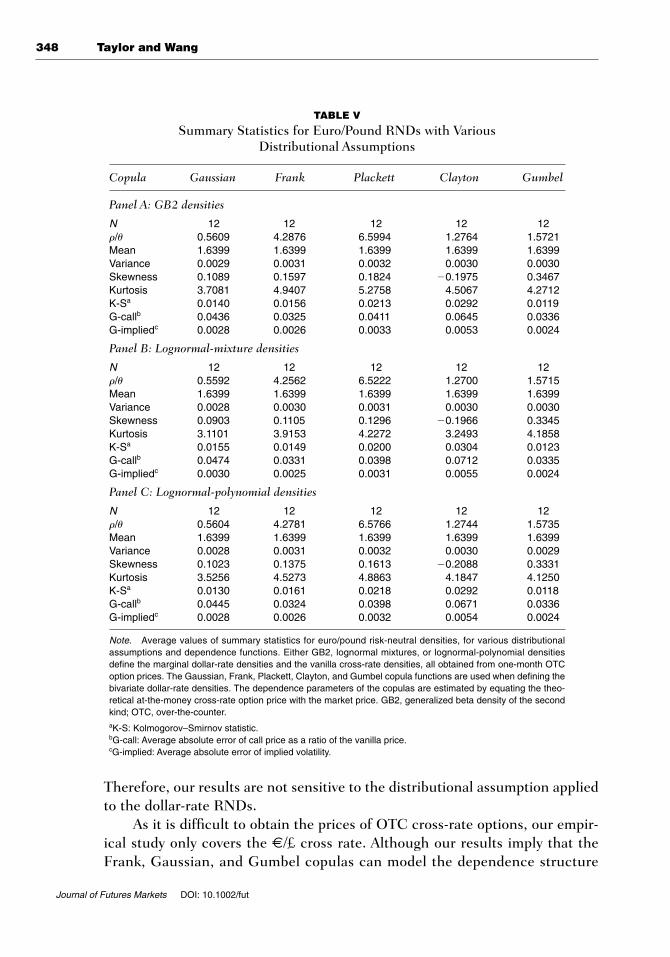
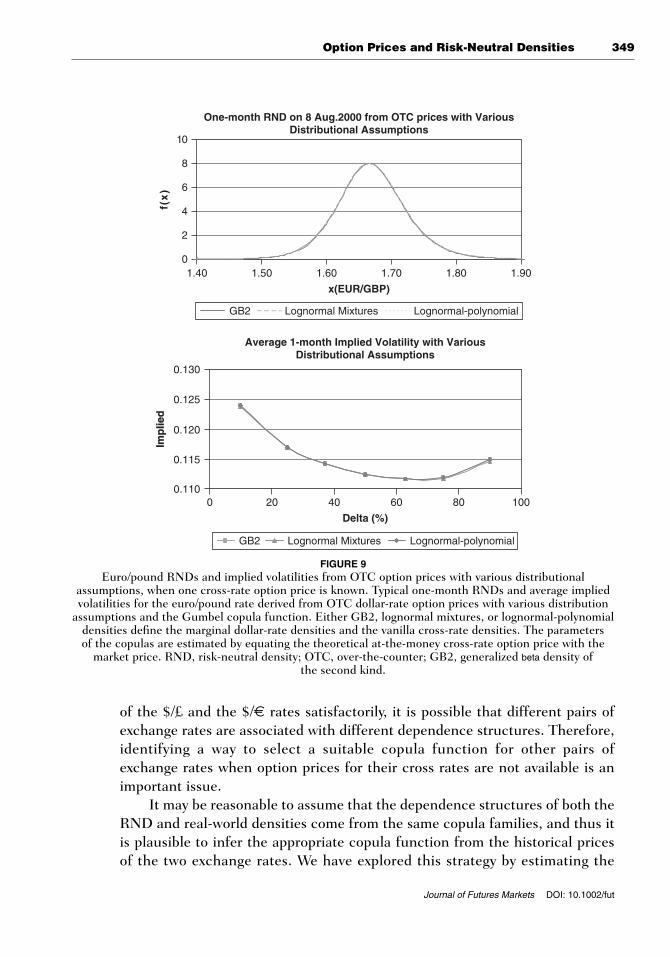
The summary statistics for the cross-rate RNDs derived from the three dis-tributional assumptions and the five copula functions are shown in Table V.There are no important differences between the cross-rate RND densitiesderived from the three families of marginal densities. Also, the averages of theK-S statistics, the absolute differences between call prices, and the magnitudesof the differences between implied volatilities are very similar across distribu-tional assumptions. Furthermore, these numerical measures of agreementbetween densities are very small and negligible when we compare two sets ofcross-rate densities obtained from the same copula but different marginalRNDs. For example, the largest K-S statistic is only 0.0025 and the largest dif-ference of average implied volatilities is only 0.02%, whereas Figure 9 illus-trates the similarities of the cross-rate RNDs and the implied volatilities.
FIGURE 8Implied volatilities for the euro/pound rate, when dependence is estimated from historical prices.
Average one-month implied volatilities, derived from OTC and CME option prices and various copulafunctions. GB2 densities define the marginal dollar-rate densities and the vanilla cross-rate densities.
The dependence parameters of the copulas are estimated from the historical correlation for one monthof 30-minute dollar-rate returns. CME, Chicago Mercantile Exchange; OTC, over-the-counter; GB2,
generalized beta density of the second kind.
Average 1-month Implied Volatility in OTC
Average 1-month Implied Volatility in CME
0 20 40 60 80 100
Delta (%)
0 20 40 60 80 100
Delta (%)
0.110
0.120
0.130
0.140
Imp
lied
0.110
0.120
0.130
0.140
Imp
lied
Vanilla Gaussian Frank
Plackett Clayton Gumbel
348 Taylor and Wang
Journal of Futures Markets DOI: 10.1002/fut
Therefore, our results are not sensitive to the distributional assumption appliedto the dollar-rate RNDs.
As it is difficult to obtain the prices of OTC cross-rate options, our empir-ical study only covers the €/£ cross rate. Although our results imply that theFrank, Gaussian, and Gumbel copulas can model the dependence structure
TABLE V
Summary Statistics for Euro/Pound RNDs with Various Distributional Assumptions
Copula Gaussian Frank Plackett Clayton Gumbel
Panel A: GB2 densities
N 12 12 12 12 12r/u 0.5609 4.2876 6.5994 1.2764 1.5721Mean 1.6399 1.6399 1.6399 1.6399 1.6399Variance 0.0029 0.0031 0.0032 0.0030 0.0030Skewness 0.1089 0.1597 0.1824 �0.1975 0.3467Kurtosis 3.7081 4.9407 5.2758 4.5067 4.2712K-Sa 0.0140 0.0156 0.0213 0.0292 0.0119G-callb 0.0436 0.0325 0.0411 0.0645 0.0336G-impliedc 0.0028 0.0026 0.0033 0.0053 0.0024
Panel B: Lognormal-mixture densities
N 12 12 12 12 12r/u 0.5592 4.2562 6.5222 1.2700 1.5715Mean 1.6399 1.6399 1.6399 1.6399 1.6399Variance 0.0028 0.0030 0.0031 0.0030 0.0030Skewness 0.0903 0.1105 0.1296 �0.1966 0.3345Kurtosis 3.1101 3.9153 4.2272 3.2493 4.1858K-Sa 0.0155 0.0149 0.0200 0.0304 0.0123G-callb 0.0474 0.0331 0.0398 0.0712 0.0335G-impliedc 0.0030 0.0025 0.0031 0.0055 0.0024
Panel C: Lognormal-polynomial densities
N 12 12 12 12 12r/u 0.5604 4.2781 6.5766 1.2744 1.5735Mean 1.6399 1.6399 1.6399 1.6399 1.6399Variance 0.0028 0.0031 0.0032 0.0030 0.0029Skewness 0.1023 0.1375 0.1613 �0.2088 0.3331Kurtosis 3.5256 4.5273 4.8863 4.1847 4.1250K-Sa 0.0130 0.0161 0.0218 0.0292 0.0118G-callb 0.0445 0.0324 0.0398 0.0671 0.0336G-impliedc 0.0028 0.0026 0.0032 0.0054 0.0024
Note. Average values of summary statistics for euro/pound risk-neutral densities, for various distributionalassumptions and dependence functions. Either GB2, lognormal mixtures, or lognormal-polynomial densitiesdefine the marginal dollar-rate densities and the vanilla cross-rate densities, all obtained from one-month OTCoption prices. The Gaussian, Frank, Plackett, Clayton, and Gumbel copula functions are used when defining thebivariate dollar-rate densities. The dependence parameters of the copulas are estimated by equating the theo-retical at-the-money cross-rate option price with the market price. GB2, generalized beta density of the secondkind; OTC, over-the-counter.aK-S: Kolmogorov–Smirnov statistic.bG-call: Average absolute error of call price as a ratio of the vanilla price.cG-implied: Average absolute error of implied volatility.
Option Prices and Risk-Neutral Densities 349
Journal of Futures Markets DOI: 10.1002/fut
of the $/£ and the $/€ rates satisfactorily, it is possible that different pairs ofexchange rates are associated with different dependence structures. Therefore,identifying a way to select a suitable copula function for other pairs ofexchange rates when option prices for their cross rates are not available is animportant issue.
It may be reasonable to assume that the dependence structures of both theRND and real-world densities come from the same copula families, and thus itis plausible to infer the appropriate copula function from the historical pricesof the two exchange rates. We have explored this strategy by estimating the
Average 1-month Implied Volatility with Various Distributional Assumptions
0.110
0.115
0.120
0.125
0.130
Imp
lied
Imp
lied
0 20 40 60 80 100
Delta (%)
GB2 Lognormal Mixtures Lognormal-polynomial
One-month RND on 8 Aug.2000 from OTC prices with Various Distributional Assumptions
01.40 1.50 1.60 1.70
x(EUR/GBP)
1.80 1.90
2
4
6
8
10
f(x
)
GB2 Lognormal Mixtures Lognormal-polynomial
FIGURE 9Euro/pound RNDs and implied volatilities from OTC option prices with various distributional
assumptions, when one cross-rate option price is known. Typical one-month RNDs and average impliedvolatilities for the euro/pound rate derived from OTC dollar-rate option prices with various distribution
assumptions and the Gumbel copula function. Either GB2, lognormal mixtures, or lognormal-polynomialdensities define the marginal dollar-rate densities and the vanilla cross-rate densities. The parameters of the copulas are estimated by equating the theoretical at-the-money cross-rate option price with the
market price. RND, risk-neutral density; OTC, over-the-counter; GB2, generalized beta density of the second kind.
350 Taylor and Wang
Journal of Futures Markets DOI: 10.1002/fut
GARCH-copula dependence model of Bartram et al. (2007). In our implemen-tation, the returns from each exchange rate are modeled by supposing they follow an MA(1) process, with the conditional variance specified as GARCH(1, 1)and the conditional density as Student-t. This model specifies univariate, con-ditional c.d.f. for each exchange rate from which time series of observed cumu-lative probabilities can be calculated, say , for the $/£ rate and for the$/€ rate. A time-varying copula parameter, such as rt for the Gaussian copula,can then be estimated by an equation resembling an autoregressive process.Like Bartram et al. (2007), we suppose that
(13)
The parameters in this equation are estimated by maximizing the log-likelihood of the bivariate time series .
We find that the highest log-likelihood for the bivariate data set of $/£ and$/€ daily returns from 2000 to 2007 is provided by the Gaussian copula. Thedifferences between the log-likelihood for the Gaussian copula and the log-likelihoods for the other copulas are 21 for the Gumbel copula, 32 for thePlackett copula, 97 for the Frank copula, and 217 for the Clayton copula; asimilar ranking of the copulas was reported in a previous version of this articlefor the earlier period from 1994 to 2000. The likelihood results are consistentwith the results obtained from the cross-rate vanilla option prices.
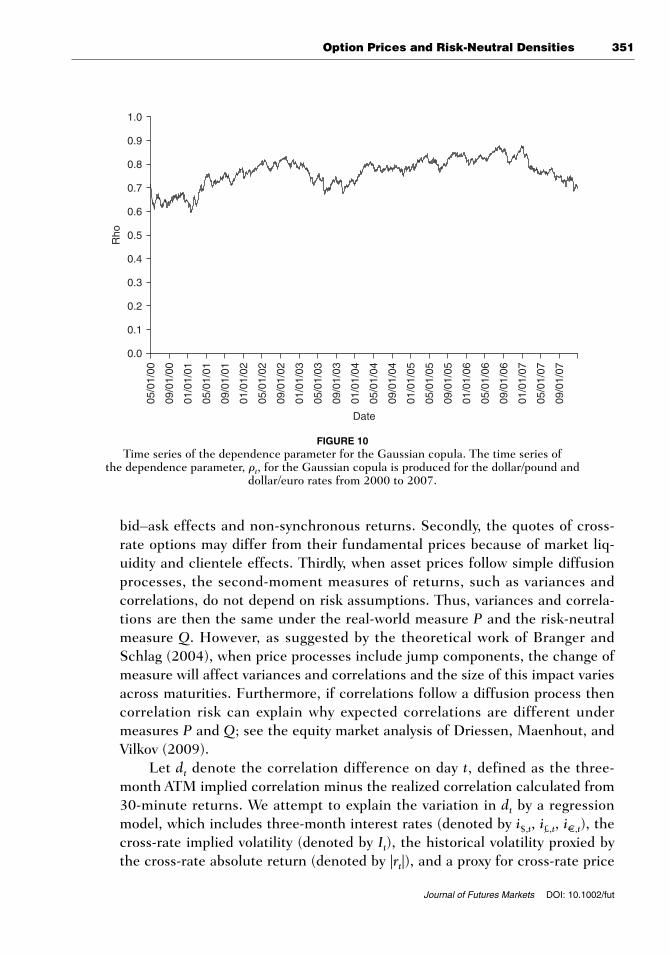
Figure 10 shows the time series of rt for the Gaussian copula, calculatedusing (13) and the maximum-likelihood parameter values, which are v� 0.0215,f1 � 0.9806, f2 � 0, and g� �0.0428.
Determinants of the Correlation Risk Premium
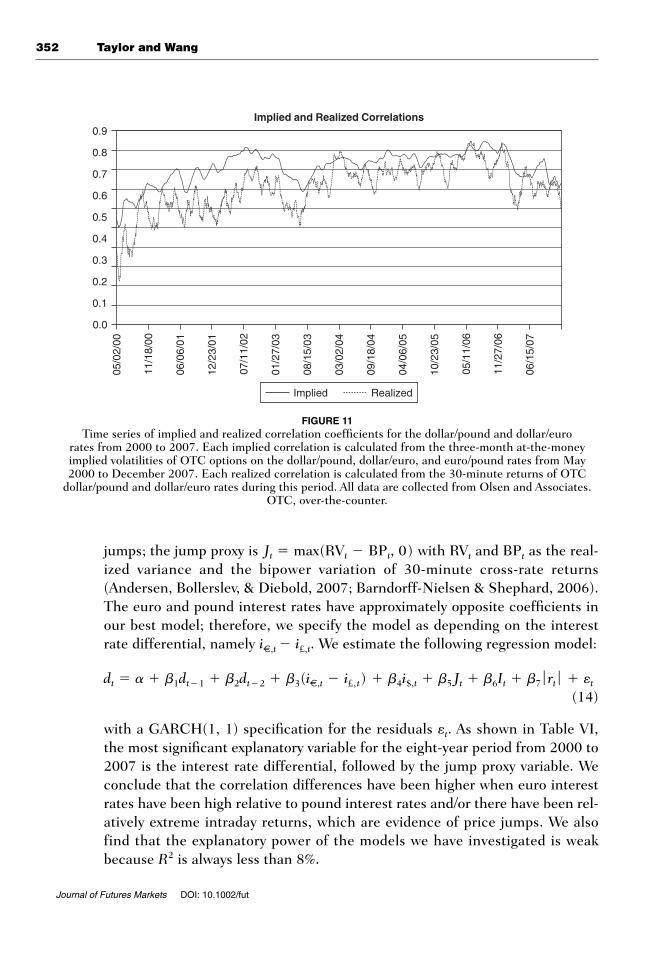
Figure 6 shows that the implied correlation between returns for the $/£ and the$/€ rates generally exceeded the realized correlation during 2000. Figure 11shows that this is also true for the longer and more recent period from 2001 to2007.7 The differences between the implied and realized correlations can beinterpreted as estimates of the correlation risk premium and this premium canbe important.8
Some possible explanations for these differences are biased historical esti-mates, mispriced ATM cross-rate options, and premia for risks that cannot behedged. Firstly, historical estimates may contain bias that can arise from
5ut,vt6
rt � v � f1rt�1 � f2rt�2 � g ƒ ut�1� vt�1 ƒ .
5vt65ut6
7We thank the referee for advising us to consider the longer period and how to evaluate empirical explana-tions for the differences between implied and realized correlations.8For example, suppose that the volatility of all dollar rates is 10% and that these rates do not have a volatilityrisk premium. Then implied and realized correlations equal to 0.6 and 0.5, respectively, provide respectivecross-rate volatilities equal to 8.9 and 10.0%, i.e. they imply an economically significant and negative cross-rate volatility risk premium.
Option Prices and Risk-Neutral Densities 351
Journal of Futures Markets DOI: 10.1002/fut
bid–ask effects and non-synchronous returns. Secondly, the quotes of cross-rate options may differ from their fundamental prices because of market liq-uidity and clientele effects. Thirdly, when asset prices follow simple diffusionprocesses, the second-moment measures of returns, such as variances and correlations, do not depend on risk assumptions. Thus, variances and correla-tions are then the same under the real-world measure P and the risk-neutralmeasure Q. However, as suggested by the theoretical work of Branger andSchlag (2004), when price processes include jump components, the change ofmeasure will affect variances and correlations and the size of this impact variesacross maturities. Furthermore, if correlations follow a diffusion process thencorrelation risk can explain why expected correlations are different undermeasures P and Q; see the equity market analysis of Driessen, Maenhout, andVilkov (2009).
Let dt denote the correlation difference on day t, defined as the three-month ATM implied correlation minus the realized correlation calculated from30-minute returns. We attempt to explain the variation in dt by a regressionmodel, which includes three-month interest rates (denoted by i$,t, i£,t, i€,t), thecross-rate implied volatility (denoted by It), the historical volatility proxied bythe cross-rate absolute return (denoted by |rt|), and a proxy for cross-rate price
0.0
0.1
0.2
0.3
0.4
0.5
0.6
0.7
0.8
0.9
1.0
05/0
1/00
09/0
1/00
01/0
1/01
05/0
1/01
09/0
1/01
01/0
1/02
05/0
1/02
09/0
1/02
01/0
1/03
05/0
1/03
09/0
1/03
01/0
1/04
05/0
1/04
09/0
1/04
01/0
1/05
05/0
1/05
09/0
1/05
01/0
1/06
05/0
1/06
09/0
1/06
01/0
1/07
05/0
1/07
09/0
1/07
Date
Rho
FIGURE 10Time series of the dependence parameter for the Gaussian copula. The time series of
the dependence parameter, rt, for the Gaussian copula is produced for the dollar/pound and dollar/euro rates from 2000 to 2007.
352 Taylor and Wang
Journal of Futures Markets DOI: 10.1002/fut
jumps; the jump proxy is with RVt and BPt as the real-ized variance and the bipower variation of 30-minute cross-rate returns(Andersen, Bollerslev, & Diebold, 2007; Barndorff-Nielsen & Shephard, 2006).The euro and pound interest rates have approximately opposite coefficients inour best model; therefore, we specify the model as depending on the interestrate differential, namely i
€,t � i£,t. We estimate the following regression model:
(14)
with a GARCH(1, 1) specification for the residuals et. As shown in Table VI,the most significant explanatory variable for the eight-year period from 2000 to2007 is the interest rate differential, followed by the jump proxy variable. Weconclude that the correlation differences have been higher when euro interestrates have been high relative to pound interest rates and/or there have been rel-atively extreme intraday returns, which are evidence of price jumps. We alsofind that the explanatory power of the models we have investigated is weakbecause R2 is always less than 8%.
dt � a � b1dt�1 � b2dt�2 � b3(i€,t � i£,t) � b4i$,t � b5 Jt � b6It � b7 ƒ rt ƒ � et
Jt � max(RVt � BPt, 0)
0.8
0.7
0.6
0.5
0.4
0.3
0.2
0.1
0.0
0.905
/02/
00
11/1
8/00
06/0
6/01
12/2
3/01
07/1
1/02
01/2
7/03
08/1
5/03
03/0
2/04
09/1
8/04
04/0
6/05
10/2
3/05
05/1
1/06
11/2
7/06
06/1
5/07
Implied and Realized Correlations
Implied Realized
FIGURE 11Time series of implied and realized correlation coefficients for the dollar/pound and dollar/euro
rates from 2000 to 2007. Each implied correlation is calculated from the three-month at-the-moneyimplied volatilities of OTC options on the dollar/pound, dollar/euro, and euro/pound rates from May2000 to December 2007. Each realized correlation is calculated from the 30-minute returns of OTC
dollar/pound and dollar/euro rates during this period. All data are collected from Olsen and Associates.OTC, over-the-counter.

Option Prices and Risk-Neutral Densities 353
Journal of Futures Markets DOI: 10.1002/fut
CONCLUDING REMARKS
This study illustrates practical methods for estimating cross-rate RNDs. Wesuppose that there is limited information available about the prices of cross-rate options, which contrasts with an abundance of information about theprices of dollar-rate options. The theoretical cross-rate RND is derived fromthe bivariate RND for two dollar exchange rates. Cross-rate RNDs can be usedto price any European contingent claim on cross rates and they also provideinsight into market expectations.
Our methods make an assumption about the number of available impliedvolatilities for cross-rate options. We find that cross-rate option prices are sen-sitive to this number, which is assumed to be either one or zero. When thereare no cross-rate option prices we have to rely on historical dollar exchangerates to quantify the dependence between the two dollar rates. The historicalcorrelation estimates are positive and on average less than those implied byoption prices.
Our methods use a copula function to provide an empirical approximationto the function defined by the bivariate RND of the dollar rates divided by theproduct of the marginal RNDs. The Frank, Gaussian, and Gumbel copulasprovide satisfactory results, when we compare the cross-rate RNDs obtainedfrom one cross-rate option price and many dollar-rate option prices with thedensities that can be estimated from seven cross-rate option prices quoted by a
TABLE VI
Determinants of the Correlation Risk Premium
Coefficient Estimate Standard Error t-Ratio p-Value
a 0.1514 0.0183 8.2938 0.0000b1 0.1256 0.0205 6.1255 0.0000b2 0.0659 0.0210 3.1320 0.0017b3 0.0409 0.0004 107.3063 0.0000b4 �0.0052 0.0023 �2.2202 0.0264b5 794.9835 70.3352 11.3028 0.0000b6 0.0932 0.2484 0.3750 0.7077b7 3.6760 1.1458 3.2082 0.0013Adjusted R 2 0.0769
The regression model estimated is
with a GARCH(1, 1) specification for the residuals t . Here dt denotes the correlation difference on day t, defined as the three-month ATM implied correlation minus the realized correlation calculated from 30-minute returns. Three-month interest rates for thedollar, pound, and euro are denoted by i$,t , i£,t , i€,t respectively. it and �rt � are, respectively, the cross-rate implied volatility and thehistorical volatility proxied by the cross-rate absolute return. Jt � max(RVt � BPt , 0) is a proxy for cross-rate price jumps with RVt
and BPt being the realized variance and bipower variation of 30-minute cross-rate returns. ATM, at-the-money.
dt � a � b1dt�1 � b2dt�2 � b3(i€,t � i£,t) � b4i$,t � b5Jt � b6It � b7 ƒ rt ƒ � et

354 Taylor and Wang
Journal of Futures Markets DOI: 10.1002/fut
particular bank. These comparisons show that the cross-rate RND can be esti-mated equally well from exchange-traded and OTC dollar-rate option prices.
Finally, we offer some advice to practitioners wishing to price cross-ratecurrency options. Dollar-rate marginal RNDs can be obtained by several meth-ods and the selection of the method is probably not particularly important.Calculation of the bivariate RND of the dollar rates requires a specific copulafunction and this choice is important. The Gaussian copula is the only one-parameter copula function that is ranked highly in all of the comparisons wehave made. The dependence parameter of the Gaussian copula is a criticalnumber. The empirical analysis suggests that it is best to select this parameterwithin a risk-neutral framework; therefore, ideally practitioners should makeuse of the ATM cross-rate option price when they calculate the prices of othercross-rate options.
APPENDIX A
To simplify (4) into (5) it is necessary to simplify the function
First, let
and replace y by tz. Then dy � zdt and g(x) becomes
Second, differentiate the inner integral twice, obtaining
Consequently, h(x) simplifies to
h(x) � ��
0
z2f$(xz, z) ˛ dz.
02
0x2 ��
x
(t � x)f$(tz, z) ˛ dt � f$(xz, z).
00x
��
x
(t � x) f$(tz, z) ˛dt � ���
x
f$(tz, z) dt and
g(x) � ��
0
z2 c ��
x
(t � x)f$(tz, z) ˛ dt d ˛dz.
g(x) � ��
0�
�
0
max(y � xz, 0)f$(y, z) ˛ dy˛dz � ��
0
c ��
xz
(y � xz)f$(y, z) ˛ dy d ˛ dz
h(x) �02
0x2 c ��
0�
�
0
max(y � xz, 0)f$(y, z) ˛ dy˛dz d .

Option Prices and Risk-Neutral Densities 355
Journal of Futures Markets DOI: 10.1002/fut
APPENDIX B
The Gaussian copula is defined by
with s � ��1(u) and t � ��1(v); � is the standard normal c.d.f., and f(.�r)denotes the standard bivariate normal density with correlation r. The copuladensity is
From Kepner, Harper, and Keith (1989), Spearman’s r for this densityequals
The Gaussian copula generates a bivariate normal density if and only if themarginal densities are normal.
The Plackett copula is defined by a constant cross-product ratio:
with u as a positive parameter. Consequently, with h � u � 1,
and
The Frank, Clayton, and Gumbel copulas are all Archimedean copulas.They are defined by C(u, v) � w�1(w(u) � w(v)) for some continuous, strictlydecreasing function w from (0, 1] to [0, q) that has w(1) � 0.
For the Frank copula,
c(u,v�u) ��u(e�u � 1)e�u(u�v)
[e�u � 1 � (e�uu � 1)(e�uv � 1)]2.
C(u, v�u) � �1u
ln c1 �(e�uu � 1)(e�uv � 1)
e�u� 1d and
w(t) � �ln[(exp(� ut) � 1)�(exp(� u) � 1)], u � 0,
c(u, v ƒ u) � [(1 � h(u � v))2 � 4uhuv]�3�2u[1 � h(u � v � 2uv)].
C(u, v ƒ u) �12
h�151 � h(u � v) � [(1 � h(u � v))2 � 4uhuv]1�26
P(U � u,V � v)P(U � u,V � v)P(U � u,V � v)P(U � u,V � v)
� u
rS � (6�p) ˛arcsin(r�2).
c(u, v ƒ r) �1
21 � r2 exp e�
12(1 � r2)
[s2 � t2 � 2rst] �12
[s2 � t2]f .
C(u, v ƒ r) � �s
���
t
��
f(y, z ƒ r) ˛ dy ˛dz
356 Taylor and Wang
Journal of Futures Markets DOI: 10.1002/fut
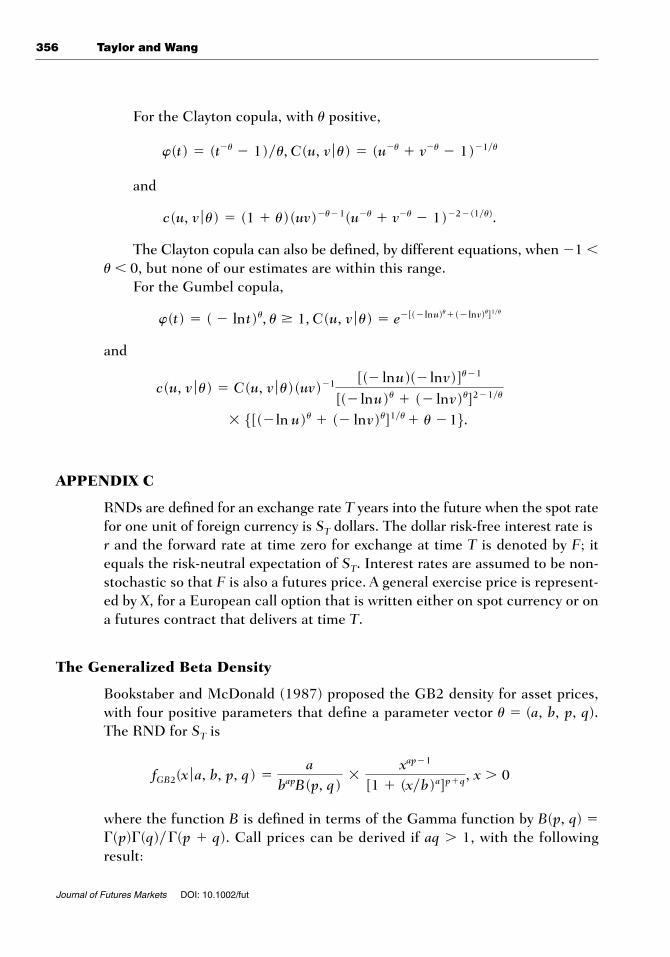
For the Clayton copula, with u positive,
and
The Clayton copula can also be defined, by different equations, when �1 u 0, but none of our estimates are within this range.
For the Gumbel copula,
and
APPENDIX C
RNDs are defined for an exchange rate T years into the future when the spot ratefor one unit of foreign currency is ST dollars. The dollar risk-free interest rate is r and the forward rate at time zero for exchange at time T is denoted by F; itequals the risk-neutral expectation of ST. Interest rates are assumed to be non-stochastic so that F is also a futures price. A general exercise price is represent-ed by X, for a European call option that is written either on spot currency or ona futures contract that delivers at time T.
The Generalized Beta Density
Bookstaber and McDonald (1987) proposed the GB2 density for asset prices,with four positive parameters that define a parameter vector u � (a, b, p, q).The RND for ST is
where the function B is defined in terms of the Gamma function by B(p, q) � (p) (q)� (p � q). Call prices can be derived if aq � 1, with the followingresult:
fGB2(x ƒ a, b, p, q) �a
bapB(p, q)�
xap�1
[1 � (x�b)a]p�q, x � 0
� 5[(�ln˛ u)u � (� ln˛v)u]1�u� u �16.c(u, v ƒ u) � C(u, v ƒ u)(uv)�1 [(� ln˛u)(� ln˛v)]u�1
[(� ln˛u)u � (� ln˛v)u]2�1�u
w(t) � ( � ln˛t)u, u � 1, C(u, v ƒ u) � e�[(� ln˛u)u� (� ln˛v)u]1�u
c(u, v ƒ u) � (1 � u)(uv)�u�1(u�u � v�u � 1)�2� (1�u).
w(t) � (t�u � 1)�u, C(u, v ƒ u) � (u�u � v�u � 1)�1�u
Option Prices and Risk-Neutral Densities 357
Journal of Futures Markets DOI: 10.1002/fut
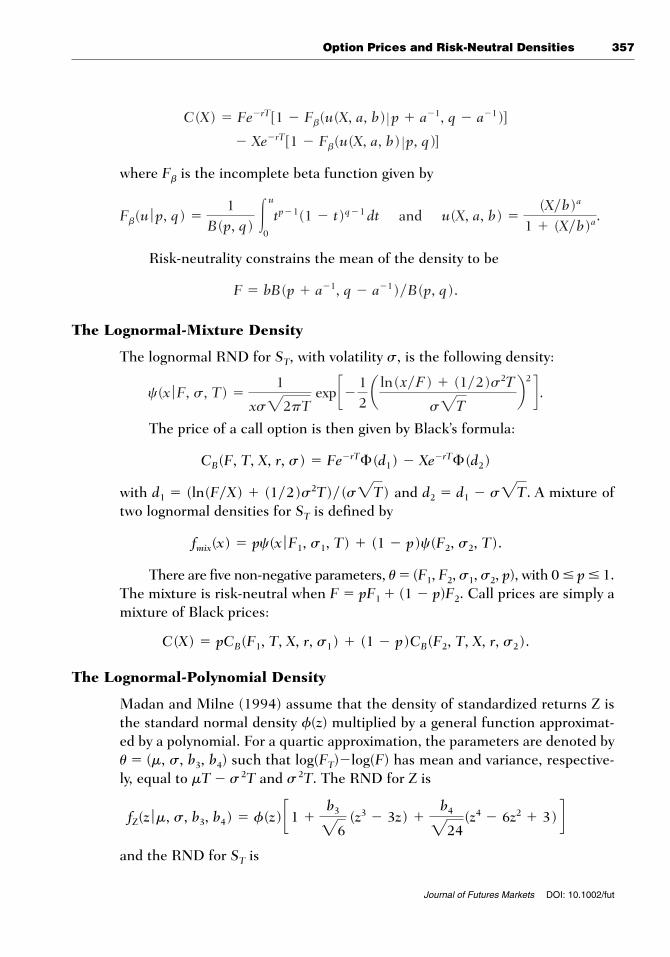
where Fb is the incomplete beta function given by
Risk-neutrality constrains the mean of the density to be
The Lognormal-Mixture Density
The lognormal RND for ST, with volatility s, is the following density:
The price of a call option is then given by Black’s formula:
with and . A mixture oftwo lognormal densities for ST is defined by
There are five non-negative parameters, u� (F1, F2,s1,s2, p), with 0 � p � 1.The mixture is risk-neutral when F � pF1 � (1 � p)F2. Call prices are simply amixture of Black prices:
The Lognormal-Polynomial Density
Madan and Milne (1994) assume that the density of standardized returns Z isthe standard normal density f(z) multiplied by a general function approximat-ed by a polynomial. For a quartic approximation, the parameters are denoted byu � (m, s, b3, b4) such that log(FT)�log(F) has mean and variance, respective-ly, equal to mT � s2T and s2T. The RND for Z is
and the RND for ST is
fZ(z ƒ m, s, b3, b4) � f(z) c1 �b3
26 (z3 � 3z) �
b4
224(z4 � 6z2 � 3) d
C(X) � pCB(F1, T, X, r, s1) � (1 � p)CB(F2, T, X, r, s2).
fmix(x) � pc(x ƒ F1, s1, T) � (1 � p)c(F2, s2, T).
d2 � d1 � s2Td1 � (ln(F�X) � (1�2)s2T)�(s2T)
CB(F, T, X, r, s) � Fe�rT£(d1) � Xe�rT£(d2)
c(x ƒ F, s, T) �1
xs22pT exp c� 1
2 a ln (x�F) � (1�2)s2T
s2Tb2 d .
F � bB(p � a�1, q � a�1)�B(p, q).
Fb(u ƒ p, q) �1
B(p, q) �u
0
tp�1(1 � t)q�1˛ dt and u(X, a, b) �
(X�b)a
1 � (X�b)a.
� Xe�rT[1 � Fb(u(X, a, b) �p, q)]
C(X) � Fe�rT[1 � Fb(u(X, a, b) � p � a�1, q � a�1)]
358 Taylor and Wang
Journal of Futures Markets DOI: 10.1002/fut
Risk-neutrality constrains the parameters to satisfy
with . The price of a call option is given by
with ,
and .
Parameter Estimation
As is common in the RND literature, we estimate the parameters by minimiz-ing the sum of squared pricing errors for a set of market call prices denoted bycm (Xi). When there are market prices available for N distinct exercise prices,having a common expiry time T, we estimate u by minimizing
BIBLIOGRAPHY
Anagnou-Basioudis, I., Bedendo, M., Hodges, S. D., & Tompkins, R. (2005). Forecastingaccuracy of implied and GARCH-based probability density functions. Review ofFutures Markets, 11, 41–66.
Andersen, T. G., Bollerslev, T., & Diebold, F. X. (2007). Roughing it up: Including jumpcomponents in the measurement, modeling and forecasting of return volatility.Review of Economics and Statistics, 89, 701–720.
Andersen, T. G., Bollerslev, T., Diebold, F. X., & Labys, P. (2001). The distribution ofrealized exchange rate volatility. Journal of the American Statistical Association,96, 42–55.
Barndorff-Nielsen, O. E., & Shephard, N. (2006). Econometrics of testing for jumps infinancial economics using bipower variation. Journal of Financial Econometrics,4, 1–30.
G(u) � aN
i�1(cm(Xi) � C(Xi ƒ u))2.
D1 � (ln (F�X) � mT � 12s
2T)�(s2T)
a4(X) � FbemT[b3£(D1) � (3b2 � 3bD1 � D21 � 1)f(D1)]�224
a3(X) � FbemT[b2£(D1) � (2b � D1)f(D1)]�26
a0(X) � FemT£(D1) � X£(D1 � s2T)
C(X) � e�rT[a0(X) � a3(X)b3 � a4(X)b4]
b � s2T
1 �b3b3
26�b4b4
224� e�mT
fLP(x ƒ m, s, b3, b4) �1
xs2T fZa ln(x) � ln(F)� mT � 0.5s2T
s2Tb.
Option Prices and Risk-Neutral Densities 359
Journal of Futures Markets DOI: 10.1002/fut
Barone-Adesi, G., & Whaley, R. E. (1987). Efficient analytic approximation ofAmerican option values. Journal of Finance, 42, 301–320.
Bartram, S. M., Taylor, S. J., & Wang, Y. (2007). The Euro and European financial mar-ket dependence. Journal of Banking & Finance, 31, 1461–1481.
Bennett, M. N., & Kennedy, J. E. (2004). Quanto pricing with copulas. Journal ofDerivatives, 12, 26–45.
Bikos, A. (2000). Bivariate FX PDFs: A sterling ERI application (working paper). Bankof England.
Bliss, R. R., & Panigirtzoglou, N. (2002). Testing the stability of implied probabilitydensity functions. Journal of Banking & Finance, 26, 381–422.
Bookstaber, R. M., & McDonald, J. B. (1987). A general distribution for describingsecurity price returns. Journal of Business, 60, 401–424.
Branger, N., & Schlag, C. (2004). Why is the index smile so steep? Review of Finance,8, 109–127.
Breeden, D. T., & Litzenberger, R. H. (1978). Prices of state-contingent claims implicitin options prices. Journal of Business, 51, 621–651.
Campa, J. M., Chang, P. H., & Reider, R. L. (1998). Implied exchange rate distribu-tions: Evidence from OTC option markets. Journal of International Money andFinance, 17, 117–160.
Cherubini, U., & Luciano, E. (2002). Bivariate option pricing with copulas. AppliedMathematical Finance, 9, 69–86.
Cherubini, U., Luciano, E., & Vecchiato, W. (2004). Copula methods in finance.England: John Wiley & Sons.
Driessen, J. J. A. G., Maenhout, P., & Vilkov, G. (2009). The price of correlation risk:Evidence from equity options. Journal of Finance, 64, 1377–1406.
Hennessy, D. A., & Lapan, H. (2002). The use of Archimedean copulas to model port-folio allocations. Mathematical Finance, 12, 143–154.
Jackwerth, J. C., & Rubinstein, M. (1996). Recovering probability distributions fromoption prices. Journal of Finance, 51, 1611–1631.
Joe, H. (1997). Multivariate models and dependence concepts. London: Chapman &Hall.
Jondeau, E., & Rockinger, M. (2000). Reading the smile: The message conveyed bymethods which infer risk neutral densities. Journal of International Money andFinance, 19, 885–915.
Jorion, P. (1995). Predicting volatility in the foreign exchange market. Journal ofFinance, 50, 507–528.
Kepner, J. L., Harper, J. D., & Keith, S. Z. (1989). A note on evaluating a certainorthant probability. The American Statistician, 43, 48–49.
Li, D. X. (2000). On default correlation: A copula function approach. Journal of FixedIncome, 9, 43–54.
Liu, X., Shackleton, M. B., Taylor, S. J., & Xu, X. (2007). Closed-form transformationsfrom risk-neutral to real-world distributions. Journal of Banking & Finance, 31,1501–1520.
Madan, D. B., & Milne, F. (1994). Contingent claims valued and hedged by pricing andinvesting in a basis. Mathematical Finance, 4, 223–245.
Malz, A. M. (1996). Using option prices to estimate realignment probabilities in theEuropean monetary system: The case of sterling-mark. Journal of InternationalMoney and Finance, 15, 717–748.
360 Taylor and Wang
Journal of Futures Markets DOI: 10.1002/fut
Malz, A. M. (1997). Estimating the probability distribution of the future exchange ratefrom option prices. Journal of Derivatives, 5, 18–36.
Melick, W. R., & Thomas, C. P. (1997). Recovering an asset’s implied PDF from optionprices: An application to crude oil during the Gulf crisis. Journal of Financial andQuantitative Analysis, 32, 91–115.
Nelsen, R. B. (1999). An introduction to copulas. New York: Springer.Pong, S., Shackleton, M. B., Taylor, S. J., & Xu, X. (2004). Forecasting currency volatili-
ty: A comparison of implied volatilities and AR(FI)MA models. Journal of Banking &Finance, 28, 2541–2563.
Ritchey, R. J. (1990). Call option valuation for discrete normal mixtures. Journal ofFinancial Research, 13, 285–296.
Rosenberg, J. V. (2003). Non-parametric pricing of multivariate contingent claims.Journal of Derivatives, 10, 9–26.
Söderlind, P., & Svensson, L. E. O. (1997). New techniques to extract market expecta-tions from financial instruments. Journal of Monetary Economics, 40, 383–429.
Taylor, S. J. (2005). Asset price dynamics, volatility, and prediction. Princeton, NJ:Princeton University Press.
Xu, X., & Taylor, S. J. (1994). The term structure of volatility implied by foreignexchange options. Journal of Financial and Quantitative Analysis, 29, 57–74.