Embed Size (px)
Citation preview

Optimizing Stroke Recovery:Insights from Basic Science
Dr. Dale Corbett PhDProfessor of Neurosciences
University of OttawaOttawa, ON CANADA
Scientific Director & CEOCanadian Partnership for Stroke Recovery
Stroke Recovery WorkshopUniversity of Northern Arizona, Phoenix USA , April 22th 2017
1

Overview
2
Learning Objectives:
1. An understanding of the biological recovery processes contributingto spontaneous and rehabilitation-induced post-stroke recovery
2. A better appreciation of how the timing and intensity of rehabilitationaffect recovery
3. Some insights into why recovery plateaus after several months and what might be done to prevent this from occurring

Stroke is a Disease of Chronic Disability
• ~62,000 strokes per year in Canada • At least 405K Canadians living with consequences of
stroke1
• Incidence of stroke expected to increase by 80% by 2038 (i.e. 650-725K)1
• Nearly 50% have chronic disabilities at 6 mo2
• Many patients after making initial functional gains show progressive decline over time
1 Krueger et al, Stroke, 20152 Teasell et al Exper Rev Neurother, 2014

Treating Upper Limb Dysfunction
Ploughman & Corbett, Arch Phys Med Rehabil, 2004

Is the Rat a Suitable Model for Studying Upper Limb Recovery?

Rat Model of Upper Limb Recovery

MCA
MCA
MCA = Middle Cerebral Artery
ET-1 Stroke Model

Staircase Reaching Test

Brain Plasticity Offers New Hope
• Historically thought that brain damage was irreversible, little hope for significant recovery
• This pessimistic view is changing due to discoveries in Neuroscience concerning neuroplasticity
• Neuroplasticity: Adaptive changes in response to injury and experience (e.g. sprouting of new connections, neurogenesis, angiogenesis)
• Harnessing neuroplasticity to dramatically improve stroke recovery is the new frontier in stroke research

Environmental Enrichment
Enrichment increases – Growth factors, dendritic growth, synaptogenesis, neurogenesis, angiogenesis & cortical thickness

Enriched Housing + Daily Reach Training = Enriched Rehab (ER)
Stroke
14d Post 29 weeks
Start Rehabilitation
BehaviouralAssessment
Post 14 weeks

Structural Remodeling of Layer V Motor Neurons
Biernaskie & Corbett J. Neurosci., 2001

Rehab DayTrough
FillPaw Availability
Trough
Height
Trough Distance
(away from wall)
1-3 Full Both 4 cm 0 mm
4-5 Full Both 4 cm 0 mm
6-7 Half Impaired Only 4 cm 0 mm
8-12 Half Impaired Only 13 cm 0 mm
13-16 Half Impaired Only 5 cm 3.2 mm
17-20 Half Impaired Only 5 cm 6.4 mm


The Critical Period for Stroke Recovery
Murphy & Corbett, Nat Neurosci Rev, 2009

Inactive & Alone
• In first few weeks after stroke people are alone ~60% of the time
• During waking hours they were inactive~ 75% of the time (resting in bed or sitting)
•* Lack of stimulation, exercise & socialization is striking
Bernhardt et al., Stroke, 2004

Does Amount of Rehab Affect Recovery?
5 stroke groups given different amounts of post-stroke reaching practice
Light STD
Light ER
Dark STD
Dark ER Limited
n = 7
n = 8 n = 8
n = 7
Dark ER Unlimited
n = 9
Crystal MacLellan, PT, PhD
STD = standard social housing
ER= Enriched rehab

Enriched Rehabilitation
Rats housed in EE & have access to reachtraining apparatus 4 hr/day, 5 days per week

Cylinder Test Montoya Staircase Test

Intensity of Rehabilitation Matters!
MacLellan et al. Neurorehab & Neural Repair, 2011

Increases in BDNF Levels Mirror Recovery Recovery

Reaching Dose Response
22

Rethinking Recovery Plateaus
• Birkenmeier, 2010 (NNR) reported that the average number of upper limb repetitions per therapy session in human studies is ~ 32, in animal studies often > 300
• “Animal doses” of reach training can be delivered to stroke patients in 1 hour therapy sessions
• The use of much more intensive rehabilitation therapies for stroke patients is strongly supported.

24

Reaching Quality
25

Kinematics of Reaching
26

Does Rehab Matter?
• Failure to see improved outcomes in recent ICARE RCT increased dose rehab study (Winstein et al, JAMA 2016) where additional rehab on top of usual practice failed to improve outcome
• Krakauer, Byblow and Kwakkel argue that level of recovery is mainly determined by spontaneous biological processes within the first weeks after stroke irrespective of rehab
• Recovery patterns seem to follow a 70% “proportionality rule”

Proportional Recovery Model for the Upper Extremity
28
• “At 3 months, patients should get ~70% of their maximum potential recovery back”4
∆FMA-UEpred = .7(66 − FMA- UEinitial))
• Holds true for all ages, both genders and in countries with different rehab services
• Fails in a subset of patients with severe hemiparesis (FM<20)
Winter et al. 2015
Krakauer and Marshall, 20154

• Does the human proportional recovery rule and its biomarkers also apply to animal models? (construct validity)
• Can these biomarkers be used to create a predictive model of post-stroke recovery and does rehabilitation modulate this model? (treatment efficacy)
• Can manipulation of recovery biomarkers influence recovery as predicted by the model? (model validity)
• Can we use biomarkers of recovery to accurately prescribe individualized intensities that will generate significant recovery of function? (personalized medicine)

Dataset Composition
Data for experiments within the Corbett lab that met the following criteria were collated into a single master dataset:
• Subjects – male, Sprague-Dawley rats, N=672
• Focal ischemia – unilateral intracerebral endothelin-1 (ET-1)
• Functional assessment – staircase or single-pellet
• Assessment timeline – minimum of 3 measurements: pre-stroke, within 1 week post-stroke & final assessment no earlier than 3 weeks post-stroke
• Impairment – post-stroke performance outside of the 95% confidence interval of pre-stroke performance (final N=593)

Evidence for a Cross Species Biological Stroke Recovery Process
31

Rehab Matters for Severe Impairment
32

Can we use biomarkers of recovery to accurately prescribe individualized intensities that will generate significant recovery of function? (personalized medicine)

How does our rehabilitation prescription relate to the original classification of fitters, non-fitters and decliners?
• Animals originally predicted to fit the proportional recovery rule always recover• These subjects may recover even
without rehabilitation
• Non-fitters had the potential to either recover if they met their prescription or not recover if they failed to achieve it• Intensive therapy is most critical for
this group
• Decliners never met their rehabilitation prescription and also never recovered

• Does the human proportional recovery rule and its biomarkers also apply to animal models? (construct validity)• Yes, a subset of animals (30%) show a recovery pattern that is not statistically different
from that seen in humans
• Can these biomarkers be used to create a predictive model of post-stroke recovery and does rehabilitation modulate this model? (treatment efficacy)• Yes, initial impairment, infarct volume and rehabilitation intensity can be used to predict
recovery of any animal that receives rehabilitation
• Manipulating these factors influences recovery in the direction predicted by the model
• Can we use biomarkers of recovery to accurately prescribe individualized intensities of rehabilitation that will generate significant recovery of function? (personalized medicine)• Yes, it is possible to individually prescribe rehabilitation based on desired level of
recovery, initial impairment and infarct volume
• This prescription is accurate in ~75-80% of subjects
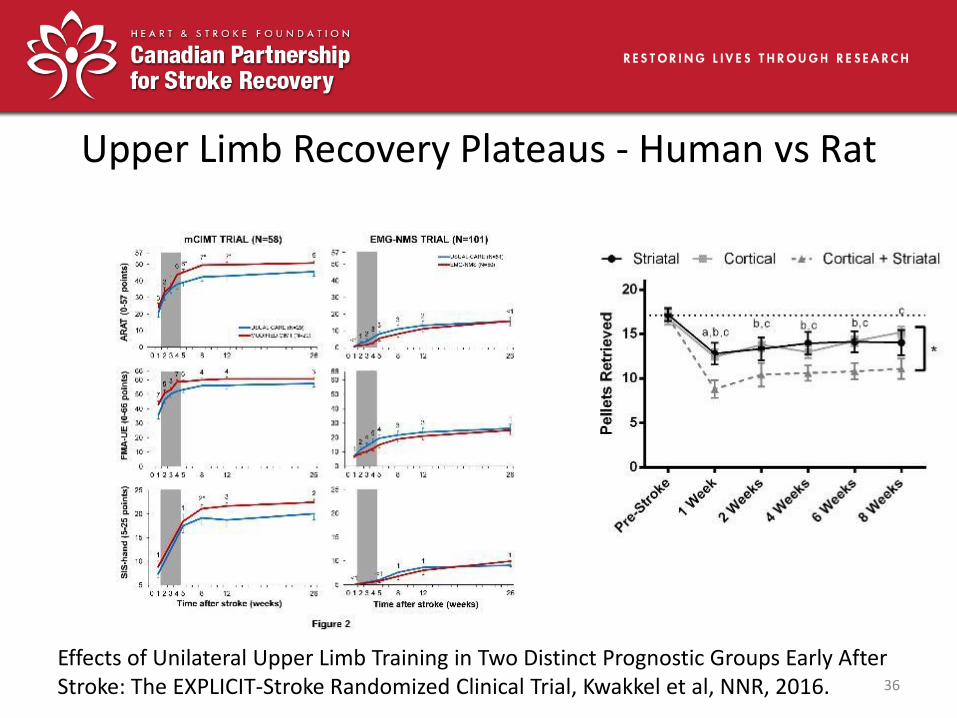
Upper Limb Recovery Plateaus - Human vs Rat
36
Effects of Unilateral Upper Limb Training in Two Distinct Prognostic Groups Early After Stroke: The EXPLICIT-Stroke Randomized Clinical Trial, Kwakkel et al, NNR, 2016.

Murphy & Corbett, Nat Rev Neurosci 2009
Why Does Recovery Stall?
37
Stroke Injury & Gene Changes
BDNF, Gap-43 and c-Jun
CSPG’s and NOGO

Critical Period PlasticityPlasticity appears to be gated by networks of PV+
neurons
Perineuronal nets (PNNs) are condensed ECM structures associated with mature PV+ neurons
Image credit: Jessy Livingston-Thomas
Hensch 2014. Cell.

Perineuronal Nets (PNNs)
Extracellular matrix structures
Wrap around the soma and proximal dendrites
Critical for synaptic stabilization
Limits plasticity and counteracts regeneration
Disruption of PNNs can reactivate plasticity
Kwok et al., 2011
39
Red = PV+ interneuronGreen = PNN
Image credit: Jessy Livingston-Thomas and Matthew Jeffers

PNNs and StrokeDisruption of PNNs in the ischemic core, the peri-infarct region and
in more distal areas following stroke5,6
– Peri-infarct area = PNNs start to recover by ~30 days
– Areas remote from infarct core = PNNs restored as early as 1 week post stroke6
5 Carmichael et al., 2005 , 6 Karetko-Sysa et al., 2011 40

RESULTS
PNN density in the Perilesional Area
n= 3/group
Stri
atal
+ C
ort
ical
gro
up
41

Fluoxetine for Stroke Recovery• The FLAME trial suggests that FLX may promote motor
recovery after stroke, independent of its antidepressant action
• Fluoxetine (FLX) reopens critical periods in adult animals and reduces the expression of PV and PNNs
Chollet et al. 2011. Lancet Neurol.Ohira et al. 2013. Mol Brain.

Summary & Conclusions
• Rehabilitation should be stimulating, early (but not too early as in AVERT) and intensive but this is NOT enough…
• Combination therapies (e.g. enrichment, exercise, drugs, etc.) targeting multiple growth promoting mechanisms need to be used to create a “permissive”, regenerative state
• This may need to be combined with interventions to "switch off" inhibitory processes that act as "brakes" on the recovery process
• Recovery can be predicted based on knowledge of initial impairment, infarct volume and intensity of rehab
• More effective rehabilitation will only result from a better understanding of the biological processes of recovery 43

Trainees:
• Dr. Jessy Livingston-Thomas (post-doc)
• Dr. Matthew McDonald (post-doc)
• Clarissa Pedrini-Schuch (post-doc, Brazil)
• Mariana Gomez-Smith (PhD)
• Nicolay Hristozov (PhD)
• Gustavo Balbinot (PhD, joint program Brazil)
• Sabina Antonescu (MSc)
• Sudhir Karthikeyan (MSc)
• Gillian Lehay (BSc honours)
• Therese Gagnon (BSc honours)
• Sarah Gasinzigwa (BSc honours)
Staff:
• Matthew Jeffers (laboratory manager)
• Anthony Carter (research technician)

Recovery from stroke: Can we predict who will respond?
Lara Boyd, PT, PhDProfessor & Canada Research Chair

No Conflicts of Interest pertaining to the data in this presentation

The Problem: Stroke
(Edwards, Kohern, Levy & Boyd, 2010)
Leading cause of adult, long-term disability in the world
Between 1998 and 2005 population-based quality of life showed a clinically meaningful decline among Canadians with stroke (related to decreased cognition and motor function)

The Problem: Stroke
Variability in outcome AND in response to interventions make it hard to predict:
– Trajectories of recovery
– The best intervention for each individual
Goal: Develop biomarkers to predict response to treatment and potential for recovery

Neuroplasticity
All learning of new facts and skills as well as re-learning to support recovery from brain damage is represented neurologically by plasticity or structural change in the brain
Brain plasticity supports all learning
Neuroplasticity is activity dependent
Brain plasticity after neurological insults contributes to recovery
Specific interventions can facilitate positive plasticity throughout life
What limits and what facilitates neuroplasticity?

Objectives:
I. Discuss potential for neuroplastic change after stroke.
II. Which interventions prime the brain for learning and facilitate recovery from stroke?
III. Which biomarkers may be used to indicate capacity for motor learning?

I. Discuss potential for neuroplastic change after stroke.

Neuroplastic Change Associated with Motor Learning
Neuroplastic change in humans is largely shown by changes in function activity in the cortical grey regions of the brain

Change in Cortical Activity Supports Motor Learning
(Meehan & Boyd, 2011)
Prefrontal Cortex Premotor Cortex

0
0.2
0.4
0.6
0.8
1
1.2
1.4
Repeat Random
PredictorWeights
Healthy
Stroke
A
Unique Patterns of Brain Activity Support Motor Learning after Stroke
(Wadden, Woodward & Boyd, 2015)
CPCA extracts functionally connected networks – here those associated with implicit motor sequence learning

Unique Networks of activity after Stroke support motor learning
Each individual with stroke employed a relatively unique network to support motor learning
Different networks noted despite a relatively homogenous group
S05
S06
S07
S08
9 right-handed individuals with chronic, right sided lesions in the basal ganglia
(Wadden, Woodward & Boyd, 2015)

Neuroplastic Change Associated with Motor Learning
Understanding of the impact of changes in white matter structures in the brain is rapidly evolving

White matter is disrupted by stroke, and associated with motor function and
learning
(Borich, Mang & Boyd, 2012; Borich, Brown & Boyd, 2013; Mang, Borich & Boyd, 2015)
Motor Learning

Myelin Water Imaging is a Validated marker of Myelin Content in vivo
(Laule et al., 2006, 2011)

Myelin is reduced after Stroke
(Borich, MacKay, Rauscher, Vavasour & Boyd, 2013)
Myelin water fraction maps from whole-cerebrum multicomponent T2 relaxation imaging
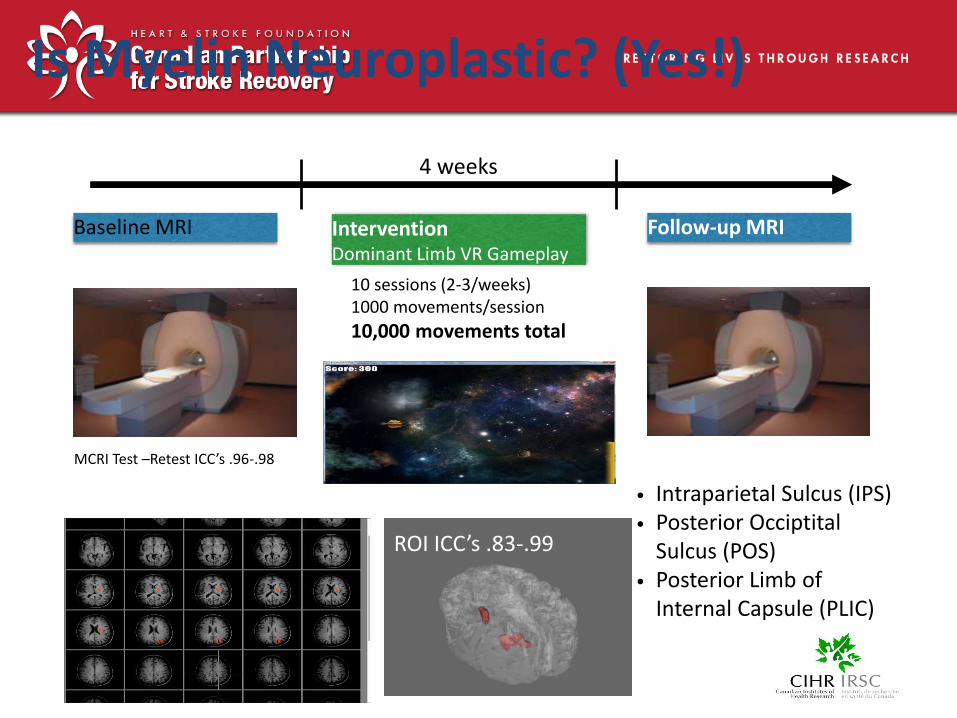
Baseline MRI Follow-up MRIInterventionDominant Limb VR Gameplay
10 sessions (2-3/weeks)1000 movements/session
10,000 movements total
4 weeks
• Intraparietal Sulcus (IPS)• Posterior Occiptital
Sulcus (POS)• Posterior Limb of
Internal Capsule (PLIC)
ROI ICC’s .83-.99
MCRI Test –Retest ICC’s .96-.98
Is Myelin Neuroplastic? (Yes!)

TrAIT

Skilled Motor Practice Increases Myelin in the Healthy Human Brain
(Lakhani, Peters, Borich, Jackson, Vavasour, Rauscher, MacKay & Boyd, 2016)

Increased Myelin is associated with Motor Learning
Inverse relationship between LIPS MWF and rate of learning
Longer time to asymptote = more myelin change
(Lakhani, Peters, Borich, Jackson, Vavasour, Rauscher, MacKay & Boyd, 2016)

Myelin plasticity
(Fields 2015; Sampiao-Baptista 2013; Makenzie 2014)

Functional and structural change occur in parallel
Pre-post analysis of resting state fMRI reveals that a network including intraparietal sulcus activity and middle frontal gyrus
• IPS: Visual motor integration – there may be something special about L IPS
• MFG: Motor planning
(Lakhani, Villamayor, Rubino & Boyd, in preparation)

Recovery from stroke is most often incomplete• Severity of long-term motor impairments after stroke
varies• Hard to predict outcome • Difficult to prescribe the most effective
interventions for individual patients • Most trial outcomes are negative or inconclusive
• Factors that may contribute to variable outcomes include:• age at stroke onset, stroke severity, lesion size and
location; • In combination these factors explain only 20% of
the variance in functional recovery after stroke
Despite these neuroplastic changes
(Mang et al., 2014)

One limit to recovery is underestimation of lesion load: covert
lesions impact outcomes
(Auriat et al., in review)

One limit to recovery is underestimation of lesion load: covert
lesions impact outcomes
(Auriat et al., in review)

The Dose Problem
What kind of practice changes the brain and promotes positive neuroplastic change?
9,600 retrievals over 4 weeks (Nudo et al., 1996)
10,000 repetitions of skilled movement (myelin; Borich, et al 2013; Lakhani et al., 2014)
31,500 repetitions of a finger sequence over 35 days (Karni et al., 1995)

Objectives:
II. Which interventions prime the brain for learning and facilitate recovery from stroke?
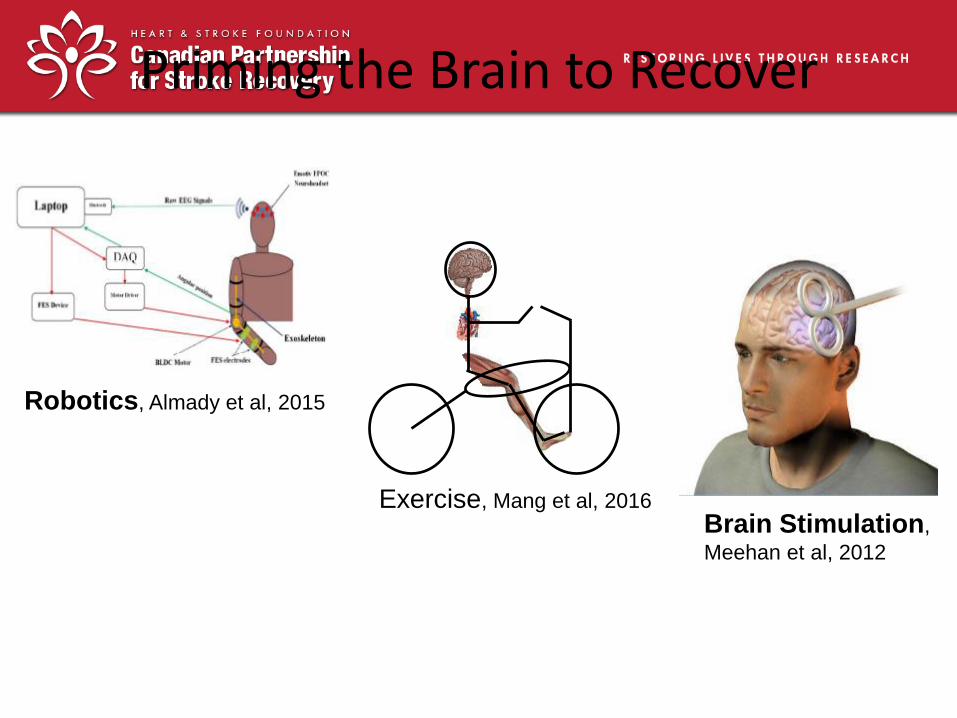
Priming the Brain to Recover
Robotics, Almady et al, 2015
Exercise, Mang et al, 2016Brain Stimulation,
Meehan et al, 2012

Paired associative stimulation – 21 ms ISI
• Median nerve stimulation
• TMS at intensity that evokes 1 mV response
• 450 stimuli
• Pairing the two stimuli is thought to induce a form
of spike dependent timing plasticity
Transcranial magnetic stimulation (TMS)
• Resting motor threshold (RMT) 5 out of 10 at 50
µV
• Recruitment curves – 90-150%RMT, 10%
increments
Paired Associative Stimulation
to Assess Long Term
Potentiation-Like Synaptic
Plasticity

Long-term potentiation-Like plasticityPAS-21 following a period of rest and following high intensity exercise
Mang et al, Journal of Applied Physiology, 2014

Cerebellar Inhibition mapped
with TMS
Mang et al, Neural Plasticity, 2014 Dashed line – M1 TMSSolid Line – Cerebellar TMS + M1 (CBI)

A single bout of high intensity exercise facilitates cerebellar
inhibition and enhances motor cortical excitability

Can we exploit this knowledge to change behaviour and learning?
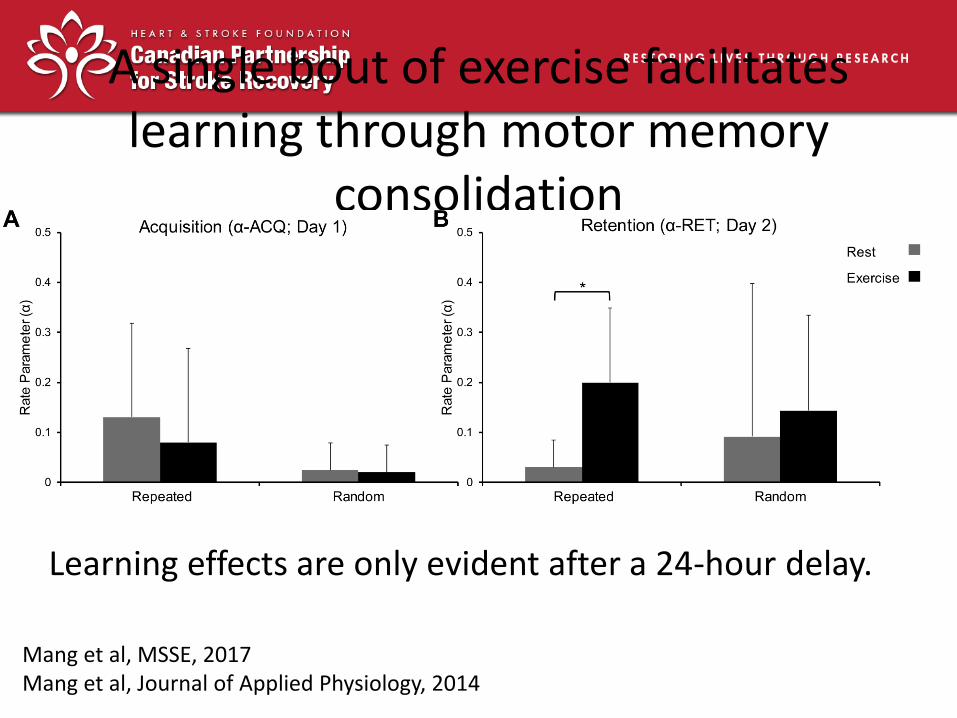
A single bout of exercise facilitates learning through motor memory
consolidation
Learning effects are only evident after a 24-hour delay.
Mang et al, MSSE, 2017Mang et al, Journal of Applied Physiology, 2014

We are now considering if this approach to priming plasticity may be an effective tool
to improve the effects of rehabilitation after stroke
Mang et al. (2013) Phys Ther: 93 (12) 1707-16.Boyd (PI) CIHR Project Grant 2016-2022Boyd (PI) Donation 2015-2022

Using rTMS to stimulate motor learning after stroke

5 Hz rTMS over ipsilesional
sensory cortex paired with
practice facilitates motor
learning
(Brodie, Meehan, Borich, Cheung, & Boyd, 2014)
1.6
1.7
1.8
1.9
2
2.1
2.2
2.3
2.4
Baseline D2 D3 D4 D5 D6 Retention
Resp
on
se T
ime (
sec)
Active
Sham
*p = 0.008

High degree of variability in response
(Brodie, Meehan, Borich, Cheung, & Boyd, 2014)
Sham rTMS5 Hz rTMS

White matter volume
Grey matter volume
Is the effectiveness of 5Hz rTMS related to structural integrity?
Pre & Postcentral gyri to Cortex ratio= (Segmented Gyral volume) / (Total cortical volume)
(Brodie, Borich & Boyd, 2014)

(r=-0.235, p=0.514)
(r=-0.525, p=0.120)
(r=-0.728, p=0.017*)
(r=-0.305, p=0.392)
(A) Grey Matter
(B) White Matter
Sensory Cortex White Matter Volume is related to response to 5 Hz rTMS + practice
(Brodie, Borich & Boyd, 2014)

Objectives:
III. Which biomarkers may be used to indicate capacity for motor learning?

First Stroke Recoveryand Rehabilitation Roundtable
Lara Boyd, ChairNick Ward, Co-Chair
BIOMARKER “Stroke recovery biomarkers are indicators of disease state that can be used clinically to reflect underlying molecular/cellular events and/or predict outcome associated with recovery from stroke. These may include markers of biology (blood, genetics), imaging (structural, functional, chemical), neurophysiology (patterns of brain excitability or electrical activity), or combinations of such.”
Bernhardt et al, International Journal of Stroke, 2016

Integrity of the Corticospinal tract key for recovery
CST integrity can be mapped with MRI, TMS or clinical tests
Stinear et al, 2012, 2014, 2017

PREP Algorithm
Stinear et al, 2012, 2014, 2017

What is the impact of severity on these processes?
We know very little about (partial) recovery from severe stroke (UE FM <30)
(Hayward et al, 2016)

Different processes are at play after severe stroke
Severe Arm Impairment (n=15, chronic):• Regression showed that after severe
stroke age and ipsilesional transcallosal inhibition combined to explain 59% of variability in WMFT rate
• FA from prefrontal corpus callosum (region 1) alone explained 49% of variance
Mild-moderate arm impairment (n=14)• No significant relationship with these
variables(Hayward et al, 2016, in review)

Different processes are at play after severe stroke
(Hayward et al, 2016, in review)
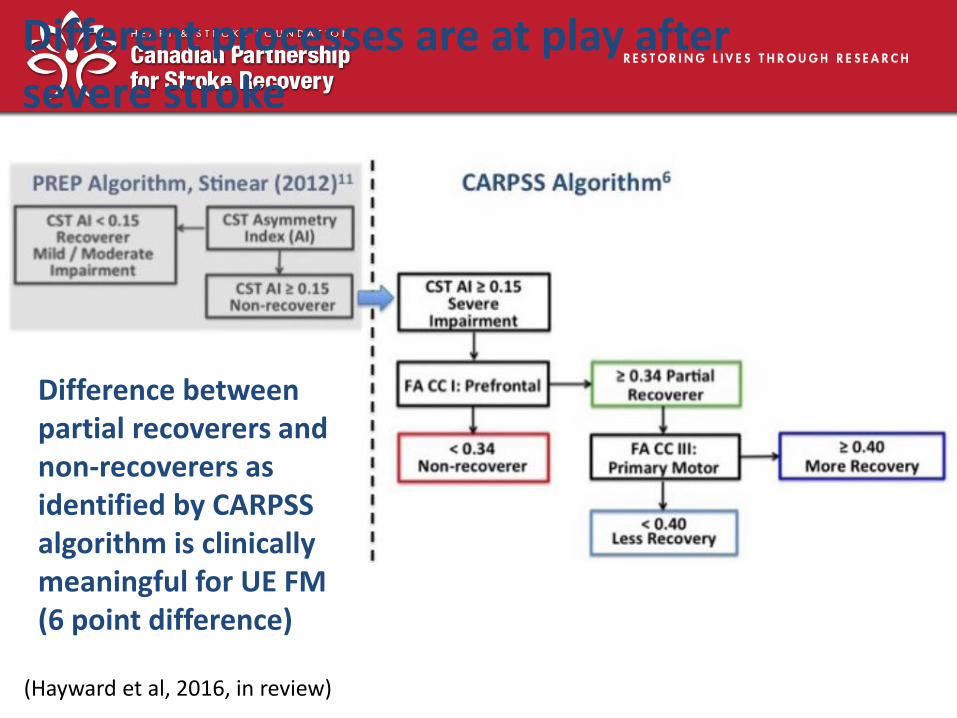
Different processes are at play after severe stroke
(Hayward et al, 2016, in review)
Difference between partial recoverers and non-recoverers as identified by CARPSS algorithm is clinically meaningful for UE FM (6 point difference)

Importance of individuality in determining Responder status
If we consider group means … “we might have an explanation for an ‘average’ subject, but it is an explanation that does not apply to any of the actual individuals making up the average.”
Averaging may preclude the discovery of important properties that help to explain why one individual responds and another does not.
(Brown and Heathcote, 2003; Wadden et al., 2016)

Crucial Question
Acute need to determine what characteristics define a responder to any given intervention
Need to move toward more personalized biomarker informed interventions
Other key considerations– Genetics
– Neurophysiological profile (interhemispheric excitability profiles)
– Motivation
– Cognition

MS
Jennifer Ferris, MSc
Kathryn Hayward, PT, PhD
Eric Vidoni,PT, PhD
Bimal Lakhani, PhD
Angela Aruiat, PhD
Jason Neva, PhD
Nick Snow, MSc
Sonia Brodie, MSc
Michael Borich, PT, PhD
Katlyn Brown, MSc
Sue Peters, PT, MSc
0
0.2
0.4
0.6
0.8
1
1.2
1.4
Repeat Random
PredictorWeights
Healthy
Stroke
A
Katie Wadden, MS
Jodi Edwards, PhD
Sean Meehan, PhD
Cameron Mang, PhD
Anica Villamayor