Embed Size (px)
Citation preview

Baltic J. Modern Computing, Vol. 4 (2016), No. 3, 496-507
Optimization of University Campus
Wireless Network
Edgars ŠIFERS, Anita JANSONE, Kaspars LAURIS
Faculty of Science and Engineering, Liepaja University, Lielā iela 14, Liepāja LV-3401, Latvia
[email protected], [email protected],
Abstract. In this publication one particular wireless network of a university campus is analyzed
after its main role has changed from secondary to primary network. Predicting that network client
user count will increase dramatically a network auditing process is done to understand the existing
and potential problems in the network including security and other risks. After the auditing process
specific measures are made to reach the most optimal operation of the wireless network -
organizational arrangements, wireless access point displacement and configuration changes,
security arrangements, etc.
Keywords: wireless network, wireless network auditing process, wireless network security
arrangements
1. Introduction
The network described in the paper is located at a university campus. The campus is
divided in two separate buildings. Capacity of building A is 300 people, capacity of
building B is 500 people. The campus is managed by city municipality. University
provides wired internet connection in every room in the campus. The internet can be
used only by students who has authentication provided by the university. In summer the
campus is used as a hotel for city guests. For that reason city municipality creates a free
wireless network in the campus as an alternative network for students and city guests.
To sum up, there are two networks in the campus. Primary network – wired network
which is provided by university and secondary network – wireless network which is
provided by city municipality. In this configuration both networks are operating suitably.
PC users are using the wired network, but mobile device users are using the wireless
network, so the usage between both networks is balanced. But this situation changes
when university announces that it cannot provide the wired network anymore. It means
that secondary (wireless) network becomes the primary network. Initially this network
was not purposed for so many users. After analyzing the situation, it is clear that the
wireless network needs reorganization to meet every campus inhabitant’s needs.
The wireless network is based on corporative solutions from “*Hewlett-Packard*”
(HP) and “*Cisco*”. “*HP ProCurve MSM765zl Mobility Controller*” and “*Cisco
2504 Wireless Controller*” are managing “*HP ProCurve MSM430*” and “*Cisco
AIR-CAP3602I-E-K9*” wireless access points which are located in the campus
Optimization of University Campus Wireless Network 497
buildings. Wireless access pints are connected to “*HP ProCurve 2910AL-24G-PoE+*”
managed network switches.
2. Audit of the network
To identify potential and existing problems in the wireless network a network auditing
process is done. There are the following methods used in the auditing process: analyzing
of device configuration, physical device inspection, wireless network signal
measurements, download and upload measurements and predictions of problems.
The following conclusions was made after the auditing process:
1. lack of information for inhabitants,
2. lack of uninterruptible power supply,
3. usage of third party network infrastructure,
4. insufficient wireless network coverage,
5. incorrect wireless channel allocation,
6. third party wireless networks,
7. ineffective dual radio standard selection,
8. traffic created by computer viruses,
9. other imperfections.
2.1. Lack of information for inhabitants
During the auditing process it has been noticed that many problem situations do not
reach appropriate people who can help. Most of these situations are because the
problems do not seem too important to users or users are ashamed of reporting them. But
there are situations when users just do not know where to report their problems.
Actually, it was already a well known fact. Earlier there was no need to provide IT
support for the network because it was not used so intensively. First conclusion is that
campus inhabitants do not know where to report their problems about, therefore city
municipality’s IT helpdesk do not know about these problems.
2.2. Lack of uninterruptible power supply
After inspecting every network commutation points it has been noticed that only the
main network switch has backup power using uninterrupted power supply (UPS). Even 1
second long power outage can disable network devices for about 1 to 2 minutes because
of the reboot time. So every power outage can paralyze parts of the network for about 1
to 2 minutes.
Lack of backup power should be resolved because power outages in the city are very
often. Statistics about power outages in the city can be seen in Fig. 1. and Fig. 2. Total
summed duration of power outages is 10 minutes and 8 seconds. It is noticeable that
power outage count in the last years have been decreased. It can be explained because
JSC “Augstsprieguma tīkls” has finished their new power line project called “Kurzemes
loks” (WEB, a)

498 Šifers et al.
Fig. 1. Power outage count by year
Fig. 2. Power outage count by duration
2.3. Usage of third party network infrastructure
When the wireless network of the campus was created, many connections between
network switches was created through university’s switches using virtual local area
networks (VLAN). It made the process much quicker and cheaper because there was no
need to install new network cables between the new switches. But using third party
infrastructure has its disadvantages. For example, no monitoring can be used to identify
problems in the “missing links” – university’s infrastructure.
2.4. Insufficient wireless network coverage
To verify that coverage of the wireless network is sufficient in every campus room,
measurements were taken. Measurements are taken in both 2.4 GHz and 5 GHz bands.
Measurements were taken using two devices: a laptop (Microsoft Windows) and a tablet
PC (Android). The software used: “Inssider” and “Inssider for Android”. The bottom
line of signal-to-noise ratio (SNR) was defined at 25 dB, which is equivalent to, for
0
20
40
60
80
100
Year 2013 Year 2014 Year 2015
99
41
22
Co
un
t Power outage count by year
0
50
100
1 sec 2 secs 3 secs 4 secs 5 secs 5-10
secs
10-15
secs
>15
secs
18
93
15 16 5 2 1
14 Co
un
t
Power outage count by duration
Optimization of University Campus Wireless Network 499
example, -65 dBm signal strength to -90 dBm noise. SNR is defined at 25 dB because at
this level the signal is strong enough to ensure stable operation of the wireless network
in client devices. Summary of the measurements reveals that in many rooms of the
campus defined SNR of 25 dB is not reached.
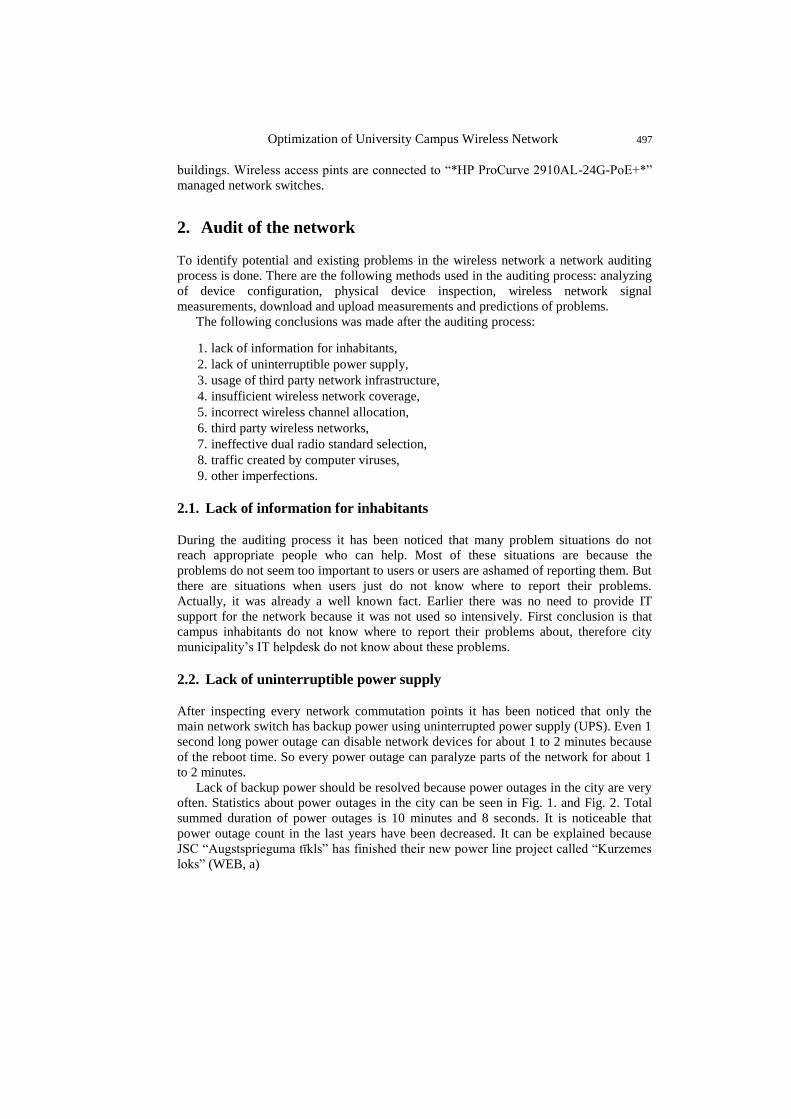
2.5. Incorrect wireless channel allocation
During the auditing process usage of wireless channels is analyzed. The analysis reveals
that many municipality’s wireless access points are operating in the same wireless
channel. It can be a normal situation in such dense wireless networks. But adjacent
wireless access points should never operate in the same wireless channel. Wireless
network controllers are configured to allocate the best wireless channel to be used by
every wireless access point but it seems that this automatic allocation of channels is not
working well. Situation in one of the campus floors can be seen in Fig. 3.
Fig. 3. Channel usage of wireless networks. “Inssider” software
One other potential problem is revealed. Some wireless access points are operating in
channel 13. It is nothing critical but there can be devices that does not support wireless
channels other than channel 1, 6 and 11 (WEB, b).
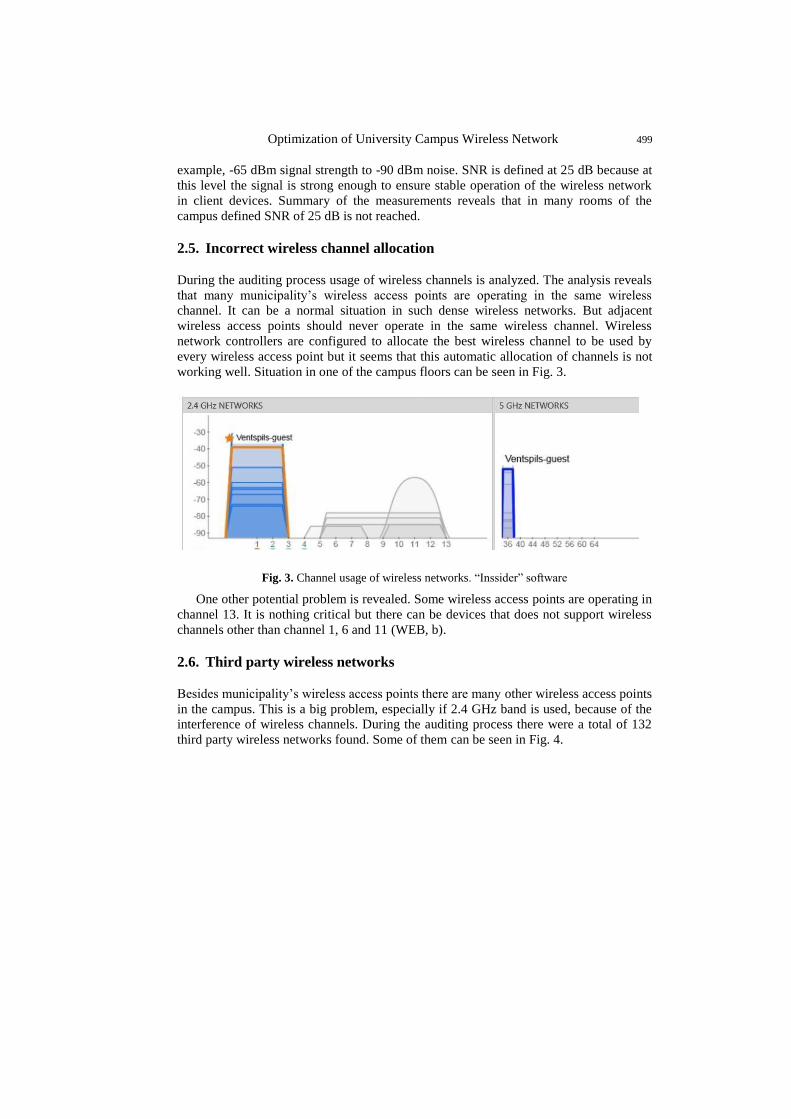
2.6. Third party wireless networks
Besides municipality’s wireless access points there are many other wireless access points
in the campus. This is a big problem, especially if 2.4 GHz band is used, because of the
interference of wireless channels. During the auditing process there were a total of 132
third party wireless networks found. Some of them can be seen in Fig. 4.

500 Šifers et al.
Fig. 4. Wireless networks in 2.4 GHz band. “Inssider” software
2.7. Ineffective dual radio standard selection
Every municipality’s wireless access point in the campus is operating in dual band mode.
It means that under the same service set identifier (SSID) both 2.4 GHz and 5 GHz
wireless standards are operating. 5 GHz band standards are better because of the non-
interfering channel count and better data transfer speeds, but the 5 GHz band signal
usually do not travel as far as 2.4 GHz band signal. So the 2.4 GHz band signal is
usually stronger. Because of this reason many wireless client devices are not using the 5
GHz band wireless standards but 2.4 GHz band wireless standards instead. Author has
seen some situations when wireless client devices cannot even connect to dual band
wireless access points.
2.8. Traffic created by computer viruses
Significant portion of all network traffic in the campus is created by computer viruses
and other malware. This information is confirmed after one month of traffic analysis by
a special device “Procera Packetlogic PL5600”. This device was chosen because it was

Optimization of University Campus Wireless Network 501
available to rent for free from some project partners in Sweden. The statistics of the
network traffic can be seen in Fig. 5.
Fig. 5. Network traffic by type (avg. in month)
Unnecessary network traffic in such dense wireless network should be eliminated.
Besides unnecessary network traffic the public IP address of the network can be blocked
by automated blacklist services (e.g. SORBS)so that some resources cannot be reached
from this network.
2.9. Other imperfections
Analyzing configuration of network switches reveals that there are not configured any
protection from Layer 2 attacks, for example, switching loops, third party DHCP servers,
etc.
There are all TCP/UDP ports open in the wireless network. It means that every
service is working, even file sharing applications that usually creates vast amounts of
network traffic
3. Network optimization
After the auditing process main problems were identified so appropriate changes could
be made to optimize the network. The following changes has been made:
1. informing of inhabitants,
2. uninterrupted power is supplied,
3. separation from third party network infrastructure,
4. expansion of wireless network coverage,
5. manual wireless channel allocation,
6. limitations of third party wireless networks,
7. separation of dual-radio standards,
8. blocking of TCP/UDP ports,
Web pages;
32%
Media
streaming; 25%
SSL; 25%
Communicatio
ns; 5%
Viruses; 5% Other; 5%
File sharing;
3%
Network traffic by type (avg. in month)

502 Šifers et al.
9. other changes.
Data gathering is done before and after network optimization so that effectiveness of
optimization can be recognized.
3.1. Informing of inhabitants
To inform inhabitants of the campus about where to report their problems regarding
wireless network operation two information campaigns was made:
1. posting a message in student internet forum,
2. creating a poster and placing them on every passage in the campus.
Statistics about problem reports can be seen in Fig. 6.
Fig. 6. Problem reports by their type
3.2. Providing uninterrupted power
Every municipality’s wireless access point is powered by Power-over-Ethernet (PoE)
network switches. So providing backup power to them all is not a difficult task – only
PoE switches needs backup power using UPS. Regarding power outage statistics in Fig.
2, it is now defined that every UPS needs to provide backup power to PoE switches for
up to 10 secs, because longer power outages are rare.
In the time period after installing the UPS units till December 2015 there were 31
power outages in campus.
WLAN:
interrupts/low
performance;
43%
WLAN: bad
signal/cannot
connect; 25%
LAN: no
physical
connection;
13%
LAN: no
connection to
resources; 8%
Closed
TCP/UDP
ports; 8% Others; 3%
Problem reports by their type

Optimization of University Campus Wireless Network 503
3.3. Separation from third party network infrastructure
To avoid situations when problems in university’s network affects municipality’s
wireless network operation in the campus, it is decided to separate wireless network
from university’s network infrastructure. It is done by using physical links between
switches instead of using VLANs trough university’s switches. In total links between 4
switches has been reorganized. Now full monitoring of every campus wireless network
branch is possible.
3.4. Expansion of wireless network coverage
First step in improving wireless network coverage is real life tests to understand where
and how close should every wireless access point be located. Campus is located in two
separate buildings which from architecture’s point of view are different. But every floor
in building A is exactly the same, and so are the floors in building B. Because of that the
tests are done in one floor of both buildings A and B. Before the network optimization
there were 4 wireless access points operating in every floor of building A and 3 wireless
access in every floor of building B. Regarding on the measurements taken before, the
wireless network coverage in both buildings is insufficient. Wireless access points are
added and relocated from one location to another to reach SNR of at least 25 dB in every
room of the campus, using the least count of wireless access points. After finding the
best wireless access point locations on of the floors of building A and B, this
configuration is implemented on all other floors of the buildings. Finding the most
suitable locations for the wireless access points the properties of wireless access points
(WEB, c, d) and structural properties of buildings A and B were considered. It is known
that concrete walls or ceilings decreases wireless signal for ~20 dB, drywall decreases
the signal for ~10 dB (WEB, e). Now the wireless access point count is increased by one
on every floor on both buildings A and B.
3.5. Manual wireless channel allocation
It is decided to set manual wireless channel (ch) allocation for every wireless access
point. It can be done in wireless network controller remotely but firstly the channel
allocation should be planned. The main concern was to configure wireless access points
not to use channel 13 and not to use the same channel on adjacent wireless access points.
Planned wireless channel allocation used geographically can be seen in Table 1 and
Table 2.
Table 1. Wireless access point channel manual allocation in building A
Floor 2.4 GHz channel, 5 GHz channel
6th Ch 1, Ch 56 Ch 6, Ch 60 Ch 11, Ch 64 Ch 1, Ch 100
5th Ch 1, Ch 136 Ch 6, Ch 140 Ch 11, Ch 36 Ch 1, Ch 40 Ch 6, Ch 52
4th Ch 6, Ch 116 Ch 11, Ch 120 Ch 1, Ch 124 Ch 6, Ch 128 Ch 11, Ch 132 3rd Ch 11, Ch 64 Ch 1, Ch 100 Ch 6, Ch 104 Ch 11, Ch 108 Ch 1, Ch 112
2nd Ch 1, Ch 36 Ch 6, Ch 40 Ch 11, Ch 52 Ch 1, Ch 56 Ch 6, Ch 60
504 Šifers et al.
Table 2. Wireless access point channel manual allocation in building B
Floor 2.4 GHz channel, 5 GHz channel
8th Ch 1, Ch 36 Ch 6, Ch 40 Ch 11, Ch 52 Ch 1, Ch 56 7th Ch 11, Ch 108 Ch 1, Ch 112 Ch 6, Ch 116 Ch 11, Ch 120
6th Ch 6, Ch 60 Ch 11, Ch 64 Ch 1, Ch 100 Ch 6, Ch 104
5th Ch 1, Ch 36 Ch 6, Ch 40 Ch 11, Ch 52 Ch 1, Ch 56 4th Ch 11, Ch 108 Ch 1, Ch 112 Ch 6, Ch 116 Ch 11, Ch 120
3rd Ch 6, Ch 60 Ch 11, Ch 64 Ch 1, Ch 100 Ch 6, Ch 104
2nd Ch 1, Ch 36 Ch 6, Ch 40 Ch 11, Ch 52 Ch 1, Ch 56
3.6. Limitations of third party wireless networks
Due to so many third party wireless networks that are interfering with municipality’s
wireless access points, limitations of third party wireless networks usage in the campus
are made. There are changes made to campus regulations so that 2.4 GHz wireless access
point users should be advised what wireless channel to use.
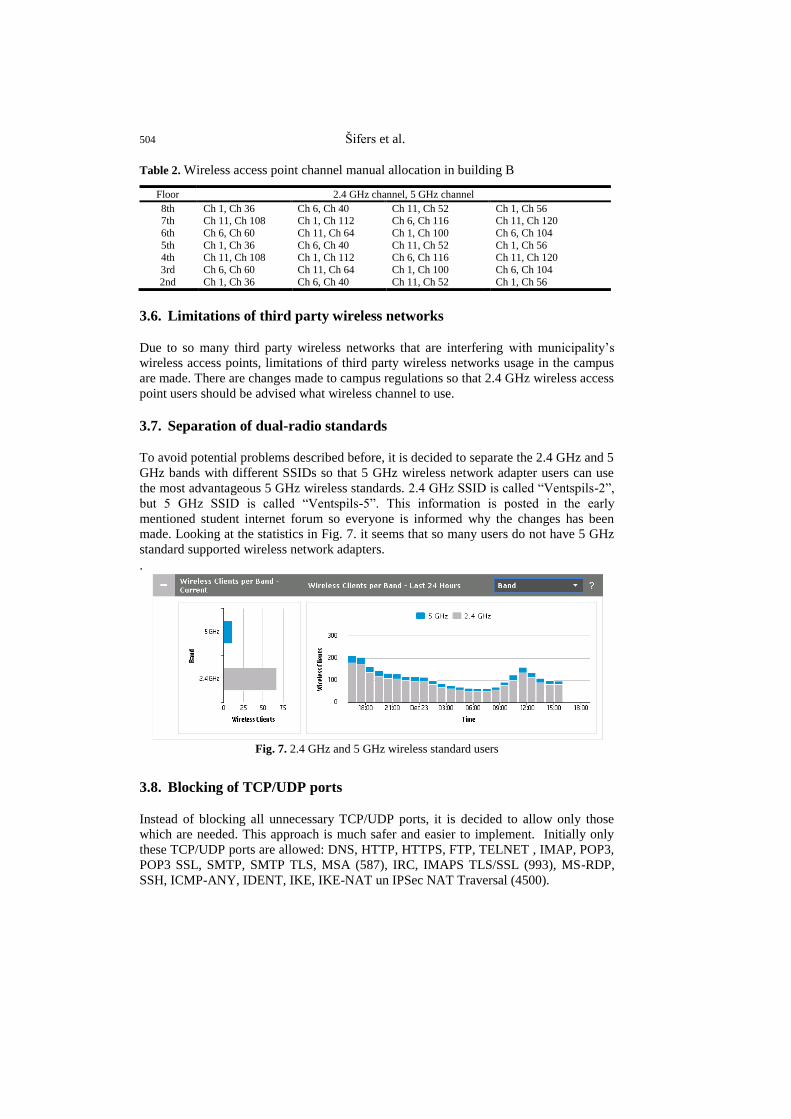
3.7. Separation of dual-radio standards
To avoid potential problems described before, it is decided to separate the 2.4 GHz and 5
GHz bands with different SSIDs so that 5 GHz wireless network adapter users can use
the most advantageous 5 GHz wireless standards. 2.4 GHz SSID is called “Ventspils-2”,
but 5 GHz SSID is called “Ventspils-5”. This information is posted in the early
mentioned student internet forum so everyone is informed why the changes has been
made. Looking at the statistics in Fig. 7. it seems that so many users do not have 5 GHz
standard supported wireless network adapters.
.
Fig. 7. 2.4 GHz and 5 GHz wireless standard users
3.8. Blocking of TCP/UDP ports
Instead of blocking all unnecessary TCP/UDP ports, it is decided to allow only those
which are needed. This approach is much safer and easier to implement. Initially only
these TCP/UDP ports are allowed: DNS, HTTP, HTTPS, FTP, TELNET , IMAP, POP3,
POP3 SSL, SMTP, SMTP TLS, MSA (587), IRC, IMAPS TLS/SSL (993), MS-RDP,
SSH, ICMP-ANY, IDENT, IKE, IKE-NAT un IPSec NAT Traversal (4500).
Optimization of University Campus Wireless Network 505
Regarding requests of campus inhabitants, all these ports have been allowed: 1024-
1096, 1194, 1194 UDP, 1195 TCP/UDP, 1365, 14580, 18080-18089, 18083, 1935, 3000
TCP, 3128, 3478 UDP, 40912, 41000, 4244, 4500, 4500 UDP, 5061 TCP, 5223, 5228,
5242, 5243, 587, 6891-6901 TCP, 7805, 7806, 7807, 7808, 8000, 8000-8020, 8038,
8080, 8081, 8088, 8090, 81, 8100, 8101, 8102, 8182, 8193, 843, 8760, 8901, 8902,
9000, 9785, 993, DNS, FTP, HTTP, HTTPS, ICMP-ANY, IDENT, IKE, IKE-NAT,
IMAP, IRC, MS-RDP, MySQL, NTP, POP3, POP3 SSL, PPTP, SMTP, SMTP TLS,
SSH, TELNET.
3.9. Other changes
To maintain full control of processes in the network advanced monitoring systems have
been implemented and used,.e.g HP Intelligent Management Center, Cisco 2500 Series
Wireless Controller, Zabbix Various protection from Layer 2 attacks have been
implemented, for example, DHCP snooping, loop protection.
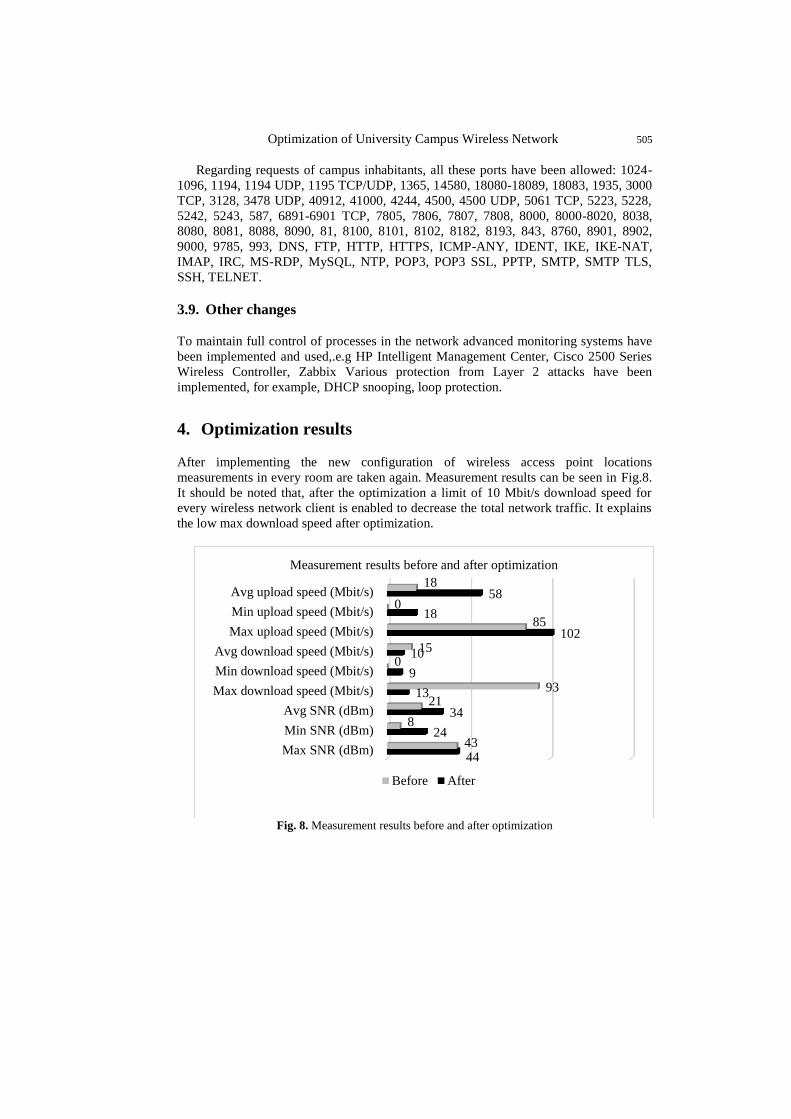
4. Optimization results
After implementing the new configuration of wireless access point locations
measurements in every room are taken again. Measurement results can be seen in Fig.8.
It should be noted that, after the optimization a limit of 10 Mbit/s download speed for
every wireless network client is enabled to decrease the total network traffic. It explains
the low max download speed after optimization.
Fig. 8. Measurement results before and after optimization
Max SNR (dBm)
Min SNR (dBm)
Avg SNR (dBm)
Max download speed (Mbit/s)
Min download speed (Mbit/s)
Avg download speed (Mbit/s)
Max upload speed (Mbit/s)
Min upload speed (Mbit/s)
Avg upload speed (Mbit/s)
44
24
34
13
9
10
102
18
58
43
8
21 93
0 15
85
0
18
Measurement results before and after optimization
Before After

506 Šifers et al.
Fig. 9. Count of IT support tickets per month
In Fig. 9. The vertical line represents the margin between IT support tiket count
before and after network optimization. Analyzing measurement results and ticket
statistics, it is clear that optimization has made positive results.
Conclusions
1. It is important to have detailed network monitoring and alert systems, so the cause
of problems could be identified and eliminated quicker.
2. Using expensive corporate network equipment does not always meet the expected
results - it needs to be configured correctly.
3. It is important to maintain communication between users and network
administrators so that both sides are informed about problems in network
operation.
4. Operation of dense wireless networks could be improved if only 5 GHz wireless
standards are used.
5. Local wireless networks will lose their popularity due to rapid evolution and usage
of mobile data networks (WEB f,g).
References
WEB (a). Augstsprieguma tīkls
http://www.ast.lv/lat/parvades_tikls/kurzemes_loks/informacija_par_projektu/
WEB (b). Saddey, Reiner. WiFi insights – Why you should avoid using channels other than 1, 6,
11 and 14 like the plague, http://blog.saddey.net/2007/07/08/wifi-insights-why-you-should-
avoid-using-channels-other-than-1-6-11-and-14-like-the-plague/
WEB (c). Antenna Radio Pattern MSM430, http://community.hpe.com/t5/MSM-Series/Antenna-
Radio-Pattern-MSM430/td-p/5851527
0
10
20
30
40
50
60
70
80
90 82
47
5 4 6 9 11 9 5 2
6 2
20
5 0
4
Tic
ket
co
unt
Count of IT support tickets per month

Optimization of University Campus Wireless Network 507
WEB (d). Cisco Aironet 1600/2600/3600 Series Access Point Deployment Guide, Release 7.5,
http://www.cisco.com/c/en/us/td/docs/wireless/technology/apdeploy/7-
5/Cisco_Aironet75.html
WEB (e). What type of building materials are WiFi penetrable and what type are WiFi
impenetrable?,https://www.reddit.com/r/askscience/comments/17zp69/what_type_of_buil
ding_materials_are_wifi
WEB (f). Global mobile statistics 2014 Part B: Mobile Web; mobile broadband penetration;
3G/4G subscribers and networks; mobile search, https://mobiforge.com/research-
analysis/global-mobile-statistics-2014-part-b-mobile-web-mobile-broadband-penetration-
3g4g-subscribers-and-ne
WEB (g). Latvija gatavojas 5G mobilajiem sakariem, http://www.delfi.lv/techlife/zinas/latvija-
gatavojas-5g-mobilajiem-sakariem.d?id=46646411
Received April 27, 2016, accepted May 22, 2016