Embed Size (px)
Citation preview
Optimization of Transducer Location for Novel Non-Intrusive Methodologies ofDiagnosis in Diesel Engines
S. Narayan1,*, M. U. Kaisan2, Shitu Abubakar2, Faisal O. Mahroogi3 and Vipul Gupta4
1Department of Mechanical Engineering, Qassim University, Buraydah, 51452, Saudi Arabia2Department of Mechanical Engineering, Ahmadu Bello University, Zaria, 810211, Nigeria3Department of Mechanical Engineering, Islamic University of Madina, Medina, 42351, Saudi Arabia4Department of Mechanical Engineering, Indus International University, Una, 174301, India*Corresponding Author: S. Narayan. Email: [email protected]
Received: 18 March 2021 Accepted: 07 June 2021
ABSTRACT
The health monitoring has been studied to ensure integrity of design of engine structure by detection, quantifica-tion, and prediction of damages. Early detection of faults may allow the downtime of maintenance to be resched-uled, thus preventing sudden shutdown of machines. In cylinder pressure developed, vibrations and noiseemissions data provide a rich source of information about condition of engines. Monitoring of vibrations andnoise emissions are novel non-intrusive methodologies for which positioning of various transducers are importantissue. The presented work shows applicability of these diagnosis methodologies adopted in case of diesel engines.The effects of changing various fuel injection parameters was analyzed. Scope of using non-intrusive techniquehas been analyzed by changing locations of microphone. Novelty of this worklies in exploring signal processingmethods for various locations around the engine test set up. Various frequency ranges of contributing noise andvibration sources were identified. Time-Frequency analysis showed the onset of various cyclic. Based on the identi-fication of various frequency bands, it is possible to device suitable filters in order to extract more information.
KEYWORDS
IC engines; automotive; vibrations and noise emissions; condition monitoring; specialized industrial machineryand equipment
1 Introduction
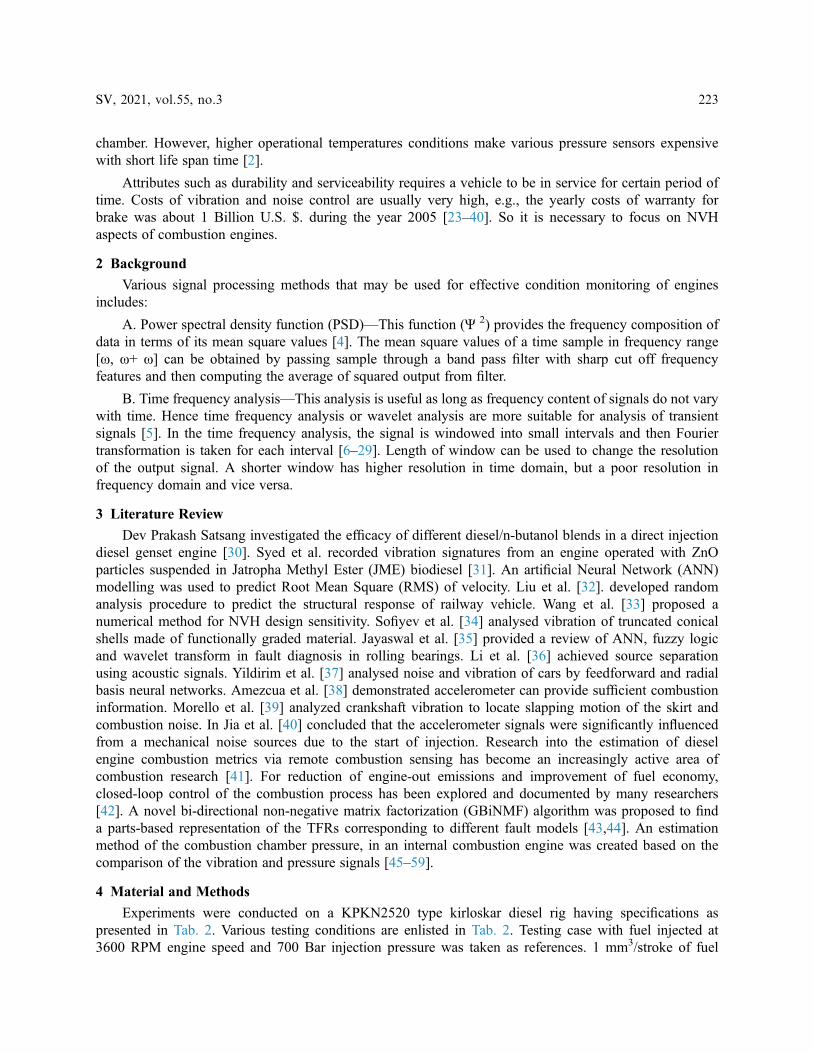
Various sources of noise and vibrations in an automotive systems are shown in Fig. 1 [1–18].
Combustion based noise can be analyzed by monitoring the speed of combustion. It is generated as animpulsive pressure wave [19]. Motion based noise which is proportional to operational speed of engine,includes noise due to piston motion, bearing noise, cam noise, oil pump noise, timing belt and chainnoise as well as structural noise of cover [20,21]. Aerodynamic flow noise includes contributions due tointake noise, exhaust noise and noise due to motion of fan. Wind and road tire noise lie in the mediumfrequency ranges [22]. Tab. 1 presents comparisons of features of various sources of noise in engines.
This work is licensed under a Creative Commons Attribution 4.0 International License, whichpermits unrestricted use, distribution, and reproduction in any medium, provided the originalwork is properly cited.
DOI: 10.32604/sv.2021.016539
ARTICLE
echT PressScience
Among the advanced techniques, monitoring of noise and vibration emissions from engines, areimportant benchmarks for various choice of customers [11–21]. Various diagnosis methodologies adoptedin case of diesel engines for their condition monitoring includes:
A. Monitoring of structural vibrations-optimumlocation of accelerometer transducer is a major hurdle asthere may be contamination of signals. Frequency spectrum, peak or RMS values are effective to monitorvarious faults like imbalances, bearing damage or shaft misalignments [1].
B. Noise monitoring- injector operational faults, wear, incorrect injection timings, valve operation faultsmay be diagnosed by monitoring noise emissions from engine.
C. Cylinder pressure development monitoring-location of abnormal combustion and hence overallcombustion efficiency of engines can be monitoring by profile of pressure developed inside combustion
Figure 1: Sources of automotive noise (1: valve train motion, 2: chain drive motion, 3–4: accessory noise,5: piston slapnoise, 6: bearing noise, 7: cover noise, 8: intake noise, 9: exhuast noise, 10: combustion noise,11: oil pan noise)
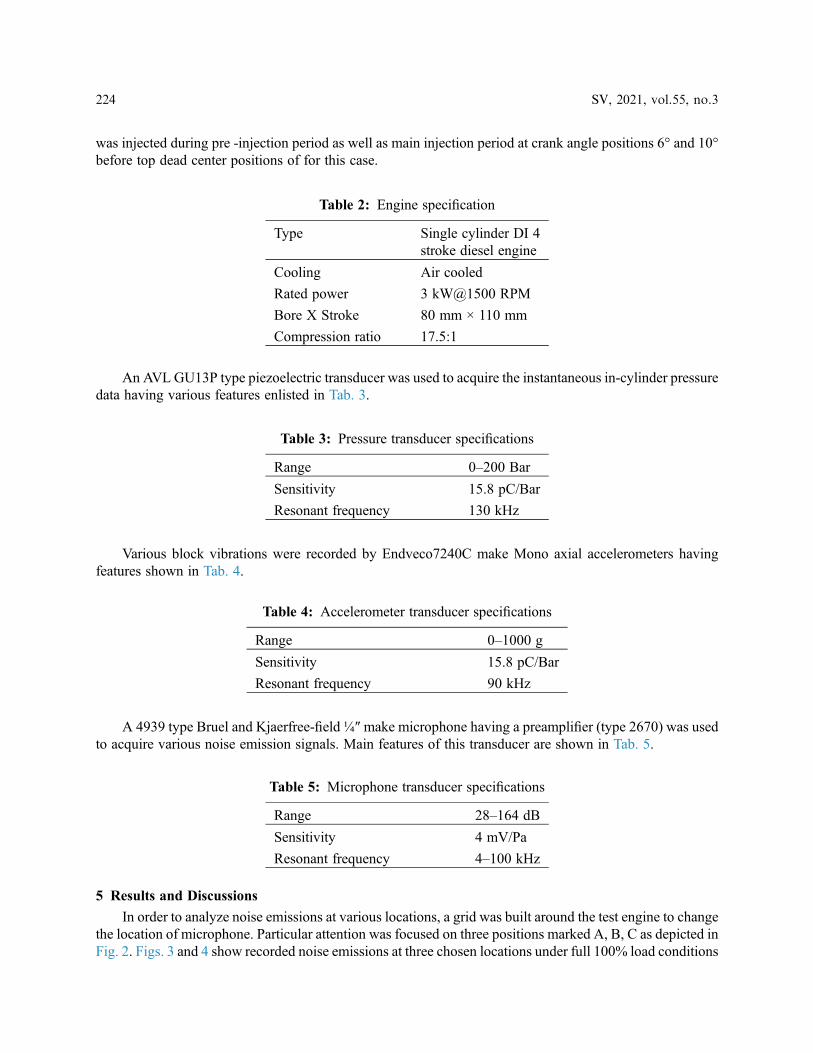
Table 1: Characteristic features of various sources
Noise source Approximate frequency range Effecting factor
Combustion Noise 500–8000 Hz In cylinder pressure
Piston Slap 2000–8000 Hz Speed, piston design
Valve Operation 500–2000 Hz Valve type, Engine speed
Fan Noise 200–2000 Hz Speed, number of Blades
Intake Flow Noise 50–5000 Hz Turbulence
Exhaust Flow Noise 50–5000 Hz Turbulence
Injection Pump Operation 2000 Hz Pump features
Gear Noise 4000 Hz Speed, Number of teeth
Accessory Belt-Chain Noise 3000 Hz Engine speed, misalignment,number of teeth
222 SV, 2021, vol.55, no.3
chamber. However, higher operational temperatures conditions make various pressure sensors expensivewith short life span time [2].
Attributes such as durability and serviceability requires a vehicle to be in service for certain period oftime. Costs of vibration and noise control are usually very high, e.g., the yearly costs of warranty forbrake was about 1 Billion U.S. $. during the year 2005 [23–40]. So it is necessary to focus on NVHaspects of combustion engines.
2 Background
Various signal processing methods that may be used for effective condition monitoring of enginesincludes:
A. Power spectral density function (PSD)—This function (Ψ 2) provides the frequency composition ofdata in terms of its mean square values [4]. The mean square values of a time sample in frequency range[ω, ω+ ω] can be obtained by passing sample through a band pass filter with sharp cut off frequencyfeatures and then computing the average of squared output from filter.
B. Time frequency analysis—This analysis is useful as long as frequency content of signals do not varywith time. Hence time frequency analysis or wavelet analysis are more suitable for analysis of transientsignals [5]. In the time frequency analysis, the signal is windowed into small intervals and then Fouriertransformation is taken for each interval [6–29]. Length of window can be used to change the resolutionof the output signal. A shorter window has higher resolution in time domain, but a poor resolution infrequency domain and vice versa.
3 Literature Review
Dev Prakash Satsang investigated the efficacy of different diesel/n-butanol blends in a direct injectiondiesel genset engine [30]. Syed et al. recorded vibration signatures from an engine operated with ZnOparticles suspended in Jatropha Methyl Ester (JME) biodiesel [31]. An artificial Neural Network (ANN)modelling was used to predict Root Mean Square (RMS) of velocity. Liu et al. [32]. developed randomanalysis procedure to predict the structural response of railway vehicle. Wang et al. [33] proposed anumerical method for NVH design sensitivity. Sofiyev et al. [34] analysed vibration of truncated conicalshells made of functionally graded material. Jayaswal et al. [35] provided a review of ANN, fuzzy logicand wavelet transform in fault diagnosis in rolling bearings. Li et al. [36] achieved source separationusing acoustic signals. Yildirim et al. [37] analysed noise and vibration of cars by feedforward and radialbasis neural networks. Amezcua et al. [38] demonstrated accelerometer can provide sufficient combustioninformation. Morello et al. [39] analyzed crankshaft vibration to locate slapping motion of the skirt andcombustion noise. In Jia et al. [40] concluded that the accelerometer signals were significantly influencedfrom a mechanical noise sources due to the start of injection. Research into the estimation of dieselengine combustion metrics via remote combustion sensing has become an increasingly active area ofcombustion research [41]. For reduction of engine-out emissions and improvement of fuel economy,closed-loop control of the combustion process has been explored and documented by many researchers[42]. A novel bi-directional non-negative matrix factorization (GBiNMF) algorithm was proposed to finda parts-based representation of the TFRs corresponding to different fault models [43,44]. An estimationmethod of the combustion chamber pressure, in an internal combustion engine was created based on thecomparison of the vibration and pressure signals [45–59].
4 Material and Methods
Experiments were conducted on a KPKN2520 type kirloskar diesel rig having specifications aspresented in Tab. 2. Various testing conditions are enlisted in Tab. 2. Testing case with fuel injected at3600 RPM engine speed and 700 Bar injection pressure was taken as references. 1 mm3/stroke of fuel
SV, 2021, vol.55, no.3 223
was injected during pre -injection period as well as main injection period at crank angle positions 6° and 10°before top dead center positions of for this case.
An AVL GU13P type piezoelectric transducer was used to acquire the instantaneous in-cylinder pressuredata having various features enlisted in Tab. 3.
Various block vibrations were recorded by Endveco7240C make Mono axial accelerometers havingfeatures shown in Tab. 4.
A 4939 type Bruel and Kjaerfree-field ¼″make microphone having a preamplifier (type 2670) was usedto acquire various noise emission signals. Main features of this transducer are shown in Tab. 5.
5 Results and Discussions
In order to analyze noise emissions at various locations, a grid was built around the test engine to changethe location of microphone. Particular attention was focused on three positions marked A, B, C as depicted inFig. 2. Figs. 3 and 4 show recorded noise emissions at three chosen locations under full 100% load conditions
Table 2: Engine specification
Type Single cylinder DI 4stroke diesel engine
Cooling Air cooled
Rated power 3 kW@1500 RPM
Bore X Stroke 80 mm × 110 mm
Compression ratio 17.5:1
Table 3: Pressure transducer specifications
Range 0–200 Bar
Sensitivity 15.8 pC/Bar
Resonant frequency 130 kHz
Table 4: Accelerometer transducer specifications
Range 0–1000 g
Sensitivity 15.8 pC/Bar
Resonant frequency 90 kHz
Table 5: Microphone transducer specifications
Range 28–164 dB
Sensitivity 4 mV/Pa
Resonant frequency 4–100 kHz
224 SV, 2021, vol.55, no.3
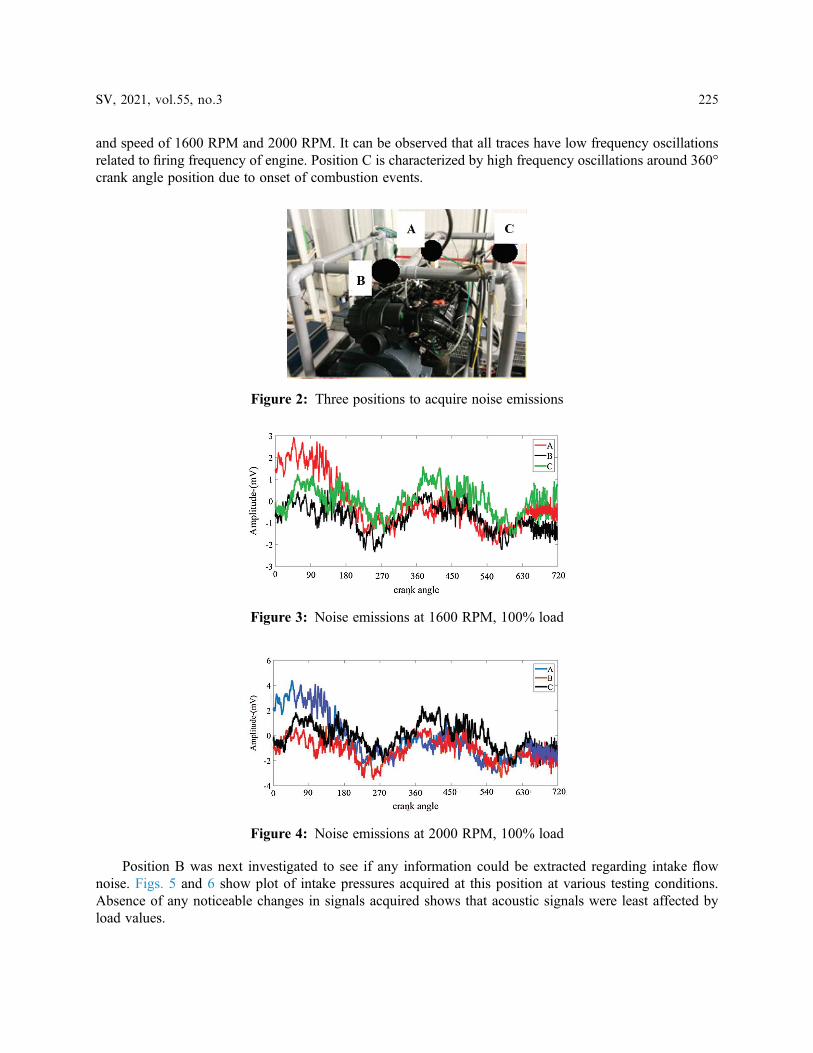
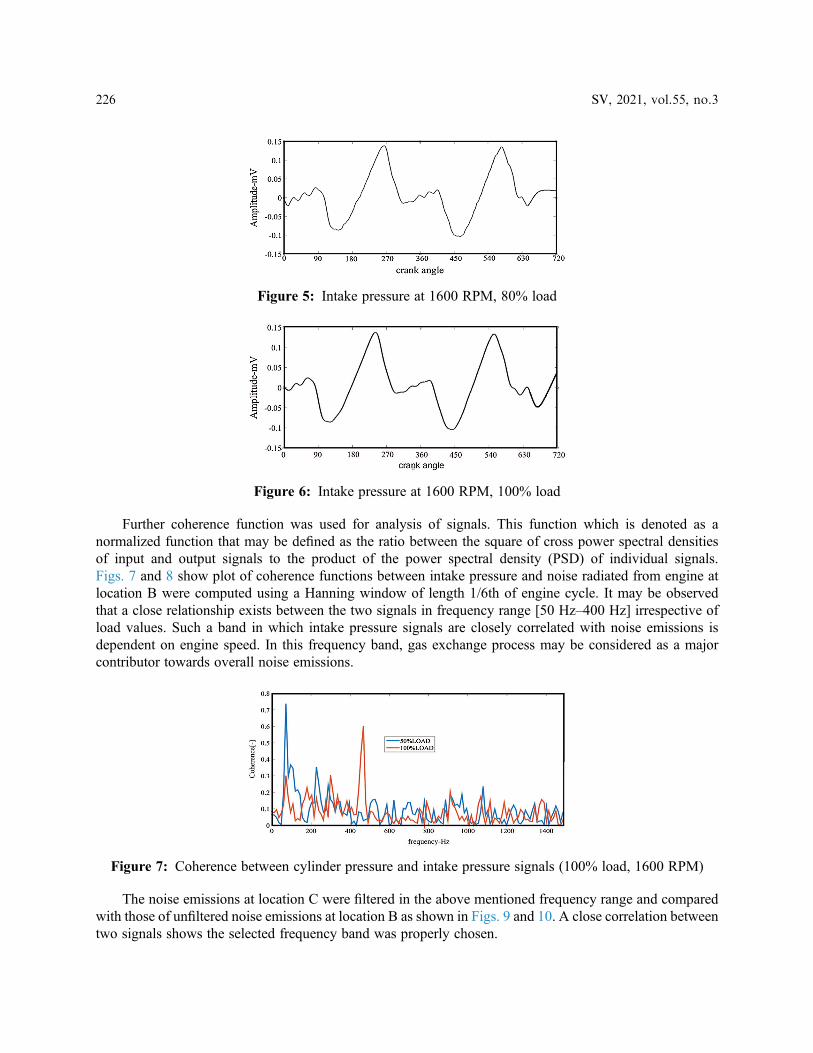
and speed of 1600 RPM and 2000 RPM. It can be observed that all traces have low frequency oscillationsrelated to firing frequency of engine. Position C is characterized by high frequency oscillations around 360°crank angle position due to onset of combustion events.
Position B was next investigated to see if any information could be extracted regarding intake flownoise. Figs. 5 and 6 show plot of intake pressures acquired at this position at various testing conditions.Absence of any noticeable changes in signals acquired shows that acoustic signals were least affected byload values.
Figure 2: Three positions to acquire noise emissions
Figure 3: Noise emissions at 1600 RPM, 100% load
Figure 4: Noise emissions at 2000 RPM, 100% load
SV, 2021, vol.55, no.3 225
Further coherence function was used for analysis of signals. This function which is denoted as anormalized function that may be defined as the ratio between the square of cross power spectral densitiesof input and output signals to the product of the power spectral density (PSD) of individual signals.Figs. 7 and 8 show plot of coherence functions between intake pressure and noise radiated from engine atlocation B were computed using a Hanning window of length 1/6th of engine cycle. It may be observedthat a close relationship exists between the two signals in frequency range [50 Hz–400 Hz] irrespective ofload values. Such a band in which intake pressure signals are closely correlated with noise emissions isdependent on engine speed. In this frequency band, gas exchange process may be considered as a majorcontributor towards overall noise emissions.
The noise emissions at location C were filtered in the above mentioned frequency range and comparedwith those of unfiltered noise emissions at location B as shown in Figs. 9 and 10. A close correlation betweentwo signals shows the selected frequency band was properly chosen.
Figure 5: Intake pressure at 1600 RPM, 80% load
Figure 6: Intake pressure at 1600 RPM, 100% load
Figure 7: Coherence between cylinder pressure and intake pressure signals (100% load, 1600 RPM)
226 SV, 2021, vol.55, no.3
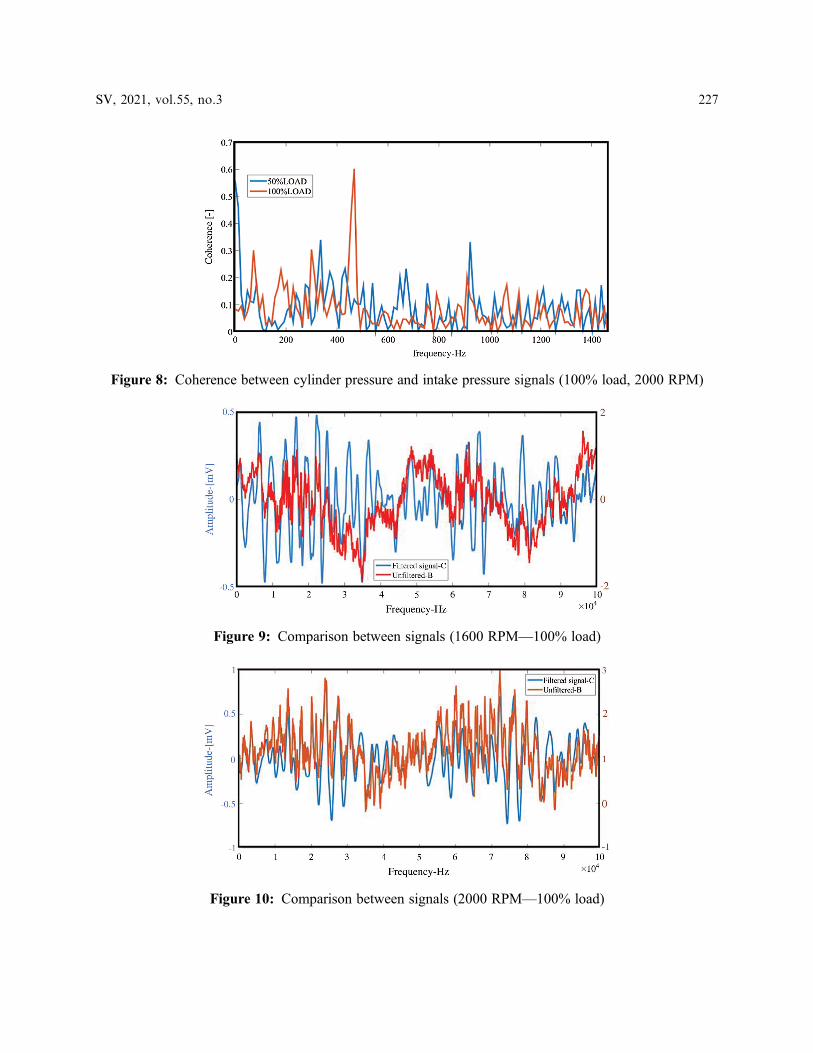
Figure 8: Coherence between cylinder pressure and intake pressure signals (100% load, 2000 RPM)
Figure 9: Comparison between signals (1600 RPM—100% load)
Figure 10: Comparison between signals (2000 RPM—100% load)
SV, 2021, vol.55, no.3 227
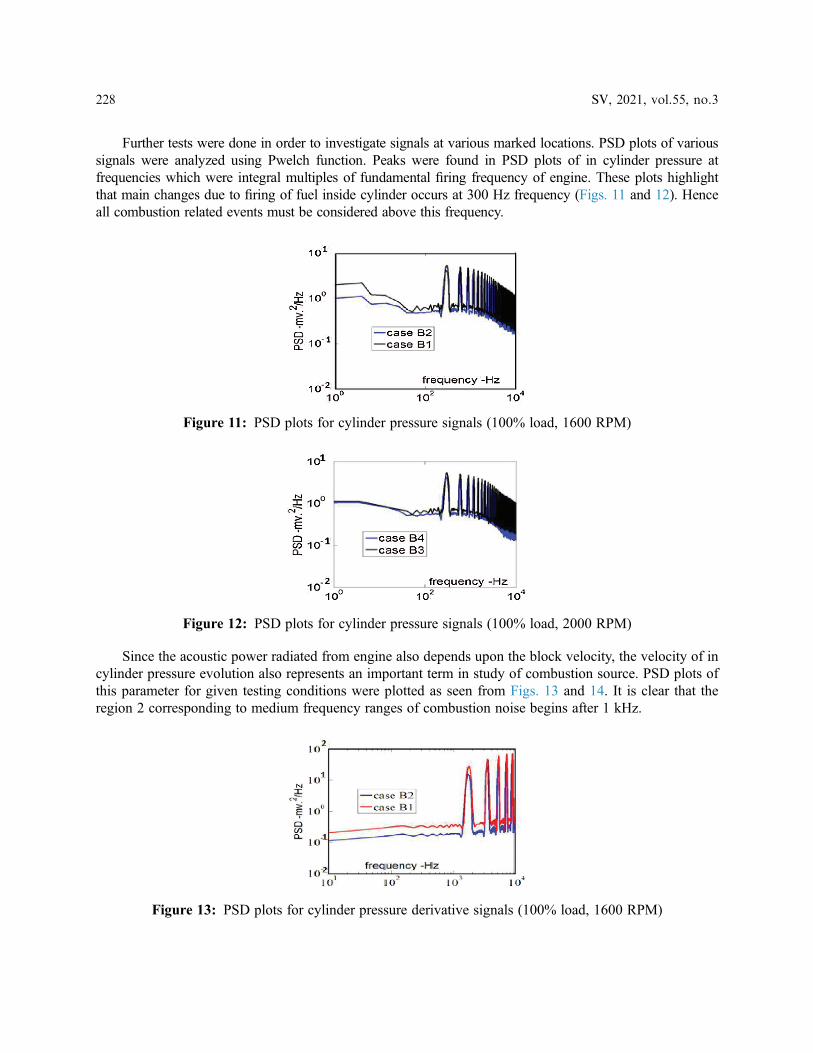
Further tests were done in order to investigate signals at various marked locations. PSD plots of varioussignals were analyzed using Pwelch function. Peaks were found in PSD plots of in cylinder pressure atfrequencies which were integral multiples of fundamental firing frequency of engine. These plots highlightthat main changes due to firing of fuel inside cylinder occurs at 300 Hz frequency (Figs. 11 and 12). Henceall combustion related events must be considered above this frequency.
Since the acoustic power radiated from engine also depends upon the block velocity, the velocity of incylinder pressure evolution also represents an important term in study of combustion source. PSD plots ofthis parameter for given testing conditions were plotted as seen from Figs. 13 and 14. It is clear that theregion 2 corresponding to medium frequency ranges of combustion noise begins after 1 kHz.
Figure 11: PSD plots for cylinder pressure signals (100% load, 1600 RPM)
Figure 12: PSD plots for cylinder pressure signals (100% load, 2000 RPM)
Figure 13: PSD plots for cylinder pressure derivative signals (100% load, 1600 RPM)
228 SV, 2021, vol.55, no.3
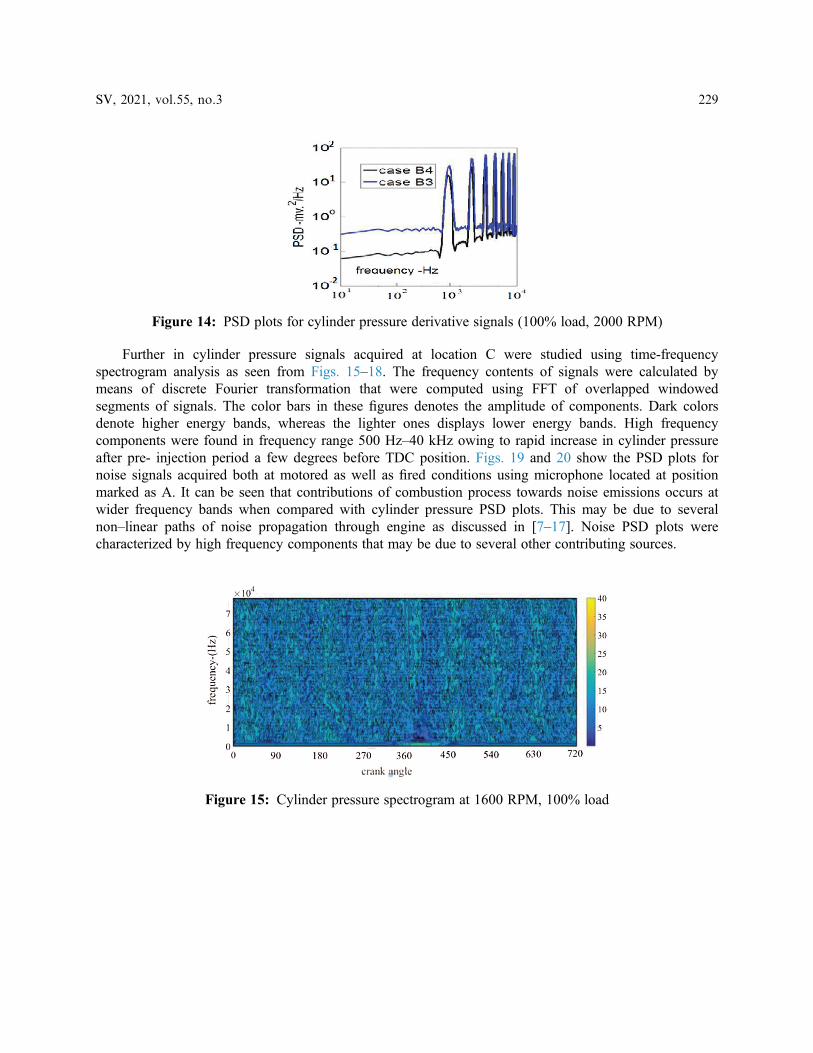
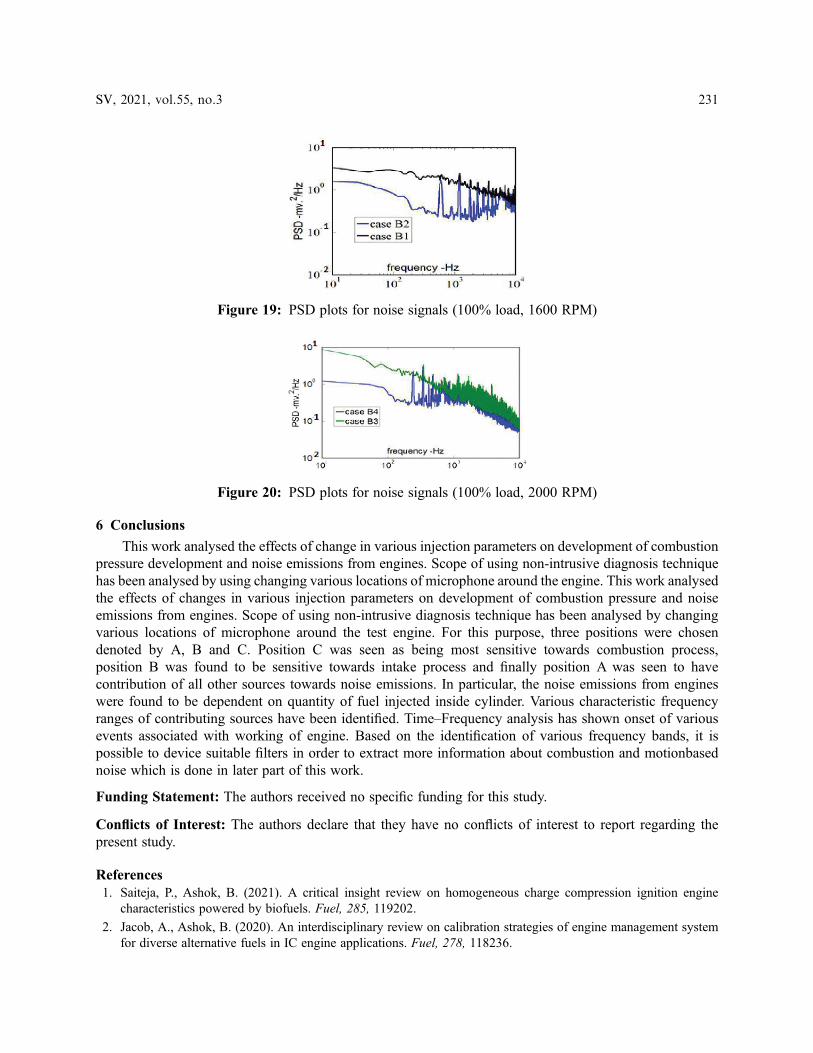
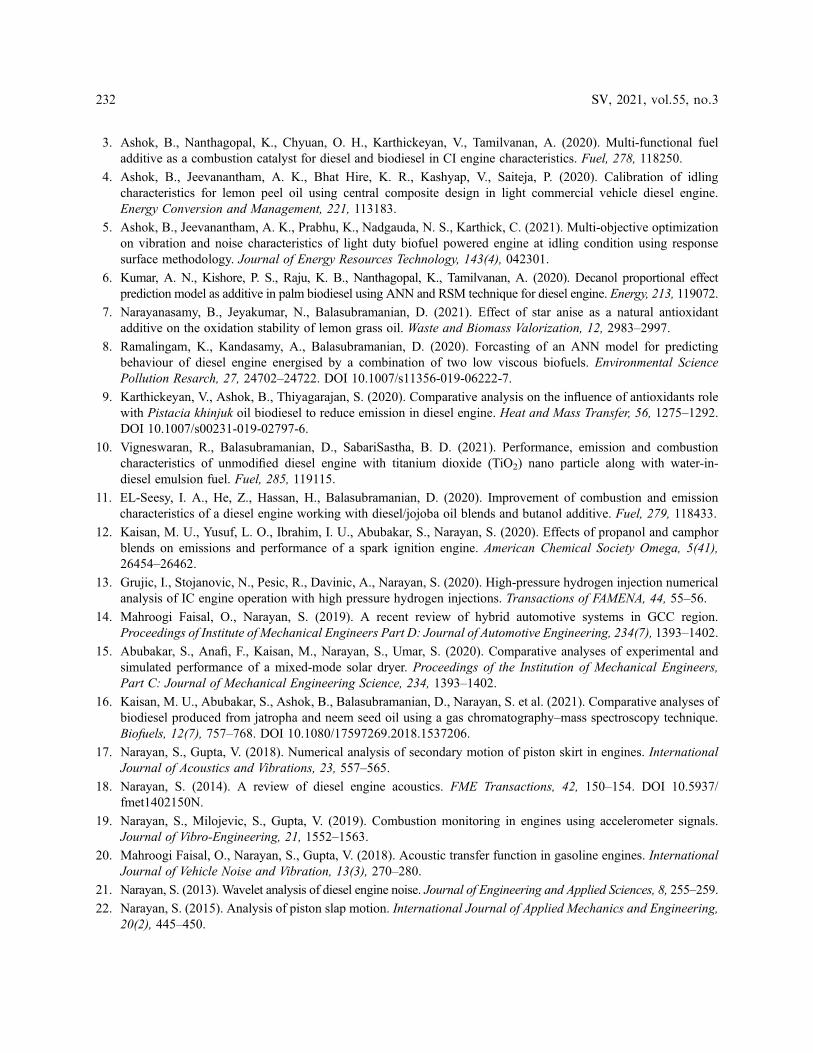
Further in cylinder pressure signals acquired at location C were studied using time-frequencyspectrogram analysis as seen from Figs. 15–18. The frequency contents of signals were calculated bymeans of discrete Fourier transformation that were computed using FFT of overlapped windowedsegments of signals. The color bars in these figures denotes the amplitude of components. Dark colorsdenote higher energy bands, whereas the lighter ones displays lower energy bands. High frequencycomponents were found in frequency range 500 Hz–40 kHz owing to rapid increase in cylinder pressureafter pre- injection period a few degrees before TDC position. Figs. 19 and 20 show the PSD plots fornoise signals acquired both at motored as well as fired conditions using microphone located at positionmarked as A. It can be seen that contributions of combustion process towards noise emissions occurs atwider frequency bands when compared with cylinder pressure PSD plots. This may be due to severalnon–linear paths of noise propagation through engine as discussed in [7–17]. Noise PSD plots werecharacterized by high frequency components that may be due to several other contributing sources.
Figure 14: PSD plots for cylinder pressure derivative signals (100% load, 2000 RPM)
Figure 15: Cylinder pressure spectrogram at 1600 RPM, 100% load
SV, 2021, vol.55, no.3 229
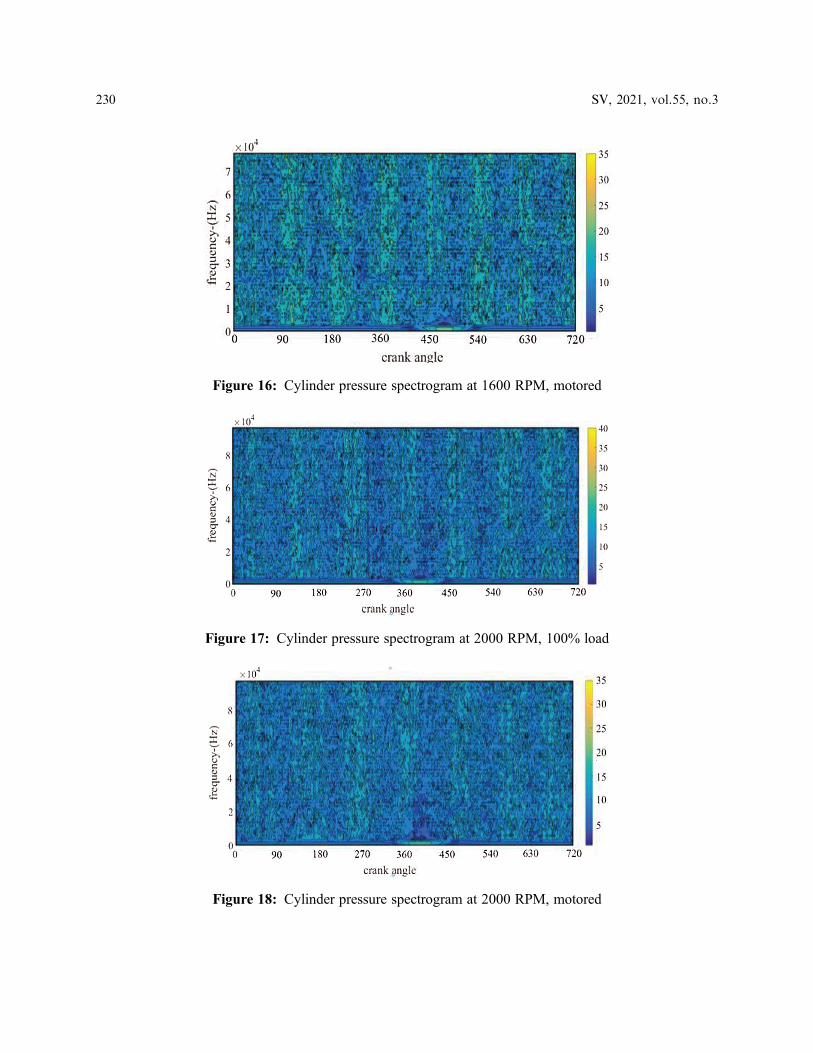
Figure 16: Cylinder pressure spectrogram at 1600 RPM, motored
Figure 17: Cylinder pressure spectrogram at 2000 RPM, 100% load
Figure 18: Cylinder pressure spectrogram at 2000 RPM, motored
230 SV, 2021, vol.55, no.3
6 Conclusions
This work analysed the effects of change in various injection parameters on development of combustionpressure development and noise emissions from engines. Scope of using non-intrusive diagnosis techniquehas been analysed by using changing various locations of microphone around the engine. This work analysedthe effects of changes in various injection parameters on development of combustion pressure and noiseemissions from engines. Scope of using non-intrusive diagnosis technique has been analysed by changingvarious locations of microphone around the test engine. For this purpose, three positions were chosendenoted by A, B and C. Position C was seen as being most sensitive towards combustion process,position B was found to be sensitive towards intake process and finally position A was seen to havecontribution of all other sources towards noise emissions. In particular, the noise emissions from engineswere found to be dependent on quantity of fuel injected inside cylinder. Various characteristic frequencyranges of contributing sources have been identified. Time–Frequency analysis has shown onset of variousevents associated with working of engine. Based on the identification of various frequency bands, it ispossible to device suitable filters in order to extract more information about combustion and motionbasednoise which is done in later part of this work.
Funding Statement: The authors received no specific funding for this study.
Conflicts of Interest: The authors declare that they have no conflicts of interest to report regarding thepresent study.
References1. Saiteja, P., Ashok, B. (2021). A critical insight review on homogeneous charge compression ignition engine
characteristics powered by biofuels. Fuel, 285, 119202.
2. Jacob, A., Ashok, B. (2020). An interdisciplinary review on calibration strategies of engine management systemfor diverse alternative fuels in IC engine applications. Fuel, 278, 118236.
Figure 19: PSD plots for noise signals (100% load, 1600 RPM)
Figure 20: PSD plots for noise signals (100% load, 2000 RPM)
SV, 2021, vol.55, no.3 231
3. Ashok, B., Nanthagopal, K., Chyuan, O. H., Karthickeyan, V., Tamilvanan, A. (2020). Multi-functional fueladditive as a combustion catalyst for diesel and biodiesel in CI engine characteristics. Fuel, 278, 118250.
4. Ashok, B., Jeevanantham, A. K., Bhat Hire, K. R., Kashyap, V., Saiteja, P. (2020). Calibration of idlingcharacteristics for lemon peel oil using central composite design in light commercial vehicle diesel engine.Energy Conversion and Management, 221, 113183.
5. Ashok, B., Jeevanantham, A. K., Prabhu, K., Nadgauda, N. S., Karthick, C. (2021). Multi-objective optimizationon vibration and noise characteristics of light duty biofuel powered engine at idling condition using responsesurface methodology. Journal of Energy Resources Technology, 143(4), 042301.
6. Kumar, A. N., Kishore, P. S., Raju, K. B., Nanthagopal, K., Tamilvanan, A. (2020). Decanol proportional effectprediction model as additive in palm biodiesel using ANN and RSM technique for diesel engine. Energy, 213, 119072.
7. Narayanasamy, B., Jeyakumar, N., Balasubramanian, D. (2021). Effect of star anise as a natural antioxidantadditive on the oxidation stability of lemon grass oil. Waste and Biomass Valorization, 12, 2983–2997.
8. Ramalingam, K., Kandasamy, A., Balasubramanian, D. (2020). Forcasting of an ANN model for predictingbehaviour of diesel engine energised by a combination of two low viscous biofuels. Environmental SciencePollution Resarch, 27, 24702–24722. DOI 10.1007/s11356-019-06222-7.
9. Karthickeyan, V., Ashok, B., Thiyagarajan, S. (2020). Comparative analysis on the influence of antioxidants rolewith Pistacia khinjuk oil biodiesel to reduce emission in diesel engine. Heat and Mass Transfer, 56, 1275–1292.DOI 10.1007/s00231-019-02797-6.
10. Vigneswaran, R., Balasubramanian, D., SabariSastha, B. D. (2021). Performance, emission and combustioncharacteristics of unmodified diesel engine with titanium dioxide (TiO2) nano particle along with water-in-diesel emulsion fuel. Fuel, 285, 119115.
11. EL-Seesy, I. A., He, Z., Hassan, H., Balasubramanian, D. (2020). Improvement of combustion and emissioncharacteristics of a diesel engine working with diesel/jojoba oil blends and butanol additive. Fuel, 279, 118433.
12. Kaisan, M. U., Yusuf, L. O., Ibrahim, I. U., Abubakar, S., Narayan, S. (2020). Effects of propanol and camphorblends on emissions and performance of a spark ignition engine. American Chemical Society Omega, 5(41),26454–26462.
13. Grujic, I., Stojanovic, N., Pesic, R., Davinic, A., Narayan, S. (2020). High-pressure hydrogen injection numericalanalysis of IC engine operation with high pressure hydrogen injections. Transactions of FAMENA, 44, 55–56.
14. Mahroogi Faisal, O., Narayan, S. (2019). A recent review of hybrid automotive systems in GCC region.Proceedings of Institute of Mechanical Engineers Part D: Journal of Automotive Engineering, 234(7), 1393–1402.
15. Abubakar, S., Anafi, F., Kaisan, M., Narayan, S., Umar, S. (2020). Comparative analyses of experimental andsimulated performance of a mixed-mode solar dryer. Proceedings of the Institution of Mechanical Engineers,Part C: Journal of Mechanical Engineering Science, 234, 1393–1402.
16. Kaisan, M. U., Abubakar, S., Ashok, B., Balasubramanian, D., Narayan, S. et al. (2021). Comparative analyses ofbiodiesel produced from jatropha and neem seed oil using a gas chromatography–mass spectroscopy technique.Biofuels, 12(7), 757–768. DOI 10.1080/17597269.2018.1537206.
17. Narayan, S., Gupta, V. (2018). Numerical analysis of secondary motion of piston skirt in engines. InternationalJournal of Acoustics and Vibrations, 23, 557–565.
18. Narayan, S. (2014). A review of diesel engine acoustics. FME Transactions, 42, 150–154. DOI 10.5937/fmet1402150N.
19. Narayan, S., Milojevic, S., Gupta, V. (2019). Combustion monitoring in engines using accelerometer signals.Journal of Vibro-Engineering, 21, 1552–1563.
20. Mahroogi Faisal, O., Narayan, S., Gupta, V. (2018). Acoustic transfer function in gasoline engines. InternationalJournal of Vehicle Noise and Vibration, 13(3), 270–280.
21. Narayan, S. (2013). Wavelet analysis of diesel engine noise. Journal of Engineering and Applied Sciences, 8, 255–259.
22. Narayan, S. (2015). Analysis of piston slap motion. International Journal of Applied Mechanics and Engineering,20(2), 445–450.
232 SV, 2021, vol.55, no.3
23. Narayan, S. (2013). Piston slap noise in engines. International Journal of Applied Engineering Research, 8(14),1695–1700.
24. Narayan, S. (2013). Effect of dwell time on noise radiated from diesel engine. International Journal of AppliedEngineering Research, 8, 1339–1347.
25. Mustapha, M., Kaisan, M. U., Shitu, A., Narayan, S. (2018). Determination of wear metals debris concentration inaircraft engines. International Journal of Innovative Technology and Exploring and engineering, 8(11), 1339–1347.
26. Alsagri, A. S., Gupta, V., Narayan, S. (2018). Design and analysis of hybrid automotive suspension system.International Journal of Mechanical and Production Engineering Research and Development, 8(2), 637–642.
27. Alsagri, A. S., Mahroogi, F. O., Narayan, S. (2018). Design and analysis of double wishbone suspension systemsfor automotive applications. International Journal of Mechanical and Production Engineering Research andDevelopment, 8, 1433–1442.
28. Stojanovic, N., Glisovic, J., Grujic, I., Narayan, S. (2020). Influence of size of ventilated brake disc ribs on air flowvelocity. International Journal of Advanced Science and Technology, 29(1), 637–647.
29. Mahroogi, F. O., Narayan, S. (2020). Effects of dampers on piston slapping motion. International Journal ofVehicle Noise and Vibration, 16(1–2), 46–57.
30. Satsang, D. P., Tiwari, N. (2018). Experimental investigation on combustion, noise, vibrations, performance andemissions characteristics of diesel/n-butanol blends driven genset engine. Fuel, 221, 44–60.
31. Javed, S., Satyanarayana Murthy, Y. V. V., Baig, R. U., Nagarjuna Rao, T. (2016). Vibration analysis of a dieselengine using biodiesel fuel blended with nano particles by dual fueling of hydrogen. Journal of Natural GasScience and Engineering, 33, 217–230.
32. Liu, I., Zhang, Y., Guo, H., He, W., Xie, S. et al. (2020). Random vibration analysis procedure of railway vehicle,vehicle system dynamics. International Journal of Vehicle Mechanics and Mobility, 58, 12.
33. Wang, S. (1999). Design sensitivity analysis of noise, vibration, and harshness of vehicle body structure.Mechanics of Structures and Machines, 27, 317–335.
34. Sofiyev, H., Schnack, E. (2012). The vibration analysis of FGM truncated conical shells resting on two-parameterelastic foundations. Mechanics of Advanced Materials and Structures, 19, 241–249.
35. Jayaswal, P., Wadhwani, A. K. (2009). Application of artificial neural networks, fuzzy logic and wavelet transform infault diagnosis via vibration signal analysis: A review. Australian Journal of Mechanical Engineering, 7, 157–171.
36. Lif, W., Gua, D., Balla, Y., leung, C., Phipps, E. (2001). A study of the noise from diesel engines using theindependent component analysis. Mechanical Systems and Signal Processing, 15, 1165–1184.
37. Yildirim, Ş., Erkaya, S., Eski, I., Uzmay, I. (2009). Noise and vibration analysis of car engines using proposedneural network. Journal of Vibration and Control, 15, 133–156.
38. Amezcua, E., Maldonado, B., Rothamer, D., Kim, K. (2020). Accelerometer-based estimation of combustionfeatures for engine feedback control of compression-ignition direct-injection engines. SAE Technical Paper2020-01-1147.
39. Morello, A. J., Blough, J., Naber, J., Jia, L. (2011). Signal processing parameters for estimation of the diesel enginecombustion signature. SAE International Journal of Passenger Cars—Mechanical Systems, 4, 1201–1215. DOI10.4271/2011-01-1649.
40. Jia, L., Naber, J., Blough, J. (2016). Review of sensing methodologies for estimation of combustion metrics.Journal of Combustion, 3, 1–9. DOI 10.1155/2016/8593523.
41. Wang, X., Cai, Y., Li, A., Zhang, W., Yue, Y. et al. (2021). Intelligent fault diagnosis of diesel engine via adaptiveVMD-Rihaczek distribution and graph regularized bi-directional NMF. Measurement, 172, 108823.
42. Wang, Q., Sun, T., Lyu, Z., Gao, D. (2019). A virtual in-cylinder pressure sensor based on EKF and frequency-amplitude-modulation Fourier-series method. Sensors, 19, 3122. DOI 10.3390/s19143122.
43. Grajales, J. A., Quintero, H. F., Romero, C. A., Henao, E., López, J. F. et al. (2016). Combustion pressureestimation method of a spark ignited combustion engine based on vibration signal processing. Journal ofVibroengineering, 18, 4237–4247.
SV, 2021, vol.55, no.3 233
44. Lee, Y., Lee, S., Choi, H. (2019). Analysis of vibration on an engine block caused by combustion in a diesel engine.International Journal of Automotive Technology, 20, 187–195.
45. Andersson, I., McKelvey, T., Larsson, M. (2014). Detection of combustion properties in a diesel engine usingblock mounted accelerometers. IFAC Proceedings, 47, 11866–11871.
46. Kaisan, M. U., Nafiu, T., Habib, Y. B. (2010). Carbon capture storage and processing as a means of enhancing renewableenergy sources in Nigeria. Renewable and Alternative Energy for Sustainable National Development, 2, 219–225.
47. Kaisan, M. U., Naifu, T., Habib, Y. B. (2016). Towards new policies in minimizing green house gas emission inNigeria. Renewable and Alternative Energy for Sustainable National Development, 2, 306–316.
48. Nafiu, T., Magaji, U. I., Zuru, A. A., Kaisan, M. U., Habib, Y. B. (2011). Production of biodiesel from wild grapeseeds. Technical Transaction Journal of Nigerian Society of Engineers, 46, 1–10.
49. Kaisan, M. U., Pam, G. Y., Kulla, D. M. (2013). Physico-chemical properties of biodiesel from wild grape seeds oiland petro-diesel blends. American Journal of Engineering Research, 2, 291–297.
50. Kaisan, M. U., Pam, G. Y. (2013). Determination of engine performance parameters of a stationary single cylindercompression engine run on biodiesel from wild grape seeds/diesel blends of engine performance parameters usingbiodiesel from wild grape seeds. Journal of Energy, Environment and Carbon Credit, 3, 15–21.
51. Muhammad, S. B., Kaisan, M. U., Cyprian, O. U., Sani, F., Abdulkadir, M. (2014). Performance evaluation of a save80 cook stoves using controlled cooking test method. Journals of Energy Environment and Carbon Credits, 4, 25–30.
52. Kaisan, M. U., Pam, G. Y., Kulla, D. M., Kehinde, A. J. (2015). Effects of oil extraction method on biodieselproduction from wild grape seeds: A case study of soxhlet extraction method and mechanical press enginedriven expeller method. Journal of Alternate Energy and Technologies, 6, 35–41.
53. Kela, R., Tijjani, A., Kaisan, M. U. (2015). Current status of research and development (R&D) activities onefficient cook stoves in Nigeria. Journal of Energy Policy, Research and Development, 1(20), 53–61.
54. Kaisan, M. U., Anafi, F. O., Nuszkwoski, J., Kulla, D. M., Umaru, S. (2016). GC-MS analyses of biodieselproduced from cotton seed oil. Nigerian Journal of Solar Energy, 27, 56–61.
55. Kaisan, M. U., Anafi, F. O., Nuszkowski, J., Kulla, D. M., Umaru, S. (2017). Calorific value, flash point and cetanenumber of biodiesel from cotton, jatropha and neem oil binary and multi-blends with diesel. Biofuels, 8, 1–7.
56. Narayan, S., Gupta, V. (2021). Frequency characteristics of in cylinder pressure of a gasoline engine. Journal ofApplied Engineering Science, 19(1), 92–97.
57. Narayan, S. (2015). Modelling of noise radiated from engines. SAE Technical Papers. DOI 10.4271/2015-01-0107.
58. Narayan, S. (2015). Effects of various parameters on piston secondary motion. SAE Technical Papers. DOI10.4271/2015-01-0079.
59. Narayan, S. (2015). Analysis of noise emitted from diesel engines. Journal of Physics Conference Series, 662,012018. DOI 10.1088/1742-6596/662/1/012018.
234 SV, 2021, vol.55, no.3