Embed Size (px)
Citation preview

www.ijsret.org
958 International Journal of Scientific Research Engineering & Technology (IJSRET), ISSN 2278 – 0882
Volume 4, Issue 9, September 2015
OPTIMIZATION OF THE EFFECTS OF DEGUMMING PARAMETERS ON THE
REMOVAL OF PHOSPHOTIDES, AND THE STABILITY OF REFINED PALM OIL.
EGBUNA S.O.
1Department of chemical engineering, Enugu State University of Science and Technology, Enugu.
ABSTRACT: This work investigated the effects of degumming parameters of the degumming stage on the stability of
refined palm oil. The raw palm oil used in the investigation was obtained from Adah palm Oil mill, Imo State, in the South
– Eastern province of Nigeria. The oil was characterized before and after refining and used in the investigation. Central
Composite Design,(CCD), a type of Response Surface Methodology (RSM), was used to optimize the process conditions of
degumming acid, contact time and process temperature. The result showed that quality of final product of palm oil
refining depends on the conditions of degumming, and on the nature of the degumming chemicals used. The degumming
was done at a temperature range of 40 to 120oC, and the optimum temperature was found to be 80
oC, at the contact time
of 40 minutes, and acid concentration of 1%. It was established that colour fixation during deodorization is mainly due to
the decomposition of the oxidation products of aldehydes and ketones at the deodorization temperature of 200oC and
above. The stability standard of the refined oil was however, measured in terms of colour,2.5 Red units, Free Fatty
Acid(FFA) 0.01%, Peroxide Value(PV) 2.8m.eq/kg, Anisidine Value(AV) 6.8m.eq/kg, Iodine Value(IV) 4.9, Iron (Fe) 4.3 x
103(Ppb), and Phosphorous content 0.03(mg/l), all of which were compared with those of the American Oil Chemist
Society (AOCS),[1].
KEY WORDS: Optimization, Degumming, Characterization, RSM, phosphotides, Stability.
1.0 INTRODUCTION In the past few years demand for refined vegetable oils has increased worldwide, Worldbook Encyclopedia,2001,
Gunstone,2002, and Rauken, 1993. This might be due to increase in world population, rising standard of living and
consumer preference. Vegetable oils find applications as cooking and frying oils, as well as in the manufacture of
margarine, shortening, baker’s fat, soap, grease, lubricants, creams, as well as biodiesel, Pahl, 2005, and hence the need to
stabilize its quality for these purposes.
Palm Oil fruit, is a monocotyledonous fruit obtained from oil palm (Elaeis Guinensis) found in abundance in the Eastern
part of Nigeria, Http://en.m.eikipedia.org/wiki/Vegetable_oil. It is 0.5 to 5mm long, and oval in shape and weighs about 6
- 8g on the average. The oil content of the fruit is about 50%,Mahatta, 1985, Nkpa et al 1989. Human beings have known
how to extract oils from their natural sources since ancient time, and make them fit for their use. The oils were consumed
crude, since very little treatment was done order than filtration or decantation. In Nigeria, palm oil is still consumed crude
Http://en.m.eikipedia.org/wiki/peroxide_value.
Two methods are used in the extraction of the oil in the recent times, namely mechanical expression and solvent
extraction Dawodu, 2009, and Egbuna and Aneke, 2005. The former is pressure dependent, while the latter works with
diffusion principles, making use of hexane as solvent, Egbuna et al, 2013(a). The oil contains considerable amount of
impurities like Free Fatty acid, carotene and chlorophyll pigments, phosphotides, odour, and oxidation products, which
are usually removed by refining, because they impart unpleasant odour and flavour to the finished product, per oxide
Egbuna 2013.
Two refining methods are available, Egbuna et al, 2013(b), and Belaw and Tribe, 1972; the chemical process, which
makes use of caustic lye to neutralize the FFA content, and the physical process, which came into use by the 20th
century,[7]. The latter was so much improved upon at the deodorization stage, with the effect of reduction in overall
processing cost.[12].
Practical experience has distinguished the two process routes. There is a substantial colour reduction at the neutralization
stage, and fuel savings on steam distillation of the chemical process, due to the moderate temperature applied to preserve

www.ijsret.org
959 International Journal of Scientific Research Engineering & Technology (IJSRET), ISSN 2278 – 0882
Volume 4, Issue 9, September 2015
the anti oxidants, sterol and tocopherol present in oil, Anderson, 1962. Capacity is also improved, and quality is assured.
The physical process offers advantages of improved deodorizer efficiency, low water consumption, reduced oil loss,
savings on chemical, manpower reduction, less corrosion and pollution tendencies, and equally high quality stability, and
hence its choice of the process method, [12].
Hoffman, 1989, had shown that bleaching stage of the refining of palm oil and the nature of the bleaching clay used play
a vital role in the stability of the finished product. Hymore and Ajayi, (1996), have also demonstrated that Local activated
Clay can effectively remove caroteniod from palm oil.
Many factors influence the stability of refined oils, and have been the subject of much study, Olaofe et al, 1994. Among
them are; type of raw oil, its colour, Phosphotides, Free fatty acid content, taste, and other physical and chemical
characteristics. To be refined, the raw oil has to be degummed, Egbuna et al, 2007, Mbah, and Njoku, 2007, and Ige, et al,
1984, bleached and deodorized in order to remove its objectionable properties,[3]. The degumming process is a well-
established operation in the processing of edible oils, and is one of the major stages for the stabilization of the refined oils.
All the colloidal and suspended particles, and soluble phosphotides would have been removed at this stage.
Anderson,1997, Danh et al,2009, and Ruddy, 2011, had, in one time or the other used design expert, statistical method or
applied RSM in their work to optimize the process conditions during extraction or refining of vegetable oils. NIST/
SEMATECH 2012, and Ejikeme et al 2013, had also used RSM to optimize the bleaching of Oil using a locally activated
clay.
In this work, we have;
shown how the stability of the refined palm oil is affected by the conditions under which the degumming is
carried out.
shown why degumming stage of palm oil refining remains a vital part of palm oil refining
demonstrated how an effective degumming stage can lead to good oil quality,
tried to optimize the degumming process parameters of time, Temperature and acid concentration, with a view to
obtaining the optimal values for the degummed palm oil.
2.0 EXPERIMENTAL 2.1 Materials/Equipment: The materials and equipment used in the investigation include; raw (crude) palm oil received
from Adah palm Industry, South Easter province of Nigeria[10], bleaching earth (Activated Ngwo clay), test chemicals,
titration apparati, a set of sieves, Lovibond Tintometer, Steam/vacuum apparatus, Distillation apparatus, conical flasks,
beakers, and test tubes, magnetic stirrer, and steam bath. Table 1 shows the physio-chemical properties of the palm oil
used in the investigation.
(a) Properties : The properties of the oil that were determined include, the PO4 (Ppm), FFA(%), PV(m.eq/kg),
AV(m.eq/kg), Colour, Fe(Ppb), etcetera, of the degummed, bleached and deodorized palm oil. This was done by using
the American Oil Chemists Society (AOCS) standard test methods. Their values are presented in Table 3.
(b) Sample : The crude and refined oil samples used for the stability tests were stored in full, glass bottles at 313K for 28
days. Colour, phosphorous, FFA , PV, and AV, were measured at intervals. The activated bleaching clay used was sieved
to 70 - 5 microns and the same sample was used throughout the experiment.
2.2 Experimental procedure:
(a) Degumming Process : Degumming of crude Palm oil was done to reduce the phosphotide so as to minimize the
foaming tendency of the finished product observed during frying. The experiment was done using Citric acid, phosphoric
acid and water, and the results compared with international values presented in Fig. 1
www.ijsret.org
960 International Journal of Scientific Research Engineering & Technology (IJSRET), ISSN 2278 – 0882
Volume 4, Issue 9, September 2015
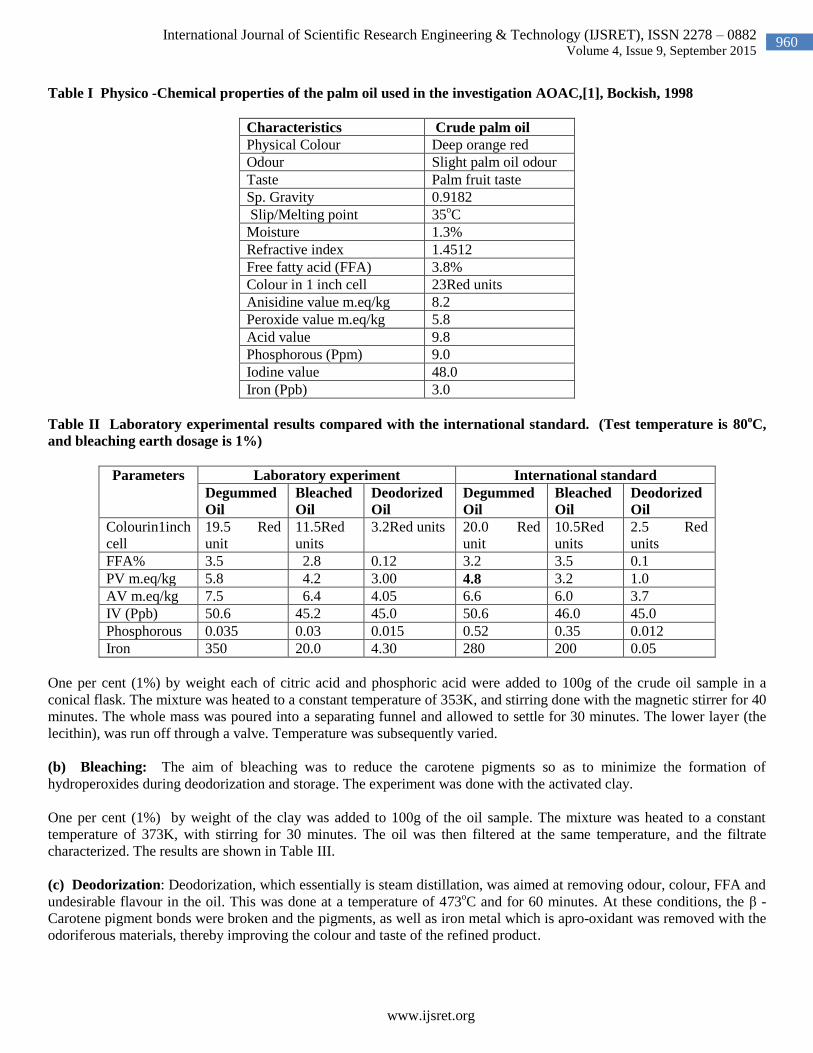
Table I Physico -Chemical properties of the palm oil used in the investigation AOAC,[1], Bockish, 1998
Characteristics Crude palm oil
Physical Colour Deep orange red
Odour Slight palm oil odour
Taste Palm fruit taste
Sp. Gravity 0.9182
Slip/Melting point 35oC
Moisture 1.3%
Refractive index 1.4512
Free fatty acid (FFA) 3.8%
Colour in 1 inch cell 23Red units
Anisidine value m.eq/kg 8.2
Peroxide value m.eq/kg 5.8
Acid value 9.8
Phosphorous (Ppm) 9.0
Iodine value 48.0
Iron (Ppb) 3.0
Table II Laboratory experimental results compared with the international standard. (Test temperature is 80oC,
and bleaching earth dosage is 1%)
Parameters Laboratory experiment International standard
Degummed
Oil
Bleached
Oil
Deodorized
Oil
Degummed
Oil
Bleached
Oil
Deodorized
Oil
Colourin1inch
cell
19.5 Red
unit
11.5Red
units
3.2Red units 20.0 Red
unit
10.5Red
units
2.5 Red
units
FFA% 3.5 2.8 0.12 3.2 3.5 0.1
PV m.eq/kg 5.8 4.2 3.00 4.8 3.2 1.0
AV m.eq/kg 7.5 6.4 4.05 6.6 6.0 3.7
IV (Ppb) 50.6 45.2 45.0 50.6 46.0 45.0
Phosphorous 0.035 0.03 0.015 0.52 0.35 0.012
Iron 350 20.0 4.30 280 200 0.05
One per cent (1%) by weight each of citric acid and phosphoric acid were added to 100g of the crude oil sample in a
conical flask. The mixture was heated to a constant temperature of 353K, and stirring done with the magnetic stirrer for 40
minutes. The whole mass was poured into a separating funnel and allowed to settle for 30 minutes. The lower layer (the
lecithin), was run off through a valve. Temperature was subsequently varied.
(b) Bleaching: The aim of bleaching was to reduce the carotene pigments so as to minimize the formation of
hydroperoxides during deodorization and storage. The experiment was done with the activated clay.
One per cent (1%) by weight of the clay was added to 100g of the oil sample. The mixture was heated to a constant
temperature of 373K, with stirring for 30 minutes. The oil was then filtered at the same temperature, and the filtrate
characterized. The results are shown in Table III.
(c) Deodorization: Deodorization, which essentially is steam distillation, was aimed at removing odour, colour, FFA and
undesirable flavour in the oil. This was done at a temperature of 473oC and for 60 minutes. At these conditions, the β -
Carotene pigment bonds were broken and the pigments, as well as iron metal which is apro-oxidant was removed with the
odoriferous materials, thereby improving the colour and taste of the refined product.

www.ijsret.org
961 International Journal of Scientific Research Engineering & Technology (IJSRET), ISSN 2278 – 0882
Volume 4, Issue 9, September 2015
1 liter of degummed oil was taken into the distillation equipment and pre - heated to a temperature of 373K. Steam was
generated by heating water in a around bottom flask and passed into the oil through a delivery tube. Temperature was then
increased to 473 K, and vacuum was applied by means of the vacuum pump and maintained at 20mmHg absolute.
Vaporized moisture, odoriferous matter, FFA, and colour pigments were condensed in the reflux condenser in which
water is used as a cooling medium. The condensate which was essentially Fatty acid , was collected in a beaker. This is a
batch process. The refined oil was then analyzed for FFA, colour, PV, AV, PO4 and Fe.
2.3 Characterization of degummed, bleached and deodorized oils, [1], Betiku et al., 2012.
The degummed, bleached and deodorized oil samples were subjected to analyses to determine their physical and
chemical properties. Among the properties determined, which will be reported here include; colour, FFA, PV,AV, PO4
and Fe contents
(a) Phosphorous: The phosphorous in the oil sample was determined by ashing. The phosphate obtained was transferred
into phosphomolybdate which was reduced to a blue- coloured compound . The concentration of the blue compound was
determined by comparison with blue colored glass disks.
Procedure: 5g oil sample was weighed into a platinum dish, and 0.5g calcium oxide added and both ashed. The ash was
dissolved in 10 - 15 cc of 2N hot dilute hydrochloric acid, and filtered into a 100cc volumetric flask. The dish was washed
into the volumetric flask and filtered, and, made up to 100cc. A blank experiment was similarly prepared, but with no oil
sample present. 5cc of the filtrate was taken in a tube and 2cc and 1cc of molybdate and hydroquinone solution added in
that order. The mixture was allowed to stand for 5 minute for the green phosphate colour to develop. 2cc of
carbonate/sulphate solution was quickly added and stirred, ( CO2 evolved). Both the test experiment and its blank were
placed in the comparator against a uniform light for comparison. The result was reported as ;
Phosphorous (Ppm) = 10000
326.05
Gxvx
xAxVx 1
Where A - comparator scale reading of PO4 (Ppm), V - Volume of ash solution, v - volume of ash solution taken for the
colour development, G - weight of oil sample.
(b) Colour pigments: Colour pigments present in Palm oil include; carotenoids, chlorophyll, and gossypol. The carotene
has been found to be an excellent indicator of crude oil quality.
Procedure: Lovibond Tintometer with 1-inch cell was used for the analysis of colour, and the latter read in terms of red
colour band that matched the colour of the refined oils.
(c) Free Fatty acid: Free fatty acid results from chemical or enzymatic hydrolysis of the fatty acid glycerides. Its
presence in oil sample is a measure of the quality of the crude and refined oils.
Procedure: 2.8ml of oil of known FFA, was measured into a conical flask and diluted with 25ml of ethanol. A drop of
phenolphthalein was added. This was titrated against 0.1N sodium hydroxide until a permanent pink colour was
registered, and the results recorded.
FFA(%) = W
VxMxN
10 2
Where, N - Normality of NaOH; V - Volume of NaOH; W - Weight of oil sample, M- Molecular weight of oil sample
used.
(d) Oxidation products: When an unsaturated fatty acid chain reacts with air at room temperature, (a process known as
autoxidation), hydroperoxides are formed. At high temperature, these peroxides break down to hydrocarbons, aldehydes
and ketones. These cleavage products impart odour and flavour to oil and must be removed.
(i) Peroxide Value; This is a measure of primary oxidation whose product is hydrocarbons. These hydrocarbons are
further oxidized to water, which causes rancidity of the oil on storage.

www.ijsret.org
962 International Journal of Scientific Research Engineering & Technology (IJSRET), ISSN 2278 – 0882
Volume 4, Issue 9, September 2015
Procedure: 30ml of chloroform - glacial ethanoic acid mixture in the volume ratio of 1:2 was transferred to a conical
flask connected to a reflux condenser. The mixture was then heated to boiling and the vapour condensed in the lower part
of a jacketed tube. When the reflux became steady, about 1.6 ml of potassium iodide was added from the top of the
condenser. The precipitate of KI was dissolved by adding 5 drops of water. The mixture was heated for 5 minutes and 2ml
of the oil was pipetted into the mixture through the top of the condenser also. The pipette was rinsed with 2ml of
chloroform into the boiling mixture, and boiling continued for 5 minutes. 50ml of distilled water was added, and 2ml of
the sample was then titrated with 0.02N thiosulphate solution, using starch solution as indicator. The result is reported as;
PV = G
VxNx1000 3
Where V - vol. of thiosulphate used (ml), N - normality of thiosulphate solution, and G - vol. of sample (ml)
(ii) Anisidine value; This measures the amount of secondary oxidation in a sample of oil. Its products are aldehydes and
ketones, whose oxidation induces higher rancidity effect to the oil.
Procedure; The procedure for analysis for AV is the same as in the PV, except that the temperature at which these
cleavage products are formed is higher.
(e) Iron (Fe): This is a metal element which, with copper, induces oxidation of the unsaturated fats and oils at the double
bond. Removal of iron will reduce the rate of oxidation reaction at the high temperature of deodorization.
Procedure: 0.2mg Fe stock solution was pipetted into 100ml conical flask. 10ml of 10% hydroxylamine hydrochloride
was added. The solution was diluted with water and mixed. 10ml of 0.25% phenolphthalein was added and allowed to
stand for 15 minutes and diluted to the mark. Using about 5ml test tube, the transmittance was read in spectrophotometer
20 at 510 UV light.
2.4 Optimization with CCD
Optimization of the factors for the degumming of palm oil using phosphoric acid was carried out using Central
Composite Design, a type of Response Surface methodology, RSM. The CCD had two factorial level with 3 numeric
factors, which also has 6 axial points and 6 centre points, Betiku, et al 2012. The factors and levels used for the CCD are
shown in Table IV, while the design matrix with the responses is shown in table V.
Table III, Factors and levels for the RSM (CCD)
Table IV Design matrix with responses for PO4 removal, (mg/l) Std Run Acid conc Time Temp. Response
Order Order (%) (mins) (oC) (mg/l)
3 1 1.00 40.00 40.00 0.1008
6 2 2.00 20.00 80.00 0.0541
2 3 2.00 20.00 40.00 0.1842
15 4 1.50 30.00 60.00 0.0612
10 5 2.50 30.00 60.00 0.191
5 6 1.00 20.00 80.00 0.0425
12 7 1.50 50.00 60.00 0.0542
1 8 1.00 20.00 40.00 0.1021
20 9 1.50 30.00 60.00 0.0946
Variable Units - -1 0 +1 +
Acid Conc. w/v(%) 0.05 0.10 0.15 0.20 0.25
Temperature oC 40 60 80 100 120
Contact time Min 20 40 60 80 100

www.ijsret.org
963 International Journal of Scientific Research Engineering & Technology (IJSRET), ISSN 2278 – 0882
Volume 4, Issue 9, September 2015
13 10 1.50 30.00 20.00 0.1375
11 11 1.50 10.00 60.00 0.0931
4 12 2.00 40.00 40.00 0.1785
9 13 0.50 30.00 60.00 0.0245
8 14 2.00 40.00 80.00 0.0456
18 15 1.50 30.00 60.00 0.0853
17 16 1.50 30.00 60.00 0.0784
14 17 1.50 30.00 100.00 0.0345
7 18 1.00 40.00 80.00 0.0329
19 19 1.50 30.00 60.00 0.0779
16 20 1.50 30.00 60.00 0.0759
3.0 DISCUSSION
3.1 Variation of degumming conditions
3.1.1 Temperature:
Table V presents the degummed oil colour, (Red unit), as a function of temperature. The subsequent deodorization colour
is shown when deodorized at constant temperature, while table V shows the stability results of storing the refined oil for
28 days.
Table V The effect of Degumming temperature on the Colour, PV, AV, FFA, PO4, and Fe of physically refined
palm oil.
Table VI The effects of degumming on the keeping quality of refined palm oil.
From table V, the degummed oil colour reduces as temperatures increases, with optimum at 80oC. The corresponding
bleached temperatures is optimized at the degumming temperature in the range of between 70 and 90oC, while the
deodorized temperature is optimized at a degumming temperature of 80 - 90oC. The peroxide value of the
Temp oC
Colour in 1 inch cell PV
m.eq/kg
AV
m.eq/kg
FFA
%
PO4
(Ppm) Fe
(Ppb) Degummed
Oil
Bleached
oil
Deodor
oil
40 21.2 14.2 3.8 6.8 3.5 0.62 0.83 8.1
50 20.8 13.8 3.6 6.5 3.55 0.61 0.65 8.0
60 20.6 13.5 3.5 5.3 3.72 0.58 0.48 7.8
70 20.3 13.3 3.2 5.0 3.85 0.55 0.22 7.3
80 20.2 12.6 3.0 4.2 3.92 0.38 0.15 6.8
90 20.4 12.7 2.9 2.0 4.00 0.40 0.18 5.0
100 20.5 13.0 2.8 1.12 4.20 0.43 0.20 4.3
110 20.8 13.2 3.0 1.50 9.8 0.48 0.25 4.2
120 21.0 13.3 3.8 1.28 12.4 0.52 0.28 4.0
Time(days) Colour (red), 1” Cell PV Deodorized oil
Degummed at
80oC
Degummed at
100oC
Degummed at
80oC
Degummed at 100oC
1 3.20 5.8 0.00 0.00
4 3.26 5.9 0.46 1.80
7 3.30 6.2 0.82 2.00
14 3.40 6.8 1.17 2.32
21 3.45 7.4 1.50 2.80
28 3.81 8.6 1.75 3.48

www.ijsret.org
964 International Journal of Scientific Research Engineering & Technology (IJSRET), ISSN 2278 – 0882
Volume 4, Issue 9, September 2015
degummed/bleached oil, is reduced as degumming temperature increases, but the rise in Anisidine Value is an indication
that oxidation products of aldehydes and ketones are not effectively removed at high temperature. This is confirmed on
storage as shown in Table V, when the PV of degummed oil rises more rapidly for oil degummed at 100oC than 80
oC.
The FFA, and PO4 are gradually reduced up to the degumming temperature of 80 oC, beyond which they start to rise
again. However, Fe continued to reduce even at the degumming temperature of 120oC.
Table VI, also, there is colour reversion during storage for deodorized oil degummed at any given temperature, but
reversion is much more when degummed at higher temperatures than 80oC. This gives a darker oil as shown by a sudden
change observed from the 14th day.
3.1.2 Chemical concentration : Figure 1 shows the effects of chemical concentration on the phosphorous content of
refined palm oil.
0.7
0.6
0.5
0.4
Ph
os
ph
oro
us
(m
g/l
)
Citric acid degumming
phosphoric acid degumming
0.4 0.8 1.2 1.6
Fig 1 The effects of chemical concentration on the phosphorous content of refined palm oil.
From the figure, it is observed that for any given degumming chemical, bleached oil colour continues to reduce as the
chemical concentration is increased. There appeared to be an optimum at a concentration of between 0.5 and 1.0%,
beyond which colour starts to rise again, and this colour is fixed at the high temperature of the deodorizer. However, it
was noticed that bleached oil colour reduces sharply when degummed with citric acid than phosphoric acid, but the
corresponding deodorized oil colour gives minimum with phosphoric acid than citric acid. It then means that best colour
reduction can be achieved at a concentration range of between 0.8 and 1.2 with optimum at 1.0%. However, H2PO4 offers
better colour reduction than citric acid.
3.1.3 Contact time : A contact time of 30 - 60 minutes at the degumming temperature, is enough to reduce the PV to
minimum. Beyond this time, the PV begins to rise, Fig.2. AV and PO4, decrease marginally, but AV reduces at a rate
greater than the PO4. The colour however, is not so much affected by prolonged contact time, provided the degummed oil
temperature is not beyond 80oC.
PV
AV
30 60 90 120 150 180 210
Time (Min.)
PV
, P
o4
AV
of
deg
um
. O
il m
.eq
/kg
25
20
15
10
5
PO4
Fig 2 The effects of contact time on the colour, PV, AV and PO4 of physically refined palm oil.

www.ijsret.org
965 International Journal of Scientific Research Engineering & Technology (IJSRET), ISSN 2278 – 0882
Volume 4, Issue 9, September 2015
3.2 Optimization of parameters
Numerical optimization was used to search the design space using the model created to find the factor setting that
met the desired goal of maximal removal efficiency. With 20 solutions founds (table V), the optimal conditions were
selected based on the highest desirability. The optimum conditions are: Acid concentration of 1%, Contact time of 40 min.
and Process temperature of 80oC The optimum conditions were validated by repeating the degumming at the predicated
optimum conditions.
3.2.1 Analysis of Variance (ANOVA)
Analysis of variance is a method of dividing the variation observed in experimental data into different parts, each
attributable to a known source. It shows if the factor or models in the experiments are significant, the result is shown in
table VII.
Table VIII, ANOVA Table
Sum of Mean of F- P- value
Source Squares df Square Value Prob > F
Model 0.042 4 0.010 25.43 < 0.0001
A-Acid concent 0.017 1 0.017 40.57 <0.0001
B-Contact time 6.618E-004 1 6.618E-004 1.61 0.2243
C-Temperature 0.022 1 0.022 53.98 <0.0001
AC 2.295E-003 1 2.295E-003 5.57 0.0322
Residual 6.179E-003 15 4.119E-004
Lack of Fit 5.568E-003 10 5.568E-004 4.56 0.0540
Pure Error 6.110E-004 5 1.222E-004
Cor Total 0.048 19
The Model F-value of 25.43 implies the model is significant. There is only a 0.01% chance that a "Model F-Value" this
large could occur due to noise. Values of "Prob > F" less than 0.0500 indicate model terms are significant. In this case A,
C, AC are significant model terms. Values greater than 0.1000 indicate the model terms are not significant. The "Lack of
Fit F-value" of 4.56 implies there is a 5.40% chance that a "lack of Fit F- value" this large could occur due to noise.
R-Squared 0.8715
Adj R-Squared 0.8372
Pred R-Squared 0.7400
Adeq Precision 16.509
The "Pred R-Squared" of 0.7400 is in reasonable agreement with the "Adj R-Squared" of 0.8372. "Adeq Precision"
measures the signal to noise ratio. A ratio greater than 4 is desirable. The ratio of 16.509
indicates an adequate signal. This model can be used to navigate the design space.
3.2.2 Model Equations
Final Equation in Terms of Coded Factors:
Phosphorus (mg/l) = 0.087 + 0.032*A - 6.431E-003*B -0.037*C - 0.017*A*C …………………4
Final Equation in Terms of Actual Factors:
Phosphorus = - 0.030816 + 0.16626*Acid conc - 6.43125E - 004*Contact time + 6.76563E-004*Temp.
-1.69375E-003*Acid conc*Temp. ………………………………………………………5

www.ijsret.org
966 International Journal of Scientific Research Engineering & Technology (IJSRET), ISSN 2278 – 0882
Volume 4, Issue 9, September 2015
3.2.3 Model Validation
Table VIII Validation
Standard Actual Predicted
Order Value Value Residual 1 0.10 0.082 0.020
2 0.18 0.18 3.791E-003
3 0.10 0.069 0.032
4 0.18 0.17 0.011
5 0.043 0.041 1.291E-003
6 0.054 0.072 -0.018
7 0.033 0.028 4.554E-003
8 0.046 0.059 -0.014
9 0.025 0.023 1.697E-003
10 0.19 0.15 0.039
11 0.093 0.10 -7.203E-003
12 0.054 0.075 -0.020
13 0.14 0.16 -0.025
14 0.035 0.013 0.022
15 0.061 0.087 -0.026
16 0.076 0.087 -0.012
17 0.078 0.087 -9.040E-003
18 0.085 0.087 -2.140E-003
19 0.078 0.087 -9.540E-003
20 0.095 0.087 7.160E-003
To validate the model equations obtained for adequacy in predicting response, residual plots were used.
ANOVA assumed that residuals were independent of each other and are distributed according to a normal distribution
with constant variance. This is shown in table IX, where the predicted, actual and residual values were given according
the standard order
3.2.4 Normal Plot of Residuals
Design-Expert® SoftwarePhosphorus (mg/l)
Color points by value ofPhosphorus (mg/l):
0.191
0.0245
Internally Studentized Residuals
No
rm
al
% P
ro
ba
bil
ity
Normal Plot of Residuals
-2.00 -1.00 0.00 1.00 2.00 3.00
1
5
10
20
30
50
70
80
90
95
99
Fig. 3 Normal Plot of Residuals
The normal probability plot indicates whether the residuals follow a normal distribution, in which case the points
will follow a straight line. Some moderate scatter, even with normal data were observed. Definite patterns like an "S-
shaped" curve, which indicates a transformation of the response may provide a better analysis. This is shown in Fig. 3.

www.ijsret.org
967 International Journal of Scientific Research Engineering & Technology (IJSRET), ISSN 2278 – 0882
Volume 4, Issue 9, September 2015
3.2.5 Residuals vs Predicted Plot.
The plot is shown in Fig. 4
Design-Expert® SoftwarePhosphorus (mg/l)
Color points by value ofPhosphorus (mg/l):
0.191
0.0245
Predicted
Inte
rna
lly
Stu
de
nti
ze
d R
es
idu
als
Residuals vs. Predicted
-3.00
-2.00
-1.00
0.00
1.00
2.00
3.00
0.00 0.05 0.10 0.15 0.20
Fig. 4 Residuals vs Predicted Plot
This is a plot of the residuals versus the ascending predicted response values. It tests the assumption of constant
variance. The plot should be a random scatter (constant range of residuals across the graph.) Expanding variance
("megaphone pattern <"), in this plot indicates the need for a transformation, Fig. 4.
3.2.6 Residuals vs Run
Design-Expert® SoftwarePhosphorus (mg/l)
Color points by value ofPhosphorus (mg/l):
0.191
0.0245
Run Number
Inte
rna
lly
Stu
de
nti
ze
d R
es
idu
als
Residuals vs. Run
-3.00
-2.00
-1.00
0.00
1.00
2.00
3.00
1 4 7 10 13 16 19
Fig. 5 Residuals vs Run order
This is a plot of the residual versus the experimental run order. It allows for a chech to be made for lurking variables that
may have influenced the response during the experiment. The plot showed a random scatter. Trends indicate a time –
related variable lurking in the background. Blocking the randomization provides insurance against trends ruining the
analysis.

www.ijsret.org
968 International Journal of Scientific Research Engineering & Technology (IJSRET), ISSN 2278 – 0882
Volume 4, Issue 9, September 2015
3.2.7 Predicted vs Actual
Design-Expert® SoftwarePhosphorus (mg/l)
Color points by value ofPhosphorus (mg/l):
0.191
0.0245
ActualP
re
dic
ted
Predicted vs. Actual
0.00
0.05
0.10
0.15
0.20
0.00 0.05 0.10 0.15 0.20
Fig. 6 Predicted vs Actual
Figure 6, is the graph of the actual response values versus the predicted response values helps to detect a value, or
group of values, that are not easily predicted by the model. The data points should be split evenly by the 45 degree line
3.3 Model Graphs
(a) One Factor Plots
The One Factor Plots of Acid concentration, Contact Time and Process temperature, are shown in Fig. 7
Design-Expert® SoftwareFactor Coding: ActualPhosphorus (mg/l)
CI BandsDesign Points
X1 = A: Acid concentr
Actual FactorsB: Contact time = 30.00C: Temperature = 60.00
1.00 1.20 1.40 1.60 1.80 2.00
A: Acid concentr
Ph
os
ph
oru
s (m
g/l)
0
0.05
0.1
0.15
0.2Warning! Factor involved in AC interaction.
22
One Factor

www.ijsret.org
969 International Journal of Scientific Research Engineering & Technology (IJSRET), ISSN 2278 – 0882
Volume 4, Issue 9, September 2015
Design-Expert® SoftwareFactor Coding: ActualPhosphorus (mg/l)
CI BandsDesign Points
X1 = B: Contact time
Actual FactorsA: Acid concentr = 1.50C: Temperature = 60.00
20.00 25.00 30.00 35.00 40.00
B: Contact time
Ph
os
ph
oru
s (
mg
/l)
0
0.05
0.1
0.15
0.2
22
One Factor
Design-Expert® SoftwareFactor Coding: ActualPhosphorus (mg/l)
CI BandsDesign Points
X1 = C: Temperature
Actual FactorsA: Acid concentr = 1.50B: Contact time = 30.00
40.00 48.00 56.00 64.00 72.00 80.00
C: Temperature
Ph
os
ph
oru
s (
mg
/l)
0
0.05
0.1
0.15
0.2Warning! Factor involved in AC interaction.
22
One Factor
Fig. 7 Model plots of Acid concentration, Contact Time and Process temperature
Fig. 7, shows the effects of the process variables on the degumming efficiency of the Phosphotic acid. It can be
seen that the three factors of acid concentration, time and temperaturehad serious effects on the degumming efficiency of
the acid. It therefore means that as the values of the factors increased, the removal efficiency is affected. . Fig. 7 (a),
shows that the removal efficiency of phosphorous continues to increase as the acid concentration is increased.
This could be attribited to the high surface area available foe adsorption. There tend to be no limit to acid concentration
but sound jugement is to stop concentration increase at the optimum point when any additional increase did not result to a
corresponding removal of PO4 In Fig 7 (b), PO4 removal also increased with time, as noted by Egbuna et al 2009. This is
because, according to [12], phosphorous removal is affected by the resident time, which in turn is affected by temperature.
The effect of temperaturee on removal efficiency of PO4 is shown in Fig.7(c). As shown, the removal efficiency reduces
with increase in temperature. It follows then that the higher the process temperature, the higher the removal efficiency,
until the optimum temperature of 80oC is reached.
(b) Two Factors
The Interacting effects of Acid concentration and temperature of the process, is shown in figure 8

www.ijsret.org
970 International Journal of Scientific Research Engineering & Technology (IJSRET), ISSN 2278 – 0882
Volume 4, Issue 9, September 2015
Design-Expert® SoftwareFactor Coding: ActualPhosphorus (mg/l)
Design Points0.191
0.0245
X1 = A: Acid concentrX2 = C: Temperature
Actual FactorB: Contact time = 30.00
1.00 1.20 1.40 1.60 1.80 2.00
40.00
48.00
56.00
64.00
72.00
80.00
Phosphorus (mg/l)
A: Acid concentr
C:
Te
mp
era
ture
0.05
0.1
0.15
6
Fig. 8, Interacting effects of Acid concentration and process temperature.
Fig. 8 gives the interacting effect of acid concentration and temperature on the PO4 removal efficiency with
H2PO4. It is observed that as acid concentation is increased at both low and high Temprature values, the removal
efficiency is increased.
(c) 3D Plot
The 3D plot of the interacting effect is shown in Figure 9
Design-Expert® SoftwareFactor Coding: ActualPhosphorus (mg/l)
Design points above predicted valueDesign points below predicted value0.191
0.0245
X1 = A: Acid concentrX2 = C: Temperature
Actual FactorB: Contact time = 30.00
40.00
48.00
56.00
64.00
72.00
80.00
1.00
1.20
1.40
1.60
1.80
2.00
0
0.05
0.1
0.15
0.2
P
ho
sp
ho
ru
s (m
g/l)
A: Acid concentr C: Temperature
Fig. 9, 3D plot of acid concentration and temperature.
The 3D plot of the interactive effect of acid concentration and temperature is shown in Fig. 9. The result
confirmed that the model is linear. The surface is sloppy showing that the removal efficiency was reduced as the
temperature and acid concentration were reduced, and the maximum efficiency was obtained at the moderate values of
both factors.
4.0 CONCLUSION
The optimal process parameters on the degumming of palm Oil, with Phosphoric acid has been investigated.
Response Surface Methodology, a type of Central Composite Design, was successfully applied in the experimental design
in order to study the effect of the key parameters of Time, Temperature and acid concentration on the degumming

www.ijsret.org
971 International Journal of Scientific Research Engineering & Technology (IJSRET), ISSN 2278 – 0882
Volume 4, Issue 9, September 2015
efficiency, and the conditions for the optimal degumming efficiency were found to be, time, temperature and Acid
concentration of, 40min. 80oC and 1% by weight acid concentration, respectively, with phosphorus of 0.0283463mg/l in
the degummed oil. The predicted concentration of 0.28% has a good correlation with the actual value of 0.033%.
Validation was done by repeating the experiments at the predicted optimum conditions as shown in table VIII. The results
obtained from the optimization of the degummed Palm oil parameters showed that the degumming efficiency is linearly
affected by Concentration of degumming acid, and contact time, and quadratic dependent on degumming temperature, as
these can be interpreted from graph and chart shown above. Concentration, and Contact time invariably increase the
degree of degumming PO. The good correlation between the predicted and experimental values shows that the method
adopted is good enough for the process and that the process variables of acid concentration, contact time, and temperature
were significant. The results obtained, have demonstrated that the quality and stability of finished palm oil product, can be
greatly influenced by the degumming stage. Variation of the degumming conditions has shown how temperature,
degumming chemicals and time conditions can affect the stability of the final product.
5.0 REFERENCES
[1]Official Methods and Recommended Practices of AOCS, Edited by David Firestone, 2013, 6th edition; ISBN978 – 1 –
893997 – 74 - 7
[2] The Worldbook Encyclopedia, 2001, Vol.14 Pp707, Worldbook Inc. Chikago
[3] Gunstone, F. D., 2002, Vegetable Oils in food Technology Composition, Properties and Uses, Pp 278 – 308,
Blackwell Publishing Ltd. U.K.
[4] Rauken, M.D., Kill, R.C., 1993, Fats and Fatty foods; Food Industries manual, 3rd
ed. Pp288 – 327; Longman
Inc.London.
[5] Pahl G., 2005, Biodiesel growing a new energy economy, White River Junction VT; Chelsea
Green Publishing Co.
[6] Http://en.m.eikipedia.org/wiki/Vegetable_oil
[7] Mahatta T. L. (1985), “Technology of refining of oils and fats,” Small business publications, (SBP), building, 4/45
Roop Nagar, Delhi.
[8] Nkpa N.N; Akpan H.Y; Arowolo T.A; 1989, Quality of Nigerian Palm Oil after bleaching with Local treated clays; J.
AOCS, 66 218 – 222.
[9] Http://en.m.eikipedia.org/wiki/peroxide _value
[10] Dawodu, F.A., 2009, Physico-chemical studies of oil Extraction Processes from some Nigerian grown
plantSeeds., Electronic Journal of Environmental, Agricultural and Food Chemistry *(2) Pp102 – 110.
[11] Egbuna S.O; Aneke N. A. G. 2005, “Evaluation of the Quality Stability in a Physically Refined Palm Oil”,
Proceedings of the 35th Annual Conference and AGM of the NSChE, Kaduna,146 – 152.
[12] Egbuna S.O, Ujam A.J, Ejikeme M. E; 2013, Comparative Analysis Of Diffusion Rates In Palm Oil Extraction
Using Different Extraction Solvents, ARPN journal of science and technology, Vol 3 no 10, 1079 – 1089.
[13] Egbuna, S.O., 2010, Design of an oil Extractor and optimization of of Process conditions for
Vegetable oil Refining, Unpublished Ph.D Thesis, Dept. Of Chemical Engineering, Enugu State
University of Sc. and Technology, Enugu, Nigeria

www.ijsret.org
972 International Journal of Scientific Research Engineering & Technology (IJSRET), ISSN 2278 – 0882
Volume 4, Issue 9, September 2015
[14] Egbuna S.O; Ozonoh M; Aniokete T .C; 2013, Diffusion Rate Analysis In Palm Kernel Oil Extraction Using
Different Extraction Solvents. International Journal of Research in Engineering and Technology, V0l 2 issue 11, 639 –
648.
[15] Belaw D. B., Tribe G. K., 1972 ,Activated Clay In Palm Oil Refining, And Its Effects On Trace
Metal Contaminants”, Laporte, Malaysia, SON.BHD..
[16] Anderson A.J.C. (1962), “Refining of oil for edible purposes,” 2nd ed. Pergamon Press London.
[17] Hoffman G. (1989), “The Chemistry and Technology of edible oils and fats and their high far products,” Academic
Press, New York.
[18] Hymore F.K; Ajayi A.F. (1989), “Use of Local Clay in the Refining of Palm Oil”, J. NSChE, Vol. 8, No 2
[19] Olaofe, O., Adeyemi, F.O., and Adediran, G.O., 1994,Amino Acid, Mineral Composition and Functional Properties
of some oilseeds., J.Agric. Food Chemistry., 42, 878 – 881
[20] Egbuna S.O; Aneke N.A.G; Chime T. O; 2007, Evaluation Of The Effects Of Degumming On The Quality And
Stability Of Physically Refined Palm Oil; Journal of Engineering and Applied Science, Vol 3 P 102 - 107
[21] Mbah, G.O. and njoku C.C.,2007, Effects of process conditions on the yield of oil from African Oil Bean Seed,
(Pentaclethra Macrophylia), Proceedings of the 37th Annual conference of the Nigeria Society of Chemical Engineers,
Enugu, Pp250 – 253.
[22] Ige, M.N., Ogunsua, A.O., and Okon, O.L., 1984, Functional properties of some Nigera Oil Seeds; Casophor Seeds
and Three Varieties of some Nigeria Oil seeds; Food Chemistry 33: 822 - 825.
[23] Andeson, M., 1997, Design of Experiment; American Institute of Physics. The Industrial Physicist Pp 24
[24] Danh, L.T., Mammucari, R., Truong, P. and Toster, N., 2009, RSM Applies to Supercritical Carbondioxide
Extraction of Vetiveria Zizaniodes Essential oil; Chemical Engineering Journal, 155: 617 – 626.
[25] Ruddy, K.2011, Ckecking Assumptions about Residuals in Regression Analysis, The Minitab Blog.
[26] NIST/SEMATECH e – Handbook of Statistical method,2012.
[27 Ejikeme E. .M, Egbuna S.O., and Ejikeme P.C.N (2013), optimal Performance of Acid Activated Ngwulangwu clay,
International journal of Engineering and innovative technology, pp 13-19
[28]. Bockish, M., 1998, Fats and Oils Handbook Pp95 – 96, Champaign, IL: AOCS Press.
[29] Betiku, E., Adepoju, T.F., and Aluko, S.E., 2012, Optimization of oil extraction from Beni Seed (Sesamum Indicum
L), Oil Seed using Response Surface methodology, (RSM) and Quality
Characterization; Abstract Submitted to 5th Workshop on Fats and Oils as Renewable Feedstock for the Industry
[30] Egbuna S.O; Aneke N.A.G; Chime T. O; 2009, Investigation Of The Effects Of Bleaching Clay Particles On The
Quality And Stability Of Physically Refined Palm Oil; Journal of Engineering and Applied Science, Vol 5 P 8 – 14.