Embed Size (px)
Citation preview

Optimization of Multi-package Drone Deliveries Considering Battery Capacity 1
2
Youngmin Choi 3
Graduate Student 4
Department of Civil and Environmental Engineering, 1173 Glenn Martin Hall 5
University of Maryland, College Park 6
E-mail: [email protected] 7
8
Paul M. Schonfeld, Ph.D. (Corresponding Author) 9
Professor 10
Department of Civil and Environmental Engineering, 1173 Glenn Martin Hall 11
University of Maryland, College Park 12
E-mail: [email protected] 13
14
15
16
17
18
19
20
21
22
Word Count: 6,789 =4,789 Words + 250 * 8 Figures and Tables 23
(Including abstract and references) 24
Submission Date: August 1, 2016 25
26
Paper Submitted for Presentation at the 2017 TRB 96th Annual Meeting 27

ABSTRACT 1
Drone delivery has been tested by private companies around world. With advanced safety and 2
reliability features, such as automated flight and sense-and-avoid technology to prevent 3
collisions, it appears that deliveries by drone will soon be practical. This paper deals with an 4
automated drone delivery system, rather than cooperative delivery by drones and trucks. The 5
study assumes that a drone can lift multiple packages within its maximum payload and serve 6
recipients in a service area of given radius. Battery capacities, the primary energy sources for 7
drone operation, are analyzed to relate parcel payloads and flight ranges. Numerical analysis is 8
used to optimize the drone fleet size for a service area, by minimizing the total costs of the 9
delivery system. Four variables are explored to show the sensitivity of system outputs to input 10
parameters: working period, drone operating speed, demand density of service area, and battery 11
capacity. Extended daily working periods are shown to benefit both service providers and users. 12
Increased drone operating speed reduces overall costs, but increases operating and investment 13
costs for suppliers. The study indicates that drone deliveries are more economical in areas with 14
high demand densities. Lastly, the large amount of energy storage resulted from battery 15
improvement can reduce the number of drones satisfying all demands in a service area. 16
17
18
19
20
21
22
23
24
25
26
27
28
29
30
31
32

INTRODUCTION 1
Drones are already widely used in industries, leisure activities and academia (1). These drones 2
are equipped with various sensors, including GPS and wireless communication, which enable 3
them to perform special functions, such as automated flight, object tracking, and collision 4
avoidance. 5
One of the promising drone applications in transportation fields is parcel delivery service, 6
either solely by drones or in collaborative operation with trucks. This application is largely 7
investigated in the private domain, and recent achievements have shown its feasibility. For 8
example, several companies, including Amazon.com, Inc. in the U.S., DHL in Germany, and 9
Alibaba in China have been working on deliveries by drones. Amazon, an electronic commerce 10
company, announced the latest prototype of its Amazon Prime Air drone in November, 2015. 11
The prototype drone can fly up to 15 miles with a maximum speed of 50 miles/hour (MPH) and 12
carry packages weighing less than five pounds. (1 mile = 1.61 km, 5 lb = 2.27kg.) Amazon 13
announced that over 86 percent of its items can be delivered by drones. In addition to delivery by 14
drones, ground robots have been introduced for deliveries. In March 2016, Domino’s pizza 15
introduced the autonomous ground delivery vehicle as a world first for delivering a maximum of 16
ten pizzas to customers located within 12 miles. Thus, for such applications, autonomous 17
delivery service is expected to be practical. 18
In comparison to ground delivery services, deliveries by drones are considerably restricted by 19
drone range and payload because most drones are powered by lithium-ion batteries, which 20
currently only allow about a half hour of flight. It is crucial to consider those characteristics and 21
examine the operating variables in the overall operation process. Otherwise a decision may result 22
in overestimating or underestimating capital requirements. Improvements in batteries or larger 23
drones can improve performance, i.e. range and/or payload. 24
The study focuses on parcel delivery service solely served by drones simultaneously lifting 25
multiple lightweight packages and optimizes the number of drones to satisfy a desired service 26
level. For analysis purposes, characteristics of drones and the baseline for service properties and 27
service area are preset. All demands are served from a single distribution depot. The specified 28
variables are explored through sensitivity analyses. These tests identify the critical factors 29
contributing to total costs of a drone delivery system. Several factors that may affect actual 30
applications, such as weather conditions, government regulations, and safety issues (e.g. drones 31
should fly below 500 feet and below 100mph), are not yet considered here. 32

1
Figure 1 Drone Delivery and Robot Delivery 2
(Left: Amazon Prime Air, Right: Domino's Robotic Unit) 3
The following section briefly summarizes the relevant research on drone applications in 4
transportation and delivery services. In the methodology part, variables are specified that 5
describe service area and drones, as well as relations among flight range, payload, and battery 6
capacity. Based on the initial settings, the drone delivery model is constructed, and numerical 7
analysis is conducted. Then, tests are conducted to determine the sensitivity of results to some 8
important factors. Finally, conclusions and future extensions for drone delivery research are 9
presented. 10
LITERATURE REVIEW 11
Applications of drones in transportation have focused on collecting traffic parameters: traffic 12
counts, queue lengths at the signalized intersections, incident detection (2) and estimation of 13
vehicle speeds on freeways using computer vision algorithms (3). Since package delivery by 14
drones has been discussed as a new business model since at least 2013, a few studies considered 15
the characteristics of drones, individual drone movements supported by trucks, and 16
environmental impacts. 17
Mathew et al (5) set two scenarios for drone delivery. A distribution depot dispatched drones 18
supported by a truck, and delivery service was solely operated by drones departing from multiple 19
centers. Each case was analyzed using the Traveling Salesman Problem (TSP) algorithm. Their 20
results suggested that delivery supported by trucks reduced delivery time by 35 percent 21
compared to a truck-only system. 22
Murry and Chu (6) applied TSP to cooperative deliveries by drone and truck. Two scenarios 23
were set: the first scenario was a truck with a drone, where the drone was launched from the 24
truck when demand points were located further or packages exceeded the drone’s allowable 25
payload. The second scenario analyzed deliveries by drones serving demand points near a 26
distribution center. Murry’s team showed how the operating speed of drones reduced delivery 27
times. 28
Welch (7) conducted a cost and benefit study of drone delivery service with a numerical 29
analysis using demographic and geographic information from the city of Chattanooga in 30

Tennessee. The author concluded that a package delivery by drones required 17 times less capital 1
investment than delivery solely by truck. 2
Toy and Goodchild (8) compared delivery-by-drone with delivery-by-truck in terms of CO2 3
emissions and VMT (Vehicle Miles Traveled). The authors used the U.S. county network 4
database for representing the customer’s location. Emission rates for truck were estimated by 5
vehicle year and speed. The rates for drones were transformed from the amount of energy 6
required for a battery charge into CO2 emissions from electricity power generation. Drone 7
delivery emitted less CO2 than trucks when service zones were located close to the center or had 8
few customers, while VMT’s were higher for drones than trucks. The authors suggested that 9
drones and trucks collaborate in deliveries for the environment’s sake, where drones deliver 10
parcels to nearby recipients while trucks deliver to more remote customers. 11
In summary, most of the studies found have considered drone delivery as a partly automated 12
service in which trucks are responsible for line-haul and heavyweight packages. This is mainly 13
because today’s technologies are not fully ripe for autonomous delivery in terms of parcel 14
payload and drone flight range. However, difficulties also exist for hybrid delivery services. For 15
instance, they may require the synchronization of drone landings on moving trucks. This process 16
requires highly accurate sensors, which may increase the costs of drones. Some researchers tried 17
to incorporate battery capabilities within their models, but no studies treated battery power as a 18
way of expressing physical constraints, such as flight range. These motivate the present paper, 19
which analyzes fully autonomous drones delivering multiple packages, while considering battery 20
capacity. 21
METHODOLOGY 22
The following sections discuss the characteristics of drones and their service properties. We 23
formulate a total cost function for this delivery system and find the number of delivery vehicles 24
that minimizes the system’s total cost. A service area is the region in which demands are 25
generated and served by a fleet of drones, each of which can lift multiple packages, from a single 26
distribution facility. Most input variables for delivery vehicles are adapted from specifications 27
provided by drone manufactures. Other baseline numerical values, such as the service zone size 28
and drone operating speed, originate from Amazon.com (13). 29
Baseline Numerical Values 30
Symbol Variable Units Baseline Value Range
Ct Total Cost $ / day - -
Ccp Capital Cost $ / day - -
Cop Drone Operating
Cost $ / day - -
Cudc Delivery Waiting
Cost $ / day - -
Ndr Number of Drone vehicle - -
Nbattery Number of Batteries units / vehicle - -
Npack Number of Packages package / vehicle - 1 - 13

(1 package = 0.5 kg)
Ntrip Daily Trip trips / (vehicle day) - -
D Average TSP
distance km - -
L Line-haul Distance km 8 -
A Zone Area km2 196π
- (16km radius)
Q Demand Density packages / km2 / hr 1 0.1 – 5
W Working Period hrs 6 3 - 24
V Drone Speed km / hr 50 30 -
110
Trt Average Round-trip
Delivery Time
hrs / vehicle round-
trip - -
Tdwell Dwell Time hrs / parcel 0.03 -
Treplenish Replenishment Time hr / trip 0.5 -
uc Unit Delivery Cost $ / package - -
dr Drone Cost $ / vehicle 3000 -
bcc Battery Charge Cost $ / battery 0.012 -
bc Battery Cost $ / unit 150 -
in Indirect Cost $ / package 0.5 -
hd Handling Cost $ / package 1 -
wgt Drone Weight kg 10 -
v User Value of Time $ / (package hr) 1 -
I Interest Rate % 6.5 -
Y Life Span for Drone year 3 -
cyc Life Cycle for
Batteries time 500 -
Table 1. Variable Definitions 1
Demands of a service area are determined by multiplying demand density (Q), zone area (A), 2
and time unit, where the time unit is set as one day. Those demands are served during the 3
working period and assumed to be uniformly generated over time and space. Payload refers gross 4
weight of parcels, and each parcel weights 0.5kg in this study. The number of packages (Npack) is 5
the average number of packages lifted by delivery vehicles within the maximum allowable 6
payload, where the combined mass of battery and parcels should be less than 2/3 of the total 7
vehicle mass (wgt) (4); this value is set for multi-package drones. More details about the baseline 8
value for Npack are discussed in the next section. Next, dwell time (Tdwell) includes a series of 9
operations in delivering parcels, such as take-off, landing, unloading, accelerating, and 10
decelerating, and these take several minutes per demand point. After the deliveries are completed, 11
the vehicle must return to the depot and go through a series of processes (Treplenish), such as 12
battery replacement or recharge, inspection, and parcel replenishment for the next trip. Daily 13
trips (Ntrip) is the average number of tours made by the vehicle during the daily working period, 14
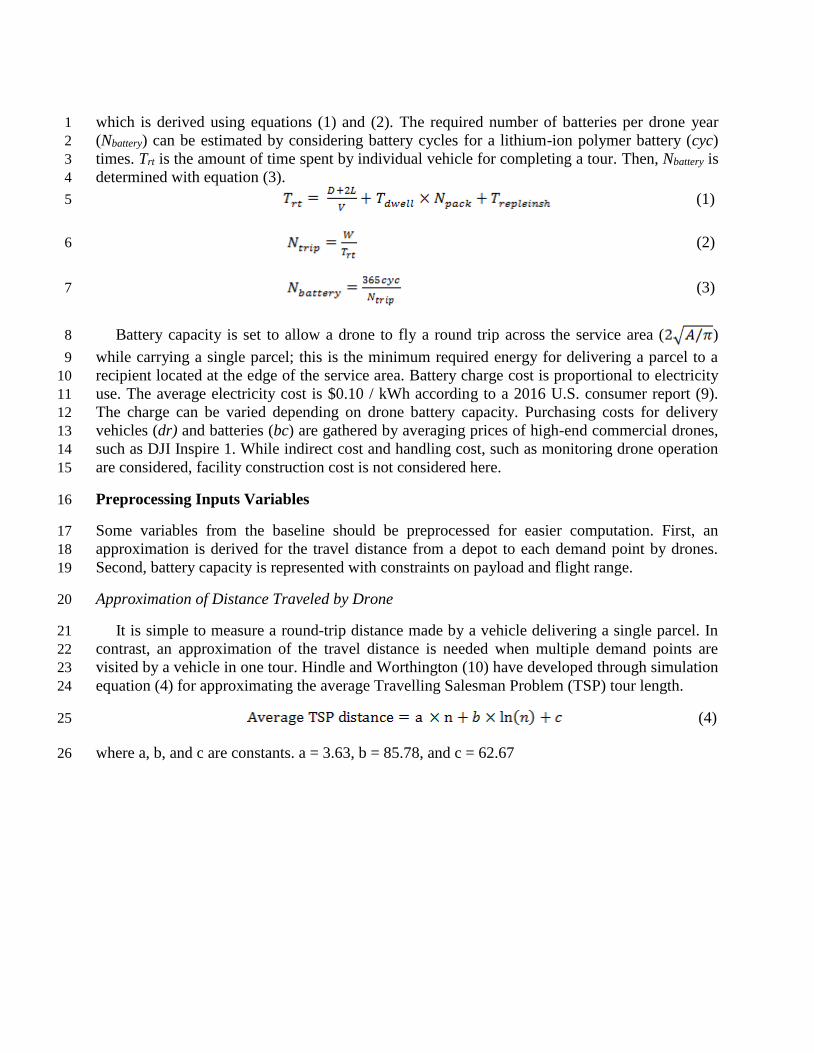
which is derived using equations (1) and (2). The required number of batteries per drone year 1
(Nbattery) can be estimated by considering battery cycles for a lithium-ion polymer battery (cyc) 2
times. Trt is the amount of time spent by individual vehicle for completing a tour. Then, Nbattery is 3
determined with equation (3). 4
(1) 5
(2) 6
(3) 7
Battery capacity is set to allow a drone to fly a round trip across the service area ( ) 8
while carrying a single parcel; this is the minimum required energy for delivering a parcel to a 9
recipient located at the edge of the service area. Battery charge cost is proportional to electricity 10
use. The average electricity cost is $0.10 / kWh according to a 2016 U.S. consumer report (9). 11
The charge can be varied depending on drone battery capacity. Purchasing costs for delivery 12
vehicles (dr) and batteries (bc) are gathered by averaging prices of high-end commercial drones, 13
such as DJI Inspire 1. While indirect cost and handling cost, such as monitoring drone operation 14
are considered, facility construction cost is not considered here. 15
Preprocessing Inputs Variables 16
Some variables from the baseline should be preprocessed for easier computation. First, an 17
approximation is derived for the travel distance from a depot to each demand point by drones. 18
Second, battery capacity is represented with constraints on payload and flight range. 19
Approximation of Distance Traveled by Drone 20
It is simple to measure a round-trip distance made by a vehicle delivering a single parcel. In 21
contrast, an approximation of the travel distance is needed when multiple demand points are 22
visited by a vehicle in one tour. Hindle and Worthington (10) have developed through simulation 23
equation (4) for approximating the average Travelling Salesman Problem (TSP) tour length. 24
(4) 25
where a, b, and c are constants. a = 3.63, b = 85.78, and c = 62.67 26

1
(a) Average TSP Trajectory with Single Delivery Drone 2
3
(b) Trajectories Allocated to Multiple Delivery Drones 4
Figure 2 Trip Distances for Delivery Drones 5
Equation (4) estimates average route distance travelled by a single vehicle visiting all demand 6
points in Figure 2 (a). For drone delivery, the estimated distance should be divided by multiple 7
delivery vehicles since limited battery energy storage restricts longer trips for the vehicles. 8
Hence, flight distance for individual vehicles is derived by dividing average TSP distance by the 9
number of drones (Ndr) as equation (5). 10
(5) 11
Total flight distance estimated from equation (4) and (5) are not exactly the same in that the 12
latter distance is longer. It is assumed that both distances are the equal. 13
Flight Range and Payload Associated with Battery Capacity 14
The Breguet range equation in the field of Aeronautics (11) specifies a relation between the 15
flight range and payload of aircraft. This equation assumes that the weight of aircraft keeps 16
decreasing as fuel is consumed, which is not applicable to battery-powered vehicles. For drones, 17
the battery capacity determines the maximum flight range. Hence, we must define the relation 18
between payload and flight range in terms of the capacity. D’Andrea (4) formulated drone 19

energy consumption considering various factors, such as air resistance, battery cost, life cycle, 1
and cost of electricity usage, as shown in equation (6): 2
(6) 3
(7) 4
where is payload weight in kg, is drone weight in kg, r is lift-to-drag ratio, is power 5
transfer efficiency for motor and propeller, p is power consumption of electronics such as 6
sensors in kW, v is drone operating speed in KPH, and t is flight duration in hours. 7
According to equation (6), the energy consumption of drones increases proportionally with 8
the combined vehicle and parcel weight. Battery capacity is expressed as energy consumption 9
multiplied by duration, and flight range is proportional to the battery energy. Power consumption 10
of electronics is assumed to be negligible. Since batteries for delivery vehicles store a fixed 11
amount of energy, battery capacity can be treated as a constant. It should be noted that and 12
r, are constants in equation (6). Then, the relation among , drone speed (V), and flight 13
duration (t) can be found. First, is inversely proportional to V. That is, vehicles can carry 14
more parcels at lower speeds conserving the same amount of energy storage. Second, flight 15
distance ( is inversely proportional to as shown in Figure 3. Using equation (7), it 16
can be derived either or (D+2L) reciprocally once one variable is changed. In Figure 3, a 17
relation between and (D+2L) is convex unlike concave shape resulting from the Breguet 18
equation, mainly because battery weight does not change as energy is expended, unlike in fuel-19
using aircraft. 20
21
Figure 3 Relation between Flight Range and Payload 22

It is safe to operate a delivery vehicle until its battery only retains 20% of the full charge. This 1
is called “the 80% flight rule”, which is commonly used with lithium-ion polymer batteries for 2
safety, maintenance and protection for drones (12). 3
Mathematical Formulation 4
Assumptions for Delivery System 5
1. The tours of each delivery vehicle are routed on a 3-dimensional Euclidean network. 6
2. The demand does not vary with service quality. 7
3. The demand is uniformly distributed within the service area and uniformly generated 8
over 24 hours / day. 9
4. All daily demands are served within a predetermined working period. 10
5. The size of delivery vehicles and their batteries are homogenous throughout a system. 11
6. Deliveries consist of one package per customer, i.e. per delivery point. 12
7. External costs, noise or system malfunctions, are assumed to be negligible. 13
8. From the distribution center to demand points, delivery vehicles travel a round-trip line-14
haul distance and a Travelling Salesman (TSP) tour at a specified operating speed. 15
Cost Function of Drone Delivery System 16
The cost function consists of system cost and user cost. The system cost includes capital cost 17
which satisfies peak-period demands and operating cost associated with the number of delivery 18
vehicles, such as battery charge, management and maintenance. The user cost can be represented 19
as the cost of the time when users wait for deliveries. It should be noted that this user wait would 20
usually occur at a home, office, or other convenient place, with little disruption to other activities 21
of the waiting users. Thus, the value of this user wait time is relatively low. The total cost is 22
expressed as follows: 23
(8) 24
More specifically, each component is expressed as follows: 25
(9) 26
(10) 27
(11) 28
In equation (9), the capital cost refers to present worth of components, namely vehicles and 29
batteries. It is noted that terminal costs for distribution depots, such as construction, rent, and 30
warehouse, are not considered. Equation (10) includes the costs for system operation, which 31
directly relate to the number of drones and their trips made in a day. Here, the operating cost, 32
related to battery charging and handling, is proportionally increased as the number of flights 33

increases. Indirect costs, including marketing and insurance, are incorporated in drone operation. 1
Equation (11) specifies the users’ cost of waiting to receive packages. 2
Constraints in Drone Delivery System 3
The required battery capacity can be formulated based on the relation between payload and 4
flight distance (shown in Figure 3). 5
(12) 6
(13) 7
(14) 8
Constraint (12) represents the maximum number of packages that each delivery vehicle can hold, 9
while constraint (13) is the maximum delivery range. The sum of the TSP tour length and line-10
haul (letter “L”), i.e. total distance, is twice the service zone radius as described earlier. It is 11
noted that right-hand side values from each equation can be varied according to battery capacity 12
or vehicle specifications. Lastly, constraint (14) is the condition that deliveries should be 13
completed before the end of the working period. Other conditions which may affect energy use 14
are not considered, such as weather and altitude limit. 15
Numerical Results 16
The number of delivery vehicles that minimizes the total cost function is found by 17
differentiating the objective function ( with respect to . The result must also satisfy the 18
imposed constraints. Using baseline inputs, the obtained results are that 146 delivery vehicles 19
costing $15,318/day should be used, as shown in the second row of Table 2. The total cost 20
function is most affected by delivery waiting costs for users. Drones average 4.76 trips/day. All 21
constraints, regarding average number of packages per drone, average delivery distance, and 22
delivery time are satisfied. More details on system outputs are discussed in the following section. 23
SENSITIVITY ANALYSIS 24
Sensitivity analyses are conducted to explore how the system reacts to changes in inputs. Four 25
cases are presented, analyzing the sensitivity to operating variables, service quality, demand 26
pattern, and battery storage improvement. 27
Case I - Variation of Working Period 28
This case is intended to demonstrate whether delivery system is affected by changes in the 29
working period; other variables, including demands in the area and vehicle speed, stay 30
unchanged. It is noted that operation costs are assumed to be the same for days and nights and 31
external costs of overnight operation, such as noise, are not considered. 32
W Ndr Ntrip Npack D+2L Trt Ccp Cop Cudc Ct uc
3 299 2.38 11.41 25.99 1.36 1,807 7,481 10,529 19,816 1.03

6* 146 4.76 5.86 26.25 1.20 1,310 2,430 11,578 15,318 0.79
12 55 9.52 3.98 29.73 1.21 810 1,816 11,694 14,320 0.74
18 31 14.29 3.04 31.98 1.23 648 1,559 11,875 14,082 0.73
24 24 19.05 2.28 31.98 1.14 623 1,559 11,655 13,838 0.72
* baseline output 1
Table 2 Effects of Working Period 2
Values in Table 2 represent system outputs, including system constraints: average number of 3
items shipped in vehicle (Npack) and average flight distance (D+2L). Since the number of daily 4
trips per vehicle (Ntrip) increases as W is increases, the service area can be served with fewer 5
vehicles (Ndr), thus reducing the service provider’s cost for capital (Ccp) and operation (Cop). 6
From the user’s perspective, delivery waiting time cost (Cudc) shows no clear relation with W, 7
because fewer vehicles serve the demands during a longer time window. Cudc does not include 8
waiting costs for demands generated outside of W, where the users must wait for service until the 9
following day. For example, if W has a baseline value of 6 and the service operates between 10
9:00am and 3:00pm, the customers who place an order after 3:00pm must wait at least until 11
9:00am the following day. This additional waiting costs decrease as W increases. Overall here, 12
the extended working period is beneficial. 13
Case II – Variation of Operating Speed 14
Again, delivery vehicles can deliver more packages by lowering operating speed at the fixed 15
amount of energy storage; the amount of energy saved by low speed flight enables vehicles to lift 16
heavier payload according to equation (7), and the same is true in reverse. It can be possible that 17
lower speed allows vehicles to deliver a larger service area, which exceeding the flight range 18
constraint, but this case is not happened in this range of analysis. 19
V Ndr Ntrip Npack D+2L Trt Ccp Cop Cudc Ct uc
30 182 3.56 8.38 26.97 1.65 1,368 2,272 15,919 19,559 1.01
50* 146 4.76 5.86 26.25 1.20 1,310 2,430 11,578 15,318 0.79
70 159 5.57 3.92 24.03 0.96 1,590 3,105 9,271 13,965 0.72
90 160 6.15 3.20 23.23 0.85 1,713 3,445 8,201 13,359 0.69
110 163 6.59 2.73 22.61 0.79 1,839 3,772 7,622 13,233 0.69
* baseline output 20
Table 3 Effects of Vehicle Speed 21
Although increased vehicle speeds (V) reduce total cost as well as unit package delivery cost 22
(uc), this is not a favorable option here for a service provider because Ccp and Cop increase. The 23
advantages of higher speed would increase if the assumed value of waiting time would increase. 24
Case III – Variation of Demand Density 25
This case is designed to explore the effects of demand density on system performance. Lower 26
demand density (Q) can be interpreted as rural areas, while higher density may represent urban 27

areas. It is noted that the case does not consider multiple deliveries made to the same recipient, 1
which potentially decreases the travel distance. 2
Q Ndr Ntrip Npack D+2L Trt Ccp Cop Cudc Ct uc
0.1 17 4.76 5.19 25.77 1.17 150 277 1,150 1,577 0.82
0.5 74 4.76 5.77 26.19 1.20 666 1,236 5,800 7,702 0.80
1* 146 4.76 5.86 26.25 1.20 1,310 2,430 11,578 15,318 0.79
1.5 217 4.76 5.89 26.27 1.20 1,954 3,624 16,908 22,486 0.78
5 716 4.76 5.95 26.31 1.20 6,452 11,969 57,888 76,308 0.79
* baseline output 3
Table 4 Effects of Demand Density 4
As Q increases, more parcels are generated within the service area, thus increasing Ndr; 5
both Npack and D+2L for the vehicles are increased. A service area with lower demand density, 6
e.g. a rural area, yields the highest uc. For more detailed analysis of how density affects the 7
system performance, a microscopic analysis may be conducted with a TSP algorithm to 8
determine the desirable combinations of tour frequency and payload per vehicle tour. 9
Case IV – Battery Performance Improvements 10
The last case is designed to explore how battery energy storage affects a delivery system. In 11
general, more energy storage enables vehicles to carry greater payloads or extend flight range. 12
Note that the right-hand side value for constraint (13) is now ignored. Since there are numerous 13
combinations of payload and flight range with the enhanced battery capacity, we select 14
combinations in which two factors are proportionally increased. Batteries with 10%, 50%, and 15
100% enhancement from the baseline are analyzed. It is assumed here that increased battery 16
storage does not increase vehicle weight. 17
Battery
Capacity
Ndr Ntrip Npack D+2L Trt Ccp Cop Cudc Ct uc
100%* 135 4.76 5.00 27.06 1.19 1,215 2,255 11,871 15,341 0.80
110% 121 4.76 7.08 28.42 1.28 1,083 2,009 12,355 15,447 0.80
150% 84 4.76 10.18 33.83 1.48 753 1,398 14,298 16,449 0.85
200% 61 4.76 14.02 40.59 1.73 549 1,018 16,677 18,244 0.95
* baseline output 18
Table 5 Effects of Battery Capacity 19
Unlike results from case II, the enhanced battery energy storage is preferable for service 20
providers, as Ccp and Cop decrease significantly. From the users’ perspective, Cudc increases 21
because fewer vehicles serve the same numbers of recipients with increased Npack and D+2L. 22
Note that there are additional cost-saving factors for the providers which are not considered, such 23
as rent or investment in facilities. 24
CONCLUSIONS AND FUTURE STUDIES 25

The drone delivery industry is mostly led by private companies, and their achievements indicate 1
that such services are becoming practical. Apart from technical difficulties, many concerns must 2
be overcome exist regarding security, regulations, noise problems and operating conditions, 3
including weather. This paper analyzes fully automated drone delivery services, rather than 4
drones supported by trucks, as found in most related studies. The study considers delivery 5
vehicles which can lift multiple packages within the predefined shipment weight and flight range. 6
Battery capacities, the primary source of drone flight, are included in the model in order to 7
realistically analyze vehicle capabilities. 8
Four cases are presented for demonstrating how system outputs are affected by changes in 9
inputs. It is found that extended working periods are shown to benefit both service providers and 10
users. Increased drone operating speed, beyond the baseline, reduces total cost, but increases 11
operating and investment costs for suppliers. Deliveries by drones are more economical in areas 12
with high demand densities. Lastly, the large amount of energy storage resulted from battery 13
improvement reduces the number of drones meeting all demands in a service area. 14
Future extensions can deal with location of facilities, economic analysis, and consideration of 15
operating conditions. First, facility location requires large amounts of capital investment, such as 16
the purchase of land, warehouse, and labor. For this reason, constructing distribution depots 17
based on drones’ present ranges may yield inefficient solutions for future drone capabilities. 18
Therefore, it may easier to effectively increase present ranges by shifting parcels among drones 19
at relay nodes. Second, from the economic perspective, it is worth examining whether delivery 20
by drones outperforms ground delivering vehicles, including robots. Lastly, cybersecurity and 21
operating conditions, such as weather, might be considered, possibly by translating them into 22
costs. 23
24
25
26
27
28
29
30
31
32
33
34
35

1
2
3
4
5
6
7
REFERENCES 8
1. Unmanned Aerial Vehicle in Logistics: A DHL perspective on implications and use cases for 9
the logistics industry. DHL Customer Solutions & Innovation, 2014. 10
http://www.dhl.com/content/dam/downloads/g0/about_us/logistics_insights/DHL_TrendReport_11
UAV.pdf. Accessed Jul. 26. 2016. 12
2. Lee J, Zhong Z, Kim K, Dimitrijevic B, Du B, Gutesa S. Examining the Applicability of Small 13
Quadcopter Drone for Traffic Surveillance and Roadway Incident Monitoring. Presented at 94th 14
Annual Meeting of the Transportation Research Board, Washington, D.C., 2015. 15
3. Zhang X, Chang YT, Li L, Guo JN. Algorithm of Vehicle Speed Detection in Unmanned 16
Aerial Vehicle Videos. Presented at 94th Annual Meeting of the Transportation Research Board, 17
Washington, D.C., 2015. 18
4. D'Andrea R. Guest Editorial Can Drones Deliver? IEEE Transactions on Automation Science 19
and Engineering, Vol. 11, No. 3, 2014. 20
5. Mathew N, Smith S, Waslander S. Planning Paths for Package Delivery in Heterogeneous 21
Multirobot Teams IEEE Transactions on Automation Science and Engineering, Vol. 12, No. 4, 22
2015. 23
6. Murray C, Chu A. The Flying Sidekick Traveling Salesman Problem: Optimization of Drone-24
assisted Parcel Delivery, Transportation Research Part C, 2015. 25
7. Welch A. Cost-benefit Analysis of Amazon Prime Air, Honors Thesis. University of 26
Tennessee at Chattanooga Economics Department., 2015. 27
8. Toy J, Goodchild A, Delivery by Drone: An Evaluation of Unmanned Aerial Vehicle 28
Technology in Reducing CO2 Emissions in the Delivery Service Industry. Presented at 95th 29
Annual Meeting of the Transportation Research Board, Washington, D.C., 2016. 30
9. Electric Power Monthly with Data for April 2016. U.S Energy Information Administration, 31
2016. www.eia.gov/electricity/monthly/pdf/epm.pdf. Accessed Jul. 26. 2016. 32

10. Hindle A, Worthington D. Models to Estimate Average Route Lengths in Different 1
Geographical Environments, Journal of the Operational Research Society, 2004 2
11. Asselin M. An Introduction to Aircraft Performance. AIAA Education Series, 1997. 3
12. Donald N. Build Your Own Quadcopter: Power Up Your Designs with the Parallax Elev-8. 4
New York: McGraw-Hill Education, 2014. 5
13. Amazon.com. Amazon Prime Air. www.amazon.com/b?node=8037720011. Accessed Jul. 6
26. 2016. 7
8