Embed Size (px)
Citation preview

OPTIMISATION OF THE GRAIN SIZE DISTRIBUTION OF THE RAW MATERIAL MIXTURE IN THE PRODUCTION OF IRON
SINTER
By
ELIE LWAMBA
Submitted in partial fulfilment of the requirements for the degree
MEng (Metallurgical Engineering)
in the Department of Materials Science and Metallurgical Engineering,
Faculty of Engineering, Built Environment and Information Technology,
University of Pretoria, Pretoria
August 2007

ACKNOWLEDGEMENTS _____________________________________________________________________
ACKNOWLEDGEMENTS
Thanks to Lord Jesus Christ for helping me, giving me strength to face all adversity
and to get to where I am.
To Professor Andrie, thank you for your guidance, patience and support.
To professor Chris Pistorius, thank you for advice and support. To Mientjie, André for help and support in the pilot plant, thank you.
To my parents, thank you for your support throughout my studies.
To Julie my wife, all my children, Maryam, Glodi, Benedict and Renau, and all my
brothers and sisters Renau, Venant, thank for your support.
_____________________________________________________________________

ABSTRACT
OPTIMISATION OF THE GRAIN SIZE DISTRIBUTION OF THE
RAW MATERIAL MIXTURE IN THE PRODUCTION OF IRON
SINTER.
Candidate: Elie Lwamba
Supervisor: Prof: A.M. Garbers-Craig
Department: Department of Materials Sciences and Metallurgical
Engineering.
ABSTRACT
The main purpose of this study was to optimise the grain size distribution of the raw
material mixture for the production of iron sinter. It well known that the constitution
of the sinter mix is based on the knowledge of chemical composition and grain size
distribution. Although Mittal Vanderbijlpark has fixed specifications on the physical
and chemical properties of the sinter for optimal blast furnace performance, the
particle size distribution of the sinter mix has not yet been optimized. This was
achieved by using the granulation characteristics of the sinter mix and the green bed
permeability tests. The influence of the moisture content of the feed, granulation
time, and mean granule diameter on permeability was investigated on Thabazimbi and
Sishen iron ore, as well as on their mixture with fluxes and without fluxes. The iron
ore results indicated that the mixture containing 20% Thabazimbi iron ore and 80%
Sishen iron ore with fluxes where the coke, lime and return fines were sized by
removing the – 0.5 mm size fraction of the return fines and coke, and the 1 mm size
fraction of lime has the highest permeability of all the studied mixtures.

ABSTRACT
The sintering properties of the mixtures of optimised grain size distributions were also
investigated and the results were very similar for all the mixtures and better than the
base case mixture, which was not optimised with respect to grain size distribution.
Keywords: Thabazimbi iron ore; Sishen iron ore; sieve analysis; Granulation,
Permeability, Sintering.
_____________________________________________________________________

1
CHAPTER I. INTRODUCTION.
In the majority of production processes, particle size distribution of the raw materials
has an influence on the properties of the product. This also pertains to iron sinter,
which is constituted of a mixture of raw materials, namely iron ore, fluxes, coke
breeze, limestone, lime, dolomite, and return sinter fines, all having various size
distributions.
Currently Mittal Vanderbijlpark uses Thabazimbi and Sishen iron ore in the
production of sinter. During the crushing of iron ores a great percentage of fine
particles are produced. Due to their detrimental influence on the permeability and
flow distribution within the blast furnace and their losses in the off-gas, fine ores are
not used directly in the blast furnace, but they undergo initial agglomeration through
pelletising or sintering, before they are charged into the blast furnace [1].
Due to its better metallurgical and physical properties than pellets and lump ore, iron
sinter is today the major source of iron in the burden to the modern blast furnace [2,3].
The raw materials are blended and subjected to granulation, which consists of
homogenisation in a rotary drum for a few minutes with the addition of water. The
resulting granules are layered in a bed on a moving strand and ignited for sintering. A
number of physical phenomena take place during sintering. These include heat
exchange between gases and solids, drying and condensation of moisture, combustion
of coke, calcination of limestone, and melting, reaction and solidification of feed
constituents. The process continues until the whole bed is converted into a porous
sintered mass called sinter, which is crushed to obtain the burden of required size
distribution for the blast furnace. The undersize sinter fines are recycled back to the
granulation drum [2,4,5].
The sinter productivity and quality are strongly dependent on the green permeability
of the bed, which is determined by the particle size distribution of the raw materials,
the optimum moisture content, the granulation effectiveness, and by the sintering
process itself [3,5,6].

2
CH. I INTRODUCTION
A large amount of research has been done on the optimization of the particle size
distribution of fluxes, especially the coke breeze and limestone to improve the quality
and productivity of sinter [7].
It was concluded that the sintering process is improved
when coarse particles of coke and limestone with low proportions of coke breeze fines
are used. The combined use of 5-1 mm limestone and 5-0.5 mm coke breeze improves
the granulating ability of raw mix components and enhances the productivity of the
sintering machine [8].
Although Mittal Vanderbijlpark has fixed specifications on the physical and chemical
properties of the produced sinter for optimal blast furnace performance, the particle
size distribution of the sinter mix has not yet been optimized. Therefore, the main
purpose of this study was to optimize the particle size distribution of the iron ore in
the raw material mixture in order to produce a desired sinter.
_____________________________________________________________________

3
CHAPTER II. LITERATURE REVIEW.
II.1 Particle size analysis.
II.1.1 Introduction.
Particle size analysis is a process in which the proportion of material of each grain
size range present in a given material is determined. The aim of particle size analysis
is to determine the particle size distribution of a given material and the optimum size
of the feed to the process for maximum efficiency. In mineral processing the quality
of grinding is determined through a particle size analysis [9,].
II.1.2 Particle size.
The particle size distribution is very important in many industries and must be
controlled from the raw material source to the finished product. The properties of
many materials depend on its particle size distribution. It well known that, only the
size of regular geometric shapes can be measured such us a cube and a sphere. The
exact size of an irregular particle cannot be measured, as the majority of particles are
quite irregular.
It is necessary to adopt an approximate description to define the size of the irregular
particle [10]. Many researchers assume irregular particles to be spherical in most
calculations. Because the sphere can be described by its diameter, therefore the
irregular particle can be defined in converting the volume or the weight of the particle
into the volume or weight of an equivalent sphere by the formula below [11]:
- Volume = 4/3 π (D/2) 3.
- Weight = 4/3 π (D/2)3 ρ.
Where, D is the diameter of the equivalent sphere. The diameter of an irregular
particle can be defined either in terms of the geometry of individual particles or in
terms of their physical properties.
_____________________________________________________________________

4
CH. II. LITERATURE REVIEW
In the first case, dimensions of a large number of particles are measured. Diameters
obtained by microscopy or sieving are of this type, and in the second case,
sedimentation methods are used to determine the diameters of the particles. The most
typical equivalent diameters are listed in Table I.
Table 1 Most typical spherical equivalence diameters (d) [11].
Symbol Name Definition Formula
dv Volume diameter Diameter of sphere having the V = (π/6)dv3
same volume as the particle
ds Surface diameter Diameter of sphere having the V = πds3
same surface as the particle
dsv Surface volume diameter Diameter of sphere having the dsv = dv3/ds
2
same external surface to volume
ratio as a sphere.
df Free- falling diameter Diameter of sphere having the
same density and the same
Free-falling speed as the particle
In a fluid of the same density
and viscosity.
dst Stokes’ diameter The free-falling diameter of dst2 = dv
3/dd
a particle in the laminar
flow region (Re<0.2)
dA Sieve diameter The width of the minimum
square aperature through which
the particle will pass
da Project area diameter Diameter of circle having the A =
(π/4)da2
same area as the projected area
of the particle resting in a stable position. _____________________________________________________________________

5
CH. II. LITERATURE REVIEW II.1.3 Average particle size.
The particle size measurement results are reported in the form of a particle size
distribution. The purpose of an average is to represent a group of individual values in
a simple manner in order to obtain an understanding of the group. It is important,
therefore, that the average should be representative of the group. All average
diameters are measures of central tendency which is unaffected by the relatively few
extreme values in the tails of the distribution [11]. The most common type of diameter
used in the sintering process is the mean diameter, which is calculated by averaging
the mean or equivalent diameters of a number of particles. The following mean
diameters are defined [11]:
-Arithmetical mean DA = (d1 + d2)/2
-Geometrical mean DG = √d1d2
- Laschinger’s mean DE = (d1 –d2)/(lnd1 –lnd2)
- Mellor’s mean DM = √(d1 + d2)(d12 + d2
2)/4
- Mean of form DF = 4(d15 – d2
5)/5(d14 – d2
4)
-Von Reytt’s mean DR = 0.435(d1 +d2)
- Number mean DN = Σnd/Σn
- Length mean DL = Σnd2/Σnd
- Surface mean DS = Σnd3/Σnd2
- Volume mean DV = Σnd4/Σnd3
- Harmonic mean DH = Σn/[Σ(n/d)]
Where D is the mean diameter, d1 and d2 are the maximum and minimum mean
particle diameters, respectively; d represents the successive mean particle diameters in
a sizing operation, and n the numerical frequency of the corresponding d.
_____________________________________________________________________

6
CH. II. LITERATURE REVIEW
II.1.4 Particles size measurement techniques.
Various techniques are used to analyse particle size. These techniques depend of the
size of the particle and the information needed from the particle. Some of the more
common techniques for measuring the particle size distribution together with their
effective size ranges are given in the table below. [10]
Techniques Approximate useful range (microns)
Sieving 100.000 → 10
Elutriation 40 → 5
Microscopy (optical) 50 → 0.25
Sedimentation (gravity) 40 → 1
Sedimentation (centrifugal) 5 → 0.05
Electro microscopy 1 → 0.005
II.1.4.1 Sieving.[10,12,13,14,] Sieve analysis is the most fundamental and widely used method for determining the
size of particles. This method consists of separating a given sample into different size
fractions. It involves passing the material being sized through openings of a particular
standard size in a screen. It classifies material according to their physical size by
using a series of woven wire or punch plate sieves arranged in decreasing order of
aperture size. In other words, the ratio between successive sieves is kept as a constant
such as √2 and hence the sieve varies in geometric progression. The material to be
tested is placed in the uppermost, coarsest sieve, and the nest is then placed in a sieve
shaker, which vibrates the material for a fixed time.
_____________________________________________________________________

7
CH. II. LITERATURE REVIEW
During the shaking, the undersized material falls through successive sieves until it is
retained on a sieve having apertures, which are slightly smaller than the diameter of
the particles. In this way the sample is separated into size fractions. The amount of
material present in each sieve is then weighed and the values are converted into
percentage of the total sample and than tabulated along with their corresponding sieve
opening.
II.1.4.2 Sedimentation and Elutriation. [10,12,14]
Sedimentation and elutriation are used to analyse fine particles by the method called
hydrometer analysis. This method of analysis is based on Stokes’ law, which relates
the terminal velocity of a sphere falling freely through a fluid to the diameter. The
relation is expressed according to the equation [11]:
v = [(ρs - ρf )/1800ŋ] x D2
Where: v = terminal velocity of sphere, cm per second.
ρs = density of sphere, g per cm3
ρf = density of fluid, g per cm3
ŋ = viscosity of fluid, g-sec per cm2
D = diameter of sphere, mm
The hydrometer method of analysis is used to determine the percentage of dispersed
particles remaining in suspension at a given time. The maximum grain size
equivalent to a spherical particle is computed for each hydrometer reading using
Stokes’ law.
It is assumed that Stoke’ law can be applied to a mass of dispersed particles of a given
material having various shapes and sizes.
_____________________________________________________________________

8
CH. II. LITERATURE REVIEW II.1.4.3 Optical microscopy. [10,14]
Optical microscopy is an old technique for particle sizing that is still being used to a
considerable extent, in spite of the fact that, unless automatic or semi-automatic
methods are used, the procedure may be very tedious. This method measures the
particle size by interaction of the particle with light. The particles shapes can be
observed, often leading to particle identification. The amount of sample required is
small.
II.1.4.4 Electro microscopy. [10, 14]
In this technique, we find the Scanning Electron Microscopy (SEM) and Transmission
Electron Microscopy (TEM). Scanning Electron Microscopy (SEM) analysis
provides highly detailed information about not only particle size, but also particle
shape, surface texture and chemical composition, and at resolutions not approachable
by other techniques. Transmission electron microscopy (TEM), which measures the
transmitted electron beam after it passes through the sample, is applicable for particle
sizing in the extreme lower size limit, below 0.2 µm, although much of the three
dimensional information is lost in this case.
II.1.5 Presentation of results. [10]
Generally the results of sieves analysis and hydrometer analysis are presented in the
form of a table or as a plot of quantity of particle retained or passing in percentage
versus particle size, as respectively shown in Table 2 and Figure 1.
Table 2 shows: 1) The sieve range used in the test.
2) The weight of material in each size range.
3) The weight of material in each size range expressed as a percentage of a total
weight
4) The nominal aperture sizes of the sieves used in the test.
_____________________________________________________________________

9
CH. II. LITERATURE REVIEW
5) The cumulative percentage of material passing through the sieves.
6) The cumulative percentage of material retained on the sieves.
Table 2. Results of a typical sieve test. [10]
1 2 3 4 5 6 Sieve size Sieve fractions Nominal Cumulative Cumulative Range wt (g) %wt aperture size % % (µm) (µm) undersize oversize +250 0.02 0.1 250 99.9 0.1
-250 +180 1.32 2.9 180 97.0 3.0
-180 +125 4.23 9.5 125 87.5 12.5
-125 +90 9.44 21.2 90 66.3 33.7
-90 +63 13.10 29.4 63 36.9 63.1
-63 +45 11.56 26.0 45 10.9 89.1
-45 4.87 0.9
A graphic method gives a better interpretation of sieve data. Graphs can be presented
in the form of either a histogram where the percentage of the sample in each class can
be shown graphically or in a cumulative curve, which consists of a plot of cumulative
undersize (or oversize) against particle size. Data are conventionally presented by
plotting particle size horizontally (x-axis) and the measured quantity vertically (y-
axis). Also the statistical method has been developed for the interpretation of the
sieve data. In this method, the simplest is the measurement of the central tendency of
which there are three commonly used parameters: The median particle size is that
which separates 50% of the sample from the rest; the median is the 50% percentile.
The mode is the largest class interval. The mean is defined in different ways, but the
most common formula is the average of the 25 and 75 percentiles. In the cumulative
curve method, data of the particle size analysis can be plotted on either arithmetic
graph paper, or semi-logarithmic or logarithmic paper.
_____________________________________________________________________

10
CH. II. LITERATURE REVIEW
Although arithmetic graph paper can be used, it suffers from the disadvantage that
points in the region of the finer aperture sizes tend to become congested. A semi-
logarithmic plot avoids this, with a linear ordinate for percentage oversize or
undersize and logarithmic abscissa for particle size. Figure 1 shows graphically the
results of the sieve test tabulated in Table 2.
Figure 1. Cumulative Arithmetic Graph
Different functions have been presented to describe the size distribution of particles in
the aim to obtain a linear distribution curve. Table 3 shows the common functions
used for linearization of particle size distributions. Symbols n, s, and S are constants
and d, d* are diameters.
Table 3. Functions used for linearization of particle size distributions.
Name Σλ (%)=%passing a given d Meaning of d*
Rosin-Rammeler 1-exp [-(d/d*) s] d value at Σλ = 0.632
Gates-Gaudin-Schumann [d/d*] n Maximum d value
Harris 1-[1-(d/d*) S] n Maximum d value.
_____________________________________________________________________
0
20
40
60
80
100
120
0 50 100 150 200 250 300
Aperture size (um)
Cu
mu
lati
ve u
nd
ersi
ze (
%)

11
CH. II. LITERATURE REVIEW
II.2 Sintering process.
II.2.1 Introduction.
Sintering is an agglomeration process that involves the heating of a mixture of iron
ore fines and fluxes. The heating and sintering process are promoted by coke
combustion.
The sintering process can be classified in two parts:
- Cold or wet processing stage, (blending and granulation), and
- Thermal or sintering stage.
The two stages are linked by the fact that the sinter productivity and quality are
strongly dependent on the permeability of the bed during sintering, which is
determined, in the first instance, by the structure of the bed before its ignition [2].
II.2.2 Cold or wet processing stage.
III.2.2.1 Granulation
In the sintering process granulation is an important step because it determines bed
permeability, which in turn determines sinter productivity [3]. The main purpose of
granulation is therefore to improve the permeability of the bed, which will enhance
the flow characteristics of the combustion air through the sinter bed. A sinter feed
consists of iron ores, fluxes, coke breeze, and other raw materials such as plant dusts.
The size of these materials may range from very fine particles [> 0.075 mm] to coarse
particles
[(1 - 12.5) mm]. The sinter feed components are mixed together and water is added
to the mixture in the drum and then granulated into pseudo-particles in a rotary mixer
for a few minutes. The addition of water to the drum provides the driving force for
granulation. The objective is to layer the fine particles onto coarse particles, which
act as nuclei. [6]
_____________________________________________________________________

12
CH. II. LITERATURE REVIEW
In this way granulation is defined as the process where by fine particles (<0.25mm)
adhere onto the surface of large particles (>0.75mm), and quasiparticles form [6].
Particles of > 0.75 mm act as nuclei while particles of < 0.25 mm act as adhering fines
[6]. Intermediate particles are difficult to granulate and do not have a well defined
role. When the water content added to the ore mixture during granulation is
increased, the intermediate particles adhere to the coarser nuclei but become detached
during drying. [15] The amount of intermediate particles needs to be minimal since it
affects the permeability in two ways [15,16]
- As nuclei these particles reduce the size of the quasiparticles, and thus lower the
permeability of the bed, and
- As adhering fines, they are poorly bonded and easily separated from the dry
particles.
The three factors that control the growth of the adhered fines layer on a nucleus are
the structure of the nucleus (surface area, porosity), the moisture content, and the
amount of fines present. [15]
The moisture content in the ore is a very important parameter in the granulation stage
in sintering. The process of adhering fine particles to nuclei, to form quasiparticles, is
very strongly influenced by the moisture available for granulation, the granulation
time, and the properties of the raw material mixture. Kumba pilot plant uses the
following parameters to judge the granulation effectiveness [9]:
- Granulation index (G.I.) expressed by the following formula: {%Mass [0.25mm(true particle size)]–%Mass [0.25mm(quasi-particle size)]}
{%Mass [0.25mm(true particle size)]
The granulation index is considered acceptable if it converges towards 200. - Granulation diameter (G.D.) expressed by the following formula: Dp (true particle size) Dp (quasi-particle size) _____________________________________________________________________

13
CH. II. LITERATURE REVIEW The granulation diameter must be less than 1. - Diameter of particle dry mix (Dp-dry mix) expressed by the following formula: ∑Dp (lin)[true particle size] - Diameter of particle wet mix (Dp-wet mix) expressed by the following formula: ∑Dp (lin)[quasi-particle size] - Percentage of Moisture: expressed by the following formula:
(Wet mass – Dry mass) x100 Wet mass Kumba considers a quasi-particle size to be the size of the particles in the granulated
sample after granulation and a true particle size as the quasi-particle dried in the oven
at 110oC for 2 hours.
III.2.2.2 Permeability.
The term permeability is widely used in engineering to denote the ease of fluid flow
through a particulate bed. The permeability of a sinter bed plays a vital role in
controlling sinter properties and productivity, since it governs the bed- temperature
profile by determining the gas flow rate through the bed.
Green bed permeability can be characterized by the relation [2,3,17,18]:
P = v (H/∆P) 0.6 v = V/A
Where P is the bed permeability, V is the air flow rate, A is the area, H is the height of
the bed, v is the superficial velocity i.e. the average linear velocity that the air would
have in the column if no packing were present, and ∆P is suction applied across the
bed.
_____________________________________________________________________

14
CH. II. LITERATURE REVIEW A (m2)
H (mm)
Fan [V (Nm3/min),∆P (mmH2O)] Figure 2. Schematic diagram of the permeability test.
P is traditionally expressed in British Permeability Units (BPU), but there is a
tendency to use the Japanese Permeability Unit (JPU) in more recent literature[4].
Permeability is controlled through the control of the following parameters.
- Bed height.
- Airflow rate
- Moisture.
- Granule size.
Table 4. Units of green bed permeability [17]
Units BPU JPU
v ft/min or mm/s m/min
H/ ∆P inches bed/inches water mm bed/mm water
gauge gauge
_____________________________________________________________________

15
CH. II. LITERATURE REVIEW II.2.3 Thermal or sintering stage.
After granulation the granules formed are loaded onto a grid layer of coarse sinter
(-40 +20) mm in sinter cars on the sinter machine. The height of the packed bed varies
from process to process and can be up to 600 mm in height [6]. The bed immediately
passes under an ignition hood where the fine coke in the surface layer is ignited by
gas flames. As the sinter cars move forward, combustion is promoted by air drawn
through the sinter bed in a series of wind boxes under the sinter bed. The pressure
drop over the sinter bed can be up to 2000 mmH2O [6]. During the sintering process
the temperature of the granulated sinter mixture is raised to temperatures between
1050 and 1400oC in order to achieve partial melting and produce a semi molten
material.
This material is subsequently cooled and cristallises into several mineral phases of
different chemical and morphological compositions: mainly hematite, magnetite,
silicoferrite of calcium and aluminum (SFCA) and calcium silicates. The sinter is
either cooled on the sinter strand (on strand cooling) or outside the sintering machine
(off strand cooling). The sinter is crushed and screened to a size of - 40 + 10 mm for
use in the blast furnace, and the size fraction of – 10 mm is recycled back to
granulation [6]. The process energy is supplied by the combustion of the coke.
The factors that affect sintering and the quality of the sinter product are:
- The size and composition of the granules.
- The size and composition and relative properties of the mixture components
(iron ores, fluxes and coke)
- The mineralogical structure of the ore mixture components and
- The thermal profile of the process.
_____________________________________________________________________

16
CH. II. LITERATURE REVIEW II.2.4 Sinter properties.
Sinter properties refer to its physical and metallurgical properties. The most
important characteristics of a sinter are defined as a combination of the following
properties:
- The cold strength
- The Reducibility of the sinter (RI)
- The reduction disintegration index (RDI).
- The high temperature properties using the REAS test.
II.2.4.1 Cold strength. [19,20,21]
Cold strength determines to what extent sinter will maintain its size during different
handling operations from the sinter plant to the blast furnace.
The cold strength of the sinter is controlled by:
- The micro cracks: These are either present in the original ore particles or formed
in
the bonding phases during cooling of the sinter.
- The individual mineral components
- The open porosity
- The strength of the individual bonding phases,
- The amount of glass formed as bonding phase.
- Ultrafine particles.
Test procedure.
According to ISO 3271, a test portion of 15 kg of – 40 + 10 mm size fraction is
tumbled in circular drum having 1000 mm as internal diameter and 500 mm as
internal length at 25 rpm for 200 revolutions, followed by sieving on test sieves of 6.3
mm and 0.5 mm.
_____________________________________________________________________

17
CH. II. LITERATURE REVIEW
The tumble Index (TI) and the Abrasion Index (AI) are calculated as follows:
- TI = (m1/mO) x100 (% + 6,3 mm material after tumbling)
The tumble index (T.I) is a relative measure of the resistance of sinter to breakage by
impact and abrasion.
The tumble index is expressed as the percentage of the +6.30 mm fraction remaining
after the tumble test. A tumble test greater than 70% is considered to be an acceptable
index for iron sinter.
- AI = [mO – (m1 +m2)/mO] x100 (% - 0.5 mm material after tumbling)
The abrasion index (A.I) is a relative measure of the size degradation of the sinter by
means of abrasion. The abrasion index is expressed as the percentage of the - 0.5 mm
fraction present after the tumbler test. An abrasion index smaller than 5% is
considered to be an acceptable index for iron sinter.
Where:
mO = mass of the test portion, in kg, weighed and placed in the tumble drum.
m1 = mass of + 6.30 mm fraction of the tumbled test portion in kg.
m2 = mass of - 6.30 mm +0.5 mm fraction of the tumbled test portion in kg.
II.2.4.2 Reduction disintegration index.
The reduction disintegration index (R.D.I) is defined as a quantitative measure of the
degree of disintegration, which could occur in the sinter in the upper part of the blast
furnace after some reduction.
The reduction degradation index of a sinter is controlled by [20]:
- The amount of relict hematite, as well as rhombohedral hematite found in a sinter.
- The amount of MgO and magnetite.
- Porosity.
_____________________________________________________________________

18
CH. II. LITERATURE REVIEW Test procedure According to the ISO 4696-1 test procedure, a test portion of 500 g of –12.5 + 10 mm
is subjected to static reduction at a temperature of 500oC for one hour using a
reducing gas consisting of:
CO: 20%(V/V) ± 0.5%(V/V).
CO2: 20%(V/V) ± 0.5%(V/V).
H2: 2.0%(V/V) ± 0.5%(V/V).
N2: 58%(V/V) ± 0.5%(V/V).
The test portion is cooled to a temperature below 100oC and tumbled in a circular
drum at 30 rpm for 300 revolutions. The test portion is then sieved with test sieves,
which have square mesh apertures of 6.30 mm, 3.15 mm, and 0.5 mm.
The reduction degradation index (RDI) is calculated as follows:
- RDI-1+6.3 = m+6.3/m0 x 100
- RDI-1- 3.15 = {[m0 – (m+6.3 + m +3.15)]/m0} x100
- RDI-1- 0.5 = {[m0 – (m+6.3 + m+3.15 + m+0.5)]/m0} x100
Where: - m0 = mass in grams of the test portion after reduction and before tumbling.
- m1, 2, 3 = mass in grams of the oversize fraction retained on the 6.30, 3.15,
0.5 mm sieves respectively. Kumba Iron Ore requires that the reduction
disintegration index RDI-1-0.5 should be below 5% and RDI-1+3.15 above 70%.
II.2.4.3 Reducibility. The reducibility index (R.I) is used to evaluate the behaviour of sinter under specific
conditions such as: isothermal reduction, reduction in a fixed bed and reduction by
means of carbon monoxide.
_____________________________________________________________________

19
CH. II. LITERATURE REVIEW
It is the ease with which oxygen combined with iron can be removed from natural or
processed ores.
It depends on the gas accessibility, sinter basicity (CaO: SiO2) [20]. It is done
according to the ISO 4695:1995(E) test procedure. In a fixed bed at 950oC, using a
reducing gas composition consisting of 40% v/v of CO and 60 % v/v of N2, a test
portion of –12.5 + 10 mm is reduced isothermally. The test portion is weighed at
specific time intervals, from which the weight loss is determined.
The reducibility is calculated as follows:
- Degree of reduction. [22]
Rt = 0.111w1/0.430w2 + [(mt – m0) x 100]/0.430m0w2
Where:
- m0 = mass of sample before reduction.
- mt = mass of test sample after reduction time t
- w1 = Iron (II) oxide as % by mass of test sample before test.
- w2 = total iron content as % by mass of the test sample before test.
- Reducibility Index [dR (O/Fe – 0.9)]/dt = 33.6/(t60 –t30)
Where:
- T30 = time to attain 30% degree of reduction.
- t60 = time to attain 60% degree of reduction.
The reducibility index should be evaluated along with the results of other tests like the
reduction degradation index. The reducibility index is directly related to sinter
basicity and increases with increasing basicity. For a basicity of between 1.6 and 2.4,
the reducibility index of between 0.95 and 1.2 are expected [22]
.
_____________________________________________________________________

20
CH. II. LITERATURE REVIEW II.2.4.4 High temperature properties. High temperature properties of sinter are evaluated using the REAS test where, a high
temperature reduction simulates the blast furnace process from stock line to melting.
It is mainly influenced by the melting temperature of gangues minerals and the
amount of FeO produced during reduction [21].
The REAS test provides [23]
- An insight into the reactions occurring during the softening and melting
processes.
- A range of indices with which to judge the blast furnace performance.
Test procedure.
- A test portion is subjected to blast furnace conditions by increasing its
temperature from room temperature to 1600 oC in 8 hours.
- Simulation of ideal gas composition and temperature.
Several indices are used to characterise the high temperature properties of a blast
furnace charge. Among them are: [23, 24]
- The cohesive and softening zone The cohesive zone is defined as the area between the melting and softening
temperatures (MT-ST) while the softening zone is defined as the area between the
dripping and softening temperatures. The cohesive zone should be small but at a high
temperature.
- Maximum pressure drop over the sample bed. (∆PMAX )
The gas pressure drop across the bed increases as the sample softens. The
temperature where the maximum pressure drop occurs is recorded as well as the value
of the pressure drop.
- Softening temperature (ST) The temperature where a pressure drop of 100 mmH2O is recorded is taken as the
softening temperature (Figure 3).
_____________________________________________________________________

21
CH. II. LITERATURE REVIEW - Melting temperature (MT) The Melting temperature is defined as the temperature where the pressure drop
recovers to 100 mmH20 and lowers after dripping has occurred (Figure 3).
- Dripping temperature. (DT) There are three different temperatures at which this index can be determined:
First mass recorded on scale.
Endothermic drop i.e. a drop in the sample temperature occurs.
Pressure drop decreases to below 100 mmH20. - Relative dripping mass. The relative dripping mass is a function of the total mass of the sample and is
calculated after the test has been completed.
%Rel Drip Mass = [(Total Drip Mass/(Sample mass – Removable O2)]x100 - Compaction. The percentage compaction is the compaction at a certain time relative to the total
compaction at the end of the test and is calculated as follows:
% Compaction = (X/Total compaction) x100
Where: X = Compacting at any stage during the test.
Total compaction = compaction at the end of the test expressed in mm.
- Viscosity
The area under the pressure drop versus temperature curve between the softening and
the melting temperatures (Figure 3) gives the measure of viscosity [23].

22
CH. II. LITERATURE REVIEW
Figure 3. Determination of the viscosity between the softening (Ts) and melting temperatures (Tm)
II.2.5 Aim of the study
The iron ore constitute the big part of raw material mixture for the production of iron
sinter. Many study have been investigated the influence of particle size distribution of
fluxes, especially the coke breeze and the limestone and the influence of very fine
particles of iron ore to the sinter quality. It was been observed that the varying in size
distribution in size distribution of coke breeze and limestone has an influence on
sinter properties, in improving the granulating ability of raw materials mixture,
shortens the sintering time and enhances the productivity of the sintering machine.
The majority of results Converge to the conclusion that, the use of coarse particle
breeze will not burn out until passing the sintering zone and the use of fine particles
will burn prematurely and lead to excessive CO formation in off gas. But size
between 0.5-4 mm is considered as optimum for coke breeze, while + 1 mm fraction
of limestone is considered optimum [8]. The use of very fine particles of iron ore has
an influence on sinter strength [19]. It will be assumed that the size distribution of raw
material mixture can influence the sinter properties. Therefore the aim of this study
was to optimise, the particle size distribution of the iron ore in the raw material
mixture.

23
CHAPTER III. EXPERIMENTAL
III.1 Materials.
The raw materials used in the sintering experiments were Thabazimbi, Sishen, and
Phoenix iron ore, Return fines, Coke, Lime, Silica, water and ferric chloride.
Representative samples of raw materials were prepared for sieves analysis,
determination of very fine particles, granulation, and for the sinter pot test.
III. 2 Unit operations.
III.2.1 Sieve analysis.
Particle size distribution was determined by sieves analysis. The amount of sample to
be sieved depended on the operation. The sample weight used for the sieve analysis
was 4 kg for the determination of very fine particles and 10 kg for granulation. With
the aim of obtaining a representative sample for sieves analysis, the sample was
emptied from the 18 kg sample bag into one of the riffle pans. The material was then
poured through the sample splitter by slowly tilting the pan so that the material flowed
in an even stream over the width of the pan. One of the samples produced was then
weighed. If the desired weight was not reached the operation was repeated by taking
either the weighed sample and splitting it again if it was too heavy or by adding two
of the produced samples together if the weight was too low. The particle size
distribution of the representative sample was determined by using a series of standard
sieves with openings ranging from 12.5 to 0.045 mm, including a cover plate and a
bottom pan. The screens of the sieves were cleaned with a soft wire brush before they
were placed on the sieve-shaking machine. The sample was poured onto the top sieve
and then shaken for 10 minutes. After the operation each sieve fraction was weighed.
_____________________________________________________________________

24
CH. III EXPERIMENTAL Another apparatus used in the sieves analysis was an oven for the drying of wet
samples from sieves analysis under wet conditions and sieves analysis of granules
frozen with liquid nitrogen. The sieve analyses of all the raw materials used in this
study are given in Appendix I.
III.2.2 Blending.
The raw materials for this study that were used for the measurement of size
distribution and granulation characteristics were mixed in a rotary drum for 20
seconds.
III.2.3 Granulation and Permeability.
Granulation characteristics and permeability tests were very important in this study,
because the optimisation of the grain size distribution of the raw materials mixtures
were based on these tests results. Granulation tests were carried out in a drum, which
has a diameter of 51.5 cm and is 50 cm in height, at a constant rotational speed of 26
rotations per minute. The granulation characteristics of Thabazimbi iron ore, Sishen
iron ore, their mixture without fluxes, and finally the optimised mixture without
fluxes blended with fluxes were examined. The composition of the optimised mixture
with fluxes was calculated taking into account the sinter specifications target of CaO=
9.52 mass %, SiO2 = 5.00 mass % and MgO = 3 mass %.
The influence of moisture content and granulation time on the permeability and mean
granule diameter was investigated. These experiments were conducted by using 10
samples of 10 kg (dry basis) of each raw material mixture under study. The procedure
involved varying the moisture content of the mixture while keeping the time constant
(5 samples), and then the effect of granulation time on permeability at optimum
moisture content (5 samples). The aim of this part of the study was to find the
optimum moisture content and the optimum granulation time for each raw material
mixture, which yields the maximum pre-ignition permeability.
_____________________________________________________________________

25
CH. III EXPERIMENTAL
After granulation part of the granulated sample, approximately 4 kg was used for a
permeability test. A pot of 0.595m in height and 0.142 m inside diameter was used to
measure the permeability. Figure 4 shows the schematic view of the pot test
apparatus. The permeability was calculated in terms of the Japanese Permeability
Unit (JPU) by taking the average of 3 measurements of pressure drop for different
flow rates at the venturi, at the top and at the bottom. For each moisture content
tested (H) there was a related permeability value (P). The highest value of
permeability is the maximum permeability, and the associated moisture is the
optimum moisture content. The same applies to the maximum time that is associated
with the maximum permeability.
Figure 4. Schematic view of the experimental apparatus in which the permeability was tested.
On the schematic view of the experimental apparatus, 1,2,3 represent respectively the
measuring points of suction pressure at the bottom, top, and the venturi.
_____________________________________________________________________

26
CH. III EXPERIMENTAL
Table 5. Specifications of the permeability apparatus Height (m) Values (m) Meaning
h1 0.595 Total available height from the top to the screen.
h2 ± 0.450 Depth of charge after filling.
h3 h1 – h2 ± 0.145
Bed height.
h4 h3- h5 ± 0.130
Effective bed height, from top of bed to bottom measuring point.
h5 0.015 Height difference between screen to lower measuring point.
h6 0.06 Height difference between Venturi to top measuring point.
Although the total available height of the permeability pot was 0.595m(h1) the height
of the sample to be tested after filling was ± 0.145 (h3). The bed height used in the
formula of permeability (JPU) is the effective bed height (h4), which is the height
from the top of the bed of the sample to measuring point 1 at the bottom (Figure 4).
The effective bed height was approximately 0.130 m. At the bottom of the apparatus
of the permeability test, a screen of 1 mm was placed, to allow suction through the
sample bed, but to avoid the sample to be sucked by the airflow through the pipe to
the exhaust. The diameter of the venturi was 0.0444 m and the diameter of the pipe
was 0.140 m in the first test done on Sishen iron ore and Thabazimbi iron ore. In the
rest of the tests a venturi having a diameter of 0.025 m and a pipe of 0.142 m were
used.
A portion of granulated sample was frozen with liquid nitrogen, in order to perform a
sieve analysis on the granules, whereby the material transfer between granulometric
classes was studied by comparing the size distribution before and after granulation.
This was done by placing 500- 700g of granulated mixture on a metallic tray. And
then, the liquid nitrogen (-200OC) was poured on the granulated sample and on the
screen.
_____________________________________________________________________

27
CH. III EXPERIMENTAL
The granule size distribution was determined by weighing separately the cooled
fractions retained onto different screens after 5 minutes of screening. The granulated
sample was cooled together with the screen in order to avoid deterioration of the
granules during sieving. This test characterised the granulation potential of a given
iron ore by comparing the size distribution of the raw materials, before and after
granulation.
III.2.4 Sintering.
Sintering tests were carried out at Kumba pilot plant in a sinter pot with a cross
sectional grate area of 0.16 m2 (Figure 5).
Figure 5. Sinter pot test equipment.
_____________________________________________________________________
28
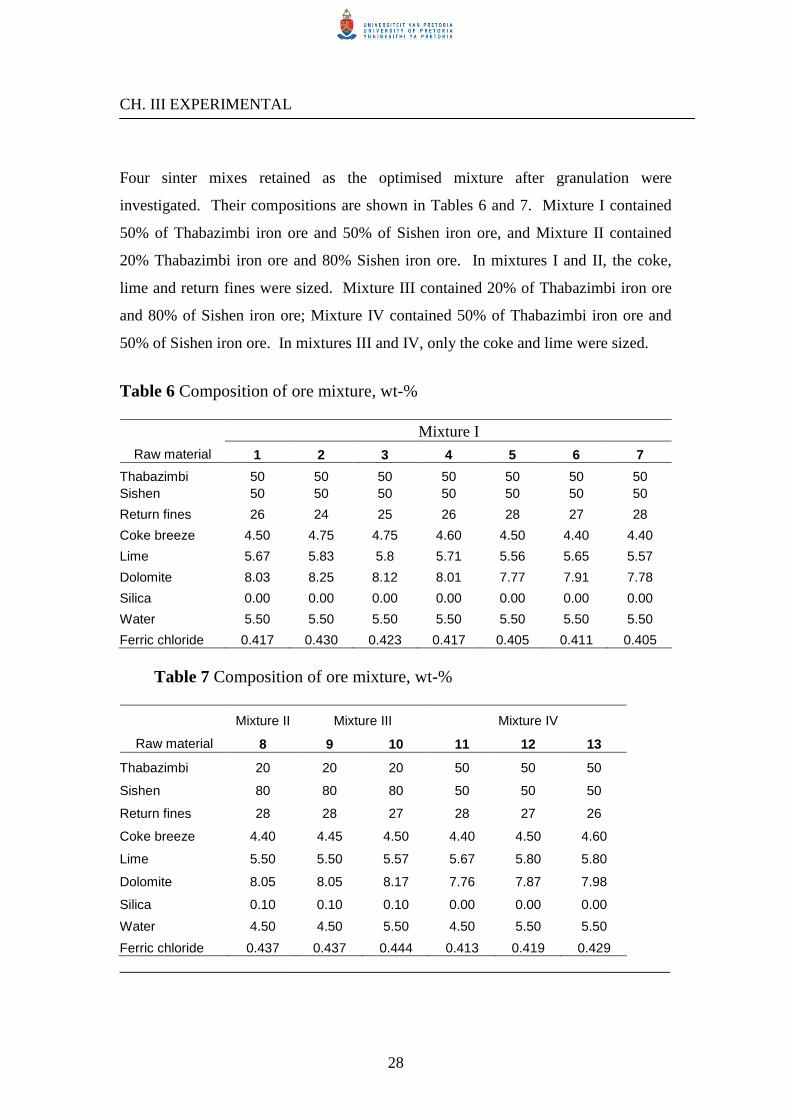
CH. III EXPERIMENTAL Four sinter mixes retained as the optimised mixture after granulation were
investigated. Their compositions are shown in Tables 6 and 7. Mixture I contained
50% of Thabazimbi iron ore and 50% of Sishen iron ore, and Mixture II contained
20% Thabazimbi iron ore and 80% Sishen iron ore. In mixtures I and II, the coke,
lime and return fines were sized. Mixture III contained 20% of Thabazimbi iron ore
and 80% of Sishen iron ore; Mixture IV contained 50% of Thabazimbi iron ore and
50% of Sishen iron ore. In mixtures III and IV, only the coke and lime were sized.
Table 6 Composition of ore mixture, wt-%
Mixture I Raw material 1 2 3 4 5 6 7
Thabazimbi 50 50 50 50 50 50 50 Sishen 50 50 50 50 50 50 50
Return fines 26 24 25 26 28 27 28
Coke breeze 4.50 4.75 4.75 4.60 4.50 4.40 4.40
Lime 5.67 5.83 5.8 5.71 5.56 5.65 5.57
Dolomite 8.03 8.25 8.12 8.01 7.77 7.91 7.78
Silica 0.00 0.00 0.00 0.00 0.00 0.00 0.00
Water 5.50 5.50 5.50 5.50 5.50 5.50 5.50
Ferric chloride 0.417 0.430 0.423 0.417 0.405 0.411 0.405 Table 7 Composition of ore mixture, wt-%
Mixture II Mixture III Mixture IV
Raw material 8 9 10 11 12 13
Thabazimbi 20 20 20 50 50 50
Sishen 80 80 80 50 50 50
Return fines 28 28 27 28 27 26
Coke breeze 4.40 4.45 4.50 4.40 4.50 4.60
Lime 5.50 5.50 5.57 5.67 5.80 5.80
Dolomite 8.05 8.05 8.17 7.76 7.87 7.98
Silica 0.10 0.10 0.10 0.00 0.00 0.00
Water 4.50 4.50 5.50 4.50 5.50 5.50
Ferric chloride 0.437 0.437 0.444 0.413 0.419 0.429 _____________________________________________________________________

29
CH. III EXPERIMENTAL Table 8. Particle size distributions of limestone, coke breeze, wt-%.
- 5 + 3.35 mm - 3.35 + 1 mm - 1 + 0.5 mm
Coke breeze 20 40 40
Lime 20 80 -
Table 8 shows the particle size distribution of limestone and coke breeze used in the
mixtures (I, II, III, and IV). The sizing of the coke breeze implied removal of the –0.5
mm size fraction and of the lime the –1 mm size fraction. In mixture I and II the
return fines were sized by removal of the – 0.5 mm size fraction.
Raw materials were fed from the mixing drum (1000 mm in height and 500 mm in
diameter), which Kumba pilot plant uses for the granulation, into the sinter pot with a
conveyer system. The dry sinter mix was about 140 Kg. The surface of the mixture
was ignited with a gas flame under pressure drop of 500 mm H2O over the bed. After
an ignition time of 1.5 minutes, the gas flame was stopped. The temperature reached
1050oC after the flame front burnt through the sinter pot. The sinter cake was cooled
in the sinter pot. It was then crushed and screened to a size fraction between -50 mm
+5 mm for analysis. The - 5 mm size fraction was kept and used as return fines. The
goal of the sinter test was to determine the effect of particle size distribution of the
raw materials mixture on the rate of sintering, the productivity, the ratio of fines, the
amount of FeO (%), the sintering time, the fuel consumption, the coke rate
(kg/t.sinter), the yield (%), the Tumble Index (TI), the Reduction Degradation Index
(RDI), the Reducibility Index (RI) and the moisture content.
_____________________________________________________________________

30
CH. III EXPERIMENTAL
In the sintering process, some parameters have been kept constant in accordance with
the Kumba pilot plant practice, such as:
- Basicity index (CaO/SiO2): 1.9
- FeO: 7.0- 9.0 %
- MgO: 3.00 %
- Ignition time: 1.5 minutes.
- Ignition temperature: 1050 0C
- Bed height: 516 mm
- Grid layer height (mm): 50
- Pressure drop (mm H2O): 500 oC for ignition time, 1200 oC for sintering, and
1500 oC for cooling.
_____________________________________________________________________

31
CHAPTER IV. RESULTS AND DISCUSSION
IV.1. Raw materials without fluxes.
In this section the granulation characteristics of Thabazimbi iron ore and Sishen iron
ore and their mixture without fluxes were investigated.
IV.1.1 Pure iron ores: Thabazimbi and Sishen iron ore.
The particle size distributions of Thabazimbi iron ore and Sishen iron ore are
respectively shown in Figures 6 and 7. Fives samples were studied for each iron ore.
Figure 6. Size distribution of Thabazimbi iron ore.
Figure 7. Size distribution of Sishen iron ore.
_____________________________________________________________________

32
CH. IV RESULTS AND DISCUSSION
It can be seen from Figures 6 and 7 that the particle size distributions for the different
samples of Thabazimbi iron ore as well as Sishen iron ore are very similar.
In comparing the size distributions of the Thabazimbi and Sishen iron ores, the Sishen
iron ore has a higher proportion of particles in the (+2 –3.35) mm, (+ 4 – 5) mm size
fractions and lower proportion of particles in the of - 0.25 mm, (+1 – 2) mm size
fractions than the Thabazimbi iron ore.
IV.1.1.1 Determination of very fine particles. After crushing, iron ore contains a large amount of fine particles. It is assumed that
improved granulation will be achieved when appropriate amounts of very fine
particles are present in the sinter mix. Past studies have shown that the very fine
particles have a great effect on sinter quality especially with respect to sinter strength,
better reactivity, and better fusibility as they adhere naturally to coarse particles [20].
The aim of this part of the study was to determine the amount of very fine particles
that are present in the Sishen and Thabazimbi iron ores. The very fine particles were
determined by comparing the size distributions of Thabazimbi and Sishen iron ores
calculated after wet and dry screening. The results are shown in Table 9. Two
parameters AC and ∆ were calculated: [27]
- AC = (%<75 µm)W
- ∆ = (%<75 µm)W - (%<75 µm)D
Where: (%<75 µm)W represents the weight fraction of the grains < 75 µm in the ore,
sieved under water
(%<75 µm)D represents the weight fraction of the grains < 75 µm in the ore,
sieved dry.
The procedure first consisted of sieving a sample of 4 kg through a 75 µm sieve for 5
minutes, and weighing the retained (+75 µm) and the passing (-75 µm) fractions. This
is the sieve analysis under dry conditions.

33
CH. IV RESULTS AND DISCUSSION
(%<75 µm)D is the weight of the fraction that passed the 75 µm sieve. Secondly the
retained fraction (+75 µm) is placed on the 75 µm sieve and washed under running
water, making sure that all the water is passing through the sieve and none over its
edges.
The process is stopped when the water passing through the sieves is clear. The
retained fraction is dried in the oven at 120 oC for 2 hours to remove water. The
weight of the fraction passing the 75µm sieve under wet conditions (%<75 µm)W will
be equal to the sum of the weight of the -75µm fraction when sieved under dry
conditions and the difference between the retained +75µm fraction under dry and wet
conditions.
Table 9 Determination of AC and ∆ Sample AC (%) ∆∆∆∆ (%) Sample AC (%) ∆∆∆∆ (%)
Thabazimbi 1 10.53 3.30 Sishen 1 6.35 2.05
Thabazimbi 2 10.00 3.60 Sishen 2 7.30 2.10
Thabazimbi 3 9.75 3.75 Sishen 3 7.40 2.10
Average 10.09 3.55 Average 7.02 2.08
Standard
deviation.
0.40 0.23 Standard
deviation.
0.58 0.03
Table 9 gives the results of sieve analyses done under dry and wet conditions, using a
75µm sieve. It shows that the parameters AC and ∆ for Thabazimbi iron ore are
bigger than for Sishen iron ore. It can therefore be concluded that Thabazimbi iron
ore has more fine particles than Sishen iron ore.
IV.1.1.2. Influence of moisture on permeability and mean granule diameter.
The influence of moisture content on the permeability and mean granule diameter was
studied in the range of 1-5% moisture for Sishen iron ore and 2-8% moisture for
Thabazimbi iron ore at 6 minutes of granulation.

34
CH. IV RESULTS AND DISCUSSION
Figure 8 shows that Sishen iron ore is more permeable than Thabazimbi iron ore at
moisture levels of 2 to 3%. The maximum permeability of 65.18 JPU was obtained at
2% moisture for Sishen iron ore, while for Thabazimbi iron ore a permeability of 43.1
JPU was obtained at 4% moisture. Sishen iron ore requires less water for granulation
to reach the maximum permeability than Thabazimbi iron ore. When water addition is
increased beyond the optimum value, bed permeability decreases. It was not possible
to test the permeability of Sishen iron ore at more than 5% moisture content, because
a further increase in water content resulted in the formation of a slurry during
granulation.
Figure 8. Influence of moisture content on permeability at 6 minutes of granulation
Figure 9 shows the influence of moisture content on the mean granule diameter. The
average particle size of the Sishen iron ore increases slightly from 3.1 mm before
granulation to a maximum value of 3.5 mm after granulation, while for Thabazimbi
iron ore it increases from 2.6 mm to 3.5 mm (Table 10). The difference between the
diameter before and after granulation of Thabazimbi is higher than for Sishen,
presumably because Thabazimbi iron ore has more fines than Sishen iron ore.
Thabazimbi iron ore granules also grow bigger than Sishen ore granules, also
presumably due to the higher fines (< 75µm) content of the Thabazimbi iron ore.
_____________________________________________________________________
0
10
20
30
40
50
60
70
0 2 4 6 8 10Moisture (%)
P (
JPU
)
ThabazimbiSishen

35
CH. IV RESULTS AND DISCUSSION
Figure 9. Influence of moisture content on mean granule diameter of pure iron ore
Table 10. Mean granule diameter of pure Thabazimbi iron ore and Sishen iron ore
Thabazimbi iron ore. Sishen iron ore
H
(%) P (JPU) D(mm) B.G
D(mm) A.G
H (%) P (JPU)
D(mm) B.G
D(mm) A.G
Sample 1 2 12 2.85 2.90 1 12 3.12 3.20 Sample 2 4 43 2.74 3.51 2 65 2.91 3.50 Sample 3 5 36 2.52 3.53 3 55 2.97 3.68 Sample 4 6 34 2.57 3.82 4 40 3.06 3.45 Sample 5 8 24 2.32 3.84 5 35 2.98 3.58
Average 2.60 3.52 3.01 3.48 IV.1.1.3 Influence of granulation time on permeability and mean granule diameter.
The influence of granulation time on permeability and mean granule diameter was
investigated in the range 2-10 minutes at optimum moisture content of 2% for Sishen
iron ore and 4% for Thabazimbi iron ore.
The highest permeability was obtained at 10 minutes for Thabazimbi iron ore, and 2
minutes for Sishen iron ore (Figure 10). Thabazimbi iron ore therefore requires more
time to be optimally granulated than Sishen iron ore; presumably to the higher fines
content of Thabazimbi iron ore.
_____________________________________________________________________
2.0
2.2
2.4
2.6
2.8
3.0
3.2
3.4
3.6
3.8
4.0
0 2 4 6 8 10Moisture (%)
Mea
n d
iam
eter
(mm
)
ThabazimbiSishen

36
CH. IV RESULTS AND DISCUSSION
Figure 10. Influence of granulation time on permeability of pure iron ore.
At their optimum moisture contents the permeability of Sishen iron ore is higher than
for Thabazimbi iron is.
Figure 11 shows the influence of granulation time on mean granule diameter. It
reveals that the mean granule diameter is a function of granulation time. As the time
increases, the mean granule diameter of the Sishen iron ore increases up to a certain
value after which it starts to decrease. With a further increase in time the mean
granule diameter starts to increase again in size. The same trend can be observed on
Figures 9 and 10, which represent respectively the influence of moisture content on
the mean granule diameter and the influence of granulation time on permeability.
These curves are sinusoidal.
Figure 11. Influence of granulation time on mean granule diameter of pure iron ore
3.4
3.5
3.6
3.7
3.8
3.9
0 2 4 6 8 10 12
Tim e (m inutes)
Mea
n d
iam
eter
(m
m)
Thabazim biS ishen

37
CH. IV RESULTS AND DISCUSSION The form of the mean diameter vs. time curve for Thabazimbi iron ore differs from
that of the curve for Sishen iron ore. The mean granule diameter of Sishen iron ore
grow more rapidly as a function of time than the mean granule diameter of
Thabazimbi iron ore. This explains why, Thabazimbi iron ore requires more time to
reach its highest permeability than Sishen iron ore.
IV.1.2. Mixture of Thabazimbi and Sishen iron ore only
In this part of the study the influence of moisture and granulation time on
permeability of a mixture of Thabazimbi and Sishen iron ore without fluxes were
investigated at 6 minutes of granulation. The mass ratio of Thabazimbi iron ore:
Sishen iron ore in the mixture was varied as follows: 20-80; 40-60; 50-50; 60-40; 80-
20.
Figure 12. Size distribution of the mixture Thabazimbi iron ore and Sishen
iron ore without fluxes.

38
CH. IV RESULTS AND DISCUSSION
By increasing the amount of Sishen iron ore in the Thabazimbi: Sishen iron ore
mixture without fluxes the mass percentage of the (-3.35 +2) mm and (-5 +4) mm size
fractions increased, while the mass percentages of the (– 4+3.35) mm and + 6 mm
size fractions decreased.
IV.1.2.1. Influence of moisture on permeability. The influence of moisture on permeability was studied in the range of 2-6% of
moisture content. It can be observed from Figure 13 that the mixture of 80% Sishen
iron ore and 20% Thabazimbi iron ore without fluxes is more permeable than any of
the other mixtures examined from 2 to 4% moisture content. A permeability of 44.24
J.P.U was obtained after 6 minutes of granulation at 3% of moisture. The
permeability increases with an increase in Sishen ore content in the mixture. At a 5%
of moisture content, the permeability of the mixture 20%Sishen iron ore and 80%
Thabazimbi iron ore peaks, and is higher than for any of the other mixtures.
Figure 13. Influence of moisture on the permeability of the mixture Thabazimbi iron
ore: Sishen iron ore without fluxes. _____________________________________________________________________
0
5
10
15
20
25
30
35
40
45
50
0 1 2 3 4 5 6 7
Moisture (%)
Per
mea
bili
ty (
JPU
)
20%Sishen&80%Thaba. 40%Sishen&60%Thaba 50%Sishen&50%Thaba.60%Sishen&40%Thaba. 80%Sishen&20%Thaba.

39
CH. IV RESULTS AND DISCUSSION The mixture 20% Sishen iron ore and 80% Thabazimbi iron ore requires more water
due to the high Thabazimbi iron ore content in the mixture, with associated higher
fines content.
It is not possible to compare the exact permeability values of the Sishen iron ore and
Thabazimbi iron ore mixtures to pure Thabazimbi iron ore or Sishen iron ore, because
the permeability test setup was different. This due to the fact that the venturi of the
permeability test used in Kumba Iron Ore pilot plant was changed after the
permeability tests on the pure Thabazimbi iron ore and Sishen iron ore samples. The
pressure drop (∆P) was consequently different, and therefore also the permeability
values. However, the trends of permeability vs. moisture content of pure Thabazimbi
iron ore and Sishen iron ore (Figure 8) can be compared to the trends of permeability
vs. moisture of Thabazimbi iron ore and Sishen iron ore mixtures (Figure 13). It can
be seen from these figures that the difference of permeabilities at optimum moisture
and at low moisture as well as at high moisture content of pure Sishen iron ore and the
mixture containing more Sishen iron ore than Thabazimbi iron ore is higher than of
pure Thabazimbi iron ore and the mixture containing more Thabazimbi iron ore.
IV.1.2.2 Influence of granulation time on permeability. The influence of granulation time on permeability was investigated at an optimum
moisture content of 3%. Figure 14 shows that the permeability of the mixture 20%
Thabazimbi and 80% Sishen is the highest for any granulation time from 2 to 10
minutes. A permeability of 46.45 J.P.U was obtained after 2 minutes of granulation at
3% of moisture content. The mixture 20% Thabazimbi, 80% Sishen without fluxes is
the optimum mixture.
_____________________________________________________________________

40
CH. IV RESULTS AND DISCUSSION
Figure 14. Influence of granulation time on permeability at optimum moisture content (3%) for Thabazimbi iron ore: Sishen iron ore mixtures without fluxes.
IV.2. Raw materials with fluxes
IV.2.1 Sishen and Thabazimbi iron ores with fluxes.
Figure 15 shows the size distribution of the mixture Sishen iron ore and Thabazimbi
iron ore with fluxes both sized and unsized. All the mixtures have high proportions of
material in the (-3,35 +2) size fraction. The mixture 20% Thabazimbi iron ore and
80% Sishen iron ore without fluxes has the highest proportion of material in the (-
3.35, +2) mm size fraction, while the mixture 80% Sishen iron ore and 20%
Thabazimbi iron ore with sized coke, lime, and return fines has the highest proportion
of material in the (-6, +5) mm size fraction.
_____________________________________________________________________

41
CH. IV RESULTS AND DISCUSSION
Figure 15. Size distribution of mixture Thabazimbi iron ore: Sishen iron ore with
fluxes
IV.2.1.1 Influence of moisture and mean granule diameter on permeability.
The influence of moisture and mean granule diameter on permeability of the
optimised mixture of 20% Thabazimbi iron ore, 80% Sishen iron ore with fluxes was
investigated.
In this part of the study the mixture of 50% Thabazimbi iron ore, 50% Sishen iron ore
with fluxes was also investigated, because traditionally Kumba Iron Ore pilot plant
uses this mixture for comparison of properties in their sinter experiments.
The fluxes were first used without being sized, after which the fluxes were sized as is
shown in Table 8.
The following abbreviations were used to describe these samples:
- Mixture 20&80 (50&50) with fluxes: The mixture 20% Thabazimbi iron ore, 80%
Sishen iron ore (50% Thabazimbi iron ore, 50% Sishen iron ore) with fluxes not
sized.
- (C&L): Coke and Lime sized.
- (C&L&R.F): Coke, Lime, and Return Fines all sized.
_____________________________________________________________________

42
CH. IV RESULTS AND DISCUSSION
Figure 16 reveals that the permeability of the mixture 20% Thabazimbi iron ore and
80% Sishen iron ore with fluxes where the coke, lime and return fines were sized gave
the highest permeability with a value of 49.12 J.P.U after 6 minutes of granulation at
4.5% of moisture. A maximum permeability of 44.72 J.P.U was obtained for the
mixture of 50% Thabazimbi, 50% Sishen iron ore where the coke, lime and return
fines were sized at 5,5% of moisture after 6 minutes of granulation. From Figure 16 it
can be seen that the permeabilities of both the 20% Thabazimbi iron ore, 80% Sishen
iron ore, and the 50% Thabazimbi iron ore, 50% Sishen iron ore mixtures with fluxes
where the coke, lime and return fines were sized were higher than when only the coke
and lime were sized as well as when none of the fluxes were sized.
Figure 16. Influence of moisture content on permeability of the different mixtures with fluxes.
The average mean diameter of the mixture 20% Thabazimbi iron ore, 80% Sishen iron
ore with fluxes changed from 2.36 mm before granulation to 3.88 mm after
granulation where the coke, and lime were sized, from 3.00 mm to 4.60 mm where the
coke, lime and return fines were sized,
_____________________________________________________________________
20
25
30
35
40
45
50
2.5 3 3.5 4 4.5 5 5.5 6 6.5 7
Moisture (%)
Per
mea
bili
ty (
JPU
)
Mixture20&80 with fluxes Mixture20&80with fluxes(C&L)Mixture20&80with fluxes(C,L&R.T) Mixture50&50with fluxesMixture50&50with fluxes(C&L) Mixture50&50with fluxes(C,L&R.F)

43
CH. IV RESULTS AND DISCUSSION
while in the mixture 50% Sishen iron ore, 50% Thabazimbi iron ore with fluxes the
average mean diameter changed from 2.68 mm to 4.03 mm where the coke and lime
were sized and from 2.90 mm to 4.31 mm where the coke, lime and return fines were
sized (Tables 11 and 12).
3
3.2
3.4
3.6
3.8
4
4.2
4.4
4.6
4.8
5
2.5 3 3.5 4 4.5 5 5.5 6 6.5 7Moisture (%)
Mea
n d
iam
eter
(m
m)
Mixture 20 & 80 with fluxes (C & L)
Mixture 20 & 80 with fluxes (C & L & RF)
Mixture 50 & 50 with fluxes (C & L)
Mixture 50 & 50 with fluxes (C & L & R.F)
Figure 17. Influence of moisture content on mean granule diameter.
Table 11. Mean granule diameter of 20% Thabazimbi iron ore - 80%Sishen iron ore mixtures.
20&80 with fluxes(C&L) 20&80 with fluxes(C&L&RF)
Sample H (%) P
(JPU) D(mm)
B.G D(mm)
A.G H (%) P
(JPU) D(mm)
B.G D(mm)
A.G 1 3 34 2.34 3.49 3 34 2.92 4.20 2 4 42 2.35 3.85 4 46 3.05 4.61 3 4.5 48 2.32 3.81 4.5 49 3.06 4.75 4 5 38 2.41 4.36 5 44 2.92 4.79
Average 2.36 3.88 2.99 4.59
_____________________________________________________________________

44
CH. IV RESULTS AND DISCUSSION
Table 12. Mean granule diameter of 50% Thabazimbi iron ore - 50%Sishen iron ore mixtures.
50&50 with fluxes(C&L) 50&50 with fluxes(C&L&RF)
Sample H (%) P
(JPU) D(mm)
B.G D(mm)
A.G H (%) P
(JPU) D(mm)
B.G D(mm)
A.G 1 4 32 2.81 3.62 4 33 2.95 3.98 2 5 39 2.78 3.91 5 41 2.93 4.09 3 5.5 44 2.46 4.03 5.5 45 2.92 4.30 4 6 41 2.65 4.55 6 44 2.89 4.52 5 - - - - 6.5 42 2.81 4.67
Average 2.68 4.03 2.90 4.31
The sizing of the coke, lime, and return fines by removing fine particles increases the
mean diameter before granulation and consequently the mean diameter after
granulation. The mixture 20% Thabazimbi iron ore and 80% Sishen iron ore with
fluxes where, coke, lime and return fines were sized has the highest mean diameter
after granulation, while the 50% Thabazimbi iron ore- 50% Sishen iron ore mixture
where only the coke and lime were sized the lowest .
IV.2.1.2 Influence of granulation time on permeability. Figure 18 shows the influence of granulation time on permeability.
The mixture 20% Thabazimbi iron ore and 80% Sishen iron ore with fluxes had the
highest permeability (50.80 JPU) where the coke, lime and return fines were sized,
and had 48 JPU where only the coke and lime were sized after 4 minutes of
granulation. The mixture 50% Thabazimbi and 50% Sishen with fluxes had a
permeability of 44.72 JPU, where the coke, lime and return fines were sized and 43.52
JPU where only the coke and lime were sized, after 6 minutes of granulation.
_____________________________________________________________________

45
CH. IV RESULTS AND DISCUSSION
Figure 18. Influence of granulation time on permeability.
The sizing of the return fines increased the permeability from 48 to 50.80 JPU at 4
minutes of granulation for the mixture 20% Thabazimbi iron ore and 80% Sishen iron
ore and from 43.52 to 44.72 JPU for the mixture 50%Thabazimbi iron ore and 50%
Sishen iron ore at 6 minutes of granulation.
IV.3 Variation in material transfer between granulometric classes.
In this part of the study the fine particles that are involved in the granulation process,
the extent of material transfer, and the effective elimination of fines were studied.
This was done by comparing the size distribution of the raw material under study
before granulation and after granulation for each granulometric class. The results
obtained were presented on a semi logarithmic graph, where the ordinate (arithmetic
scale) shows the gain or loss as a percentage of the total sample weight, and the
abscissa (logarithmic scale) shows the granulation class. Each point represents the
difference between the quantities of material before and after granulation for each
granulometric class.
_____________________________________________________________________

46
CH. IV RESULTS AND DISCUSSION It was assumed that [27]:
X: The size limit between the reduced and increased granulometric fraction during the
granulation process expressed in mm, considering that the reduced and increased
granulometric fractions are the fractions whose relative percentages reduce or increase
respectively after granulation.
S: The level of material transfer between the reduced and increased granulometric
fractions, expressed as a percentage of the total weight of the sample.
Ex: The efficiency of elimination of the fraction smaller than X mm, during the
granulation process.
(%<Xmm)BG = the weight fraction of grains less than X mm in the ore before
granulation.
(%>Xmm)BG = the corresponding weight fraction above X mm.
(%<Xmm)AG = the weight fraction of grains less than X mm in the ore after
granulation.
(%>Xmm)AG = the corresponding weight fraction above X mm
The expressions of S and Ex are: S = (%<Xmm)BG - (%<Xmm)AG
= (%>Xmm)AG - (%>Xmm)BG
Ex = 100*S/S’ Where S’ = (%<Xmm)BG The value of X is obtained from the intersection of each curve with the x-axis of the
semi logarithmic graph. Figures 19 to 26 illustrate the variation in material transfer of
pure Thabazimbi and Sishen iron ores, and of the raw material mixture with fluxes
between granulometric classes for different moistures levels at 6 minutes of
granulation.
IV.3.1 Pure Thabazimbi and Sishen iron ores Figures 19 and 20 reveal that the notion of fine and coarse particles depends mainly
on the amount of water used for granulation as well as the nature of the ore mineral.
Therefore, at a fixed percentage of moisture, fine particles are defined as the limit
between the reduced and the increased granulometric fraction.
_____________________________________________________________________

47
CH. IV RESULTS AND DISCUSSION
In other words, the size less than X are considered as the fine particles. In varying the
amount of moisture, the intermediate particles will be defined as those particles
comprised between X at low moisture and X at high moisture. In the case of
Thabazimbi iron ore (Figure 19) particles less than 0.25 mm in diameter are
considered fines at a 2% of moisture content.
In varying the moisture from 2% to 8% the intermediate size particles are those with
diameters between 0.25 to 1 mm. In conclusion for Thabazimbi iron ore, particles
with diameters less than 0.25 mm are fines, the intermediates particles have diameters
between 0.25 mm and 1 mm and coarse particles have diameters that exceed 1 mm.
From Figure 20, it can be concluded for Sishen iron ore that particles with diameters
smaller than 0.66 are fines, the intermediates particles have diameters between 0.66
mm and 1,5 mm and the coarse particles have diameters larger than 1,5 mm.
Figure 19. Variation in material transfer between granulometric classes of Thabazimbi iron ore. (H= moisture content)
_____________________________________________________________________
(25)
(20)
(15)
(10)
(5)
0
5
10
15
20
25
0.010 0.100 1.000 10.000
Fraction(mm)
% L
oss
or
Gai
n
2% H 4% H 5% H 6% H 8% H

48
CH. IV RESULTS AND DISCUSSION
Figure 20. Variation in material transfer between granulometric classes of Sishen iron ore. (H= moisture content)
IV.3.2 Mixture of 50% Thabazimbi iron ore, 50% Sishen iron ore with fluxes.
In the mixture 50% Thabazimbi iron ore and 50% Sishen iron ore with fluxes not
sized, fines particle have diameters smaller than 0.48 mm and coarse particles have
diameters larger than 1.8 mm (Figure 21). For the mixture 50% Thabazimbi iron ore
and 50% Sishen iron ore where the coke and lime were sized, fine particles have
diameters smaller than 1 mm and coarse particles have diameters larger than 2.9 mm
(Figure 22). For the mixture 50% Thabazimbi iron ore and 50% Sishen iron ore with
fluxes where the coke, lime and return fines were sized, fines particles have diameters
smaller than 2 mm and coarse particle have diameters larger than 3.35 mm (Figure
23).
_____________________________________________________________________

49
CH. IV RESULTS AND DISCUSSION
Figure 21. Variation in material transfer between granulometric classes for the mixture 50% Thabazimbi and 50% Sishen with fluxes not sized. (H=
moisture content)
Figure 22. Variation in material transfer between granulometric classes for the mixture 50% Thabazimbi and 50% Sishen with only, coke and lime sized.
(H= moisture content) _____________________________________________________________________
(40)
(30)
(20)
(10)
0
10
20
30
40
50
0.01 0.10 1.00 10.00
Fraction (mm)
Lo
ss o
r G
ain
(%
)
H = 4% H = 5% H = 5.5% H = 6%

50
CH. IV RESULTS AND DISCUSSION
Figure 23. Variation in material transfer between granulometric classes for the mixture 50% Thabazimbi and 50% Sishen with coke, lime and return
fines sized. (H= moisture content)
IV.3.3 Mixture of 20%Thabazimbi, 80% Sishen with fluxes.
In the mixture 20% Thabazimbi iron ore and 80% Sishen iron ore with fluxes not
sized, fine particles have diameters smaller than 0.9 mm and coarse particles have
diameter larger than 2.9 mm (Figure 24). For the mixture 20% Thabazimbi iron ore
and 80% Sishen iron ore where the coke and lime were sized, fine particles have
diameters smaller than 1.4 mm and coarse particle have diameters larger than 3.35
mm (Figure 25). For the mixture 20% Thabazimbi and 80% Sishen with fluxes where
the coke, lime and return fines were sized, fines particles have diameters smaller than
2.4 mm and coarse particle have diameters larger than 3.35 mm (Figure 26).
_____________________________________________________________________
(40)
(30)
(20)
(10)
0
10
20
30
40
0.01 0.10 1.00 10.00
Fraction (mm)
Lo
ss o
r G
ain
(%
)
H = 4% H = 5% H = 5,5% H = 6% H = 6.5%

51
CH. IV RESULTS AND DISCUSSION
Figure 24. Variation in material transfer between granulometric classes for the
mixture 20% Thabazimbi and 80% Sishen with fluxes, not sized. (H= moisture content)
Figure 25. Variation in material transfer between granulometric classes for the mixture 20% Thabazimbi and 80% Sishen with coke and lime sized. (H=
moisture content) _____________________________________________________________________
(35.00)
(25.00)
(15.00)
(5.00)
5.00
15.00
25.00
35.00
0.01 0.10 1.00 10.00
Fraction (mm)
Lo
ss o
r G
ain
(%
)
H = 3% H = 4% H = 4.5% H = 5%
(40)
(30)
(20)
(10)
0
10
20
30
40
0.01 0.10 1.00 10.00
Fraction (mm)
Lo
ss o
r G
ain
(%
)
H = 3% H = 4% H = 4.5% H = 5%

52
CH. IV RESULTS AND DISCUSSION
Figure 26. Variation in material transfer between granulometric classes for the
mixture 20% Thabazimbi and 80% Sishen with fluxes, coke, lime, and return fines sized. (H= moisture content)
Figures 21 – 26 which show the variation in material transfer between granulometric
classes for the mixtures 50% Thabazimbi iron ore - 50% Sishen iron ore and 20%
Thabazimbi iron ore - 80% Sishen iron ore with fluxes reveal that the removal of the -
0.5 mm size fraction of coke breeze, - 0.5 mm size fraction of return fines and -1 mm
size fraction of limestone increase the size limit (X) between the reduced and
increased granulometric fractions.
IV.4 Granulation potentials of Thabazimbi and Sishen iron ores and
mixtures between them.
The results on the influence of moisture content on permeability and mean granule
diameter at 6 minutes of granulation, on Thabazimbi iron ore, Sishen iron ore and
their mixtures as well as the variation on material transfer between granulometric
classes are summarised in Tables 13 to 20. These results depict the granulation
potential of Thabazimbi and Sishen iron ores and their mixtures. It allows the
comparison of the potential of granulation of a given iron ore or a mixture between
them.
_____________________________________________________________________
(40)
(30)
(20)
(10)
0
10
20
30
40
0.01 0.10 1.00 10.00
Fraction (mm)
Lo
ss o
r G
ain
(%
)
H = 3% H =4% H = 4.5% H = 5%

53
CH. V RESULTS AND DISCUSSION The granulation potential of a given iron ore or an iron ore mixture is better than
another one, if its permeability and the amount of material transfer (Ex) is higher at
optimum moisture contents and also if its moisture content (H) is less. The value of S
indicates the amount of material transfer in mass percentage and the value of Ex
shows which fines are eliminated effectively. H is the moisture content in mass
percentage on a dry basis and P is the permeability in terms of the Japanese
Permeability Unit. D (B.G.) and D (A.G) are respectively the mean diameter before
granulation and after granulation expressed in mm. The calculation of S and Ex is
shown in Appendix II.
In comparing the granulation potentials of Thabazimbi and Sishen iron ores, (Tables
13 and 14) it can be concluded that the granulation potential of Sishen iron ore is
better than that of Thabazimbi iron ore, because Sishen iron ore has a higher
permeability (65.18 JPU), at a lower moisture content (2%). The amount of material
transfer (Ex = 97%) of Thabazimbi iron ore is higher at optimum moisture contents
than for Sishen iron ore (Ex =92.85%). The optimum moisture content of Sishen iron
ore (2%) is less than for one of Thabazimbi iron ore (4%).
Table 13. Characterisation of granulation potential of Thabazimbi iron ore.
H (%) P (JPU) X (mm) S (%) EX (%) D (mm)
B.G. D (mm) A.G.
Sample 1 2 13 0.25 13.1 93.3 2.85 2.90
Sample 2 4 43 0.50 21.8 97.0 2.74 3.51
Sample 3 5 36 0.65 25.2 100.0 2.52 3.53
Sample 4 6 34 0.90 31.6 93.9 2.57 3.82
Sample 5 8 25 1.00 38.6 100.0 2.32 3.84
_____________________________________________________________________

54
CH. V RESULTS AND DISCUSSION Table 14. Characterisation of granulation potential of Sishen iron ore H (%) P (JPU) X (mm) S (%) EX (%) D (mm)
B.G. D (mm) A.G.
Sample 1 1 13 0.66 6.9 43.6 3.12 3.20
Sample 2 2 65 0.70 17.0 92.9 2.91 3.50
Sample 3 3 55 1.00 18.0 100.0 2.97 3.68
Sample 4 4 40 1.00 16.2 100.0 3.06 3.45
Sample 5 5 35 1.50 17.3 52.2 2.98 3.58
In comparing the granulation potentials of mixtures containing 50% Thabazimbi iron
ore and 50% Sishen iron ore, the mixture where the coke and lime were sized (Table
16) present a better sinter mixture than the mixture where the coke, lime and return
fines were sized (Table 17) and where the fluxes were not sized (Table15). Although
its permeability (P =43.52 JPU) is slightly less than of the mixture where the coke,
lime and return fines were sized (43.52 vs 44.72JPU), it presents a higher efficiency
of elimination of fine particles (Ex = 76.22% vs. 59,70%).
Table 15. Granulation potential of mixture 50% Thabazimbi, 50% Sishen with fluxes not sized.
H (%) P (JPU) X (mm) S (%) EX (%) D (mm) B.G.
D (mm) A.G.
Sample 1 4 32 0.48 17.5 98.7 2.51 3.15
Sample 2 5 38 1.50 31.9 61.5 2.45 3.61
Sample 3 5.5 42 1.60 35.1 73.3 2.59 4.01
Sample 4 6 33 1.80 39.3 85.6 2.65 4.34
_____________________________________________________________________
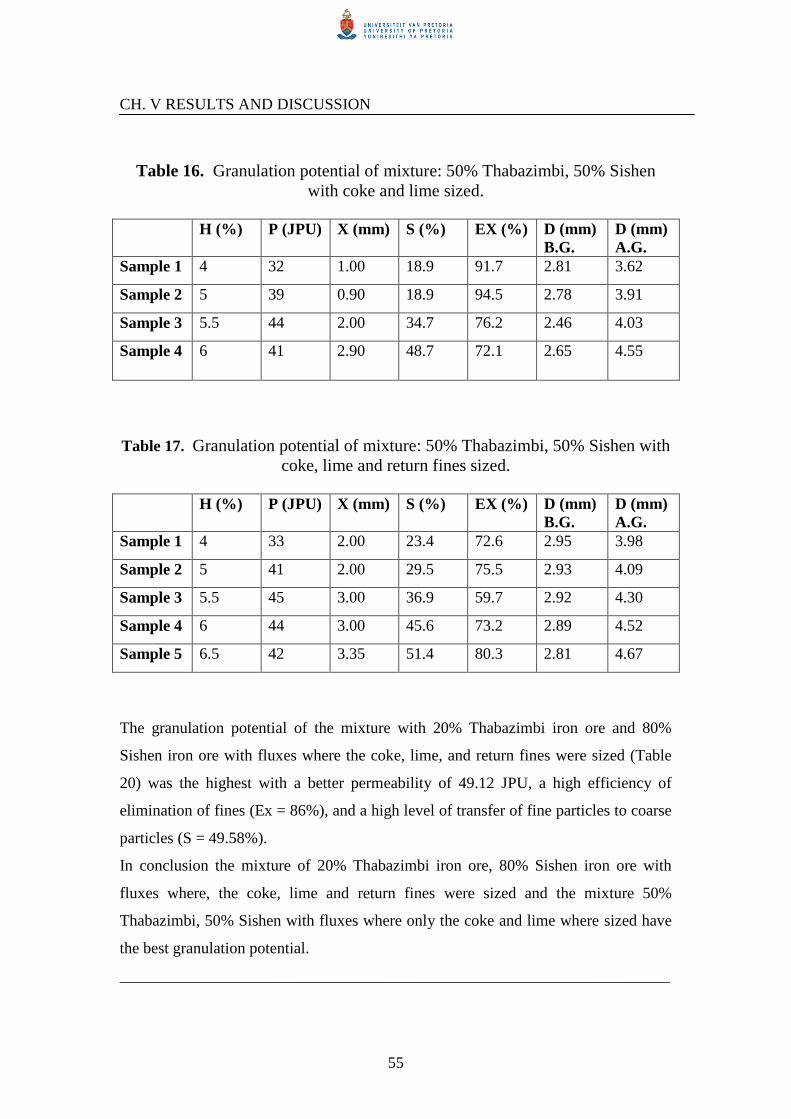
55
CH. V RESULTS AND DISCUSSION
Table 16. Granulation potential of mixture: 50% Thabazimbi, 50% Sishen
with coke and lime sized. H (%) P (JPU) X (mm) S (%) EX (%) D (mm)
B.G. D (mm) A.G.
Sample 1 4 32 1.00 18.9 91.7 2.81 3.62
Sample 2 5 39 0.90 18.9 94.5 2.78 3.91
Sample 3 5.5 44 2.00 34.7 76.2 2.46 4.03
Sample 4 6 41 2.90 48.7 72.1 2.65 4.55
Table 17. Granulation potential of mixture: 50% Thabazimbi, 50% Sishen with
coke, lime and return fines sized. H (%) P (JPU) X (mm) S (%) EX (%) D (mm)
B.G. D (mm) A.G.
Sample 1 4 33 2.00 23.4 72.6 2.95 3.98
Sample 2 5 41 2.00 29.5 75.5 2.93 4.09
Sample 3 5.5 45 3.00 36.9 59.7 2.92 4.30
Sample 4 6 44 3.00 45.6 73.2 2.89 4.52
Sample 5 6.5 42 3.35 51.4 80.3 2.81 4.67
The granulation potential of the mixture with 20% Thabazimbi iron ore and 80%
Sishen iron ore with fluxes where the coke, lime, and return fines were sized (Table
20) was the highest with a better permeability of 49.12 JPU, a high efficiency of
elimination of fines (Ex = 86%), and a high level of transfer of fine particles to coarse
particles (S = 49.58%).
In conclusion the mixture of 20% Thabazimbi iron ore, 80% Sishen iron ore with
fluxes where, the coke, lime and return fines were sized and the mixture 50%
Thabazimbi, 50% Sishen with fluxes where only the coke and lime where sized have
the best granulation potential.
_____________________________________________________________________
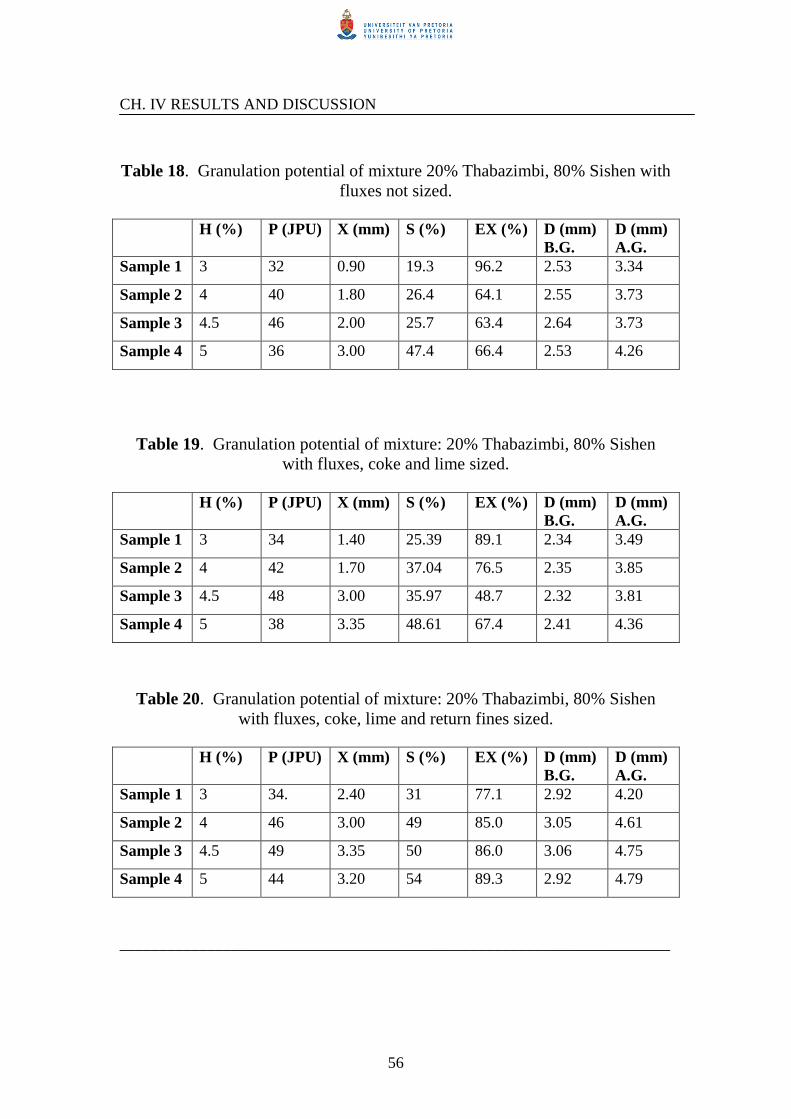
56
CH. IV RESULTS AND DISCUSSION
Table 18. Granulation potential of mixture 20% Thabazimbi, 80% Sishen with
fluxes not sized. H (%) P (JPU) X (mm) S (%) EX (%) D (mm)
B.G. D (mm) A.G.
Sample 1 3 32 0.90 19.3 96.2 2.53 3.34
Sample 2 4 40 1.80 26.4 64.1 2.55 3.73
Sample 3 4.5 46 2.00 25.7 63.4 2.64 3.73
Sample 4 5 36 3.00 47.4 66.4 2.53 4.26
Table 19. Granulation potential of mixture: 20% Thabazimbi, 80% Sishen with fluxes, coke and lime sized.
H (%) P (JPU) X (mm) S (%) EX (%) D (mm)
B.G. D (mm) A.G.
Sample 1 3 34 1.40 25.39 89.1 2.34 3.49
Sample 2 4 42 1.70 37.04 76.5 2.35 3.85
Sample 3 4.5 48 3.00 35.97 48.7 2.32 3.81
Sample 4 5 38 3.35 48.61 67.4 2.41 4.36
Table 20. Granulation potential of mixture: 20% Thabazimbi, 80% Sishen
with fluxes, coke, lime and return fines sized. H (%) P (JPU) X (mm) S (%) EX (%) D (mm)
B.G. D (mm) A.G.
Sample 1 3 34. 2.40 31 77.1 2.92 4.20
Sample 2 4 46 3.00 49 85.0 3.05 4.61
Sample 3 4.5 49 3.35 50 86.0 3.06 4.75
Sample 4 5 44 3.20 54 89.3 2.92 4.79
_____________________________________________________________________

57
CH. IV RESULTS AND DISCUSSION
Sintering pot tests were subsequently done on the mixtures 20% Thabazimbi iron ore,
80% Sishen iron ore where the coke, lime and return fines were sized (Mixture II),
and on 50% Thabazimbi iron ore, 50% Sishen iron ore (Mixture IV) in which only
the coke and lime were sized. The investigation was extended to the mixtures 20%
Thabazimbi iron ore, 80% Sishen iron ore where only the coke and lime were sized
(Mixture III) and 50% Thabazimbi iron ore, 50% Sishen iron ore (Mixture I) in which
the return fines, coke, and lime were sized, because their permeabilities were also
high.
IV.5 Mixture Phoenix iron ore –Sishen iron ore with fluxes.
In this part of the study, the pick up of adhering fines by nuclear particles for a blend
of Sishen and Phoenix iron ores and as-received fluxes with fluxes was examined.
The mixture was constituted from 50% Sishen iron ore and 50% Phoenix iron ore
where the Phoenix iron ore was sized as shown in Table 18.
Table 21. Size distribution of Phoenix iron ore
Fraction (mm) -5 +2 -2 + 0.8 -0.8
Mass (%) 50 20 30
The mixture Phoenix iron ore and Sishen iron ore has a high proportion of material in
the (-3.35 + 2) mm, (-2 + 1) mm, (-6 +5) mm and, (-5 +4) mm size fractions, but
very little in the + 6 mm size fraction (Figure 27).
Four granulation tests were done in which the moisture content was varied from 3 to
6% (Figure 28), and the granulation time varied between 2 and 10 minutes (Figure
29). It was found that a maximum permeability of 49.63 JPU was obtained at a 5%
moisture content after 6 minutes of granulation.
_____________________________________________________________________

58
CH. IV RESULTS AND DISCUSSION
The mean granule diameter of the mixture was about 2.2 mm before granulation and
4.3 mm after granulation at an optimum moisture content of 5%.
After 6 minutes of each granulation experiment, two samples of the granulated
mixture were collected and frozen with liquid nitrogen, followed by sieving to
different size fractions from 5 to 1 mm (Appendix IV).
Each size fraction was again sieved after it was dried at 110oC for 2 hours, in order to
determine which size of particles adhered to which size of particles.
Figure 27. Size distribution of the mixture Phoenix iron ore-Sishen iron ore
with fluxes.
_____________________________________________________________________

59
CH. IV RESULTS AND DISCUSSION
Figure 28. Influence of moisture content on the permeability of the mixture Phoenix iron ore- Sishen iron ore with fluxes.
Figure 29. Influence of granulation time on the permeability of the mixture Phoenix iron ore- Sishen iron ore with fluxes.
_____________________________________________________________________
0
10
20
30
40
50
60
0 2 4 6 8 10 12
Time (minutes)
Per
mea
bili
ty (
JPU
)
30
35
40
45
50
55
2 3 4 5 6 7
Moisture (%)
Per
mea
bili
ty (
JPU
)
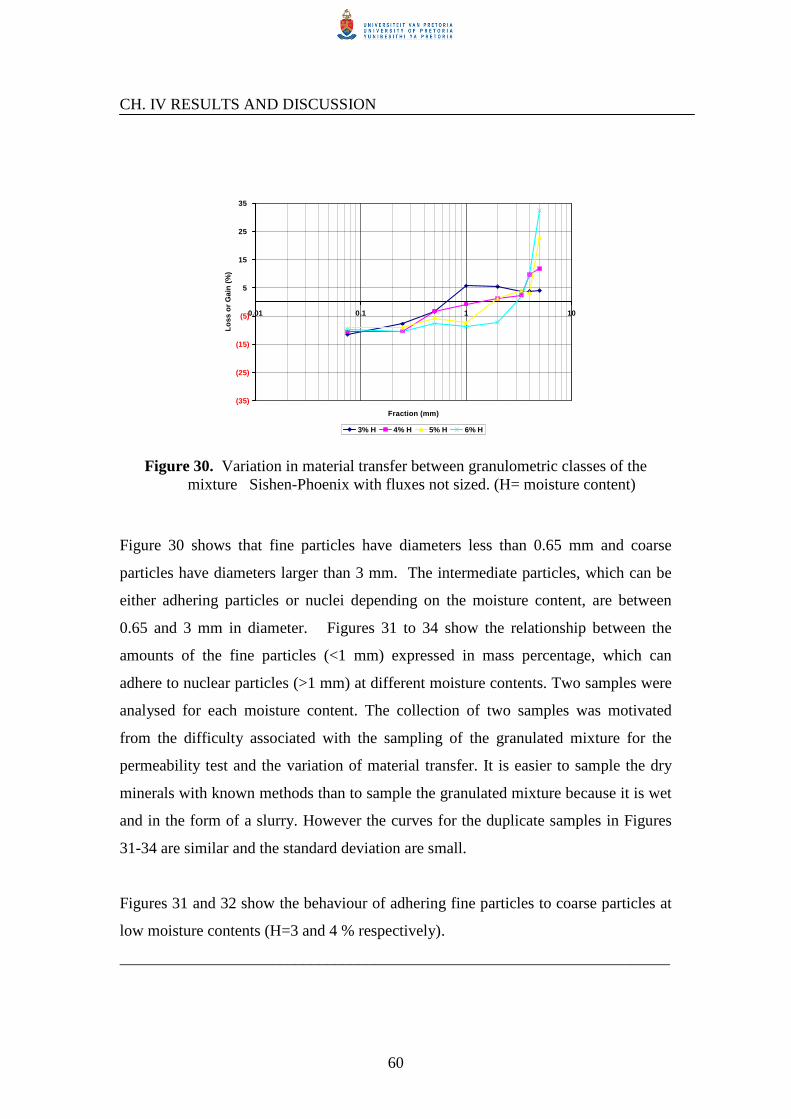
60
CH. IV RESULTS AND DISCUSSION
Figure 30. Variation in material transfer between granulometric classes of the
mixture Sishen-Phoenix with fluxes not sized. (H= moisture content)
Figure 30 shows that fine particles have diameters less than 0.65 mm and coarse
particles have diameters larger than 3 mm. The intermediate particles, which can be
either adhering particles or nuclei depending on the moisture content, are between
0.65 and 3 mm in diameter. Figures 31 to 34 show the relationship between the
amounts of the fine particles (<1 mm) expressed in mass percentage, which can
adhere to nuclear particles (>1 mm) at different moisture contents. Two samples were
analysed for each moisture content. The collection of two samples was motivated
from the difficulty associated with the sampling of the granulated mixture for the
permeability test and the variation of material transfer. It is easier to sample the dry
minerals with known methods than to sample the granulated mixture because it is wet
and in the form of a slurry. However the curves for the duplicate samples in Figures
31-34 are similar and the standard deviation are small.
Figures 31 and 32 show the behaviour of adhering fine particles to coarse particles at
low moisture contents (H=3 and 4 % respectively).
_____________________________________________________________________
(35)
(25)
(15)
(5)
5
15
25
35
0.01 0.1 1 10
Fraction (mm)
Lo
ss o
r G
ain
(%
)
3% H 4% H 5% H 6% H

61
CH. IV RESULTS AND DISCUSSION
They reveal that, at low moisture contents fine particles adhere more to particles of
intermediate size (-3+0.65) mm than coarse particles. It can also be seen that at a 3%
moisture contents the classes + 5 mm and (-5 + 4) mm don’t participate in
granulation, because there is not a sufficient amount of water available for
granulation. Class (-1+0.5) mm report mainly to the class (-2+1) mm size fraction
(Figure 31, Table 22). By increasing the water content from below the optimum
moisture, all the classes start to participate in granulation (Figure 32, Table 23).
The trends of the curves show that, fine particles start to adhere to nuclear particles in
ascending order of size, from 1 to 5 mm.
Figure 31. Adhesion of fine particles (x<1 mm) to coarse particles (x>1 mm)
at 3% moisture content. _____________________________________________________________________
0
5
10
15
20
0 1 2 3 4 5 6
Fraction (mm)
% M
ass
- 0.25 mm (+0.25-0.5) mm(+0.5-1) mm
0
5
10
15
20
0 1 2 3 4 5 6
Fraction (mm)
% M
ass
- 0.25 mm (+0.25-0.5) mm(+0.5-1) mm
(a) (b)
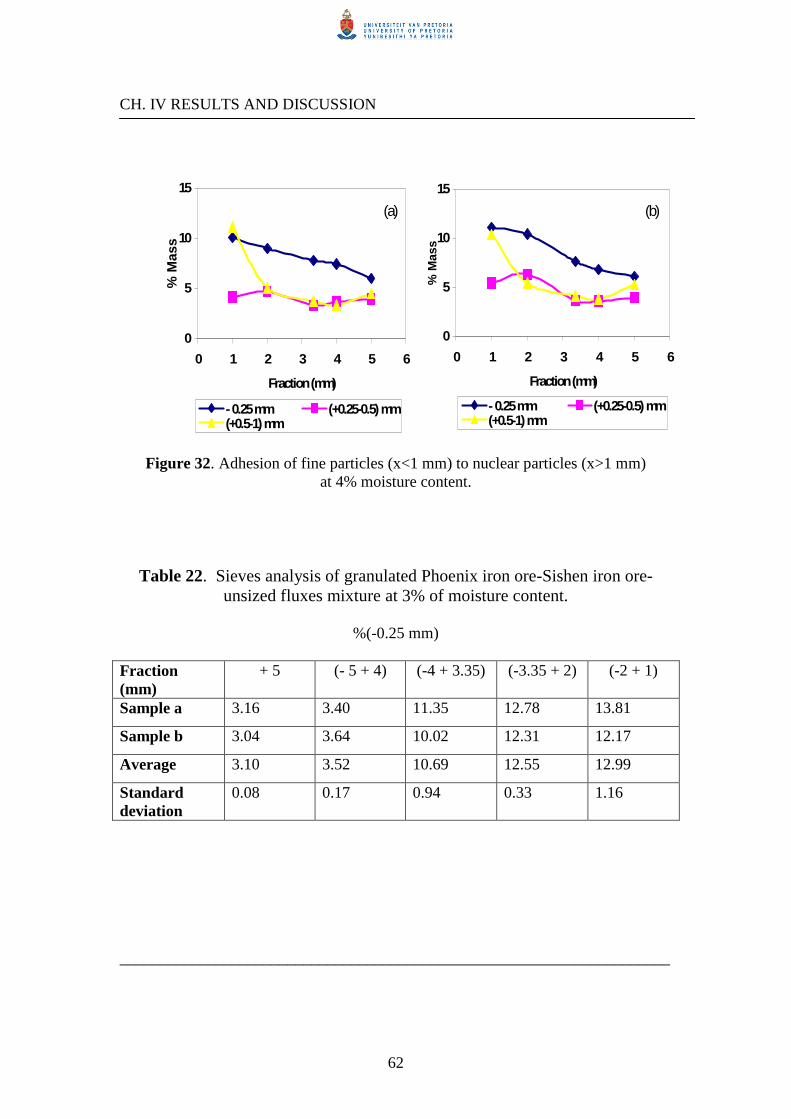
62
CH. IV RESULTS AND DISCUSSION
Figure 32. Adhesion of fine particles (x<1 mm) to nuclear particles (x>1 mm)
at 4% moisture content.
Table 22. Sieves analysis of granulated Phoenix iron ore-Sishen iron ore-
unsized fluxes mixture at 3% of moisture content.
%(-0.25 mm)
Fraction (mm)
+ 5 (- 5 + 4) (-4 + 3.35) (-3.35 + 2) (-2 + 1)
Sample a 3.16 3.40 11.35 12.78 13.81
Sample b 3.04 3.64 10.02 12.31 12.17
Average 3.10 3.52 10.69 12.55 12.99
Standard deviation
0.08 0.17 0.94 0.33 1.16
_____________________________________________________________________
0
5
10
15
0 1 2 3 4 5 6
Fraction (mm)
% M
ass
- 0.25 mm (+0.25-0.5) mm(+0.5-1) mm
0
5
10
15
0 1 2 3 4 5 6
Fraction (mm)
% M
ass
- 0.25 mm (+0.25-0.5) mm(+0.5-1) mm
(a) (b)

63
CH. IV RESULTS AND DISCUSSION
%(+0.25 – 0.5) mm
Fraction (mm)
+ 5 (- 5 + 4) (-4 + 3.35) (-3.35 + 2) (-2 + 1)
Sample a 0.83 1.05 2.12 3.55 6.62
Sample b 1.01 1.26 1.89 4.10 7.30
Average 0.92 1.15 2.00 3.83 6.96
Standard deviation
0.13 0.15 0.16 0.39 0.48
%(+ 0.5 – 1) mm
Fraction (mm)
+ 5 (- 5 + 4) (-4 + 3.35) (-3.35 + 2) (-2 + 1)
Sample a 0.66 0.65 0.76 2.34 15.03
Sample b 0.58 0.84 1.02 2.05 17.28
Average 0.62 0.75 0.87 2.20 16.15
Standard deviation
0.06 0.13 0.18 0.21 1.59
Table 23. Sieves analysis of granulated Phoenix iron ore-Sishen iron ore- unsized fluxes mixture at 4% of moisture content.
%(-0.25 mm)
Fraction (mm)
+ 5 (- 5 + 4) (-4 + 3.35) (-3.35 + 2) (-2 + 1)
Sample a 6.02 7.43 7.80 8.99 10.08
Sample b 6.08 6.80 7.63 10.42 11.12
Average 6.05 7.12 7.72 9.71 10.60
Standard deviation
0.04 0.45 0.12 1.01 0.74
_____________________________________________________________________

64
CH. IV RESULTS AND DISCUSSION
%(+0.25 – 0.5) mm
Fraction (mm)
+ 5 (- 5 + 4) (-4 + 3.35) (-3.35 + 2) (-2 + 1)
Sample a 3.94 3.69 3.32 4.67 4.15
Sample b 3.95 3.60 3.65 6.34 5.41
Average 3.95 3.65 3.49 5.50 4.78
Standard deviation
0.01 0.06 0.23 1.18 0.89
%(+ 0.5 – 1) mm
Fraction (mm)
+ 5 (- 5 + 4) (-4 + 3.35) (-3.35 + 2) (-2 + 1)
Sample a 4.49 3.34 3.76 5.07 11.13
Sample b 5.29 3.80 4.15 5.44 10.37
Average 4.89 3.57 3.96 5.26 10.75
Standard deviation
0.57 0.33 0.28 0.26 0.54
Figures 33a and 33b as well as Table 24 show the behaviour at the optimum moisture
content of 5%. At the optimum moisture content the – 0.25 mm and (– 0.5 + 0.25)
mm size fractions are distributed almost equally between intermediate and nuclear
particles. Class (–1 + 0.5) mm adhere preferentially to the (-2 + 1) mm size fraction.
_____________________________________________________________________

65
CH. IV RESULTS AND DISCUSSION
Figure 33. Adhesion of fine particles (x< 1 mm) to nuclear particles (x >1 mm) at 5% of moisture.
Table 24. Sieves analysis of granulated Phoenix iron ore-Sishen iron ore- unsized fluxes mixture at 5% of moisture content.
%(-0.25 mm)
Fraction (mm)
+ 5 (- 5 + 4) (-4 + 3.35) (-3.35 + 2) (-2 + 1)
Sample a 5.29 5.26 4.99 4.15 5.06
Sample b 5.84 5.16 6.28 6.61 6.67
Average 5.57 5.21 5.64 5.38 5.87
Standard deviation
0.39 0.07 0.91 1.74 1.14
_____________________________________________________________________

66
CH. IV RESULTS AND DISCUSSION
%(+0.25 – 0.5) mm
Fraction (mm)
+ 5 (- 5 + 4) (-4 + 3.35) (-3.35 + 2) (-2 + 1)
Sample a 3.54 3.73 2.80 2.31 4.27
Sample b 3.89 3.46 3.08 3.19 4.07
Average 3.72 3.60 2.94 2.75 4.17
Standard deviation
0.25 0.19 0.20 0.62 0.14
%(+ 0.5 – 1) mm
Fraction (mm)
+ 5 (- 5 + 4) (-4 + 3.35) (-3.35 + 2) (-2 + 1)
Sample a 4.30 3.98 3.65 4.06 10.58
Sample b 4.40 3.58 3.67 4.18 13.50
Average 4.35 3.78 3.66 4.12 12.04
Standard deviation
0.07 0.28 0.01 0.08 2.06
Figure 34. Adhesion of fine particles (x< 1 mm) to nuclear particles (x>1 mm)
at 6% moisture content. _____________________________________________________________________
0
5
10
15
0 1 2 3 4 5 6
Fraction (mm)
% M
ass
- 0.25 mm (+0.25-0.5) mm(+0.5-1) mm
0
5
10
15
0 1 2 3 4 5 6
Fraction (mm)
% M
ass
- 0.25 mm (+0.25-0.5) mm(+0.5-1) mm
(a) (b)

67
CH. IV RESULTS AND DISCUSSION
Figures 34a and 34b show the adhesion of fine particles to nuclear particles at a high
moisture content of 6%. Above the optimum moisture content, all classes take part in
granulation. Class –0.25 mm report preferentially to (-4 + 3.35 mm) size fraction,
while class (–1+0.5) mm adhere preferentially to the (-2 + 1) mm size fraction and
class (–0.5 + 0.25) mm adhere preferentially to the +5 mm size fraction.
Table 25. Sieves analysis of granulated Phoenix iron ore-Sishen iron ore- unsized fluxes mixture at 6 % of moisture content.
%(-0.25 mm)
Fraction (mm)
+ 5 (- 5 + 4) (-4 + 3.35) (-3.35 + 2) (-2 + 1)
Sample a 7.50 7.97 11.83 7.12 5.27
Sample b 7.60 7.26 12.03 5.99 3.92
Average 7.55 7.62 11.93 6.56 4.59
Standard deviation
0.07 0.50 0.14 0.80 0.96
%(+0.25 – 0.5) mm
Fraction (mm)
+ 5 (- 5 + 4) (-4 + 3.35) (-3.35 + 2) (-2 + 1)
Sample a 6.65 4.22 3.33 3.31 3.16
Sample b 5.87 3.80 2.71 2.76 3.92
Average 6.26 4.01 3.02 3.04 3.54
Standard deviation
0.55 0.30 0.44 0.39 0.53
_____________________________________________________________________

68
CH. IV RESULTS AND DISCUSSION
%(+ 0.5 – 1) mm
Fraction (mm)
+ 5 (- 5 + 4) (-4 + 3.35) (-3.35 + 2) (-2 + 1)
Sample a 4.96 3.02 3.01 6.43 8.83
Sample b 5.40 2.96 3.30 5.71 6.85
Average 5.18 2.99 3.16 6.07 7.84
Standard deviation
0.31 0.04 0.21 0.51 1.40
_____________________________________________________________________

69
CH. IV RESULTS AND DISCUSSION
IV.6 Sintering.
Tables 26 to 30 summarise the results from 18 sinter pot tests that were performed on
the optimised mixtures. The compositions of the mixture are shown in Tables 6 and 7.
This was done in order to evaluate how optimisation of the grain size distribution of
the sinter mixture effects the sintering time, sinter yield, productivity, and sinter
quality. Tables 26 and 27 represent respectively the sintering pot test results of
mixtures I and II, where the coke, lime and return fines were sized. Tables 28 and 29
represent the sintering pot test results of mixtures III and IV where only the coke and
lime were sized. The ratio of Thabazimbi iron ore and Sishen iron ore was 50 – 50%
in mixtures I and IV, and 20 – 80% in the mixtures II and III. The quality of the
produced sinter was evaluated by taking into account the sinter specifications
especially the ratio of fines (0.95-1.05), the amount of FeO (7.0-9.0 mass %), and the
productivity.
IV.6.1 Definitions of sintering process parameters [31]
.
The main purpose of sinter pot studies is to quantify the common indicators of
performance, which are: Productivity, yield, sintering time, coke rate, sinter ratio fine
and sinter quality.
Productivity. The productivity or production rate is a very important parameter whereby the
capacity of the sinter plant is judged. It is expressed as the mass of sinter in tons (+ 5
mm) produced per square meter of the pot per day (t/m2/24h). It is calculated from
the sintering time, the cross sectional area of the pot grate and the weight of product
sinter recovered from the test, less the weight of the hearth layer.
Sinter fines ratio.
The sinter fines ratio is expressed as the weight of fines generated over the weight of
fines returned to green feed. It needs to be close to 1 as possible. A sinter is
considered to be ‘in’ or acceptable if the ratio is between 0.95 and 1.05.
_____________________________________________________________________
70
CH. IV RESULTS AND DISCUSSION
Fuel Rate.
The fuel rate is defined as the weight (in kilograms) of dry coke required to produce
one tone of product sinter. It is expressed in kilograms per tonne of sinter produced.
Sinter FeO content.
The sinter FeO content is a measure of the magnetite content of the sinter. It is the
most popular technique to control the sinter plant coke rate. A value of between 7 –9
mass percent is acceptable for the sinter plant.
Coke in Mixture.
The coke in the sinter mixture is expressed as a mass percentage on ore basis.
Return Fines. The sinter return fines is the mass percent of - 5 mm material. It is
expressed in mass percentage.
Sintering time.
The sintering time is defined as the time from the start of bed ignition to the time
when the waste gas temperature reaches a maximum. It is expressed in minutes.
Yield. The yield is the ratio of mass of sinter produced to the total mass of raw materials fed
into the process, expressed as a percentage.
IV.6.2 Base case.
There is no specified sintering time, productivity, or fuel consumption whereby the
effectiveness of the sintering process is evaluated. A short sintering time with
associated high productivity is considered to be good.
_____________________________________________________________________

71
CH. IV RESULTS AND DISCUSSION
At Kumba Iron Ore pilot plant, the productivity for a 50% Thabazimbi iron ore 50%
Sishen iron ore mixture with unsized fluxes is often less than 30 tons per day per
square meter and the sintering time more than 22 minutes. In Table 30, the base case
is a mixture of 50% Thabazimbi iron ore, 50% Sishen iron ore with unsized fluxes.
Many sintering tests were done on the 4 mixtures, and for each mixture one sinter test
were taken for analysis of the quality of the sinter according to the sinter
specifications in terms of the ratio of fines (0.95 – 1.05), the FeO content (7 – 9), the
productivity, the sintering time and the -5 mm size fraction. A high productivity, a
short time and a less amount of - 5 mm size fraction of sinter were preferred. The
Test 9 for mixture I, Test 4 for mixture II, Test 2 for mixture III and Test 3 for
mixture IV were selected. In each mixture the test 1 were done in the aim to produce
return fines which can be used for others test.
Table 26. Sintering results of mixture I Test Prod. Ratio Fuel FeO Coke R.F Time -5 mm
1 30.18 1.068 83.33 7.33 4.50 26.00 22.38 33.838
2 32.01 0.889 87.79 8.48 4.75 24.00 20.37 36.16
3 31.46 0.934 88.30 8.69 4.75 25.00 20.82 36.208
4 34.55 0.929 85.34 7.98 4.60 26.00 18.97 37.802
5 33.22 1.039 85.28 9.02 4.50 28.00 19.95 36.418
6 30.82 0.952 82.85 8.53 4.40 27.00 21.27 38.914
7 39.27 1.14 73.86 6.78 4.40 27.00 18.35 31.844
8 30.92 1.012 81.52 8.21 4.40 28.00 21.52 37.882
9 31.17 1.035 80.6 8.38 4.40 28.00 21.15 36.284
Average 32.62 1.000 83.21 8.16 4.52 26.56 20.53 36.150
Standard Deviation
2.83 0.08 4.37 0.70 1.27 2.16
_____________________________________________________________________

72
CH. IV RESULTS AND DISCUSSION
Table 27. Sintering results of mixture II
Test Prod. Ratio Fuel FeO Coke R.F Time -5 mm
1 30.38 1.020 79.88 8.19 4.40 28.00 21.92 36.880
2 31.06 0.977 83.19 8.05 4.40 28.00 20.27 37.900
3 33.05 0.959 82.33 8.18 4.40 28.00 19.22 38.536
4 31.89 1.003 79.38 7.91 4.40 28.00 20.98 37.426
Average 31.60 0.990 81.20 8.08 4.40 28.00 20.60 37.686
Standard Deviation
1.15 0.03 1.86 0.13 1.14 0.70
Table 28. Sintering results of mixture III
Test Prod. Ratio Fuel FeO Coke R.F Time -5 mm
1 31.44 1.032 78.19 7.46 4.40 28.00 21.45 36.142
2 30.97 0.995 80.44 7.78 4.50 27.00 21.63 36.110
Average 31.21 1.014 79.32 7.62 4.45 27.50 21.54 36.126
Standard
Deviation
0.33 0.03 1.59 0.23 0.13 0.02
Table 29. Sintering results of mixture IV
Test Prod. Ratio Fuel FeO Coke R.F Time -5mm
1 32.31 1.040 82.27 7.89 4.40 28.00 20.08 36.296
2 33.81 1.057 80.82 7.78 4.50 27.00 20.10 34.658
3 28.81 1.043 80.96 8.55 4.60 26.00 23.27 32.674
Average 31.64 1.047 81.35 8.07 4.50 27.00 21.15 34.543
Standard
Deviation
2.57 0.01 0.80 0.42 1.84 1.82
_____________________________________________________________________

73
CH. IV RESULTS AND DISCUSSION
Table 30 shows the sintering properties of the sinter retained for each type of sinter
mixture. It reveals that the sintering properties varied slightly and that the sinter
results of all the tests on mixtures I –IV are very similar. All the sinter properties of
the optimised mixtures are better than those of the base case sinter except for the TI
(%+6.3mm). The sintering time was shortened in all the tested mixture, and the
product yield and productivity have been improved. The sintering times for all the
produced sinters are less than 22 minutes, compared to 26 minutes for the base case
sinter. The yields of sinter mixtures I – IV range between 82 and 84%, which are
substantially higher than for the base case sinter (72%). The productivities of the
produced sinters range between 31 – 34t/day/m2, compared to 24.3t/day/m2 for the
base case sinter. Sizing of the coke, lime, and return fines also decreased the coke rate
(< 81 kg/t. sinter) compared to the base case (> 90 kg/t. sinter). The RDI of all the
produced sinters did not reach the acceptable requirement of RDI-1-0.50 ≥ 5% and RDI-
1+3.15 > 70%.
Table 30. The sintering properties of the optimised mixtures. Mixture I Mixture II Mixture III Mixture IV Base case
Productivity. (t/24h/m2) 31.17 31.89 30.97 33.81 24.30
Coke rate. (Kg/t.sinter) 80.60 79.38 80.44 80.82 93.26
Yield (%) 82.28 83.93 83.63 81.91 71.91
Sintering time (minutes) 21.15 20.98 21.63 20.10 25.70
TI (% + 6.3 mm) 71.00 71.15 71.42 71.34 73.75
TI (% -6.3 + 0.5 mm) 23.90 23.16 23.00 23.55 20.44
AI (% -0.5 mm) 5.10 5.69 5.58 5.11 5.81
RDI (% +6.30 mm) 29.15 19.70 25.00 30.30 21.88
RDI (% +3.15 mm) 64.50 57.95 60.75 66.70 62.31
RDI (% -0.50 mm) 5.25 5.90 5.70 5.00 5.53
RI (%/min) 1.45 1.52 1.25 1.15 1.60
Moisture (%) 5.50 4.50 4.50 5.50 5.25
G.I* 198.94 196.51 197.33 197.94 197.61
____________________________________________________________________ * As defined by Kumba Iron Ore (section III.2.2.1)

74
CH. IV RESULTS AND DISCUSSION
In comparing the properties of the four sinters, the sinter made from mixture IV in
which the blend contained 50% Thabazimbi iron ore and 50% Sishen iron ore, and in
which the coke and limestone were sized, had the shortest sintering time (20.10 min.),
the highest productivity (33.81t/24h/m2), a good RI (1.15%/min.), the highest [RDI
(% +3.15mm)] (66.70%) and the lowest [RDI (% - 0.5mm)] (5%). Mixture II that
contained 20% Thabazimbi iron ore and 80% Sishen iron ore, in which, coke, lime,
and return fines were sized has the highest Yield (83.93%) and lowest coke rate
(79.4kg/t.sinter), and is considered to be second best to Mixture IV with regards to the
productivity and sintering time. Appendix III gives the results of chemical
compositions of the sinters, as were determined by XRF analysis. The chemical
compositions of all the mixtures are almost the same with high iron oxide contents, (~
81 mass %), lime (9.3 – 9.6 mass %), silica (4.7 – 5.0 mass %), MgO (~ 2.9 mass %)
and alumina (1.3 – 1.5 mass %).
Quantification of the phases present in the produced sinters was done by the manual
point counting technique (Table 31). Figure 35 shows the mineral compositions of the
5 sinters investigated. Mixture III contained the highest amount of total SFCA,
followed by mixture I, mixture II, the base case and mixture IV. Mixture III has more
relict hematite, and less magnetite than mixtures I, II, and IV. Mixture IV although
presenting good sintering properties has the lowest amounts of total SFCA, acicular
SFCA and columnar SFCA, and also contains more magnesioferrite than mixture I, II
and III. All the mixtures contain more relict hematite than the base case sinter.
____________________________________________________________________

75
CH. IV RESULTS AND DISCUSSION
0
10
20
30
40
50
60
Hematite
relic
t
Hematite
rhom
bic
Total H
ematite
Mag
netit
e
Mag
nesiof
errit
e
SFCA a
cicu
lar
SFCA ta
bular (
columna
r)
SFCA d
endr
itic + eu
tectic
Total S
FCA
Calcium
silica
te (C
a2Si
O4)
Glass
Mineral morphology
Sin
ter m
iner
al c
om
posi
tion (%
)
Mixture 1Mixture 2Mixture 3Mixture 4Base case
Figure 35. Mineral composition of sinters.
Table 31. Mineralogical and morphological analysis (vol. %)
Mineral morphology Mixture I Mixture II Mixture III Mixture IV Base case
Hematite relict 13.2 14.1 19.8 17.3 3.5
Hematite rhombic 1.8 6.6 3.1 3.6 4.1
Hematite Finely granular - - - - 1.9
Hematite skeletal - - - - 5.5
Total Hematite 15 20.7 22.9 20.9 15
Magnetite 9.3 10.4 5.0 9.6 -
Magnesioferrite 23.2 18.9 22.0 30.4 -
Total Spinel( magnetite + magnesioferrite )
32.5 29.3 27.0 40.0 30.2
SFCA acicular 5.4 2.9 6.9 2.2 16.7
SFCA tabular (columnar) 39.2 42.6 40.3 35.7 18.5
SFCA dendritic + eutectic 2.4 1.3 0.6 0.0 6.5
Total SFCA 47 46.8 47.8 37.9 41.1
Calcium silicate (Ca2SiO4) 0.6 0.5 0.9 0.4 7.4
Glass 4.5 2.4 0.6 0.4 5.5
Periclase 0.0 0.0 0.3 0.0 -
___________________________________________________________________

76
CHAPTER V CONCLUSIONS
Optimisation of the grain size distribution of the raw material mixture in the
production of iron sinter was studied by using granulation and permeability tests. The
following conclusions can be drawn from the test results:
Sishen iron ore has less fine particles, and is more permeable than Thabazimbi iron
ore.
The permeability of the granulated mixture of Thabazimbi iron ore and Sishen iron
ore without fluxes can be increased by increasing the Sishen iron ore content in the
blend. That is presumably due to the fact that the Sishen iron ore has less fine
particles than Thabazimbi iron ore.
The granulation effectiveness and the permeability in terms of Japanese Permeability
Unit (JPU), was the best at any granulation time (2-10 minutes) for the mixture that
contained 20% Thabazimbi iron ore, 80% Sishen iron ore and fluxes where the coke,
lime and return fines were sized.
Graphs representing the influence of moisture content on permeability follow a
gaussian curve. The plots of bed permeability versus moisture content are not
therefore straight lines, but inverted V-shapes: As water addition increases, the
permeability increases and the granulation effectiveness improves resulting in the
formation of large particles, but when water addition is increasing beyond the
optimum value bed permeability deteriorates.
The growth in mean granule diameter during granulation is a function of the initial
mean diameter before granulation, the amount of moisture, and the granulation time.
As the time increases, the mean granule diameter increases up to a certain value and
then starts to decrease. With further increase in time the mean granule restarts the
same phenomenon. The same phenomenon was observed when the influence of
moisture content on the mean granule diameter was examined. The trends of these
curves have sinusoidal forms.
_____________________________________________________________________

77
CH. V CONCLUSIONS
The mean granule diameter does not predict the permeability of the bed.
Four sinter compositions, in which different Thabazimbi iron ore: Sishen iron ore
ratios were used, and the sized fluxes to different degrees, were selected on the basis
of their permeabilities for sinter pot tests. These sinter were: Mixture I, ( 50%
Thabazimbi iron ore, 50% Sishen iron ore, with coke, lime and return fines sized),
Mixture II (20% Thabazimbi iron ore, 80% Sishen iron ore, with coke, lime and
return fines sized), Mixture III (20% Thabazimbi iron ore, 80% Sishen iron ore with
coke and lime sized), and Mixture IV (50% Thabazimbi iron ore , 50% Sishen iron
ore, with coke and lime sized). The sinter properties of the four optimised sinters were
found to be similar, but better than the base case sinter in which the fluxes were not
sized. Mixture IV showed the best sinter properties with regard to the shortest
sintering time and the highest productivity, with acceptable, (RI>1% min), TI (>70%)
and lowest [RDI (% -0.50 mm)] (5%).
_____________________________________________________________________

78
CHAPTER VI RECOMMENDATIONS FOR FUTURE WORK
The optimisation of the grain size distribution of the sinter mixture is dependant on
the composition of the raw materials and its particle size distribution, while the heat
pattern also influences sinter quality.
In this first study the optimisation of the grain size distribution was investigated by
monitoring the granulation characteristic. (Green permeability, moisture content, and
granulation time).
Because granulation is an important step in producing iron sinter, it suggested that
different sequences whereby coke breeze and limestone are coated on to the surface of
the quasi-particle, be examined during granulation. [26]
The effect of heat distribution through the sinter bed, on sinter quality, should also be
examined.
_____________________________________________________________________

79
REFERENCES
REFERENCES.
[1]. ANIL K. BISWAS. 1981. “Principles of Blast Furnace Ironmaking”
University of Queensland, Brisbane, Australia. Page 194.
[2]. VENKATARAMANA R., GUPTA S.S. & KAPUR P.C 1999. “A Combined
Model for Granule Size Distribution and Cold Bed Permeability in the Wet
Stage of Iron Ore Sintering Process” Int. J. of Mineral Processing, 57, pages 43-58.
[3]. WILLIAM J. RANKIN& JOHN F. GANNON. “The Effect of Raw Mixture
Properties on Bed Permeability during Sintering”. ISIJ International, Vol. 29
(1989), No. 1, pages 33-42.
[4]. GERHARD C., LAWRENCE G., OKKAR P., GERHARD P., HANS S.,
JOHANNES W. “Perfect Sinter – The Dream of the Blast Furnace Operator”
Iron& Steel Review, March 2002, pages 2-6.
[5]. YASUSHI I., YASUTO S. & HIDEO T. “Improvement of Sinter Quality based
on the Mineralogical Properties of Ores.” Nippon Steel Corporation, Japan.
[6]. JACOBUS W. J., MEng thesis 2002. “The Variation of Sinter Strength in the
Sinter Bed due to the Mineral Phase Distribution.” University of Pretoria, pages1-
2.
[7]. PETERS K.H., BEER H., KROPLA H.W and MULLER H. 1990 “Effect of
Coke Size Distribution in the Mix on the Iron ore Sintering Process”. Proceeding
of the sixth International Iron and Steel Congress, Nagoya, ISIJ, pages 103-109.
[8]. HOSOTANI Y., KONNO N., YAMAGUCHI K., ORIMOTO T., INAZUMI T. “Reduction Properties of Sinter with fine Dispersed Pores at High Temperatures
of 1273K and Above” ISIJ International, Vol. 45 (1996), No. 12, pages 1439-1447.
[9]. Personal Communication with Kumba Iron Ore Personnel.
[10]. BA Wills “Mineral Processing Technology” 3rd edition, Camborne school of
Mines, Cornwall, England. Pages 96,97.
[11]. ALLEN T.1990. “Particle Size Measurement.” 4th Edition, Chapman&Hall,
London, New York. Page 125.
_____________________________________________________________________

80
REFERENCES
[12]. CADLE R.D. 1980. “Testing and Characterisation of Powders and Fine
particles”. Pages 56-65. National Centre Atmospheric research, USA.
[13]. “Particle Size Measurement and Distribution” [online] Available.
http://www.engin.umich.edu/class/che360/coursepack/ch15-PSD.doc
[14]. FERRARIS C.F., HACKLEY V.A, AVILES A.I. & BUCHANAN C.E., May
2002
“ASTM Round-Robin Test on Particle Size Distribution of Portland Cement.”
National Institute of Standards and Technology Internal Report 6883, U.S.
Department of Commerce Technology Administration.
[15]. FORMOSO A., MORO A., FERNANDEZ G., MENENDEZ J.L., MUNIZ M.
&CORES A. 2003 “Influence of Nature and Particle Size Distribution on
Granulation of Iron ore Mixtures used in a Sinter strand.” Iron making and
Steelmaking, vol. 30, No. 6, page 447-460.
[16]. LISTER J.D., WATERS A.G., NICOL S.K. 1989 “Mechanisms of Iron ore
Granulation ” 5th International Symposium on Agglomeration, Brisbane, Australia.
pages 33-49.
[17]. LOO C.E. & LEANEY J.C.M. April 2002 “Characterising the Contribution
of the High-Temperature zone to Iron ore Sinter Bed Permeability.”
Trans.Institution of Mining and Metallurgy.C11- C17
[18]. POOT E, MEUNIER G, VIDAL R. “Contribution to the Rational
Composition of the Raw Material Mix for the Production of Ultra High
Reducible Sinter.” Centre de Recherches Metallurgiques, Liege, Belgium. Pages
337-345.
[19]. SAHOO K.C., LAHIRI D.K., SUNDERMURTHY V., BARPANDA S. “Effect
of Ultrafines on Sinter Quality.” 1991. 3rd International Symposium on
Beneficiation and Agglomeration, Bhubaneswar, India. Pages 421-433.
[20]. DAWSON PR. 1993. “Research Studies on Sintering and Sinter Quality.”
Ironmaking and Steelmaking vol 20. No 2. Pages 137-143.
[21]. MUKHERJEE, T. ET. AL 1985. “Structure of Fluxed Sinter” Ironmaking
and Steelmaking vol. 12 no. 4. Pages C151-C155.
_____________________________________________________________________

81
REFERENCES
[22]. K Vreugdenburg, MS Schoeman, A Garbers-Craig, PA Botha.”Applied
Mineralogy in Sinter Processes” 12-13 October 2004, In house Kumba Iron Ore
Course.
[23]. WILHEMINA FREDRIKA VAN DER VYVER. 1998 “Evaluation of the
REAS test for Blast Furnace charge materials”. MSc Thesis, University of
Pretoria,
pages 13-23.
[24]. VOLKER. J. RITZ, HEINRICH. A.KORTMANN. 1998. “Reduction,
Softening and Melting Properties of Pellets, Sinters, Lumpy Ore and Mixed Blast
furnace Burden.”ICSTI/Ironmaking conference proceedings Pages 1635-1654.
[25]. BHAGAT R.P. 1999. “Factors affecting Return sinter fines regimed and
Strand productivity in Iron ore Sintering” Mineral processing division, ISIJ
International, Vol. 39(1999), No. 9, pages 889-895.
[26]. OYOMA N., SATO H., TAKEDA K. ARIYAMA T., MASUMOTO S. JINNO
T. FUJII N. 2005. “Development of Coating Granulation Process at Commercial
Plant for Improving Productivity and Reducibility” ISIJ International, Vol. 45
(2005), No. 6, pages 817-826.
[27]. Li-HENG HSIEH. “Effect of Raw Material Composition on the Sintering
Properties” ISIJ International , Vol. 45 (2005), No. 4, pages 551-559.
[28]. C.E LOO, D.J WONG. “Fundamental Factors Determining Laboratory
Sintering Results” ISIJ International , Vol. 45 (2005), No. 4, pages 449-458.
[29]. C.E LOO. “A Perspective of Goethitic Ore Sintering Fundamentals” ISIJ
International, Vol. 45 (2005), No. 4, pages 436-448.
[30]. J. OKAZAKI, K> HIGUCHI “Marra Mamba Ore, Its Mineralogical
Properties and Evaluation for Utilization” ISIJ International, Vol. 45 (2005), No.
4, pages 544-550.
[31]. T. MAEDA, C. FUKUMOTO, T. MATSUMURA, K. NISHIOKA, M.
SHIMIZU
“Effect of Adding Moisture and Wettability on Granulation of Iron Ore ”. ISIJ
International, Vol. 45 (2005), No. 4, pages 477-484.
_____________________________________________________________________

82
APPENDIX I
Sieves analysis of Thabazimbi iron ore. Thabazimbi 1 Fraction
(mm) Mass(g) %mass Cum.Mass
(%) second input (-1 mm)
Fraction (mm)
Mass(g) %mass Cum. Mass(%)
12.50 18.00 0.18 0.18 0.50 120.80 28.69 28.6910.00 40.00 0.40 0.58 0.25 101.30 24.06 52.748.00 96.10 0.96 1.54 0.13 85.60 20.33 73.076.30 724.90 7.25 8.79 0.11 16.40 3.89 76.975.00 1248.00 12.48 21.28 0.08 36.00 8.55 85.514.00 834.20 8.34 29.62 0.05 38.20 9.07 94.593.35 759.70 7.60 37.22 0.05 15.40 3.66 98.242.00 1796.30 17.97 55.19 -0.05 7.40 1.76 100.00
1.00 1502.80 15.03 70.22 Total 421.10 100.00
-1.00 2977.00 29.78 100.00
Total 9997.00 100.00
sieve analysis Linear Geometric
Fraction (mm) %mass Cum. Mass Dp calc Dp Calc 12.50 0.18 0.18 14.25 0.03 10.00 0.40 0.58 11.25 0.05 11.18 0.04 8.00 0.96 1.54 9.00 0.09 8.94 0.09 6.30 7.25 8.79 7.15 0.52 7.10 0.51 5.00 12.48 21.28 5.65 0.71 5.61 0.70 4.00 8.34 29.62 4.50 0.38 4.47 0.37 3.35 7.60 37.22 3.68 0.28 3.66 0.28 2.00 17.97 55.19 2.68 0.48 2.59 0.47 1.00 15.03 70.22 1.50 0.23 1.41 0.21 0.50 8.54 78.76 0.75 0.06 0.71 0.06 0.25 7.16 85.93 0.38 0.03 0.35 0.03 0.13 6.05 91.98 0.19 0.01 0.18 0.01 0.11 1.16 93.14 0.12 0.00 0.12 0.00 0.08 2.55 95.69 0.09 0.00 0.09 0.00 0.05 2.70 98.39 0.06 0.00 0.06 0.00 0.05 1.09 99.48 0.05 0.00 0.05 0.00 -0.05 0.52 100.00 0.02 0.00 0.03 0.00
Total 100.00 2.85 2.78 ________________________________________________________________________

83
APPENDIX I
Sieves analysis of Thabazimbi iron ore. Thabazimbi 2 Fraction
(mm) Mass(g) %mass Cum.
Mass (%) second input (-1 mm)
Fraction(mm) Mass(g) %mass Cum.Mass (%)
12.50 9.50 0.10 0.10 0.50 204.80 26.82 26.82 10.00 41.00 0.41 0.51 0.25 168.30 22.04 48.85 8.00 62.50 0.63 1.13 0.13 163.00 21.34 70.20 6.30 709.40 7.09 8.22 0.11 23.80 3.12 73.31 5.00 1132.50 11.33 19.55 0.08 82.70 10.83 84.14 4.00 827.00 8.27 27.82 0.05 62.70 8.21 92.35 3.35 736.90 7.37 35.19 0.05 34.90 4.57 96.92 2.00 1873.50 18.74 53.93 -0.05 23.50 3.08 100.00
1.00 1532.60 15.33 69.25 Total 763.70 100.00
-1.00 3074.50 30.75 100.00
Total 9999.40 100.00
sieve analysis Linear Geometric
Fraction (mm)
%mass Cum. Mass Dp calc Dp Calc
12.50 0.10 0.10 14.25 0.01 10.00 0.41 0.51 11.25 0.05 11.18 0.05 8.00 0.63 1.13 9.00 0.06 8.94 0.06 6.30 7.09 8.22 7.15 0.51 7.10 0.50 5.00 11.33 19.55 5.65 0.64 5.61 0.64 4.00 8.27 27.82 4.50 0.37 4.47 0.37 3.35 7.37 35.19 3.68 0.27 3.66 0.27 2.00 18.74 53.93 2.68 0.50 2.59 0.49 1.00 15.33 69.26 1.50 0.23 1.41 0.22 0.50 8.25 77.51 0.75 0.06 0.71 0.06 0.25 6.78 84.28 0.38 0.03 0.35 0.02 0.13 6.56 90.85 0.19 0.01 0.18 0.01 0.11 0.96 91.80 0.12 0.00 0.12 0.00 0.08 3.33 95.13 0.09 0.00 0.09 0.00 0.05 2.52 97.66 0.06 0.00 0.06 0.00 0.05 1.41 99.06 0.05 0.00 0.05 0.00 -0.05 0.95 100.01 0.02 0.00 0.03 0.00
Total 100.01 2.74 2.68 ________________________________________________________________________

84
APPENDIX I
Sieves analysis of Thabazimbi iron ore. Thabazimbi 3
Fraction (mm)
Mass (g) %Mass Cum. Mass Second input (-1 mm)
Fraction (mm)
Mass (g) %Mass Cum.Mass
12.50 0.00 0.00 0.00 0.50 112.30 27.63 27.63 10.00 20.40 0.20 0.20 0.25 104.80 25.78 53.41 8.00 51.50 0.52 0.72 0.13 102.20 25.14 78.55 6.30 635.00 6.36 7.08 0.11 29.70 7.31 85.85 5.00 931.30 9.33 16.40 0.08 35.50 8.73 94.59 4.00 980.60 9.82 26.22 0.05 14.70 3.62 98.20 3.35 446.40 4.47 30.69 0.05 6.40 1.57 99.78 2.00 1807.20 18.10 48.79 -0.05 0.90 0.22 100.00
1.00 1641.60 16.44 65.22 Total 406.50 100.00
-1.00 3473.00 34.78 100.00
Total 9987.00 100.00
Sieve analysis Linear Geometric
Fraction %Mass Cum. Mass Dp Calc Dp Calc
12.50 0.00 0.00 14.25 0.00 10.00 0.20 0.20 11.25 0.02 11.18 0.02 8.00 0.52 0.72 9.00 0.05 8.94 0.05 6.30 6.36 7.08 7.15 0.45 7.10 0.45 5.00 9.33 16.40 5.65 0.53 5.61 0.52 4.00 9.82 26.22 4.50 0.44 4.47 0.44 3.35 4.47 30.69 3.68 0.16 3.66 0.16 2.00 18.10 48.79 2.68 0.48 2.59 0.47 1.00 16.44 65.22 1.50 0.25 1.41 0.23 0.50 9.61 74.83 0.75 0.07 0.71 0.07 0.25 8.97 83.80 0.38 0.03 0.35 0.03 0.13 8.74 92.54 0.19 0.02 0.18 0.02 0.11 2.54 95.08 0.12 0.00 0.12 0.00 0.08 3.04 98.12 0.09 0.00 0.09 0.00 0.05 1.26 99.38 0.06 0.00 0.06 0.00 0.05 0.55 99.92 0.05 0.00 0.05 0.00 -0.05 0.08 100.00 0.02 0.00 0.03 0.00
Total 100.00 2.52 2.47
________________________________________________________________________

85
APPENDIX I Sieves analysis of Thabazimbi iron ore. Thabazimbi 4
Fraction (mm)
Mass (g) %Mass Cum. Mass Second input (-1 mm)
Fraction (mm)
Mass (g) %Mass Cum. Mass
12.50 6.30 0.06 0.06 0.50 150.80 32.04 32.04 10.00 41.20 0.41 0.48 0.25 114.00 24.22 56.25 8.00 56.60 0.57 1.04 0.13 141.30 30.02 86.27 6.30 600.00 6.00 7.04 0.11 28.80 6.12 92.39 5.00 993.00 9.93 16.98 0.08 32.10 6.82 99.21 4.00 773.70 7.74 24.72 0.05 0.22 0.05 99.26 3.35 691.10 6.91 31.63 0.05 3.10 0.66 99.92 2.00 1842.80 18.43 50.06 -0.05 0.40 0.08 100.00
1.00 1628.90 16.29 66.36 Total 470.72 100.00
-1.00 3363.10 33.64 100.00
Total 9996.70 100.00
Sieve analysis Linear Geometric
Fraction (mm)
%Mass Cum. Mass Dp Calc Dp Calc
12.50 0.06 0.06 14.25 0.01 10.00 0.41 0.48 11.25 0.05 11.18 0.05 8.00 0.57 1.04 9.00 0.05 8.94 0.05 6.30 6.00 7.04 7.15 0.43 7.10 0.43 5.00 9.93 16.98 5.65 0.56 5.61 0.56 4.00 7.74 24.72 4.50 0.35 4.47 0.35 3.35 6.91 31.63 3.68 0.25 3.66 0.25 2.00 18.43 50.06 2.68 0.49 2.59 0.48 1.00 16.29 66.36 1.50 0.24 1.41 0.23 0.50 10.78 77.14 0.75 0.08 0.71 0.08 0.25 8.15 85.28 0.38 0.03 0.35 0.03 0.13 10.10 95.38 0.19 0.02 0.18 0.02 0.11 2.06 97.44 0.12 0.00 0.12 0.00 0.08 2.29 99.73 0.09 0.00 0.09 0.00 0.05 0.02 99.75 0.06 0.00 0.06 0.00 0.05 0.22 99.97 0.05 0.00 0.05 0.00 -0.05 0.03 100.00 0.02 0.00 0.03 0.00
Total 100.00 2.57 2.51
________________________________________________________________________

86
APPENDIX I
Sieves analysis of Thabazimbi iron ore. Thabazimbi 5
Fraction (mm)
Mass (g) %Mass Cum. Mass Second input (-1 mm)
Fraction (mm)
Mass (g) %Mass Cum. Mass
12.50 16.00 0.16 0.16 0.50 138.50 27.99 27.99 10.00 32.30 0.32 0.48 0.25 126.80 25.62 53.61 8.00 68.00 0.68 1.16 0.13 108.00 21.82 75.43 6.30 509.50 5.10 6.27 0.11 31.00 6.26 81.69 5.00 798.80 8.00 14.26 0.08 45.20 9.13 90.83 4.00 662.90 6.64 20.90 0.05 31.40 6.34 97.17 3.35 610.00 6.11 27.01 0.05 8.20 1.66 98.83 2.00 1708.50 17.11 44.11 -0.05 5.80 1.17 100.00
1.00 1728.00 17.30 61.41 Total 494.90 100.00
-1.00 3854.00 38.59 100.00
Total 9988.00 100.00
Sieve analysis Linear Geometric
Fraction (mm)
%Mass Cum. Mass Dp Calc Dp Calc
12.50 0.16 0.16 14.25 0.02 10.00 0.32 0.48 11.25 0.04 11.18 0.04 8.00 0.68 1.16 9.00 0.06 8.94 0.06 6.30 5.10 6.27 7.15 0.36 7.10 0.36 5.00 8.00 14.26 5.65 0.45 5.61 0.45 4.00 6.64 20.90 4.50 0.30 4.47 0.30 3.35 6.11 27.01 3.68 0.22 3.66 0.22 2.00 17.11 44.11 2.68 0.46 2.59 0.44 1.00 17.30 61.41 1.50 0.26 1.41 0.24 0.50 10.80 72.21 0.75 0.08 0.71 0.08 0.25 9.89 82.10 0.38 0.04 0.35 0.03 0.13 8.42 90.52 0.19 0.02 0.18 0.01 0.11 2.42 92.94 0.12 0.00 0.12 0.00 0.08 3.52 96.46 0.09 0.00 0.09 0.00 0.05 2.45 98.91 0.06 0.00 0.06 0.00 0.05 0.64 99.55 0.05 0.00 0.05 0.00 -0.05 0.45 100.00 0.02 0.00 0.03 0.00
Total 100.00 2.32 2.25
________________________________________________________________________

87
APPENDIX I
Sieves analysis of Sishen iron ore. Sishen 1 Fraction
(mm) Mass (g) %Mass Cum.Mas
s Second input (-1mm)
Fraction (mm)
Mass (g) %Mass Cum.Mass
12.50 0.00 0.00 0.00 0.50 214.40 58.68 58.68 10.00 39.50 0.40 0.40 0.25 100.90 27.61 86.29 8.00 150.50 1.51 1.90 0.13 48.80 13.36 99.64 6.30 349.70 3.50 5.40 0.11 1.00 0.27 99.92 5.00 1081.30 10.82 16.23 0.08 0.10 0.03 99.95 4.00 1970.00 19.72 35.94 0.05 0.20 0.05 100.00 3.35 598.80 5.99 41.94 0.05 0.00 0.00 100.00 2.00 2596.80 25.99 67.93 -0.05 0.00 0.00 100.00
1.00 1635.00 16.37 84.30 Total 365.40 100.00
-1.00 1569.00 15.70 100.00
Total 9990.60 100.00
Sieve analysis Linear Geometric
Fraction (mm)
%Mass Cum. Mass
Dp Calc Dp Calc
12.50 0.00 0.00 14.25 0.00 10.00 0.40 0.40 11.25 0.04 11.18 0.04 8.00 1.51 1.90 9.00 0.14 8.94 0.13 6.30 3.50 5.40 7.15 0.25 7.10 0.25 5.00 10.82 16.23 5.65 0.61 5.61 0.61 4.00 19.72 35.94 4.50 0.89 4.47 0.88 3.35 5.99 41.94 3.68 0.22 3.66 0.22 2.00 25.99 67.93 2.68 0.70 2.59 0.67 1.00 16.37 84.30 1.50 0.25 1.41 0.23 0.50 9.21 93.51 0.75 0.07 0.71 0.07 0.25 4.34 97.85 0.38 0.02 0.35 0.02 0.13 2.10 99.94 0.19 0.00 0.18 0.00 0.11 0.04 99.99 0.12 0.00 0.12 0.00 0.08 0.00 99.99 0.09 0.00 0.09 0.00 0.05 0.01 100.00 0.06 0.00 0.06 0.00 0.05 0.00 100.00 0.05 0.00 0.05 0.00 -0.05 0.00 100.00 0.02 0.00 0.03 0.00
Total 100.00 3.18 3.12
________________________________________________________________________

88
APPENDIX I
Sieves analysis of Sishen iron ore. Sishen 2
Fraction (mm)
Mass (g) %Mass Cum. Mass Second input (-1 mm)
Fraction (mm)
Mass (g) %Mass Cum.Mass
12.50 0.00 0.00 0.00 0.50 164.40 40.83 40.83 10.00 20.10 0.20 0.20 0.25 131.30 32.61 73.45 8.00 98.60 0.99 1.19 0.13 95.60 23.75 97.19 6.30 287.20 2.87 4.06 0.11 5.50 1.37 98.56 5.00 795.70 7.96 12.02 0.08 3.80 0.94 99.50 4.00 1898.80 18.99 31.01 0.05 1.40 0.35 99.85 3.35 907.30 9.07 40.08 0.05 0.50 0.12 99.98 2.00 2559.90 25.60 65.68 -0.05 0.10 0.02 100.00
1.00 1588.70 15.89 81.57 Total 402.60 100.00
-1.00 1828.60 18.29 100.00
Total 9999.40 100.00
Sieve analysis Linear Geometric
Fraction (mm)
%Mass Cum. Mass Dp Calc Dp Calc
12.50 0.00 0.00 14.25 0.00 10.00 0.20 0.20 11.25 0.02 11.18 0.02 8.00 0.99 1.19 9.00 0.09 8.94 0.09 6.30 2.87 4.06 7.15 0.21 7.10 0.20 5.00 7.96 12.02 5.65 0.45 5.61 0.45 4.00 18.99 31.01 4.50 0.85 4.47 0.85 3.35 9.07 40.08 3.68 0.33 3.66 0.33 2.00 25.60 65.68 2.68 0.68 2.59 0.66 1.00 15.89 81.57 1.50 0.24 1.41 0.22 0.50 7.47 89.04 0.75 0.06 0.71 0.05 0.25 5.96 95.00 0.38 0.02 0.35 0.02 0.13 4.34 99.34 0.19 0.01 0.18 0.01 0.11 0.25 99.59 0.12 0.00 0.12 0.00 0.08 0.17 99.77 0.09 0.00 0.09 0.00 0.05 0.06 99.83 0.06 0.00 0.06 0.00 0.05 0.02 99.85 0.05 0.00 0.05 0.00 -0.05 0.00 99.86 0.02 0.00 0.03 0.00
Total 99.86 2.96 2.91
________________________________________________________________________

89
APPENDIX I
Sieves analysis of Sishen iron ore. Sishen 3
Fraction (mm)
Mass (g) %Mass Cum. Mass Second input (-1 mm)
Fraction Mass (g) %Mass Cum. Mass
12.50 4.30 0.04 0.04 0.50 179.40 45.48 45.48 10.00 67.70 0.68 0.72 0.25 102.30 25.93 71.41 8.00 161.10 1.61 2.33 0.13 74.90 18.99 90.39 6.30 287.30 2.87 5.21 0.11 12.60 3.19 93.59 5.00 791.20 7.92 13.12 0.08 0.39 0.10 93.69 4.00 1956.10 19.57 32.69 0.05 0.01 0.00 93.69 3.35 629.10 6.29 38.98 0.05 13.40 3.40 97.08 2.00 2652.00 26.53 65.52 -0.05 11.50 2.92 100.00 1.00 1651.00 16.52 82.03 Total 394.50 100.00
-1.00 1796.00 17.97 100.00
Total 9995.80 100.00
Sieve analysis Linear Geometric
Fraction (mm)
%Mass Cum. Mass Dp Calc Dp Calc
12.50 0.04 0.04 14.25 0.01 10.00 0.68 0.72 11.25 0.08 11.18 0.08 8.00 1.61 2.33 9.00 0.15 8.94 0.14 6.30 2.87 5.21 7.15 0.21 7.10 0.20 5.00 7.92 13.12 5.65 0.45 5.61 0.44 4.00 19.57 32.69 4.50 0.88 4.47 0.88 3.35 6.29 38.98 3.68 0.23 3.66 0.23 2.00 26.53 65.52 2.68 0.71 2.59 0.69 1.00 16.52 82.03 1.50 0.25 1.41 0.23 0.50 8.17 90.20 0.75 0.06 0.71 0.06 0.25 4.66 94.86 0.38 0.02 0.35 0.02 0.13 3.41 98.27 0.19 0.01 0.18 0.01 0.11 0.57 98.85 0.12 0.00 0.12 0.00 0.08 0.02 98.87 0.09 0.00 0.09 0.00 0.05 0.00 98.87 0.06 0.00 0.06 0.00 0.05 0.61 99.48 0.05 0.00 0.05 0.00 -0.05 0.52 100.00 0.02 0.00 0.03 0.00
Total 100.00 3.04 2.98
________________________________________________________________________

90
APPENDIX I
Sieves analysis of Sishen iron ore. Sishen 4
Fraction (mm)
Mass (g) %Mass Cum.Mass Second input (-1 mm)
Fraction (mm)
Mass (g) %Mass Cum.Mass
12.50 0.00 0.00 0.00 0.50 165.40 40.66 40.66 10.00 29.30 0.29 0.29 0.25 120.80 29.70 70.35 8.00 178.00 1.78 2.07 0.13 99.70 24.51 94.86 6.30 387.50 3.88 5.95 0.11 4.20 1.03 95.89 5.00 842.70 8.43 14.38 0.08 12.00 2.95 98.84 4.00 1961.70 19.62 34.00 0.05 2.40 0.59 99.43 3.35 712.70 7.13 41.13 0.05 1.80 0.44 99.88 2.00 2671.20 26.72 67.84 -0.05 0.50 0.12 100.00
1.00 1591.00 15.91 83.75 Total 406.80 100.00
-1.00 1624.30 16.25 100.00
Total 9998.40 100.00
Sieve analysis Linear Geometric
Fraction (mm)
%Mass Cum. Mass Dp Calc Dp Calc
12.50 0.00 0.00 14.25 0.00 10.00 0.29 0.29 11.25 0.03 11.18 0.03 8.00 1.78 2.07 9.00 0.16 8.94 0.16 6.30 3.88 5.95 7.15 0.28 7.10 0.28 5.00 8.43 14.38 5.65 0.48 5.61 0.47 4.00 19.62 34.00 4.50 0.88 4.47 0.88 3.35 7.13 41.13 3.68 0.26 3.66 0.26 2.00 26.72 67.85 2.68 0.71 2.59 0.69 1.00 15.91 83.76 1.50 0.24 1.41 0.23 0.50 6.61 90.36 0.75 0.05 0.71 0.05 0.25 4.82 95.18 0.38 0.02 0.35 0.02 0.13 3.98 99.17 0.19 0.01 0.18 0.01 0.11 0.17 99.33 0.12 0.00 0.12 0.00 0.08 0.48 99.81 0.09 0.00 0.09 0.00 0.05 0.10 99.91 0.06 0.00 0.06 0.00 0.05 0.07 99.98 0.05 0.00 0.05 0.00 -0.05 0.02 100.00 0.02 0.00 0.03 0.00
Total 100.00 3.12 3.07
________________________________________________________________________

91
APPENDIX I
Sieves analysis of Sishen iron ore. Sishen 5
Fraction Mass (g) %Mass Cum.Mass Second input (-1 mm)
Fraction Mass (g) %Mass Cum.Mass
12.50 0.00 0.00 0.00 0.50 165.80 42.20 42.20 10.00 46.10 0.46 0.46 0.25 100.10 25.48 67.68 8.00 104.70 1.05 1.51 0.13 87.30 22.22 89.90 6.30 303.60 3.04 4.55 0.11 3.70 0.94 90.84 5.00 864.50 8.66 13.22 0.08 15.00 3.82 94.66 4.00 1970.30 19.75 32.97 0.05 10.70 2.72 97.38 3.35 681.10 6.83 39.79 0.05 8.00 2.04 99.41 2.00 2709.00 27.15 66.94 -0.05 2.30 0.59 100.00
1.00 1578.60 15.82 82.77 Total 392.90 100.00
-1.00 1719.60 17.23 100.00
Total 9977.50 100.00
Sieve analysis Linear Geometric
Fraction %Mass Cum. Mass Dp Calc Dp Calc
12.50 0.00 0.00 14.25 0.00 10.00 0.46 0.46 11.25 0.05 11.18 0.05 8.00 1.05 1.51 9.00 0.09 8.94 0.09 6.30 3.04 4.55 7.15 0.22 7.10 0.22 5.00 8.66 13.22 5.65 0.49 5.61 0.49 4.00 19.75 32.97 4.50 0.89 4.47 0.88 3.35 6.83 39.79 3.68 0.25 3.66 0.25 2.00 27.15 66.94 2.68 0.73 2.59 0.70 1.00 15.82 82.77 1.50 0.24 1.41 0.22 0.50 7.27 90.04 0.75 0.05 0.71 0.05 0.25 4.39 94.43 0.38 0.02 0.35 0.02 0.13 3.83 98.26 0.19 0.01 0.18 0.01 0.11 0.16 98.42 0.12 0.00 0.12 0.00 0.08 0.66 99.08 0.09 0.00 0.09 0.00 0.05 0.47 99.55 0.06 0.00 0.06 0.00 0.05 0.35 99.90 0.05 0.00 0.05 0.00 -0.05 0.10 100.00 0.02 0.00 0.03 0.00
Total 100.00 3.04 2.98
________________________________________________________________________

92
APPENDIX I
Sieves analysis of Phoenix-Sishen iron ore. Phoenix-Sishen 1
Fraction (mm)
Mass (g) %Mass Cum.Mass (%)
Second input (-1mm)
Fraction Mass (g) %Mass Cum. Mass
12.50 0.00 0.00 0.00 0.50 182.20 30.19 30.19 10.00 4.50 0.05 0.05 0.25 195.80 32.44 62.62 8.00 4.00 0.04 0.09 0.13 183.40 30.38 93.01 6.30 26.60 0.27 0.35 0.11 24.90 4.13 97.13 5.00 748.50 7.49 7.84 0.08 14.20 2.35 99.49 4.00 1113.10 11.14 18.99 0.05 2.60 0.43 99.92 3.35 915.10 9.16 28.15 0.05 0.40 0.07 99.98 2.00 2229.40 22.32 50.47 -0.05 0.10 0.02 100.00
1.00 1873.40 18.75 69.22 Total 603.60 100.00 -1.00 3074.50 30.78 100.00
Total 9989.10 100.00
Sieve analysis Linear Geometric
Fraction %Mass Cum. Mass Dp Calc Dp Calc
12.50 0.00 0.00 14.25 0.00 10.00 0.05 0.05 11.25 0.01 11.18 0.01 8.00 0.04 0.09 9.00 0.00 8.94 0.00 6.30 0.27 0.35 7.15 0.02 7.10 0.02 5.00 7.49 7.84 5.65 0.42 5.61 0.42 4.00 11.14 18.99 4.50 0.50 4.47 0.50 3.35 9.16 28.15 3.68 0.34 3.66 0.34 2.00 22.32 50.47 2.68 0.60 2.59 0.58 1.00 18.75 69.22 1.50 0.28 1.41 0.27 0.50 9.29 78.51 0.75 0.07 0.71 0.07 0.25 9.98 88.50 0.38 0.04 0.35 0.04 0.13 9.35 97.85 0.19 0.02 0.18 0.02 0.11 1.27 99.12 0.12 0.00 0.12 0.00 0.08 0.72 99.84 0.09 0.00 0.09 0.00 0.05 0.13 99.97 0.06 0.00 0.06 0.00 0.05 0.02 99.99 0.05 0.00 0.05 0.00 -0.05 0.01 100.00 0.02 0.00 0.03 0.00
Total 100.00 2.29 2.24
________________________________________________________________________

93
APPENDIX I
Sieves analysis of Phoenix-Sishen iron ore. Phoenix-Sishen 2
Fraction (mm)
Mass (g) %Mass Cum.Mass (%)
Second input (-1mm)
Fraction (mm)
Mass (g) %Mass Cum. Mass
12.50 0.00 0.00 0.00 0.50 165.30 28.01 28.01 10.00 3.50 0.04 0.04 0.25 211.50 35.84 63.84 8.00 15.40 0.15 0.19 0.13 164.30 27.84 91.68 6.30 44.00 0.44 0.63 0.11 15.60 2.64 94.32 5.00 817.60 8.18 8.81 0.08 26.70 4.52 98.85 4.00 1289.30 12.90 21.72 0.05 5.50 0.93 99.78 3.35 987.80 9.89 31.60 0.05 0.90 0.15 99.93 2.00 2134.00 21.36 52.96 -0.05 0.40 0.07 100.00
1.00 1788.50 17.90 70.86 Total 590.20 100.00
-1.00 2911.70 29.14 100.00
Total 9991.80 100.00
Sieve analysis Linear Geometric
Fraction (mm)
%Mass Cum. Mass Dp Calc Dp Calc
12.50 0.00 0.00 14.25 0.00 10.00 0.04 0.04 11.25 0.00 11.18 0.00 8.00 0.15 0.19 9.00 0.01 8.94 0.01 6.30 0.44 0.63 7.15 0.03 7.10 0.03 5.00 8.18 8.81 5.65 0.46 5.61 0.46 4.00 12.90 21.72 4.50 0.58 4.47 0.58 3.35 9.89 31.60 3.68 0.36 3.66 0.36 2.00 21.36 52.96 2.68 0.57 2.59 0.55 1.00 17.90 70.86 1.50 0.27 1.41 0.25 0.50 8.16 79.02 0.75 0.06 0.71 0.06 0.25 10.44 89.46 0.38 0.04 0.35 0.04 0.13 8.11 97.58 0.19 0.02 0.18 0.01 0.11 0.77 98.35 0.12 0.00 0.12 0.00 0.08 1.32 99.66 0.09 0.00 0.09 0.00 0.05 0.27 99.94 0.06 0.00 0.06 0.00 0.05 0.04 99.98 0.05 0.00 0.05 0.00 -0.05 0.02 100.00 0.02 0.00 0.03 0.00
Total 100.00 2.41 2.36
________________________________________________________________________

94
APPENDIX I Sieves analysis of Phoenix-Sishen iron ore. Phoenix-Sishen 3
Fraction (mm)
Mass (g) %Mass Cum.Mass (%)
Second input (-1mm)
Fraction Mass (g) %Mass Cum. Mass
12.50 0.00 0.00 0.00 0.50 222.00 28.76 28.76 10.00 4.40 0.04 0.04 0.25 275.60 35.70 64.46 8.00 9.00 0.09 0.13 0.13 230.70 29.88 94.34 6.30 46.90 0.47 0.60 0.11 19.50 2.53 96.87 5.00 957.50 9.59 10.19 0.08 19.80 2.56 99.43 4.00 1403.30 14.05 24.24 0.05 3.70 0.48 99.91 3.35 1001.20 10.02 34.26 0.05 0.30 0.04 99.95 2.00 2227.10 22.30 56.56 -0.05 0.40 0.05 100.00
1.00 1749.10 17.51 74.07 Total 772.00 100.00
-1.00 2589.80 25.93 100.00
Total 9988.30 100.00
Sieve analysis Linear Geometric
Fraction %Mass Cum. Mass Dp Calc Dp Calc
12.50 0.00 0.00 14.25 0.00 10.00 0.04 0.04 11.25 0.00 11.18 0.00 8.00 0.09 0.13 9.00 0.01 8.94 0.01 6.30 0.47 0.60 7.15 0.03 7.10 0.03 5.00 9.59 10.19 5.65 0.54 5.61 0.54 4.00 14.05 24.24 4.50 0.63 4.47 0.63 3.35 10.02 34.26 3.68 0.37 3.66 0.37 2.00 22.30 56.56 2.68 0.60 2.59 0.58 1.00 17.51 74.07 1.50 0.26 1.41 0.25 0.50 7.46 81.53 0.75 0.06 0.71 0.05 0.25 9.26 90.78 0.38 0.03 0.35 0.03 0.13 7.75 98.53 0.19 0.01 0.18 0.01 0.11 0.65 99.19 0.12 0.00 0.12 0.00 0.08 0.67 99.85 0.09 0.00 0.09 0.00 0.05 0.12 99.98 0.06 0.00 0.06 0.00 0.05 0.01 99.99 0.05 0.00 0.05 0.00 -0.05 0.01 100.00 0.02 0.00 0.03 0.00
Total 100.00 2.55 2.50
________________________________________________________________________

95
APPENDIX I Sieves analysis of Phoenix-Sishen iron ore. Phoenix-Sishen 4
Fraction (mm)
Mass (g) %Mass Cum.Mass (%)
Second input (-1 mm)
Fraction Mass (g) %Mass Cum. Mass
12.50 0.00 0.00 0.00 0.50 199.00 31.46 31.46 10.00 0.00 0.00 0.00 0.25 224.70 35.52 66.98 8.00 7.20 0.07 0.07 0.13 178.50 28.22 95.19 6.30 37.20 0.37 0.44 0.11 12.00 1.90 97.09 5.00 738.80 7.40 7.84 0.08 16.00 2.53 99.62 4.00 1271.50 12.73 20.57 0.05 2.00 0.32 99.94 3.35 933.50 9.35 29.92 0.05 0.30 0.05 99.98 2.00 2222.80 22.26 52.18 -0.05 0.10 0.02 100.00
1.00 1799.30 18.02 70.19 Total 632.60 100.00
-1.00 2977.20 29.81 100.00
Total 9987.50 100.00
Sieve analysis Linear Geometric
Fraction %Mass Cum. Mass Dp Calc Dp Calc
12.50 0.00 0.00 14.25 0.00 10.00 0.00 0.00 11.25 0.00 11.18 0.00 8.00 0.07 0.07 9.00 0.01 8.94 0.01 6.30 0.37 0.44 7.15 0.03 7.10 0.03 5.00 7.40 7.84 5.65 0.42 5.61 0.42 4.00 12.73 20.57 4.50 0.57 4.47 0.57 3.35 9.35 29.92 3.68 0.34 3.66 0.34 2.00 22.26 52.18 2.68 0.60 2.59 0.58 1.00 18.02 70.19 1.50 0.27 1.41 0.25 0.50 9.38 79.57 0.75 0.07 0.71 0.07 0.25 10.59 90.16 0.38 0.04 0.35 0.04 0.13 8.41 98.57 0.19 0.02 0.18 0.01 0.11 0.57 99.13 0.12 0.00 0.12 0.00 0.08 0.75 99.89 0.09 0.00 0.09 0.00 0.05 0.09 99.98 0.06 0.00 0.06 0.00 0.05 0.01 100.00 0.05 0.00 0.05 0.00 -0.05 0.00 100.00 0.02 0.00 0.03 0.00
Total 100.00 2.36 2.31
________________________________________________________________________

96
APPENDIX I Sieves analysis of Phoenix-Sishen iron ore. Phoenix-Sishen 5
Fraction (mm)
Mass (g) %Mass Cum.Mass (%)
Second input (-1mm)
Fraction Mass (g) %Mass Cum. Mass
12.50 0.00 0.00 0.00 0.50 237.10 29.68 29.68 10.00 0.00 0.00 0.00 0.25 201.90 25.28 54.96 8.00 5.30 0.05 0.05 0.13 319.60 40.01 94.97 6.30 21.00 0.21 0.26 0.11 23.90 2.99 97.96 5.00 640.70 6.41 6.68 0.08 13.20 1.65 99.61 4.00 1024.90 10.26 16.94 0.05 2.20 0.28 99.89 3.35 903.00 9.04 25.98 0.05 0.80 0.10 99.99 2.00 2184.50 21.87 47.85 -0.05 0.10 0.01 100.00
1.00 1873.30 18.75 66.60 Total 798.80 100.00
-1.00 3336.40 33.40 100.00
Total 9989.10 100.00
Sieve analysis Linear Geometric
Fraction (mm)
%Mass Cum. Mass Dp Calc Dp Calc
12.50 0.00 0.00 14.25 0.00 10.00 0.00 0.00 11.25 0.00 11.18 0.00 8.00 0.05 0.05 9.00 0.00 8.94 0.00 6.30 0.21 0.26 7.15 0.02 7.10 0.01 5.00 6.41 6.68 5.65 0.36 5.61 0.36 4.00 10.26 16.94 4.50 0.46 4.47 0.46 3.35 9.04 25.98 3.68 0.33 3.66 0.33 2.00 21.87 47.85 2.68 0.58 2.59 0.57 1.00 18.75 66.60 1.50 0.28 1.41 0.27 0.50 9.91 76.51 0.75 0.07 0.71 0.07 0.25 8.44 84.96 0.38 0.03 0.35 0.03 0.13 13.36 98.32 0.19 0.03 0.18 0.02 0.11 1.00 99.32 0.12 0.00 0.12 0.00 0.08 0.55 99.87 0.09 0.00 0.09 0.00 0.05 0.09 99.96 0.06 0.00 0.06 0.00 0.05 0.03 100.00 0.05 0.00 0.05 0.00 -0.05 0.00 100.00 0.02 0.00 0.03 0.00
Total 100.00 2.18 2.13
________________________________________________________________________

97
APPENDIX I Sieves analysis of the mixture 20% Thabazimbi iron ore, 80% Sishen iron ore without fluxes. Fraction
(mm) Mass (g) %Mass Cum.Mas
s Second input (-1mm)
Fraction 9 (mm)
Mass (g) %Mass Cum. Mass
12.50 3.60 0.04 0.04 0.50 212.48 47.74 47.74 10.00 39.60 0.40 0.43 0.25 114.38 25.70 73.44 8.00 139.62 1.40 1.83 0.13 71.64 16.10 89.54 6.30 424.74 4.25 6.08 0.11 5.56 1.25 90.79 5.00 1114.64 11.16 17.24 0.08 16.62 3.73 94.52 4.00 1742.84 17.44 34.68 0.05 12.70 2.85 97.38 3.35 630.98 6.31 40.99 0.05 6.98 1.57 98.94 2.00 2436.70 24.39 65.38 -0.05 4.70 1.06 100.00
1.00 1608.56 16.10 81.48 Total 445.06 100.00
-1.00 1850.60 18.52 100.00
Total 9991.88 100.00
Sieve analysis Linear Geometric
Fraction (mm)
%Mass Cum. Mass
Dp Calc Dp Calc
12.50 0.04 0.04 14.25 0.01 10.00 0.40 0.43 11.25 0.04 11.18 0.04 8.00 1.40 1.83 9.00 0.13 8.94 0.12 6.30 4.25 6.08 7.15 0.30 7.10 0.30 5.00 11.16 17.24 5.65 0.63 5.61 0.63 4.00 17.44 34.68 4.50 0.78 4.47 0.78 3.35 6.31 40.99 3.68 0.23 3.66 0.23 2.00 24.39 65.38 2.68 0.65 2.59 0.63 1.00 16.10 81.48 1.50 0.24 1.41 0.23 0.50 8.84 90.32 0.75 0.07 0.71 0.06 0.25 4.76 95.08 0.38 0.02 0.35 0.02 0.13 2.98 98.06 0.19 0.01 0.18 0.01 0.11 0.23 98.29 0.12 0.00 0.12 0.00 0.08 0.69 98.99 0.09 0.00 0.09 0.00 0.05 0.53 99.51 0.06 0.00 0.06 0.00 0.05 0.29 99.80 0.05 0.00 0.05 0.00 -0.05 0.20 100.00 0.00 0.00 0.03 0.00
Total 100.00 3.11 3.05
________________________________________________________________________

98
APPENDIX I
Sieves analysis of the mixture 40% Thabazimbi iron ore, 60% Sishen iron ore without fluxes. Fraction
(mm) Mass (g) %Mass Cum.Mas
s (%)
Second input (-1mm)
Fraction (mm)
Mass (g) %Mass Cum.
Mass
12.50 3.60 0.04 0.04 0.50 212.48 47.74 47.74 10.00 39.60 0.40 0.43 0.25 114.38 25.70 73.44 8.00 139.62 1.40 1.83 0.13 71.64 16.10 89.54 6.30 424.74 4.25 6.08 0.11 5.56 1.25 90.79 5.00 1114.64 11.16 17.24 0.08 16.62 3.73 94.52 4.00 1742.84 17.44 34.68 0.05 12.70 2.85 97.38 3.35 630.98 6.31 40.99 0.05 6.98 1.57 98.94 2.00 2436.70 24.39 65.38 -0.05 4.70 1.06 100.00
1.00 1608.56 16.10 81.48 Total 445.06 100.00
-1.00 1850.60 18.52 100.00
Total 9991.88 100.00
Sieve analysis Linear Geometric
Fraction (mm)
%Mass Cum. Mass
Dp Calc Dp Calc
12.50 0.04 0.04 14.25 0.01 10.00 0.40 0.43 11.25 0.04 11.18 0.04 8.00 1.40 1.83 9.00 0.13 8.94 0.12 6.30 4.25 6.08 7.15 0.30 7.10 0.30 5.00 11.16 17.24 5.65 0.63 5.61 0.63 4.00 17.44 34.68 4.50 0.78 4.47 0.78 3.35 6.31 40.99 3.68 0.23 3.66 0.23 2.00 24.39 65.38 2.68 0.65 2.59 0.63 1.00 16.10 81.48 1.50 0.24 1.41 0.23 0.50 8.84 90.32 0.75 0.07 0.71 0.06 0.25 4.76 95.08 0.38 0.02 0.35 0.02 0.13 2.98 98.06 0.19 0.01 0.18 0.01 0.11 0.23 98.29 0.12 0.00 0.12 0.00 0.08 0.69 98.99 0.09 0.00 0.09 0.00 0.05 0.53 99.51 0.06 0.00 0.06 0.00 0.05 0.29 99.80 0.05 0.00 0.05 0.00 -0.05 0.20 100.00 0.00 0.00 0.03 0.00
Total 100.00 3.11 3.05
________________________________________________________________________

99
APPENDIX I
Sieves analysis of the mixture 50% Thabazimbi iron ore, 50% Sishen iron ore without fluxes. Fraction
(mm) Mass (g) %Mass Cum.Mas
s (%)
Second input (-1mm)
Fraction (mm)
Mass (g) %Mass Cum. Mass
12.50 3.15 0.03 0.03 0.50 158.10 36.03 36.03 10.00 35.25 0.35 0.38 0.25 117.40 26.76 62.79 8.00 117.30 1.17 1.56 0.13 120.50 27.46 90.25 6.30 493.75 4.94 6.50 0.11 16.50 3.76 94.01 5.00 917.85 9.18 15.68 0.08 22.05 5.03 99.04 4.00 1367.70 13.68 29.36 0.05 1.31 0.30 99.34 3.35 701.90 7.02 36.38 0.05 2.45 0.56 99.90 2.00 2257.00 22.58 58.95 -0.05 0.45 0.10 100.00
1.00 1609.95 16.10 75.06 Total 438.76 100.00
-1.00 2493.70 24.94 100.00
Total 9997.55 100.00
Sieve analysis Linear Geometric
Fraction %Mass Cum. Mass
Dp Calc Dp Calc
12.50 0.03 0.03 14.25 0.00 10.00 0.35 0.38 11.25 0.04 11.18 0.04 8.00 1.17 1.56 9.00 0.11 8.94 0.10 6.30 4.94 6.50 7.15 0.35 7.10 0.35 5.00 9.18 15.68 5.65 0.52 5.61 0.52 4.00 13.68 29.36 4.50 0.62 4.47 0.61 3.35 7.02 36.38 3.68 0.26 3.66 0.26 2.00 22.58 58.95 2.68 0.60 2.59 0.58 1.00 16.10 75.06 1.50 0.24 1.41 0.23 0.50 8.99 84.04 0.75 0.07 0.71 0.06 0.25 6.67 90.72 0.38 0.03 0.35 0.02 0.13 6.85 97.57 0.19 0.01 0.18 0.01 0.11 0.94 98.51 0.12 0.00 0.12 0.00 0.08 1.25 99.76 0.09 0.00 0.09 0.00 0.05 0.07 99.84 0.06 0.00 0.06 0.00 0.05 0.14 99.97 0.05 0.00 0.05 0.00 -0.05 0.03 100.00 0.02 0.00 0.03 0.00
Total 100.00 2.85 2.79
________________________________________________________________________

100
APPENDIX I Sieves analysis of the mixture 60% Thabazimbi iron ore, 40% Sishen iron ore without fluxes. Fraction
(mm) Mass (g) %Mass Cum.Mas
s
Second input (-1mm)
Fraction Mass (g) %Mass Cum. Mass
12.50 1.72 0.02 0.02 0.50 139.14 34.63 34.63 10.00 39.32 0.39 0.41 0.25 103.80 25.83 60.46 8.00 95.34 0.95 1.37 0.13 91.28 22.72 83.18 6.30 495.92 4.96 6.33 0.11 22.86 5.69 88.87 5.00 875.26 8.76 15.09 0.08 21.55 5.36 94.23 4.00 1370.80 13.72 28.81 0.05 8.82 2.20 96.43 3.35 519.48 5.20 34.01 0.05 9.20 2.29 98.72 2.00 2145.12 21.47 55.48 -0.05 5.14 1.28 100.00
1.00 1645.36 16.47 71.95 Total 401.79 100.00
-1.00 2802.20 28.05 100.00
Total 9990.52 100.00
Sieve analysis Linear Geometric
Fraction %Mass Cum. Mass
Dp Calc Dp Calc
12.50 0.02 0.02 14.25 0.00 10.00 0.39 0.41 11.25 0.04 11.18 0.04 8.00 0.95 1.37 9.00 0.09 8.94 0.09 6.30 4.96 6.33 7.15 0.35 7.10 0.35 5.00 8.76 15.09 5.65 0.49 5.61 0.49 4.00 13.72 28.81 4.50 0.62 4.47 0.61 3.35 5.20 34.01 3.68 0.19 3.66 0.19 2.00 21.47 55.48 2.68 0.57 2.59 0.56 1.00 16.47 71.95 1.50 0.25 1.41 0.23 0.50 9.71 81.66 0.75 0.07 0.71 0.07 0.25 7.25 88.91 0.38 0.03 0.35 0.03 0.13 6.37 95.28 0.19 0.01 0.18 0.01 0.11 1.60 96.88 0.12 0.00 0.12 0.00 0.08 1.50 98.38 0.09 0.00 0.09 0.00 0.05 0.62 99.00 0.06 0.00 0.06 0.00 0.05 0.64 99.64 0.05 0.00 0.05 0.00 -0.05 0.36 100.00 0.02 0.00 0.03 0.00
Total 100.00 2.73 2.68
________________________________________________________________________

101
APPENDIX I Sieves analysis of the mixture 80% Thabazimbi iron ore, 20% Sishen iron ore without fluxes. Fraction Mass (g) %Mass Cum.Mas
s (%)
Second input (-1mm)
Fraction Mass (g) %Mass Cum. Mass
12.50 7.60 0.08 0.08 0.50 196.72 28.45 28.45 10.00 36.82 0.37 0.44 0.25 160.90 23.27 51.72 8.00 69.72 0.70 1.14 0.13 149.52 21.62 73.34 6.30 624.96 6.25 7.39 0.11 20.14 2.91 76.25 5.00 1065.14 10.66 18.05 0.08 66.92 9.68 85.93 4.00 1041.36 10.42 28.47 0.05 50.44 7.29 93.23 3.35 770.98 7.71 36.18 0.05 28.02 4.05 97.28 2.00 2010.78 20.11 56.29 -0.05 18.82 2.72 100.00
1.00 1543.82 15.44 71.74 Total 691.48 100.00
-1.00 2825.32 28.26 100.00
Total 9996.50 100.00
Sieve analysis Linear Geometric
Fraction %Mass Cum. Mass
Dp Calc Dp Calc
12.50 0.08 0.08 14.25 0.01 10.00 0.37 0.44 11.25 0.04 11.18 0.04 8.00 0.70 1.14 9.00 0.06 8.94 0.06 6.30 6.25 7.39 7.15 0.45 7.10 0.44 5.00 10.66 18.05 5.65 0.60 5.61 0.60 4.00 10.42 28.47 4.50 0.47 4.47 0.47 3.35 7.71 36.18 3.68 0.28 3.66 0.28 2.00 20.11 56.29 2.68 0.54 2.59 0.52 1.00 15.44 71.74 1.50 0.23 1.41 0.22 0.50 8.04 79.78 0.75 0.06 0.71 0.06 0.25 6.58 86.35 0.38 0.02 0.35 0.02 0.13 6.11 92.47 0.19 0.01 0.18 0.01 0.11 0.82 93.29 0.12 0.00 0.12 0.00 0.08 2.74 96.02 0.09 0.00 0.09 0.00 0.05 2.06 98.09 0.06 0.00 0.06 0.00 0.05 1.15 99.23 0.05 0.00 0.05 0.00 -0.05 0.77 100.00 0.02 0.00 0.03 0.00
Total 100.00 2.79 2.73
________________________________________________________________________

102
APPENDIX I Sieves analysis of the mixture 50% Thabazimbi iron ore, 50% Sishen iron ore with fluxes not sized.
Fraction (mm)
Mass (g) %Mass Cum.Mass (%)
Second input (1mm)
Fraction Mass (g) %Mass Cum. Mass
12.50 21.80 0.22 0.22 0.50 180.30 43.23 43.23 10.00 18.00 0.18 0.40 0.25 142.30 34.12 77.34 8.00 22.10 0.22 0.62 0.13 78.00 18.70 96.04 6.30 212.20 2.12 2.74 0.11 12.00 2.88 98.92 5.00 767.20 7.67 10.42 0.08 3.20 0.77 99.69 4.00 1374.20 13.75 24.16 0.05 1.00 0.24 99.93 3.35 1080.90 10.81 34.98 0.05 0.20 0.05 99.98 2.00 1712.50 17.13 52.11 -0.05 0.10 0.02 100.00
1.00 2197.10 21.98 74.09 Total 417.10 100.00
-1.00 2590.30 25.91 100.00
Total 9996.30 100.00
Sieve analysis Linear Geometric
Fraction %Mass Cum. Mass Dp Calc Dp Calc
12.50 0.22 0.22 14.25 0.03 10.00 0.18 0.40 11.25 0.02 11.18 0.02 8.00 0.22 0.62 9.00 0.02 8.94 0.02 6.30 2.12 2.74 7.15 0.15 7.10 0.15 5.00 7.67 10.42 5.65 0.43 5.61 0.43 4.00 13.75 24.16 4.50 0.62 4.47 0.61 3.35 10.81 34.98 3.68 0.40 3.66 0.40 2.00 17.13 52.11 2.68 0.46 2.59 0.44 1.00 21.98 74.09 1.50 0.33 1.41 0.31 0.50 11.20 85.29 0.75 0.08 0.71 0.08 0.25 8.84 94.13 0.38 0.03 0.35 0.03 0.13 4.85 98.97 0.19 0.01 0.18 0.01 0.11 0.75 99.72 0.12 0.00 0.12 0.00 0.08 0.20 99.92 0.09 0.00 0.09 0.00 0.05 0.06 99.98 0.06 0.00 0.06 0.00 0.05 0.01 99.99 0.05 0.00 0.05 0.00 -0.05 0.01 100.00 0.02 0.00 0.03 0.00 Total 100.00 2.59 2.51
________________________________________________________________________

103
APPENDIX I Sieves analysis of the mixture 50% Thabazimbi iron ore, 50% Sishen iron ore with fluxes where only coke and lime were sized.
Fraction (mm)
Mass (g) %Mass Cum. Mass (%)
Second input(1mm)
Fraction Mass (g) %Mass Cum. Mass
12.50 12.00 0.12 0.12 0.50 187.50 37.14 37.14 10.00 10.40 0.10 0.22 0.25 130.80 25.91 63.04 8.00 21.50 0.22 0.44 0.13 161.20 31.93 94.97 6.30 247.30 2.47 2.91 0.11 13.00 2.57 97.54 5.00 712.30 7.13 10.04 0.08 9.00 1.78 99.33 4.00 823.60 8.24 18.28 0.05 2.80 0.55 99.88 3.35 1112.90 11.13 29.41 0.05 0.60 0.12 100.00 2.00 2500.00 25.01 54.42 -0.05 0.00 0.00 100.00
1.00 1680.00 16.81 71.23 Total
-1.00 2876.20 28.77 100.00
Total 9996.20
Sieve analysis Linear Geometric
Fraction %Mass Cum. Mass Dp Calc Dp Calc
12.50 0.12 0.12 14.25 0.02 10.00 0.10 0.22 11.25 0.01 11.18 0.01 8.00 0.22 0.44 9.00 0.02 8.94 0.02 6.30 2.47 2.91 7.15 0.18 7.10 0.18 5.00 7.13 10.04 5.65 0.40 5.61 0.40 4.00 8.24 18.28 4.50 0.37 4.47 0.37 3.35 11.13 29.41 3.68 0.41 3.36 0.41 2.00 25.01 54.42 2.68 0.67 2.59 0.65 1.00 16.81 71.23 1.50 0.25 1.41 0.24 0.50 10.69 81.91 0.75 0.08 0.71 0.08 0.25 7.45 89.37 0.38 0.03 0.35 0.03 0.13 9.19 98.55 0.19 0.02 0.18 0.02 0.11 0.74 99.29 0.12 0.00 0.12 0.00 0.08 0.51 99.81 0.09 0.00 0.09 0.00 0.05 0.16 99.97 0.06 0.00 0.06 0.00 0.05 0.03 100.00 0.05 0.00 0.05 0.00 -0.05 0.00 100.00 0.02 0.00 0.03 0.00 Total 100.00 2.46 2.39
________________________________________________________________________
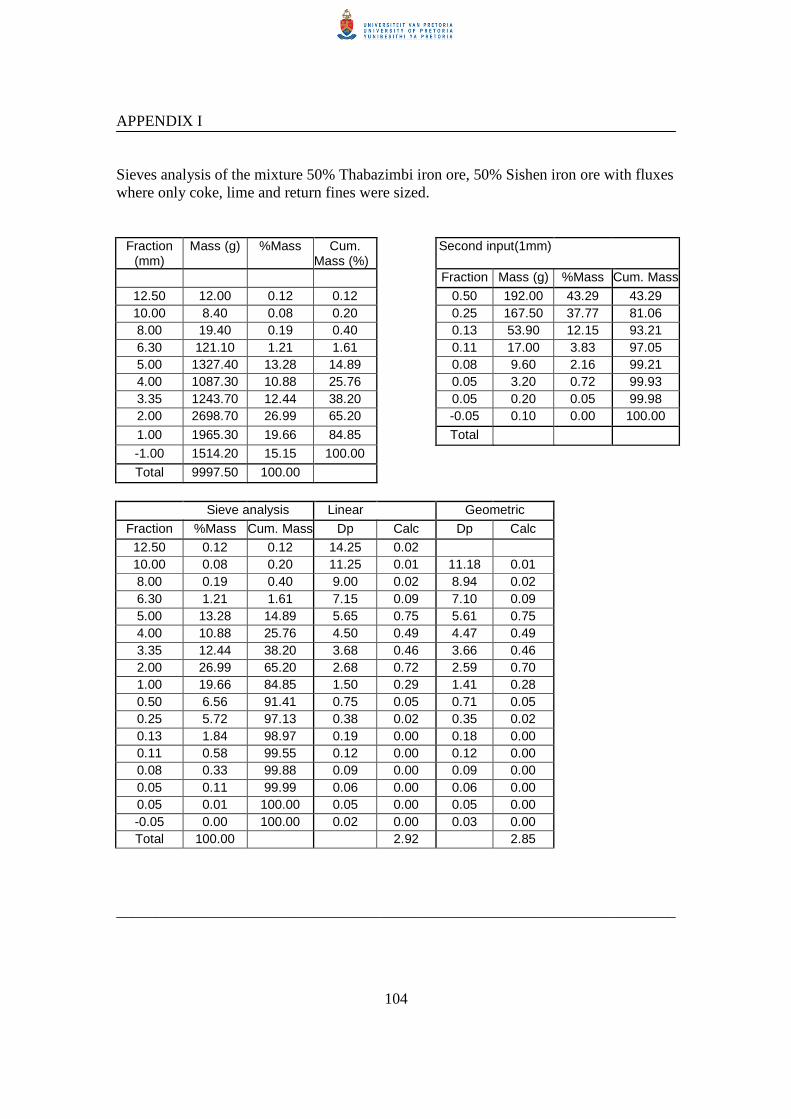
104
APPENDIX I Sieves analysis of the mixture 50% Thabazimbi iron ore, 50% Sishen iron ore with fluxes where only coke, lime and return fines were sized.
Fraction (mm)
Mass (g) %Mass Cum. Mass (%)
Second input(1mm)
Fraction Mass (g) %Mass Cum. Mass
12.50 12.00 0.12 0.12 0.50 192.00 43.29 43.29 10.00 8.40 0.08 0.20 0.25 167.50 37.77 81.06 8.00 19.40 0.19 0.40 0.13 53.90 12.15 93.21 6.30 121.10 1.21 1.61 0.11 17.00 3.83 97.05 5.00 1327.40 13.28 14.89 0.08 9.60 2.16 99.21 4.00 1087.30 10.88 25.76 0.05 3.20 0.72 99.93 3.35 1243.70 12.44 38.20 0.05 0.20 0.05 99.98 2.00 2698.70 26.99 65.20 -0.05 0.10 0.00 100.00
1.00 1965.30 19.66 84.85 Total
-1.00 1514.20 15.15 100.00
Total 9997.50 100.00
Sieve analysis Linear Geometric
Fraction %Mass Cum. Mass Dp Calc Dp Calc
12.50 0.12 0.12 14.25 0.02 10.00 0.08 0.20 11.25 0.01 11.18 0.01 8.00 0.19 0.40 9.00 0.02 8.94 0.02 6.30 1.21 1.61 7.15 0.09 7.10 0.09 5.00 13.28 14.89 5.65 0.75 5.61 0.75 4.00 10.88 25.76 4.50 0.49 4.47 0.49 3.35 12.44 38.20 3.68 0.46 3.66 0.46 2.00 26.99 65.20 2.68 0.72 2.59 0.70 1.00 19.66 84.85 1.50 0.29 1.41 0.28 0.50 6.56 91.41 0.75 0.05 0.71 0.05 0.25 5.72 97.13 0.38 0.02 0.35 0.02 0.13 1.84 98.97 0.19 0.00 0.18 0.00 0.11 0.58 99.55 0.12 0.00 0.12 0.00 0.08 0.33 99.88 0.09 0.00 0.09 0.00 0.05 0.11 99.99 0.06 0.00 0.06 0.00 0.05 0.01 100.00 0.05 0.00 0.05 0.00 -0.05 0.00 100.00 0.02 0.00 0.03 0.00 Total 100.00 2.92 2.85
________________________________________________________________________

105
APPENDIX I Sieves analysis of the mixture 20% Thabazimbi iron ore, 80% Sishen iron ore with fluxes not sized.
Fraction (mm)
Mass (g) %Mass Cum. Mass (%)
Second input(1mm)
Fraction Mass (g) %Mass Cum. Mass
12.50 12.00 0.12 0.12 0.50 205.40 39.39 39.39 10.00 7.60 0.08 0.20 0.25 178.60 34.25 73.65 8.00 17.80 0.18 0.37 0.13 94.00 18.03 91.68 6.30 114.20 1.14 1.52 0.11 21.60 4.14 95.82 5.00 1000.20 10.00 11.52 0.08 18.30 3.51 99.33 4.00 905.00 9.05 20.57 0.05 2.70 0.52 99.85 3.35 1092.60 10.93 31.50 0.05 0.80 0.15 100.00 2.00 2804.60 28.05 59.55 -0.05 0.00 0.00 100.00
1.00 1928.30 19.29 78.84 Total 521.40 100.00
-1.00 2115.60 21.16 100.00
Total 9997.90 100.00
Sieve analysis Linear Geometric
Fraction %Mass Cum. Mass Dp Calc Dp Calc
12.50 0.12 0.12 14.25 0.02 10.00 0.08 0.20 11.25 0.01 11.18 0.01 8.00 0.18 0.37 9.00 0.02 8.94 0.02 6.30 1.14 1.52 7.15 0.08 7.10 0.08 5.00 10.00 11.52 5.65 0.57 5.61 0.56 4.00 9.05 20.57 4.50 0.41 4.47 0.40 3.35 10.93 31.50 3.68 0.40 3.66 0.40 2.00 28.05 59.55 2..68 0.75 2.59 0.73 1.00 19.29 78.84 1.50 0.29 1.41 0.27 0.50 8.34 87.18 0.75 0.06 0.71 0.06 0.25 7.25 94.42 0.38 0.03 0.35 0.03 0.13 3.81 98.24 0.19 0.01 0.18 0.01 0.11 0.88 99.12 0.12 0.00 0.12 0.00 0.08 0.74 99.86 0.09 0.00 0.09 0.00 0.05 0.11 99.97 0.06 0.00 0.06 0.00 0.05 0.03 100.00 0.05 0.00 0.05 0.00 -0.05 0.00 100.00 0.02 0.00 0.030 0.00 Total 100.00 2.64 2.56
________________________________________________________________________

106
APPENDIX I Sieves analysis of the mixture 20% Thabazimbi iron ore, 80% Sishen iron ore with fluxes where only coke and lime were sized.
Fraction (mm)
Mass (g) %Mass Cum. Mass (%)
Second input(1mm)
Fraction Mass (g) %Mass Cum. Mass
12.50 4.00 0.04 0.04 0.50 169.00 41.14 41.14 10.00 8.10 0.08 0.12 0.25 140.20 34.13 75.27 8.00 6.60 0.07 0.19 0.13 81.00 19.72 94.99 6.30 112.30 1.12 1.31 0.11 12.20 2.97 97.96 5.00 658.20 6.59 7.90 0.08 6.80 1.66 99.61 4.00 890.30 8.91 16.81 0.05 1.30 0.32 99.93 3.35 1060.20 10.61 27.42 0.05 0.30 0.07 100.00 2.00 2417.40 24.19 51.61 -0.05 0.00 0.00 100.00
1.00 1995.50 19.97 71.58 Total 410.80 100.00
-1.00 2839.50 28.42 100.00
Total 9992.10 100.00
Sieve analysis Linear Geometric
Fraction %Mass Cum. Mass Dp Calc Dp Calc
12.50 0.04 0.04 14.25 0.01 0.01 10.00 0.08 0.12 11.25 0.01 11.18 0.01 8.00 0.07 0.19 9.00 0.01 8.94 0.08 6.30 1.12 1.31 7.15 0.08 7.10 0.37 5.00 6.59 7.90 5.65 0.37 5.61 0.40 4.00 8.91 16.81 4.50 0.40 4.47 0.39 3.35 10.61 27.42 3.68 0.39 3.66 0.63 2.00 24.19 51.61 2.68 0.65 2.59 0.28 1.00 19.97 71.58 1.50 0.30 1.41 0.08 0.50 11.69 83.27 0.75 0.09 0.71 0.03 0.25 9.70 92.97 0.38 0.04 0.35 0.01 0.13 5.60 98.57 0.19 0.01 0.18 0.00 0.11 0.84 99.42 0.12 0.00 0.12 0.00 0.08 0.47 99.89 0.09 0.00 0.09 0.00 0.05 0.09 99.98 0.06 0.00 0.06 0.00 0.05 0.02 100.00 0.05 0.00 0.05 0.00 -0.05 0.00 100.00 0.02 0.00 0.03 0.00 Total 100.00 2.35 2.29
________________________________________________________________________

107
APPENDIX I Sieves analysis of the mixture 20% Thabazimbi iron ore, 80% Sishen iron ore with fluxes where coke, lime and return fines were sized.
Fraction (mm)
Mass (g) %Mass Cum. Mass (%)
Second input(1mm)
Fraction Mass (g) %Mass Cum. Mass
12.50 8.00 0.08 0.08 0.50 146.40 40.76 40.76 10.00 14.80 0.15 0.23 0.25 113.20 31.51 72.27 8.00 22.10 0.22 0.45 0.13 86.90 24.19 96.46 6.30 290.40 2.9 3.35 0.11 7.30 2.03 98.50 5.00 1402.00 14.02 17.38 0.08 3.30 0.92 99.42 4.00 1308.00 13.08 30.46 0.05 2.00 0.56 99.97 3.35 1188.50 11.89 42.35 0.05 0.10 0.03 100.00 2.00 2225.50 22.26 64.61 -0.05 0.00 0.00 100.00
1.00 2179.50 21.80 86.41 Total 359.20
-1.00 1359.10 13.59 100.00
Total 9997.90
Sieve analysis Linear Geometric
Fraction %Mass Cum. Mass Dp Calc Dp Calc
12.50 0.08 0.08 14.25 0.01 10.00 0.15 0.23 11.25 0.02 11.18 0.02 8.00 0.22 0.45 9.00 0.02 8.94 0.02 6.30 2.90 3.35 7.15 0.21 7.10 0.21 5.00 14.02 17.38 5.65 0.79 5.61 0.79 4.00 13.08 30.46 4.50 0.59 4.47 0.59 3.35 11.89 42.35 3.68 0.44 3.66 0.44 2.00 22.26 64.61 2.68 0.60 2.59 0.58 1.00 21.80 86.41 1.50 0.33 1.41 0.31 0.50 5.54 91.95 0.75 0.04 0.71 0.04 0.25 4.28 96.23 0.38 0.02 0.35 0.02 0.13 3.29 99.52 0.19 0.01 0.18 0.01 0.11 0.28 99.80 0.12 0.00 0.12 0.00 0.08 0.12 99.92 0.09 0.00 0.09 0.00 0.05 0.08 100.00 0.06 0.00 0.06 0.00 0.05 0.00 10.00 0.05 0.00 0.05 0.00 -0.05 0.00 100.00 0.02 0.00 0.03 0.00 Total 100.00 3.06 2.99
________________________________________________________________________

108
APPENDIX II Sieve analysis before and after granulation
Before granulation
After granulation
Fraction (mm)
Mass (g)
% Mass
Cum.mass (%)
Mass (g)
% Mass
Cum.mass (%)
5.00 1041.30 10.42 10.42 191.60 35.55 35.55
4.00 1374.20 13.75 24.16 86.00 15.95 51.50
3.35 1080.90 10.81 34.98 73.80 13.69 65.19
2.00 1712.50 17.13 52.11 118.60 22.00 87.20 1.00 2197.10 21.98 74.09 68.70 12.75 99.94
0.50 1119.71 11.20 85.29 0.32 0.06 100.00
0.25 883.72 8.84 94.13 0.00 0.00 100.00
-0.25 586.87 5.87 100.00 0.00 0.00 100.00 Tot 9996.30 539.02
Fraction
% Diff.
%Transferred
5.000 25.129 52.471
4.000 2.208 4.610
2.000 4.872 10.172
1.000 -9.234 -19.281
0.500 -11.142 -23.265
0.250 -8.840 -18.459
0.075 -5.871 -12.259
X (mm) S = (%<xmm)BG -(%<xmm)AG Ex = 100 * S/S’ 1.6 = (%>xmm)AG -(%>xmm)BF = 73.26 = (%<2mm)BG -(%<2mm)AG = 35.087 _______
-30
-20
-10
0
10
20
30
0.01 0.10 1.00 10.00
Fraction(mm)
% L
oss
or G
ain

109
APPENDIX III XRF analysis of sinter samples.
% GSNcert GSN Mixture 1 Mixture 2 Mixture 3 Mixture 4
SiO2 65.80 65.44 5.04 4.78 5.02 4.70
TiO2 0.68 0.64 0.10 0.10 0.11 0.11
Al2O3 14.67 14.63 1.31 1.52 1.39 1.51
Fe2O3 3.75 3.67 80.99 81.04 81.90 81.25
MnO 0.06 0.05 0.38 0.28 0.37 0.28
MgO 2.30 2.21 2.89 2.89 2.88 2.86
CaO 2.50 2.99 9.35 9.32 9.60 9.28
Na2O 3.77 3.81 0.01 0.01 0.01 0.01
K2O 4.63 4.70 0.06 0.05 0.06 0.06
P2O5 0.28 0.29 0.10 0.12 0.10 0.12
Cr2O3 0.008 0.008 0.03 0.03 0.02 0.03
NiO 0.0043 0.006 0.00 0.00 0.00 0.00
V2O5 0.01 0.01 0.01 0.01 0.01 0.01
ZrO2 0.03 0.03 0.00 0.00 0.00 0.00
LOI 1.32 1.29 -0.82 -0.88 -0.84 -0.84
TOTAL 99.82 99.78 99.44 99.26 100.63 99.39
ppm GSNcert GSN Mixture 1 Mixture 2 Mixture 3 Mixture 4
As 1.6 3 18 34 29 44
Cu 20 26 24 13 18 13
Ga 22 20 6 4 7 5
Mo 1.2 1 38 38 37 39
Nb 21 22 29 30 29 29
Ni 34 37 72 59 27 38
Pb 53 46 26 23 32 31
Rb 185 182 27 30 28 29
Sr 570 579 215 311 225 317
Th 42 41 64 65 61 63
U 8 5 62 66 61 66
W* 450 458 100 119 147 160
Y 19 11 38 37 36 36
Zn 48 50 34 24 34 22
Zr 235 227 81 72 80 72
Cl* 450 499 115 144 113 125
Co 65 57 2 2 2 2
Cr 55 45 115 118 72 84
F* 1050 1177 874 723 636 663
S* 140 556 81 72 73 73
Sc 7 6 1 3 1 2
V 65 63 20 19 17 19
Cs 5 6 9 9 9 9
Ba 1400 1417 127 167 133 173
La 75 60 30 29 31 28
Ce 135 138 5 5 5 5
________________________________________________________________________

110
APPENDIX IV Sieve analysis of the granulated mixture Phoenix iron ore-Sishen iron ore with as-received fluxes1
Sieve analysis of the granulated mixture Phoenix iron ore-Sishen iron ore with as-received fluxes1’ Granule('+ 5mm) Granule('+ 4mm) Granule('+ 3,35mm) Granule('+ 2mm) Granule('+ 1mm)
Fraction Mass(g) Mass(%) Mass(g) Mass(%) Mass(g) Mass(%) Mass(g) Mass(%) Mass(g) Mass(%)
5 58.500 84.783 4 7.300 10.580 58.800 82.238
3.35 0.000 0.000 8.200 11.469 34.000 49.347 2 0.000 0.000 0.300 0.420 25.800 37.446 78.100 57.216 1 0.000 0.000 0.100 0.140 0.200 0.290 33.200 24.322 78.000 63.260
0.5 0.400 0.580 0.600 0.839 0.700 1.016 2.800 2.051 21.300 17.275 0.25 0.700 1.014 0.900 1.259 1.300 1.887 5.600 4.103 9.000 7.299 -0.25 2.100 3.043 2.600 3.636 6.900 10.015 16.800 12.308 15.000 12.165
Total 69.000 100.000 71.500 100.000 68.900 100.000 136.500 100.000 123.300 100.000
_________________________________________________________________________________________
Granule('+ 5mm) Granule('+ 4mm) Granule('+ 3,35mm) Granule('+ 2mm) Granule('+ 1mm)
Fraction Mass(g) Mass(%) Mass(g) Mass(%) Mass(g) Mass(%) Mass(g) Mass(%) Mass(g) Mass(%)
5 50.800 84.385 4 6.600 10.963 64.700 84.575
3.35 0.000 0.000 7.500 9.804 31.900 48.260 2 0.000 0.000 0.300 0.392 24.200 36.611 84.200 59.759 1 0.000 0.000 0.100 0.131 0.600 0.908 30.400 21.576 79.000 64.542
0.5 0.400 0.664 0.500 0.654 0.500 0.756 3.300 2.342 18.400 15.033 0.25 0.500 0.831 0.800 1.046 1.400 2.118 5.000 3.549 8.100 6.618 -0.25 1.900 3.156 2.600 3.399 7.500 11.346 18.000 12.775 16.900 13.807
Total 60.200 100.000 76.500 100.000 66.100 100.000 140.900 100.000 122.400 100.000

111
APPENDIX IV Sieves analysis of the granulated mixture Phoenix iron ore-Sishen iron ore with as-received fluxes 2
Granule('+ 5mm) Granule('+ 4mm) Granule('+ 3,35mm) Granule('+ 2mm) Granule('+ 1mm)
Fraction Mass(g) Mass(%) Mass(g) Mass(%) Mass(g) Mass(%) Mass(g) Mass(%) Mass(g) Mass(%)
5.00 100.50 55.04 4.00 27.10 14.84 89.10 44.44 3.35 6.60 3.61 45.60 22.74 50.40 45.16 2.00 11.70 6.41 26.00 12.97 35.70 31.99 117.40 58.94 1.00 10.30 5.64 10.80 5.39 8.90 7.97 44.50 22.34 113.30 74.64 0.50 8.20 4.49 6.70 3.34 4.20 3.76 10.10 5.07 16.90 11.13 0.25 7.20 3.94 7.40 3.69 3.70 3.32 9.30 4.67 6.30 4.15 -0.25 11.00 6.02 14.90 7.43 8.70 7.80 17.90 8.99 15.30 10.08
Total 182.60 100.00 200.50 100.00 111.60 100.00 199.20 100.00 151.80 100.00
Sieves analysis of the granulated mixture Phoenix iron ore-Sishen iron ore 2’
Granule('+ 5mm) Granule('+ 4mm) Granule('+ 3,35mm) Granule('+ 2mm) Granule('+ 1mm) Fraction Mass(g) Mass(%) Mass(g) Mass(%) Mass(g) Mass(%) Mass(g) Mass(%) Mass(g) Mass(%)
5.00 90.20 54.87 4.00 18.90 11.50 89.10 44.57 3.35 7.80 4.74 45.60 22.81 56.70 47.05 2.00 14.00 8.52 26.00 13.01 36.02 29.89 101.40 57.42 1.00 8.30 5.05 10.80 5.40 9.20 7.63 36.00 20.39 97.30 73.10 0.50 8.70 5.29 7.60 3.80 5.00 4.15 9.60 5.44 13.80 10.37 0.25 6.50 3.95 7.20 3.60 4.40 3.65 11.20 6.34 7.20 5.41 -0.25 10.00 6.08 13.60 6.80 9.20 7.63 18.40 10.42 14.80 11.12
Total 164.40 100.00 199.90 100.00 120.52 100.00 176.60 100.00 133.10 100.00
___________________________________________________________________________________________

112
APPENDIX IV Sieves analysis of the granulated mixture Phoenix iron ore-Sishen iron ore 3
Granule('+ 5mm) Granule('+ 4mm) Granule('+ 3,35mm) Granule('+ 2mm) Granule('+ 1mm)
Fraction Mass(g) Mass(%) Mass(g) Mass(%) Mass(g) Mass(%) Mass(g) Mass(%) Mass(g) Mass(%)
5.00 157.20 54.02 4.00 48.70 16.74 68.40 41.86 3.35 11.70 4.02 42.30 25.89 36.40 44.34 2.00 16.50 5.67 20.20 12.36 28.90 35.20 77.50 71.49 1.00 18.70 6.43 11.30 6.92 7.40 9.01 19.50 17.99 50.70 80.09 0.50 12.50 4.30 6.50 3.98 3.00 3.65 4.40 4.06 6.70 10.58 0.25 10.30 3.54 6.10 3.73 2.30 2.80 2.50 2.31 2.70 4.27 -0.25 15.40 5.29 8.60 5.26 4.10 4.99 4.50 4.15 3.20 5.06
Total 291.00 100.00 163.40 100.00 82.10 100.00 108.40 100.00 63.30 100.00
Sieves analysis of the granulated mixture Phoenix iron ore-Sishen iron ore 3’
Granule('+ 5mm) Granule('+ 4mm) Granule('+ 3,35mm) Granule('+ 2mm) Granule('+ 1mm) Fraction Mass(g) Mass(%) Mass(g) Mass(%) Mass(g) Mass(%) Mass(g) Mass(%) Mass(g) Mass(%)
5.00 115.20 44.82 4.00 50.20 19.53 82.00 48.09 3.35 13.80 5.37 35.50 20.82 35.80 42.42 2.00 21.00 8.17 19.40 11.38 29.90 35.43 84.90 64.46 1.00 20.50 7.98 12.80 7.51 7.70 9.12 28.40 21.56 46.60 75.77 0.50 11.30 4.40 6.10 3.58 3.10 3.67 5.50 4.18 8.30 13.50 0.25 10.00 3.89 5.90 3.46 2.60 3.08 4.20 3.19 2.50 4.07 -0.25 15.00 5.84 8.80 5.16 5.30 6.28 8.70 6.61 4.10 6.67
Total 257.00 100.00 170.50 100.00 84.40 100.00 131.70 100.00 61.50 100.00
___________________________________________________________________________________________

113
APPENDIX IV Sieves analysis of the granulated mixture Phoenix iron ore-Sishen iron ore 4
Granule('+ 5mm) Granule('+ 4mm) Granule('+ 3,35mm) Granule('+ 2mm) Granule('+ 1mm)
Fraction Mass(g) Mass(%) Mass(g) Mass(%) Mass(g) Mass(%) Mass(g) Mass(%) Mass(g) Mass(%)
5.00 90.20 36.37 4.00 45.70 18.43 68.90 41.58 3.35 18.10 7.30 37.60 22.69 38.00 40.86 2.00 22.60 9.11 24.20 14.60 31.40 33.76 73.90 72.03 1.00 24.00 9.68 9.80 5.91 6.70 7.20 11.40 11.11 62.80 82.74 0.50 12.30 4.96 5.00 3.02 2.80 3.01 6.60 6.43 6.70 8.83 0.25 16.50 6.65 7.00 4.22 3.10 3.33 3.40 3.31 2.40 3.16 -0.25 18.60 7.50 13.20 7.97 11.00 11.83 7.30 7.12 4.00 5.27
Total 248.00 100.00 165.70 100.00 93.00 100.00 102.60 100.00 75.90 100.00
Sieves analysis of the granulated mixture Phoenix iron ore-Sishen iron ore 4’
Granule('+ 5mm) Granule('+ 4mm) Granule('+ 3,35mm) Granule('+ 2mm) Granule('+ 1mm) Fraction Mass(g) Mass(%) Mass(g) Mass(%) Mass(g) Mass(%) Mass(g) Mass(%) Mass(g) Mass(%)
5.00 96.50 37.78 4.00 46.20 18.09 73.00 40.76 3.35 16.80 6.58 40.60 22.67 35.50 41.86 2.00 23.70 9.28 29.10 16.25 28.90 34.08 80.70 74.31 1.00 24.00 9.40 11.30 6.31 5.10 6.01 12.20 11.23 61.00 85.315 0.50 13.80 5.40 5.30 2.96 2.80 3.30 6.20 5.71 4.90 6.853 0.25 15.00 5.87 6.80 3.80 2.30 2.71 3.00 2.76 2.80 3.916 -0.25 19.40 7.60 13.00 7.26 10.20 12.03 6.50 5.99 2.80 3.916
Total 255.40 100.00 179.10 100.00 84.80 100.00 108.60 100.00 71.50 100.000
__________________________________________________________________________________________

83


![Application Example 09/2016 Exchange of large data volumes ...€¦ · Raw[3] Raw[4] GetTagRawWait Tag Raw R_ID Raw[0] Raw[1] Raw[2] Raw[3] Raw[4] SetTagRawWait. 3 Basic information](https://img.dokumen.tips/doc/110x75/5f1fce0444607025af2e69fc/application-example-092016-exchange-of-large-data-volumes-raw3-raw4-gettagrawwait.jpg)