Embed Size (px)
Citation preview

REVIEW
Copyright © 2010 American Scientific PublishersAll rights reservedPrinted in the United States of America
Journal ofComputational and Theoretical Nanoscience
Vol. 7, 1–29, 2010
Optimal Tooltip Trajectories in a Hydrogen AbstractionTool Recharge Reaction Sequence for Positionally
Controlled Diamond Mechanosynthesis
Denis Tarasov1, Natalia Akberova2, Ekaterina Izotova2, Diana Alisheva2,Maksim Astafiev1, and Robert A. Freitas, Jr.3�∗1Kazan Scientific Center, Russian Academy of Science, Russia
2Department of Biology, Kazan State University, Russia3Institute for Molecular Manufacturing, Palo Alto, CA 94301, USA
The use of precisely applied mechanical forces to induce site-specific chemical transformationsis called positional mechanosynthesis, and diamond is an important early target for achievingmechanosynthesis experimentally. A key step in diamond mechanosynthesis (DMS) employs anethynyl-based hydrogen abstraction tool (HAbst) for the site-specific mechanical dehydrogenationof H-passivated diamond surfaces, creating an isolated radical site that can accept adatoms viaradical–radical coupling in a subsequent positionally controlled reaction step. The abstraction tool,once used (HAbstH), must be recharged by removing the abstracted hydrogen atom from thetooltip, before the tool can be used again. This paper presents the first theoretical study of DMStool-workpiece operating envelopes and optimal tooltip trajectories for any positionally controlledreaction sequence—and more specifically, one that may be used to recharge a spent hydrogenabstraction tool—during scanning-probe based ultrahigh-vacuum diamond mechanosynthesis. Tra-jectories were analyzed using Density Functional Theory (DFT) in PC-GAMESS at the B3LYP/6-311G(d,p)//B3LYP/3-21G(2d,p) level of theory. The results of this study help to define equipmentand tooltip motion requirements that may be needed to execute the proposed reaction sequenceexperimentally and provide support for early developmental targets as part of a comprehensivenear-term DMS implementation program.
Keywords: Abstraction, Carbon, Diamond, DMS, Germanium, Hydrogen, Mechanosynthesis,Nanotechnology, Pathology, Positional Control, Reaction Sequence, Tooltip,Trajectory.
CONTENTS
1. Introduction . . . . . . . . . . . . . . . . . . . . . . . . . . . . . . . . . 12. Computational Methods . . . . . . . . . . . . . . . . . . . . . . . . . 43. Reaction I: Join GeRad Tool to Apical Ethynyl C Atom
of HAbstH . . . . . . . . . . . . . . . . . . . . . . . . . . . . . . . . . . 53.1. Tooltip Geometry and Coordinate System . . . . . . . . . . . 53.2. PES as a Function of Positional Angles � and � . . . . . . 63.3. Trajectory Pathologies of Reaction I . . . . . . . . . . . . . . 83.4. PES as a Function of Rotational Angle � . . . . . . . . . . . 93.5. Lateral Displacement Error Tolerance . . . . . . . . . . . . . 103.6. Optimal Tooltip Trajectories . . . . . . . . . . . . . . . . . . . 11
4. Reaction II: Abstract Apical H from HAbstH UsingGeRad2 Tool . . . . . . . . . . . . . . . . . . . . . . . . . . . . . . . . 154.1. Tooltip Geometry and Coordinate System . . . . . . . . . . . 154.2. PES as a Function of Positional Angles �H and �H . . . . . 164.3. Trajectory Pathologies of Reaction II . . . . . . . . . . . . . . 184.4. PES as a Function of Rotational Angle �H . . . . . . . . . . 20
∗Author to whom correspondence should be addressed.
4.5. Lateral Displacement Error Tolerance . . . . . . . . . . . . . 204.6. Optimal Tooltip Trajectories . . . . . . . . . . . . . . . . . . . 21
5. Reaction III: Detach GeRad Tool from Recharged HAbst Tool . 215.1. Tooltip Geometry and Coordinate System . . . . . . . . . . . 215.2. PES as a Function of Rotational Angle �D . . . . . . . . . . 225.3. PES as a Function of Positional Angles �D and �D . . . . . 235.4. Trajectory Pathologies of Reaction III . . . . . . . . . . . . . 235.5. Optimal Tooltip Trajectories . . . . . . . . . . . . . . . . . . . 27
6. Conclusions . . . . . . . . . . . . . . . . . . . . . . . . . . . . . . . . . 28Acknowledgments . . . . . . . . . . . . . . . . . . . . . . . . . . . . . 28References . . . . . . . . . . . . . . . . . . . . . . . . . . . . . . . . . . 28
1. INTRODUCTION
Arranging atoms in most of the ways permitted by phys-ical law is a fundamental objective of molecular manu-facturing. A more modest and specific objective is theability to synthesize atomically precise diamondoid struc-tures using positionally controlled molecular tools. Such
J. Comput. Theor. Nanosci. 2010, Vol. 7, No. 2 1546-1955/2010/7/001/029 doi:10.1166/jctn.2010.1365 1

REVIEW
Optimal Tooltip Trajectories in a Hydrogen Abstraction Tool Recharge Reaction Sequence Tarasov et al.
Denis Tarasov is Senior Reasearch Scientist at the Supercomputer Center of Kazan Sci-entific Center of Russian Academy of Sciences, in Kazan, Russia. He graduated from theDepartment of Biochemistry of Kazan State University in Kazan (Russian Federation) andreceived an M.S. in biochemistry. He received his Ph.D. in Biology from Kazan State Uni-versity in 2004. His research interests include computer modeling in biology and chemistry,high performance computing and molecular machine systems. He has published 15 refereedjournal publications.
Natalia Akberova is Assistant Professor of the Kazan State University biology depart-ment. She has a Ph.D. in Biology, with specialization in biochemistry (1999) and lecturerof courses for biology department students in informatics, bioinformatics, and modelingin biology. Her scientific interests include systems biology, bioinformatics, and molecularmodeling.
Ekaterina Izotova is a Ph.D. candidate in Kazan State University with reseach interests inmolecular mechanics and quantum chemistry methods. She was born in Kazan (Russia) andreceived her M.S. in biochemistry from Kazan State University.
Diana Alisheva is a Ph.D. candidate at the Kazan State University with reseach interestsin molecular mechanics and quantum chemistry methods. She was born in Kazan (Russia)and received her M.S. in biochemistry from Kazan State University.
Maksim Astafiev is Senior Research Scientist at the Kazan Scientific Center of RussianAcademy of Sciences in Kazan, Russia. Since 2000 he has devoted himself to the creationof high performance computers and organization of computing services for science institutesof the Kazan Scientific Center of the Russian Academy of Sciences. His research interestsinclude: high performance computers, information technology and telecommunications forresearch, computational mathematics. He is co-organizer of Public Supercomputing Centerat KSC RAS. He is author of a number of reports for international and Russian conferencesdevoted to the latest developments of information support for research on high performancecomputing, and co-author of publications in various Russian journals.
2 J. Comput. Theor. Nanosci. 7, 1–29, 2010

REVIEW
Tarasov et al. Optimal Tooltip Trajectories in a Hydrogen Abstraction Tool Recharge Reaction Sequence
Robert A. Freitas, Jr. is Senior Research Fellow at the Institute for Molecular Manu-facturing (IMM) in Palo Alto, California, and was a Research Scientist at Zyvex Corp.(Richardson, Texas), the first molecular nanotechnology company, during 2000–2004. Hereceived B.S. degrees in Physics and Psychology from Harvey Mudd College in 1974 anda J.D. from University of Santa Clara in 1979. Freitas co-edited the 1980 NASA feasibilityanalysis of self-replicating space factories and in 1996 authored the first detailed technicaldesign study of a medical nanorobot ever published in a peer-reviewed mainstream biomedi-cal journal. Freitas is the author of Nanomedicine, the first book-length technical discussionof the potential medical applications of molecular nanotechnology; the initial two volumesof this 4-volume series were published in 1999 and 2003 by Landes Bioscience. His researchinterests include: nanomedicine, medical nanorobotics design, molecular machine systems,
diamondoid mechanosynthesis (theory and experimental pathways), molecular assemblers and nanofactories, atomicallyprecise manufacturing, and self-replication in machine and factory systems. He has published 49 refereed journal publi-cations and contributed book chapters, co-authored Kinematic Self-Replicating Machines (Landes Bioscience, 2004), andin 2006 co-founded the Nanofactory Collaboration. His home page is at www.rfreitas.com.
positional control might be achieved using an instrumentlike a Scanning Probe Microscope (SPM). The landmarkexperimental demonstration of positional atomic assemblyoccurred in 1989 when Eigler and Schweizer1 employedan SPM to spell out the IBM logo using 35 xenon atomsarranged on nickel surface, though no covalent bonds wereformed.The use of precisely applied mechanical forces to induce
site-specific chemical transformations is called positionalmechanosynthesis. In 2003, Oyabu et al.2 achieved the firstexperimental demonstration of atomically precise purelymechanical positional chemical synthesis on a heavy atomusing only mechanical forces to make and break covalentbonds, first abstracting and then rebonding a single siliconatom to a silicon surface with SPM positional control invacuum at low temperature. Using an atomic force micro-scope the same group similarly manipulated individual Geatoms in 20043 and Si/Sn atoms in 2008.4
The assumption of positionally controlled highly reac-tive tools operating in vacuum permits the use of noveland relatively simple reaction pathways. Following earlygeneral proposals by Drexler5 and Merkle6 for possi-ble diamond mechanosynthesis (DMS) tools and sketchesof conceptual approaches to a few reaction pathways,a comprehensive three-year DFT-based (Density Func-tional Theory) study by Freitas and Merkle7 computation-ally analyzed for the first time a complete set of DMSreactions and an associated minimal set of nine specificDMS tooltips that could be used to build basic diamond,graphene (e.g., carbon nanotubes), and all of the toolsthemselves including all necessary tooltip recharging reac-tions. Their work defined 65 foundational DMS reactionsequences incorporating 328 reaction steps.A key step in the process of atomically precise
mechanosynthetic fabrication of diamond is to remove ahydrogen atom from a specific lattice location on the dia-mond surface, leaving behind a reactive dangling bond
able to accept adatoms via radical–radical coupling ina subsequent positionally controlled reaction step. Thisremoval could be done using a hydrogen abstraction tool8
that has a high chemical affinity for hydrogen at one endbut is elsewhere inert. The tool’s unreactive region servesas a handle or handle attachment point. The tool wouldbe held by a high-precision nanoscale positioning devicesuch as an SPM tip that is moved directly over particularhydrogen atoms on the surface. One suitable molecule fora hydrogen abstraction tooltip is the acetylene or “ethynyl”radical, comprised of two triple-bonded carbon atoms. Onecarbon of the two serves as the handle connection andwould bond to a nanoscale positioning device through alarger handle structure. The other carbon of the two hasa dangling bond where a hydrogen atom would normallybe present in a molecule of ordinary acetylene (C2H2�,forming the reactive tip. The environment around the toolwould be inert (e.g., vacuum or a noble gas such asxenon). This tool has received substantial theoretical studyand computational validation,5–14 and site-specific hydro-gen abstraction from crystal surfaces, though not purelymechanical abstraction, has also been achieved experimen-tally via scanning probe microscopy. For example, Lydinget al.15–17 demonstrated the ability to abstract an individ-ual hydrogen atom from a specific atomic position in acovalently-bound hydrogen monolayer on a flat Si(100)surface, using an electrically-pulsed SPM tip in ultrahighvacuum. Ho’s group18 has similarly demonstrated position-ally controlled single-atom hydrogen abstraction experi-mentally using an SPM.After each use, the “spent” hydrogen abstraction tool has
an unwanted H atom bonded to its tip that must be removedbefore the tool can be used again for hydrogen abstractionin a molecular manufacturing system. Freitas and Merkle7
describe a mechanosynthetic reaction sequence (Fig. 1)labeled “RS5” involving three reaction steps that could beused to recharge a spent ethynyl-type hydrogen abstrac-tion tool (hereinafter “HAbst” after recharge, “HAbstH”
J. Comput. Theor. Nanosci. 7, 1–29, 2010 3

REVIEW
Optimal Tooltip Trajectories in a Hydrogen Abstraction Tool Recharge Reaction Sequence Tarasov et al.
Reaction I Reaction II Reaction III
Fig. 1. Schematic of reaction sequence 5 from Freitas and Merkle,7 showing recharge reaction for 1-ethynyladamantane hydrogen abstraction tool(end product of Reaction III, structure at top) using sequence of three positionally controlled reactions involving two 1-germanoadamantane radicaltooltips. (C= black, H= white, Ge= yellow).
when hydrogenated and requiring recharge), modeled asan ethynyl radical mounted on an adamantane base (i.e.,1-ethynyladamantane). This base would be part of a largerdiamond lattice handle structure in an actual DMS tool.The recharge reaction requires the use of a second posi-tionally controlled tool, a germanium radical (hereinafter“GeRad”), which is modeled as an adamantane base withan unterminated germanium atom substituted for carbonat a bridgehead position (i.e., 1-germanoadamantane). Theunterminated Ge atom is the active tip of the GeRad tool.During the recharge reaction RS5, the Ge radical on aGeRad tool is first bonded to the distal C atom of theethynyl group on the spent HAbstH tool. A second GeRad(hereinafter “GeRad2”) is brought up to the transactionalH atom on the HAbstH tool and abstracts the H atom; thisH atom is readily donated to a clean diamond surface (notillustrated), recovering the original GeRad2 tool. GeRadis then mechanically debonded from the distal C atom,yielding a recharged HAbst tool.While the proposed recharge reaction sequence appears
energetically favorable, to date the positional and rota-tional operating envelopes of specific DMS tools act-ing on specific surfaces, workpieces, or other tools havebeen examined theoretically in only one prior study19
that considered a C2 dimer placement tool (DCB6Ge)20
interacting with a clean C(110) diamond surface in a sin-gle mechanosynthetic reaction. No such studies have yetbeen attempted for any other DMS tool or depositionsurface, nor have any yet been attempted for completereaction sequences. This paper presents the first theoret-ical study of DMS tool-workpiece operating envelopesand optimal tooltip trajectories for any positionally con-trolled reaction sequence—in particular, one that maybe used in a complete three-reaction mechanosyntheticsequence to recharge a spent hydrogen abstraction tool—during scanning-probe based ultrahigh-vacuum diamondmechanosynthesis. The results of this study help to defineequipment and tooltip motion requirements that may beneeded to execute the proposed reaction sequence exper-imentally and provide guidance on early development
targets as part of a comprehensive near-term DMS imple-mentation program.
2. COMPUTATIONAL METHODS
All studies were conducted using Density Functional The-ory (DFT) in the PC-GAMESS version21 of the GAMESS(US) QC package21A running on several clusters con-suming ∼188,320 CPU-hours of runtime at 1 GHz, andincluded 5,284 separate valid-structure calculations. Dur-ing this four-year course of work (in 2005–2009) thehardware was upgraded several times, and has includeda cluster of 3 GHz Pentium4 HT (5 nodes), a cluster of2 GHz AMD Opteron machines (16 nodes) and 1.8 GHzIntel Xeon machines (8 nodes) at the Supercomputing Cen-ter at the Kazan Scientific Center of the Russian Academyof Sciences (KSC RAS), and a cluster of 1.6 GHz AMDOpteron 240 machines (8 nodes, 2 CPU per node).A comparison (Table I) of the reaction energy (energy of
optimized product (HAbstH-GeRad complex) less energyof optimized reactants) for Reaction I shows that com-puted exoergicity is dependent on basis set choice,
Table I. Comparison of basis sets for calculating bond lengths,bond angles, and reaction energies (without zero-point correction) inReaction I.
Reaction C–Ge bond Ge–C–C bondBasis set energy (eV) length (Å) angle (deg)
AM1 −0.708 1.974 122.7STO-3 −2.109 1.918 120.7MIDI −1.135 1.953 123.83-21G(d) −0.917 1.980 121.23-21G(2d,p) −0.997 1.967 122.33-21G+ (2d,2p) −1.047 1.966 123.46-31G(d) −1.083 1.953 123.46-31G+ (2d,2p) −0.964 1.958 123.1DZV −1.234 1.953 125.66-311G −0.695 1.969 123.86-311G(d,p) −0.694 1.971 123.56-311G(d,p)//3-21G(2d,p) −0.696 1.966a 123.4a
aug-cc-VTZ//6-311G(d,p) −0.634 1.971b 123.5b
aGeometry from 3-21G(2d,p) basis set. bGeometry from 6-311G(d,p) basis set.
4 J. Comput. Theor. Nanosci. 7, 1–29, 2010

REVIEW
Tarasov et al. Optimal Tooltip Trajectories in a Hydrogen Abstraction Tool Recharge Reaction Sequence
but that DFT energies computed using 6-311G(d,p)//3-21G(2d,p) differ little from 6-311G(d,p)//6-311G(d,p) andare comparable to the highest-accuracy cc-aug-VTZ//6-311G(d,p) energy, with semi-empirical AM1 giving asurprisingly good performance. Optimized reactant andproduct structures are also very similar to the 6-311G(d,p)results except for STO-3G. Based on these results, weselected the 6-311G(d,p)//3-21G(2d,p) basis set for therest of this study, using B3LYP which is a hybridHartree-Fock/DFT method using Becke’s three-parametergradient-corrected exchange functional (B3)23 with theLee-Yang-Parr correlation functional (LYP).24 The meanabsolute deviation from experiment (MAD) for B3LYP/6-311+G(2d,p)//B3LYP/3-21G(d) energies is estimated25 as0.14 eV for carbon-rich molecules, which should be ade-quate for the purposes of this analysis while conservingcomputational resources, and which appears slightly supe-rior to the MAD of 0.34 eV estimated25 for the more com-monly reported B3LYP/6-31G(d)//B3LYP/6-31G(d) basisset. In conventional positionally uncontrolled chemistry,errors on the order of 0.14 eV might well influence reac-tion rates and also the dominant reaction pathway takenwhen multiple alternative reaction pathways are present.However, in the context of the present analysis this shouldnot be an issue because alternative reaction pathways arelimited by using positional control. Zero-point correctionsare not made to the energy data because:(1) the differences between energies with and withouta correction are small (∼0.008 eV for Reaction I, andsimilarly for Reaction II),(2) the number of points to be evaluated is large (manythousands in this study), and(3) the computational expense is huge (e.g., analyticalsecond derivatives for spin-unrestricted calculations arenot implemented in PC-GAMESS and the calculation ofnumerical frequencies requires about twice as much CPUtime as geometry optimizations).
For each of the three positionally controlled mechano-synthetic reactions examined, the HAbst, HAbstH andGeRad tooltips are constrained by fixing the positionsof the three sidewall carbon atoms (CH2 groups) in thetooltip adamantane base that are located on the side ofthe cage farthest from the active radical site of the tool.Each tool was thus fixed precisely in space by constrainingjust 3 toolbase atoms from the start of each run, then thesystem was allowed to relax to its equilibrium geometryduring the run. This method provides the best model foranticipated actual laboratory conditions in which an exper-imentalist will control tooltip position by applying forcesthrough a larger diamond lattice handle structure affixedbehind the base structures of the respective tooltips. Foreach run, each tooltip base was positionally constrained toa specific spherical coordinate � (in XY plane) and � (inZ direction) in fixed increments, and to several fixed radialdistances R, and the incoming tooltip was also constrainedto a specific axial rotational angle �.
3. REACTION I: JOIN GeRad TOOL TOAPICAL ETHYNYL C ATOM OF HAbstH
In Reaction I of the HAbst recharge reaction sequenceRS5 (Fig. 1), a GeRad tool is brought up to the distalethynyl carbon atom to which the abstracted hydrogenatom is bonded on the HAbstH tool (which now becomesthe workpiece), and is then bonded. This decreases thecarbon–carbon bond order from 3 to 2, causing the car-bon dimer to become nonlinear relative to the adamantanehandle central axis and creating an open radical site on thecarbon atom proximal to the HAbstH base structure.After defining the tooltip geometry and coordinate sys-
tem for Reaction I (Section 3.1) we calculate the reactionPES (potential energy surface) as a function of positionalangles � and � (Section 3.2), describe some trajectory-related pathologies (Section 3.3), calculate the reactionPES as a function of rotational angle � of the incom-ing GeRad tool (Section 3.4), estimate the tolerance forlateral displacement error in tooltip positioning for Reac-tion I (Section 3.5), then recommend some optimal GeRadtooltip trajectories for this reaction (Section 3.6).
3.1. Tooltip Geometry and Coordinate System
The tooltip geometry and coordinate system for Reac-tion I is shown in Figure 2. The first coordinate origin Ois defined as the point equidistant from the fixed carbonatoms C4, C6, and C10 in the HAbstH adamantane base,and lying in the plane containing those atoms. The X axislies perpendicular to the C4/C6/C10 plane and points fromorigin O to a second origin O′ which is initially coinci-dent with atom C12 in HAbstH, ∼5.262 Å away from O.This axis passes from origin O through atoms C1, C11,C12, and H28, whose equilibrium positions are collinearin HAbstH. The Y axis originates at O′, lies perpendicu-lar to the X axis, and runs parallel to a vector pointingfrom atom C10 to origin O. The Z axis also originatesat O′ and lies perpendicular to X and Y axes followingthe right-hand rule, running parallel to a vector pointingfrom atom C6 to atom C4. The approaching GeRad toolis initially oriented relative to the HAbstH workpiece suchthat a line extending backwards through atoms C12 (originO′) and Ge35 perpendicularly penetrates the plane definedby the 3 fixed GeRad tool base carbon atoms (C30, C32,and C34), intersecting a third origin O′′ which lies in theC30/C32/C34 plane and is equidistant from C30, C32 andC34, analogous to origin O.In this spherical coordinate system, � is defined as the
angle from the X axis to the Y axis of the projection of thevector pointing from O′ to O′′ onto the XY plane. Note that+� is defined as rotation toward the −Y axis in the arrowdirection, since the target hydrogen atom (H28) movesaway from GeRad in the +Y direction (−� direction)upon GeRad bonding to atom C12 at the completion of
J. Comput. Theor. Nanosci. 7, 1–29, 2010 5

REVIEW
Optimal Tooltip Trajectories in a Hydrogen Abstraction Tool Recharge Reaction Sequence Tarasov et al.
GeRad2
Fig. 2. Coordinate system for Reaction I: Positionally controlled reactant tooltips prior to reaction (top left), and following completion of reaction(top right), defining phi (�� and theta (��, including atom labels (bottom, left), and definition of tooltip axial rotation angle rho (�� (bottom, right).(C= yellow, H= blue, Ge= white).
Reaction I. � is defined as the angle from the XY plane tothe vector pointing from O′ to O′′, with −90� ≤ � ≤+90�
and −180� ≤ � ≤ +180�. Radial distance R is defined asthe distance between origins O′′ and O′. Although atomC12 moves away from O′ as the reaction proceeds, theproper experimental protocol is nevertheless to aim the O′′-to-Ge35 vector directly toward the fixed origin O′ (not toC12, which moves) to execute Reaction I. The rotationalstate of HAbstH is completely specified after labeling thebase atoms C4, C6, and C10 and defining the positiveY -axis as the C10-to-O direction. The rotational state ofGeRad, specified by �, is measured as the angle taken fromthe O-to-C10 vector to the O′′-to-C34 vector when GeRadis virtually repositioned to (�, ��= �180�, 0�� making O′′
coincident with O, with +� taken in the clockwise direc-tion as viewed from O′. Thus, rotation to +� becomesequivalent to rotation to −� at � =+90�, or to +� at � =−90�. This coordinate system was chosen because originsO and O′′ experience negligible reaction-mediated nonther-mal displacement during the course of the reaction andthus may be most directly controlled in an experimentalapparatus.
3.2. PES as a Function of Positional Angles � and �
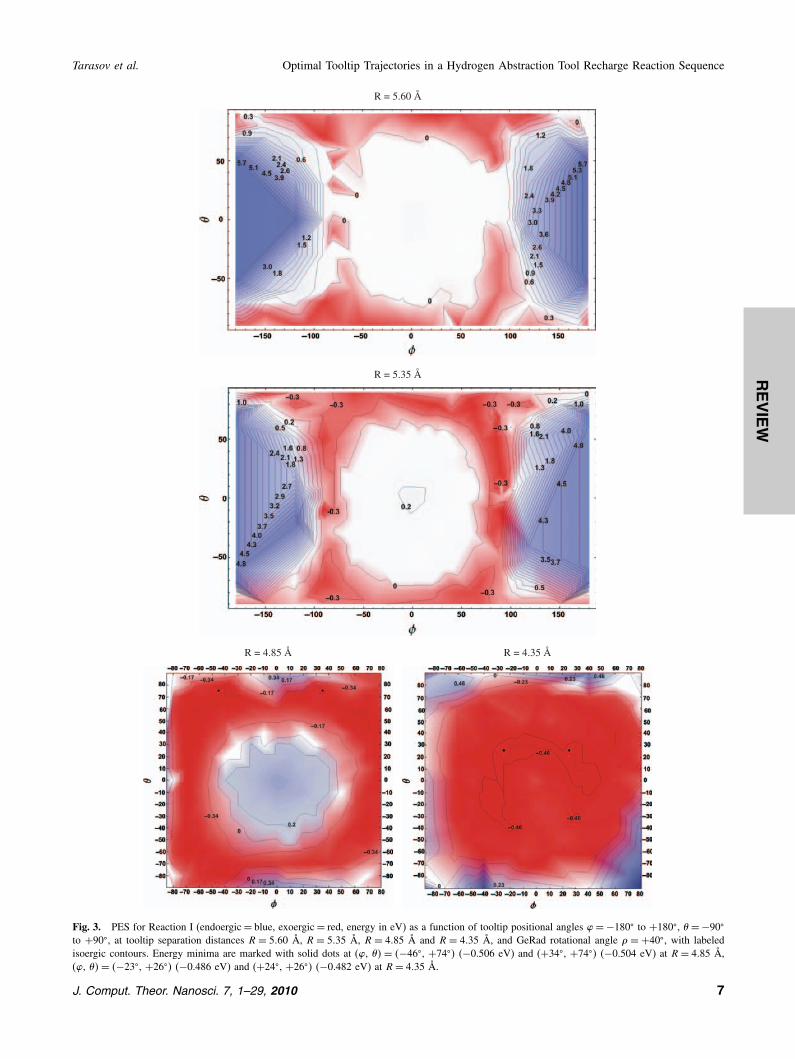
The PES as a function of positional angles � and � isshown in Figure 3, holding GeRad at the rotational angle� = +40�, for four different tooltip-workpiece displace-ments (R = 5�60 Å, 5.35 Å, 4.85 Å, and 4.35 Å) as theGeRad tool approaches the HAbstH workpiece.At R = 5�60 Å, with Ge35 roughly 3.20 Å away from
O′ (originally at C12), the PES in a 90� × 90� angularregion centered on (�, �� = �0�, 0�� is largely featurelessand flat, with strongly endoergic mountains centered on(�, ��= �±180�, 0�� due to rapidly rising steric repulsionbetween approaching HAbstH and GeRad tool handles atthose angles. At R = 5�35 Å, with Ge35 roughly 2.95 Åaway from O′, a weakly endoergic hill about 30� in radiushas appeared at the center of the PES due to rising repul-sion between the Ge35 radical on the GeRad tool andthe target hydrogen atom H28 on the HAbstH workpiece,since H28 lies between Ge35 and C12 at these angles ofapproach. At R= 4�85 Å, with Ge35 roughly 2.45 Å awayfrom O′, the hydrogen hill at the center of the PES hasbecome more repulsive, defining an annular region sur-rounding the hydrogen hill within which the GeRad tool
6 J. Comput. Theor. Nanosci. 7, 1–29, 2010
REVIEW
Tarasov et al. Optimal Tooltip Trajectories in a Hydrogen Abstraction Tool Recharge Reaction Sequence
R = 5.35 Å
R = 4.85 Å R = 4.35 Å
R = 5.60 Å
Fig. 3. PES for Reaction I (endoergic= blue, exoergic= red, energy in eV) as a function of tooltip positional angles �=−180� to +180�, � =−90�
to +90�, at tooltip separation distances R = 5�60 Å, R = 5�35 Å, R = 4�85 Å and R = 4�35 Å, and GeRad rotational angle � = +40�, with labeledisoergic contours. Energy minima are marked with solid dots at (�, ��= �−46�, +74�� (−0.506 eV) and (+34�, +74�� (−0.504 eV) at R= 4�85 Å,(�, ��= �−23�, +26�� (−0.486 eV) and (+24�, +26�� (−0.482 eV) at R= 4�35 Å.
J. Comput. Theor. Nanosci. 7, 1–29, 2010 7

REVIEW
Optimal Tooltip Trajectories in a Hydrogen Abstraction Tool Recharge Reaction Sequence Tarasov et al.
may approach the distal C12 atom along a maximally exo-ergic trajectory. By R= 4�35 Å, with Ge35 roughly 1.95 Åaway from O′ (the approximate equilibrium Ge–C bondlength), H28 has moved off to the side and the PES in an80�×80� region centered on (�, ��= �0�, 0�� is uniformlyexoergic, mostly in the −0.40 to −0.50 eV range, for thecompleted Ge35–C12 bonding reaction.The spherical representations of the PES (Fig. 4) for
R = 4�85 show regions of favorable (red, exoergic) andunfavorable (blue, endoergic) net reaction energies fromthe viewpoint of a GeRad tool as it approaches theHAbstH tool—here represented by the hydrogenatedethynyl (CCH) group, the HAbstH handle bridgehead Catom to which the ethynyl is attached and the three side-wall C atoms attached to the bridgehead. The central endo-ergic (blue) hydrogen hill is surrounded by an exoergic(red) annular region, with another (blue) annular regionbehind it indicating unfavorable energetics, with a yellowregion at negative X-axis values that is excluded due tohandle collision.A comparison of the succession of charts in Figure 3
indicates the presence of a favorable annular region withinwhich many dozens of useful approach trajectories exist,such as the (�, �, �� = �+40�, +70�, +40�� example.A closer examination of the progression of the Ge35–C12 bonding reaction for this exemplar trajectory (Fig. 5)shows the kinking of the bridgehead-ethynyl group andthe ∼60� shift in CC–H28 bond angle (left image), alongwith the ∼0.13 Å increase in CC bond length as bondorder changes from 3 (C≡C) to 2 (C C) and the changein Ge35–C12 equilibrium separation as the Ge–C bondforms (center image). The 1D PES (right image) shows aslight uplift in energy peaking at R = 5�65 Å as GeRadapproaches, prior to consummation of the bonding reac-tion, revealing a small +0.09 eV reaction barrier along thistrajectory. The ∼0.18 Å excess separation (above diagonalline on top curve in center image) due to repulsion betweenGe35 and C12 at the R= 5�65 Å barrier peak implies thatonly a rather modest mechanical force of ∼0.80 nN mustbe applied by the incoming GeRad tool to overcome this
Z Z
Y X
Z
X
Fig. 4. Three views of spherical representation of PES for reaction I (endoergic = blue, exoergic = red) as a function of tooltip positional angles �and � (see Fig. 2) expressed on the cartesian XYZ coordinate system at tooltip separation distance R= 4�85 Å and GeRad rotational angle �=+40�.Yellow region is excluded due to handle collision.
repulsive barrier, when following this particular exemplarapproach trajectory.
3.3. Trajectory Pathologies of Reaction I
Aside from the known possible reaction pathologies ofReaction I that are energetically disfavored,7 two addi-tional classes of undesired trajectory-associated patholo-gies have been identified in the present work (Fig. 6).The first trajectory pathology involves the bonding of
Ge35 and C11 (the proximal ethynyl carbon atom onHAbstH to which H28 is not directly attached) in thecase of high-� trajectories that allow the Ge35 radicalsite to pass too close to C11 while moving toward C12,enabling an unwanted Ge35–C11 bond to form before thedesired Ge35–C12 bond can form (Fig. 6(A)). Nonexhaus-tive investigations of numerous relevant (�, �� trajectoriesat �=+40� and R= 4�85 Å revealed that the Ge35–C11misbonding pathology does not occur for ��� ≤ 90�, andoccurs only at low � for some higher values of �, e.g.,at (�, �� = �−100�, +20�� and (−100�, +30��, and at(+120�, 0�� and (+120�, −40��, and is not observed insome high-� high-� trajectories such as (�, ��= �+120�,±70��. Apparently the pathology is absent when the clos-est initial Ge35–C11 distance dGe35–C11 is ≥2.74 Å, withpathology permitted but not mandatory for 2.73 Å >dGe35–C11 ≥2.57 Å.The second class of trajectory pathologies involves
unwanted high-energy covalent bond formation betweenHAbstH and GeRad tool handles during very high-� tra-jectories where the handles are computationally forcedinto experimentally unrealistic proximity at the start ofan energy minimization. Five distinct structural rearrange-ments were recorded, of two general subclasses: twoinstances (Figs. 6(D and F)) in which a handle-cageshoulder-bond to Ge35 is broken, resulting in diradicaliza-tion of the Ge atom, and three instances (Figs. 6(B, C andE)) in which multiple rebonding events between handle-cage atoms are accompanied by the release of an H2
molecule, a likely spurious result. These rearrangements
8 J. Comput. Theor. Nanosci. 7, 1–29, 2010

REVIEW
Tarasov et al. Optimal Tooltip Trajectories in a Hydrogen Abstraction Tool Recharge Reaction Sequence
Fig. 5. Progression of Ge35–C12 bonding reaction in Reaction I as a function of R (Å) for a fixed (�, �, ��= �+40�, +70�, +40�� approach trajectoryat 0.05 Å increments. Left: C1–C11–C12 (black) and C11–C12–H28 (red) bond angles (deg). Center: Ge35–C12 (black) and C11–C12 (red) bonddistances (Å). Right: PES (eV).
have not been investigated in further detail since they occuronly well outside of the recommended (�, �� operatingrange of ∼ �±80�, ±80�� for Reaction I, and are reportedhere for completeness.
3.4. PES as a Function of Rotational Angle �
Figure 7 shows the effects of GeRad tooltip rotationalangle � on the 1-dimensional PES for Reaction I. At (�,��= �0�, 0�� for R= 4�85 Å, the PES has negligible varia-tion with changing � because the HAbstH and GeRad han-dles are maximally distant, thus minimizing handle–handlesteric interactions. Using the viable (�, ��= �+40�, +70��trajectory, varying � has greater effect—there is a smallervariation of about ±0.03 eV at a more distant separation
(A)
(D) (E) (F)
(B) (C)
Fig. 6. Six instances of handle–handle rearrangements observed during experimentally unrealistic close apposition of tooltip handles for Reaction I,at R= 4�85 Å and �=+40�, for (�, �� settings: (A) (+100�, −30��, (−100�, +30��, (−100�, +20��, (+120�, −40��, and (+120�, 0��; (B) (−110�,−10��; (C) (−120�, 0��; (D) (−120�, +20��; (E) (+150�, −40��; and (F) (−150�, −50��. (C= yellow, H= blue, Ge= white).
distance of R= 4�85 Å and a somewhat larger variation of±0.14 eV as final Ge35–C12 bond formation is reached atR = 4�35 Å, with reaction energy minimized in this caseat � = +40�, +160�, and +280�. There are three peaksand valleys due to the threefold symmetry of the GeRadtooltip: the Ge–C bonds of the three sidewall CH2 groupsbonded to Ge35 are spaced 120� apart, as are the threegaps between those shoulder groups, producing an asym-metric steric interaction when GeRad is brought into closerproximity to the HAbstH handle and rotated to variousvalues of �. At the most extreme values of � =±90�, thechoice of � (∼ �� has greatest effect because of the stronghandle–handle interactions as GeRad rotations in � movetool handle sidewall CH2 groups into and out of juxtapo-sition on the apposed tool handles. In particular, there is a
J. Comput. Theor. Nanosci. 7, 1–29, 2010 9

REVIEW
Optimal Tooltip Trajectories in a Hydrogen Abstraction Tool Recharge Reaction Sequence Tarasov et al.
Fig. 7. PES for Reaction I as a function of GeRad tooltip rotational angle �, for trajectory (�, �� = �0�, 0�� at R = 4�85 Å and trajectory (�,��= �+40�, +70�� at R= 4�85 Å and 4.35 Å (at left), and trajectories � =±90� at R= 4�85 Å (at right) where � displacements are equivalent to �.
variation of ±0.38 eV depending on the choice of �, andwith the reaction energy for Reaction I minimized at �(∼ ��= 0�, ±120� in this case. Note that if the GeRad toolwas held fixed in space and instead the HAbstH workpiecewas rotated around its central axis, we would expect to seethe same trimodal pattern in net energy due to the similarthreefold symmetry of the HAbstH handle structure.Figure 7 shows that the impact of � on net reaction
energy can sometimes be significant, especially near theperimeter of the recommended (�, �� operating range of∼ �±80�, ±80�� for Reaction I. Since the choice of � forwhich Reaction I net energy will be minimized is a func-tion of the selected approach trajectory (�, �� but is not afunction of R, Figure 8 explores the space of minimum-and maximum-energy � values as a function of � and �in the two representative (+�, ±�� quadrants to 20� reso-lution at R= 4�85 Å. The results confirm that:(a) the impact of � on net reaction energy increases withlarger � or � (Figs. 8(A and B)) and may vary significantlydepending upon trajectory (Fig. 8(D)),(b) the increase in net reaction energy caused by choos-ing the most detrimental versus the most optimal � rangesfrom 0.0 eV to +0.7 eV (Fig. 8(B)), and(c) the choice of optimal � (Fig. 8(C)) can vary from 0�
to 100� depending upon choice of (�, ��.
The apparent patternlessness of optimal � settings inFigure 8(C) is partly due to the occurrence in somecases of multiple minima having small energy differenceswithin the computational error and partly artifactual dueto wraparound (i.e., �= 0� = 120��.
For trajectories where the most optimal and most detri-mental � values give reaction energies that differ onlyslightly (i.e., white areas in Fig. 8(B)), the precise valueof � is inconsequential in determining reaction reliabil-ity and thus the ability to positionally control � duringthe experiment may not be crucial. For other trajectorieswhere this energy differential is large (i.e., dark blue areasin Fig. 8(B)), � can be a significant factor in determiningreaction reliability in which case the ability to positionallycontrol � during the experiment would be very important.
3.5. Lateral Displacement Error Tolerance
To specify a useful experimental protocol it is alsonecessary to determine the maximum tolerable lateralmisplacement error of GeRad that will still result in a suc-cessful consummation of Reaction I. We start by defin-ing the U -axis as a vector pointing from O′′ to C34 andthe V -axis as a vector originating at O′′ and perpendic-ular to U that points parallel and codirectional with avector from C30 to C32 (Fig. 9). We can then exam-ine whether the Ge35–C12 bond still forms when GeRadis translationally displaced within the UV plane awayfrom its intended position at any point within a particu-lar approach trajectory. A comprehensive analysis of allpossible displacements from every point along all possibleapproach trajectories is beyond the scope of this paper, sowe analyzed a representative reaction point (R = 4�35 Å)along a single exemplar approach trajectory: (�, �, �� =�+40�, +70�, +50��. The lateral displacement of GeRadfrom its intended trajectory is reported as a displacementangle � measured from U and a displacement radial dis-tance �r measured from O′′.
Simulations began by examining small �r , moving tolarger �r , simulating progressively larger displacementerror circles. At some �r we would expect to find thatGe35 and C12 are too far apart to form the desiredbond. However, before that point is reached a compet-ing Ge35–C11 bonding pathology is encountered, initiallyonly at � = 90� where the GeRad error displacementmoves Ge35 exactly in the C11 direction. This � = 90�
pathology is observed at �r = 0�6 Å but not at �r =0�5 Å. Thus the maximum tolerable GeRad tooltip dis-placement error for successfully completing Reaction Ialong the exemplar trajectory at � = 90� is 0.5 Å. Withincreasing �r beyond 0.6 Å, the range of � over whichthe Ge35–C11 bonding pathology occurs increases—e.g.,by �r = 1�0 Å the pathology is found over �= 50�–130�
although the desired Ge35–C12 bonding is still obtained atall other �; at �r = 1�5 Å, Ge35–C12 bonding is obtainedonly at �= 180�; and at �r = 1�6 Å the desired Ge35–C12
10 J. Comput. Theor. Nanosci. 7, 1–29, 2010

REVIEW
Tarasov et al. Optimal Tooltip Trajectories in a Hydrogen Abstraction Tool Recharge Reaction Sequence
(A)
ϕ ϕ ϕ
θ θ θ(B)
(D)
eV eV deg(C)
Fig. 8. Effects on reaction energy for various choices of GeRad tooltip rotational angle � as a function of (�, �� trajectory for R = 4�85 Å inReaction I: (A) minimum net energy Emin (eV) produced by choosing the optimum � value for each trajectory; (B) increase in net reaction energy(eV) over minimum (Emin� produced by choosing the most detrimental � value that yields the highest reaction energy Emax, or �Emax–Emin�; (C) choiceof optimum � value (deg) that produces the minimum net energy shown in (A) for each trajectory; and (D) energy variations as a function of � fortrajectories (�, �� = �+80�, +60��, (0�, +60�� and (+60�, +40��. Charts (A)–(C): E or �E < 0 (red), = 0 (white), > 0(blue); optimum � angles inyellow; excluded data points in gray.
bonding cannot be obtained at any � (tested full circle at20� increments). These results are broadly consistent withsimilar results from previous analyses of tolerable mispo-sitioning errors reported elsewhere.1926
3.6. Optimal Tooltip Trajectories
3.6.1. Single-Setting Optimal Trajectories
Perhaps the simplest method for selecting an optimalapproach trajectory for Reaction I is to choose a single(�, �� trajectory that continuously maintains an acceptablylow net reaction energy throughout the entire approach,starting from infinite separation between tool and work-piece and concluding with Ge35–C12 bond formation atR = 4�35 Å. The objective is to allow tool and work-piece to be positioned in the energy landscape on a val-ley floor of acceptable depth but maximum width which
will permit successful consummation of Reaction I evenin situations where tooltip placement error may be signif-icant, e.g., the (�, �, �� = �+40�, +70�, +40�� approachtrajectory described in Section 3.2 (Fig. 5). This methodprovides a safe and adequate approach trajectory that min-imizes demands on the reliability of an experimental posi-tional control system, since the controls can be set onceat the start of the reaction and held constant through itsconclusion.A more systematic method for generating a general
range of workable single-setting trajectories starts with thetwo PES charts for R = 4�85 Å and R = 4�35 Å fromFigure 3, which represent the “before” and “after” cases ofH28 and C11–C12 movement during tooltip approach—the key mechanical events of Reaction I. The intersec-tion of all exoergic points simultaneously present on bothPES surfaces yields a large subset of acceptable approachtrajectories (Fig. 10). The 10 best (�, �� trajectories (as
J. Comput. Theor. Nanosci. 7, 1–29, 2010 11
REVIEW
Optimal Tooltip Trajectories in a Hydrogen Abstraction Tool Recharge Reaction Sequence Tarasov et al.
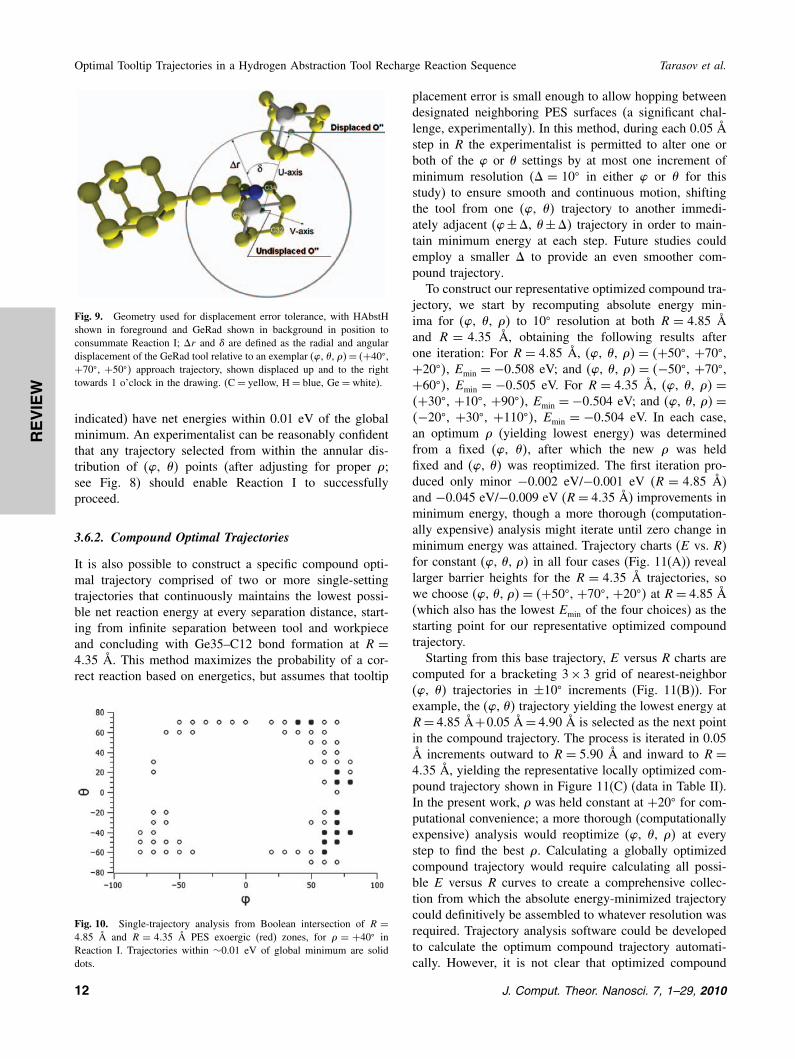
Fig. 9. Geometry used for displacement error tolerance, with HAbstHshown in foreground and GeRad shown in background in position toconsummate Reaction I; �r and � are defined as the radial and angulardisplacement of the GeRad tool relative to an exemplar (�, �, ��= �+40�,+70�, +50�� approach trajectory, shown displaced up and to the righttowards 1 o’clock in the drawing. (C= yellow, H= blue, Ge= white).
indicated) have net energies within 0.01 eV of the globalminimum. An experimentalist can be reasonably confidentthat any trajectory selected from within the annular dis-tribution of (�, �� points (after adjusting for proper �;see Fig. 8) should enable Reaction I to successfullyproceed.
3.6.2. Compound Optimal Trajectories
It is also possible to construct a specific compound opti-mal trajectory comprised of two or more single-settingtrajectories that continuously maintains the lowest possi-ble net reaction energy at every separation distance, start-ing from infinite separation between tool and workpieceand concluding with Ge35–C12 bond formation at R =4�35 Å. This method maximizes the probability of a cor-rect reaction based on energetics, but assumes that tooltip
Fig. 10. Single-trajectory analysis from Boolean intersection of R =4�85 Å and R = 4�35 Å PES exoergic (red) zones, for � = +40� inReaction I. Trajectories within ∼0.01 eV of global minimum are soliddots.
placement error is small enough to allow hopping betweendesignated neighboring PES surfaces (a significant chal-lenge, experimentally). In this method, during each 0.05 Åstep in R the experimentalist is permitted to alter one orboth of the � or � settings by at most one increment ofminimum resolution (� = 10� in either � or � for thisstudy) to ensure smooth and continuous motion, shiftingthe tool from one (�, �� trajectory to another immedi-ately adjacent (�±�, �±�� trajectory in order to main-tain minimum energy at each step. Future studies couldemploy a smaller � to provide an even smoother com-pound trajectory.To construct our representative optimized compound tra-
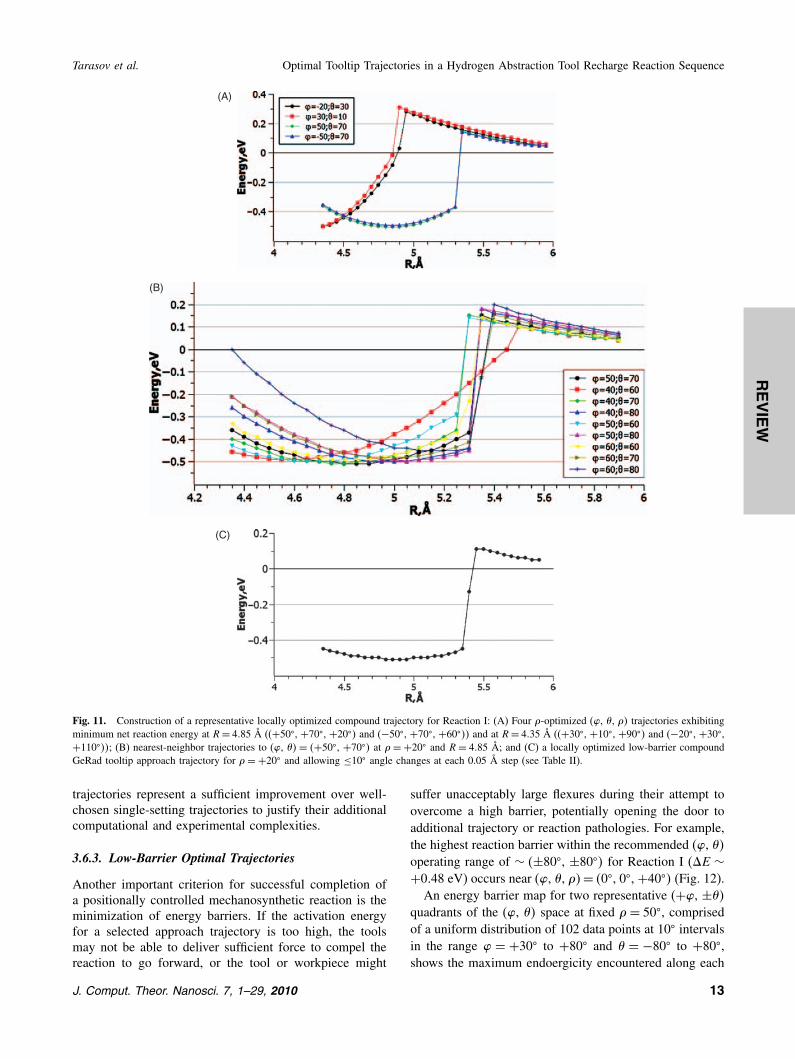
jectory, we start by recomputing absolute energy min-ima for (�, �, �� to 10� resolution at both R = 4�85 Åand R = 4�35 Å, obtaining the following results afterone iteration: For R = 4�85 Å, (�, �, �� = �+50�, +70�,+20��, Emin = −0�508 eV; and (�, �, �� = �−50�, +70�,+60��, Emin = −0�505 eV. For R = 4�35 Å, (�, �, �� =�+30�, +10�, +90��, Emin = −0�504 eV; and (�, �, �� =�−20�, +30�, +110��, Emin = −0�504 eV. In each case,an optimum � (yielding lowest energy) was determinedfrom a fixed (�, ��, after which the new � was heldfixed and (�, �� was reoptimized. The first iteration pro-duced only minor −0.002 eV/−0.001 eV (R = 4�85 Å)and −0.045 eV/−0.009 eV (R= 4�35 Å) improvements inminimum energy, though a more thorough (computation-ally expensive) analysis might iterate until zero change inminimum energy was attained. Trajectory charts (E vs. R)for constant (�, �, �� in all four cases (Fig. 11(A)) reveallarger barrier heights for the R = 4�35 Å trajectories, sowe choose (�, �, ��= �+50�, +70�, +20�� at R= 4�85 Å(which also has the lowest Emin of the four choices) as thestarting point for our representative optimized compoundtrajectory.Starting from this base trajectory, E versus R charts are
computed for a bracketing 3× 3 grid of nearest-neighbor(�, �� trajectories in ±10� increments (Fig. 11(B)). Forexample, the (�, �� trajectory yielding the lowest energy atR= 4�85 Å+0.05 Å= 4�90 Å is selected as the next pointin the compound trajectory. The process is iterated in 0.05Å increments outward to R = 5�90 Å and inward to R =4�35 Å, yielding the representative locally optimized com-pound trajectory shown in Figure 11(C) (data in Table II).In the present work, � was held constant at +20� for com-putational convenience; a more thorough (computationallyexpensive) analysis would reoptimize (�, �, �� at everystep to find the best �. Calculating a globally optimizedcompound trajectory would require calculating all possi-ble E versus R curves to create a comprehensive collec-tion from which the absolute energy-minimized trajectorycould definitively be assembled to whatever resolution wasrequired. Trajectory analysis software could be developedto calculate the optimum compound trajectory automati-cally. However, it is not clear that optimized compound
12 J. Comput. Theor. Nanosci. 7, 1–29, 2010
REVIEW
Tarasov et al. Optimal Tooltip Trajectories in a Hydrogen Abstraction Tool Recharge Reaction Sequence
(A)
(B)
(C)
Fig. 11. Construction of a representative locally optimized compound trajectory for Reaction I: (A) Four �-optimized (�, �, �� trajectories exhibitingminimum net reaction energy at R= 4�85 Å ((+50�, +70�, +20�� and (−50�, +70�, +60��� and at R= 4�35 Å ((+30�, +10�, +90�� and (−20�, +30�,+110���; (B) nearest-neighbor trajectories to (�, ��= �+50�, +70�� at �=+20� and R= 4�85 Å; and (C) a locally optimized low-barrier compoundGeRad tooltip approach trajectory for �=+20� and allowing ≤10� angle changes at each 0.05 Å step (see Table II).
trajectories represent a sufficient improvement over well-chosen single-setting trajectories to justify their additionalcomputational and experimental complexities.
3.6.3. Low-Barrier Optimal Trajectories
Another important criterion for successful completion ofa positionally controlled mechanosynthetic reaction is theminimization of energy barriers. If the activation energyfor a selected approach trajectory is too high, the toolsmay not be able to deliver sufficient force to compel thereaction to go forward, or the tool or workpiece might
suffer unacceptably large flexures during their attempt toovercome a high barrier, potentially opening the door toadditional trajectory or reaction pathologies. For example,the highest reaction barrier within the recommended (�, ��operating range of ∼ �±80�, ±80�� for Reaction I (�E ∼+0�48 eV) occurs near (�, �, ��= �0�, 0�, +40�� (Fig. 12).An energy barrier map for two representative (+�, ±��
quadrants of the (�, �� space at fixed �= 50�, comprisedof a uniform distribution of 102 data points at 10� intervalsin the range � = +30� to +80� and � = −80� to +80�,shows the maximum endoergicity encountered along each
J. Comput. Theor. Nanosci. 7, 1–29, 2010 13

REVIEW
Optimal Tooltip Trajectories in a Hydrogen Abstraction Tool Recharge Reaction Sequence Tarasov et al.
Table II. Representative locally-optimized compound trajectory for Reaction I, with �=+20� and allowing ≤ 10� angle changes at each 0.05 Å step.
R (Å) � � E (eV) R (Å) � � E (eV) R (Å) � � E (eV)
5.90 +40� +60� +0.041 5.35 +60� +70� −0.134 4.80 +50� +70� −0.5075.85 +40� +60� +0.046 5.30 +50� +80� −0.453 4.75 +40� +70� −0.5065.80 +50� +60� +0.052 5.25 +50� +80� −0.468 4.70 +40� +70� −0.5035.75 +40� +60� +0.058 5.20 +50� +80� −0.480 4.65 +50� +60� −0.5005.70 +40� +60� +0.065 5.15 +50� +80� −0.488 4.60 +50� +60� −0.4975.65 +40� +60� +0.072 5.10 +40� +80� −0.493 4.55 +40� +60� −0.4915.60 +40� +60� +0.079 5.05 +40� +80� −0.498 4.50 +40� +60� −0.4875.55 +40� +60� +0.087 5.00 +40� +80� −0.500 4.45 +40� +60� −0.4795.50 +40� +60� +0.096 4.95 +50� +70� −0.500 4.40 +40� +60� −0.4695.45 +50� +60� +0.110 4.90 +50� +70� −0.505 4.35 +40� +60� −0.4565.40 +50� +70� +0.112 4.85 +50� +70� −0.508
approach trajectory (Fig. 13). The peak energy barriersoccur at a variety of separation distances R (not shown),and range from a minimum of +0.102 eV at (�, �� =�+50�, +60�� to a high of +0.30 eV at (�, ��= �+30�, 0��approaching the “hydrogen hill” at the leftmost edge of thechart, with the maximum barrier of +0.48 eV at (�, ��=�0�, 0�� not directly visible on the chart. The single-setting(�, �, �� = �+50�, +70�, +20�� approach trajectory liesin a favorable region of the energy barrier map, and otheroptimal trajectories computed using methods described inSections 3.6.1 and 3.6.2 might be enhanced by selectingneighboring paths possessing reduced barrier heights.The barrier-driven flexure through an angle of the
tip of the C–C≡C group away from linear configu-ration as the GeRad tooltip approaches C12 can becrudely estimated from the standard bond-bending term inmolecular mechanics: Ebend = 1/2kbend (–eq�
2 (1+ksextic(–eq�
4�, where kbend is the angle-bending force constant,eq is the equilibrium bond angle, and ksextic = 0�754 rad−4
for C–C bonds in MM2. Data from a published8 bendingpotential chart for the adamantane-handled (C9H15�C–C≡Csystem (the HAbst tooltip) gives kbend ∼ 370 zJ/rad2, hencesurmounting a ∼0.14 eV barrier on the (�, �, ��= �+50�,+70�, +20�� approach trajectory should produce a max-imum flexure (immediately prior to Ge35–C12 bond for-mation) of ∼ 20�, or ∼0.9 Å deflection at the endof a 2.66 Å C–C≡C lever arm requiring a very modest0.25 nN of mechanical force to overcome. This estimate
Fig. 12. PES for Reaction I as a function of tooltip separation distancesR using the highest-barrier (�E∼ +0.48 eV) approach trajectory at (�, �,��= �0�, 0�, +40��.
is consistent with the ∼0.4 Å prebonding ethynyl repul-sion displacement computationally predicted for the O′′-C12 distance as GeRad approaches (shaded area, Fig. 14),given that no prebonding compression is evident in O′′-Ge35 but that some portion of the total compression energyis likely partitioned into each of the two tools.
3.6.4. Other Optimal Trajectories
Figure 8(B) indicates another possible optimal trajec-tory criterion—minimum � angle impact on net reactionenergy—that yields specific approach trajectories at R =4�85 Å such as (�, ��= �+80�, 0�� which is both very exo-ergic and maximally insensitive to � angle setting, perhaps
Fig. 13. Energy barrier map for Reaction I (endoergic = blue,exoergic= red, energy in eV) as a function of tooltip positional angles �and �. Minimum barrier height occurs at various tooltip separation dis-tances R depending on value of � and �, taking GeRad rotational angle�=+50�, with lowest energy value +0.102 eV at (�, ��= �+50�, +60��where the guidelines intersect.
14 J. Comput. Theor. Nanosci. 7, 1–29, 2010

REVIEW
Tarasov et al. Optimal Tooltip Trajectories in a Hydrogen Abstraction Tool Recharge Reaction Sequence
O”-C12 distance O”-Ge35 distance
Fig. 14. Deflection of C12 at ethynyl tip of HAbstH and partial extrusion of Ge35 during Ge35–C12 bonding event along (�, �, ��= �+50�, +70�,+20�� approach trajectory in Reaction I, as GeRad travels from R= 6�60 Å to 4.35 Å.
ideal in situations where the experimentalist finds � diffi-cult or impossible to control. Other specialized trajectorycriteria may be investigated in future work.
4. REACTION II: ABSTRACT APICAL HFROM HAbstH USING GeRad2 TOOL
In Reaction II of the HAbst recharge reaction sequenceRS5 (Fig. 1), a second GeRad tool (“GeRad2”) is broughtup to the transactional hydrogen atom (H28), and at someseparation distance H28 jumps to the incoming GeRad2tool, having been abstracted away from the tip of theHAbstH tool. This allows the C11–C12 bond order toincrease from 2 to 3, causing the carbon dimer to seek toresume linearity relative to the adamantane central axis,and eliminates the open radical site on the carbon atomproximal to the HAbstH base structure that was createdduring Reaction I. The hydrogenated GeRad2-H tool maythen be withdrawn from the system along any noncolli-sional trajectory, the choice of which is noncritical (and isnot examined further in the present work) because thereare no remaining open radicals in the system and so alltooltips are in an inert condition. The GeRad2-H tooltip issubsequently restored to an active GeRad2 tooltip using aseparate recharge reaction sequence7 specific to that tool,e.g., contacting the GeRad2-H to a depassivated flat bulkdiamond surface, causing the H to donate to the surface.After defining the tooltip geometry and coordinate sys-
tem for Reaction II (Section 4.1) we calculate the reactionPES (potential energy surface) as a function of positionalangles �H and �H (Section 4.2), describe the trajectory-related pathologies (Section 4.3), calculate the reactionPES as a function of rotational angle �H of the incom-ing GeRad2 tool (Section 4.4), estimate the tolerancefor lateral displacement error in tooltip positioning forReaction II (Section 4.5), then recommend some optimalGeRad2 tooltip trajectories for this reaction (Section 4.6).
4.1. Tooltip Geometry and Coordinate System
A positionally unconstrained single-cage-handle HAbstH-GeRad complex (as created in Reaction I) has two sta-ble minimum-energy configurations—a “cis” form withthe H28 atom and the radical site on the same sideof the ethynyl C≡C dimer, and a “trans” form withH28 and the radical site on opposite sides of the C≡Cdimer (Fig. 15). We confirm earlier work7 reporting thatthe unconstrained “trans” form is −0.12 eV lower inenergy than the unconstrained “cis” form. However, in amechanosynthetic apparatus the two handles comprisingthis structure are not unconstrained, but rather are contin-uously positionally controlled. Using positional control, amechanical barrier can be imposed that forces the struc-ture to adopt or to retain either configuration since bothare stable stationary states with no imaginary frequencies.In the present work, as in previous work,7 we presume thatpositional control is employed to establish and maintainthe system in the slightly higher energy “cis” state becausethis configuration provides greater steric accessibility toH28 by the incoming GeRad2 tooltip.We start by assuming that the displacement distance
R producing the lowest energy on the optimal trajectoryrepresents the endpoint of Reaction I, and hence consti-tutes the starting point for Reaction II. Hence the tooltipgeometry and coordinate system for Reaction II is basedon the minimum energy configuration for HAbstH-GeRadin “cis” geometry at (�, �, ��= �+50�, +70�, +20�� andR= 4�85 Å (Fig. 16). Structural data for this initial geom-etry are as follows: A(C1–C11–C12) = +151�059 deg,C1–C11–C12–H28 dihedral = +179�775 deg, A(Ge35–C12–C11) = +129�257 deg, A(Ge35–C12–H28) =+112�258 deg, and R(Ge35–C12) = 1�984 Å. The firstcoordinate origin OH is defined as the equilibrium startingposition of H28 with GeRad2 removed to infinite distance.The positive XH axis originates at OH and points in thedirection from the starting position of C12 to OH. The
J. Comput. Theor. Nanosci. 7, 1–29, 2010 15

REVIEW
Optimal Tooltip Trajectories in a Hydrogen Abstraction Tool Recharge Reaction Sequence Tarasov et al.
“Cis” Configuration
A (Ge35–C12–C11) = +127.820 deg
A (C1–C11–C12) = +141.661 deg
A (Ge35–C12–H28) = +112.514 deg
A (H28–C12–C11) = +119.664 deg
R (Ge35–C12) = 1.96636 Å
∆E = –0.45 eV
“Trans” Configuration
A (Ge35–C12–C11) = +123.158 deg
A (C1–C11–C12) = +140.580 deg
A (Ge35–C12–H28) = +116.034 deg
A (H28–C12–C11) = +120.808 deg
R (Ge35–C12) = 1.95947 Å
∆E = –0.57 eV
Fig. 15. Unconstrained single-cage-handle HAbstH-GeRad structure at Reaction I completion has two stable minimum-energy configurations. (C =yellow, H= blue, Ge= white).
YH axis originates at OH, lies perpendicular to the XH
axis and in the plane containing the starting positions ofatoms C1, C11, C12 and Ge35, and points away fromthe GeRad tooltip containing Ge35. The ZH axis alsooriginates at OH and lies perpendicular to XH and YH axesfollowing the right-hand rule. The approaching GeRad2tool is initially oriented relative to the HAbstH-GeRadworkpiece such that a line extending backwards throughOH and Ge65 perpendicularly penetrates the plane definedby the 3 fixed GeRad2 tool base carbon atoms (C59, C66,and C74), intersecting a second origin O′
H which lies inthe C59/C66/C74 plane and is equidistant from C59, C66and C74, analogous to origins O and O′′.In this spherical coordinate system, �H is defined as the
angle from the XH axis to the YH axis of the projection ofthe vector pointing from OH to O′
H onto the XHYH plane.Note that +�H is defined as rotation toward the −YH axisin the arrow direction for consistency with prior usage inReaction I. �H is defined as the angle from the XHYH planeto the vector pointing from OH to O′
H, with −90� ≤ �H ≤+90� and −180� ≤ �H ≤ +180�. Radial distance RH isdefined as the distance between origins OH and O′
H. Therotational state of HAbstH-GeRad is completely specifiedby (�, �, ��= �+50�, +70�, +20��. The rotational state ofGeRad2, specified by �H, is measured as the angle takenfrom the O′
H-to-C59 vector to the YH-axis vector whenGeRad2 is virtually repositioned to (�H, �H� = �0�, 0��placing both O′
H and Ge65 on the XH axis, with +�H takenin the counterclockwise direction as viewed from O′
H look-ing toward OH. Thus, rotation to +�H becomes equivalentto rotation to −�H at �H =+90�, or to +�H at �H =−90�,consistent with prior usage in Reaction I. The positioningof GeRad2 is controlled by constraining atoms C59, C66,and C74 in the GeRad2 handle base.
4.2. PES as a Function of Positional Angles�H and �H
Since well-separated HAbstH-GeRad and GeRad2 eachhave one unpaired electron, the system of workpiece+tooltip can have singlet or triplet multiplicity. The PES asa function of workpiece-tooltip separation distance RH forthe ideal (�H, �H, �H� = �0�, 0�, 0�� approach trajectory(Fig. 17) shows that the system remains in the unbondedlower-energy triplet state down to RH = 5�90 Å (with Ge65roughly 3.05 Å away from H28), but at RH = 5�80 Å (orcloser) the singlet state has lower energy and the Ge65–H28 bond has formed, indicating a successful abstractionof the hydrogen atom. Figure 17 indicates that the abstrac-tion reaction may be barrierless, consistent with similarresults previously reported elsewhere.78
The PES for the Ge65–H28 abstraction reaction as afunction of positional angles �H and �H is shown inFigure 18 for displacement distance RH = 5�80 Å and�H = 0�, compiled from a total of 343 underlying datapoints at 10� intervals. The PES is uniformly flat andhighly exoergic across a ±40� ×±80� region centered on(�H, �H�= �0�, 0��, with net reaction energies approximat-ing −1.50 eV over most of this space but rising no higherthan −0.75 eV even at the periphery. (The computed abso-lute minimum energy of −1.576 eV actually occurs at(�H, �H� = �0�, +10�� but this is only −0.004 eV belowthe value at the assumed ideal (�H, �H� = �0�, 0�� set-ting, well below the accuracy of the computational methodused.) High endoergic mountains are beginning to appearat �H ≥ +50� on the right side of the chart (approach-ing Ge35) and also at �H ≤ −90� on the left side of thechart (approaching C11–C1) due to rapidly rising stericrepulsion between closely proximated HAbstH-GeRad and
16 J. Comput. Theor. Nanosci. 7, 1–29, 2010

REVIEW
Tarasov et al. Optimal Tooltip Trajectories in a Hydrogen Abstraction Tool Recharge Reaction Sequence
Fig. 16. Coordinate systems for Reaction II: Positionally controlled reactant tooltips prior to reaction, defining phiH (�H� and thetaH (�H� (top image),and definition of tooltip axial rotation angle rhoH (�H� (bottom image). (C= yellow, H= blue, Ge= white).
Fig. 17. Singlet and triplet PES as a function of RH for the ideal (�H,�H, �H�= �0�, 0�, 0�� approach trajectory for Reaction II.
Fig. 18. Singlet PES for Reaction II (endoergic= blue, exoergic= red,excluded= gray) at tooltip separation distance RH = 5�80 Å for approachtrajectories in the range (�H, �H, �H�= �±180�, ±90�, 0��.
J. Comput. Theor. Nanosci. 7, 1–29, 2010 17
REVIEW
Optimal Tooltip Trajectories in a Hydrogen Abstraction Tool Recharge Reaction Sequence Tarasov et al.
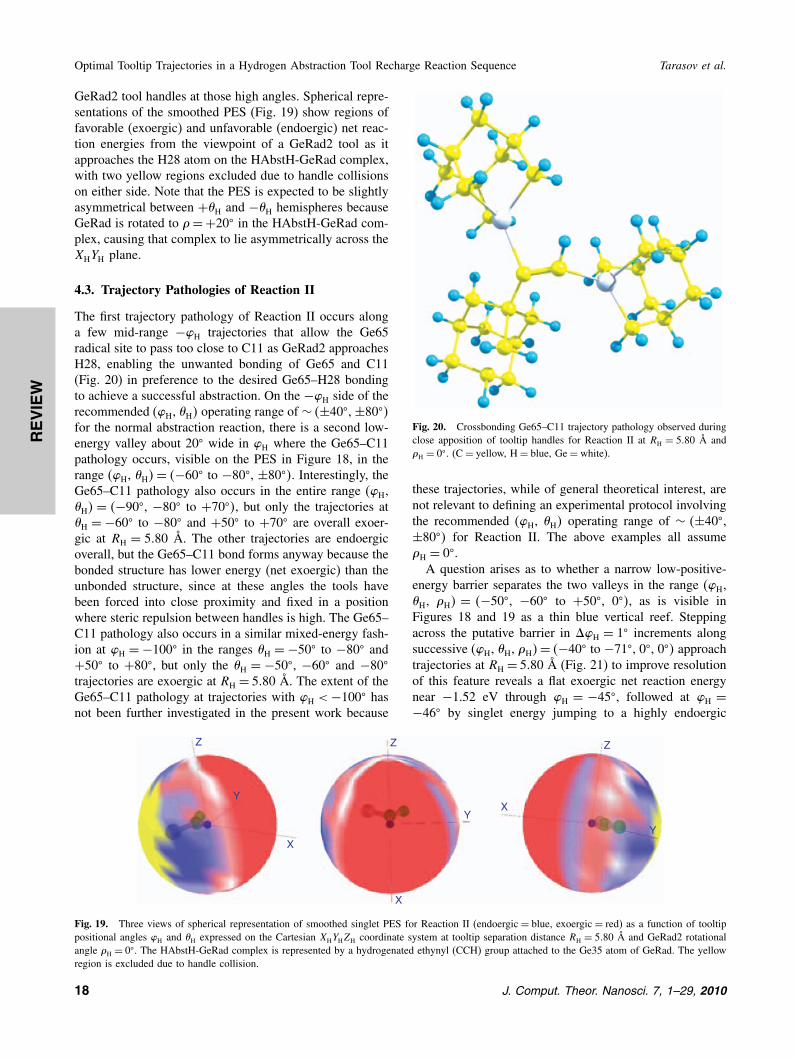
GeRad2 tool handles at those high angles. Spherical repre-sentations of the smoothed PES (Fig. 19) show regions offavorable (exoergic) and unfavorable (endoergic) net reac-tion energies from the viewpoint of a GeRad2 tool as itapproaches the H28 atom on the HAbstH-GeRad complex,with two yellow regions excluded due to handle collisionson either side. Note that the PES is expected to be slightlyasymmetrical between +�H and −�H hemispheres becauseGeRad is rotated to �=+20� in the HAbstH-GeRad com-plex, causing that complex to lie asymmetrically across theXHYH plane.
4.3. Trajectory Pathologies of Reaction II
The first trajectory pathology of Reaction II occurs alonga few mid-range −�H trajectories that allow the Ge65radical site to pass too close to C11 as GeRad2 approachesH28, enabling the unwanted bonding of Ge65 and C11(Fig. 20) in preference to the desired Ge65–H28 bondingto achieve a successful abstraction. On the −�H side of therecommended (�H, �H� operating range of ∼ �±40�, ±80��for the normal abstraction reaction, there is a second low-energy valley about 20� wide in �H where the Ge65–C11pathology occurs, visible on the PES in Figure 18, in therange (�H, �H�= �−60� to −80�, ±80��. Interestingly, theGe65–C11 pathology also occurs in the entire range (�H,�H� = �−90�, −80� to +70��, but only the trajectories at�H = −60� to −80� and +50� to +70� are overall exoer-gic at RH = 5�80 Å. The other trajectories are endoergicoverall, but the Ge65–C11 bond forms anyway because thebonded structure has lower energy (net exoergic) than theunbonded structure, since at these angles the tools havebeen forced into close proximity and fixed in a positionwhere steric repulsion between handles is high. The Ge65–C11 pathology also occurs in a similar mixed-energy fash-ion at �H = −100� in the ranges �H = −50� to −80� and+50� to +80�, but only the �H = −50�, −60� and −80�
trajectories are exoergic at RH = 5�80 Å. The extent of theGe65–C11 pathology at trajectories with �H <−100� hasnot been further investigated in the present work because
Z
Y
X
Z
X
Z
Y
Y
X
Fig. 19. Three views of spherical representation of smoothed singlet PES for Reaction II (endoergic= blue, exoergic= red) as a function of tooltippositional angles �H and �H expressed on the Cartesian XHYHZH coordinate system at tooltip separation distance RH = 5�80 Å and GeRad2 rotationalangle �H = 0�. The HAbstH-GeRad complex is represented by a hydrogenated ethynyl (CCH) group attached to the Ge35 atom of GeRad. The yellowregion is excluded due to handle collision.
Fig. 20. Crossbonding Ge65–C11 trajectory pathology observed duringclose apposition of tooltip handles for Reaction II at RH = 5�80 Å and�H = 0�. (C= yellow, H= blue, Ge= white).
these trajectories, while of general theoretical interest, arenot relevant to defining an experimental protocol involvingthe recommended (�H, �H� operating range of ∼ �±40�,±80�� for Reaction II. The above examples all assume�H = 0�.A question arises as to whether a narrow low-positive-
energy barrier separates the two valleys in the range (�H,�H, �H� = �−50�, −60� to +50�, 0��, as is visible inFigures 18 and 19 as a thin blue vertical reef. Steppingacross the putative barrier in ��H = 1� increments alongsuccessive (�H, �H, �H�= �−40� to −71�, 0�, 0�� approachtrajectories at RH = 5�80 Å (Fig. 21) to improve resolutionof this feature reveals a flat exoergic net reaction energynear −1.52 eV through �H = −45�, followed at �H =−46� by singlet energy jumping to a highly endoergic
18 J. Comput. Theor. Nanosci. 7, 1–29, 2010

REVIEW
Tarasov et al. Optimal Tooltip Trajectories in a Hydrogen Abstraction Tool Recharge Reaction Sequence
Fig. 21. Singlet and triplet PES as a function of �H for a (�H, �H�= �0�,0�� approach trajectory at RH = 5�80 Å for Reaction II (left ordinate),and Ge65–C11 distance (right ordinate), for −71� ≤ �H ≤− 40� in thesinglet case; singlet �H = 45� approach trajectory is also shown.
+0.55 eV, well above the +0.01 eV for triplet, coincidingwith failure of the normal Ge65–H28 abstraction reac-tion. Singlet energy again retreats below triplet only at�H ≤ −54�, indicating the potential onset of Ge65–C11pathological bonding as previously discussed: in the sin-glet mode, significant prebonding movement of atomsGe65 and C11 occurs at �H =−46�, but their interatomicseparation stays well above the equilibrium Ge–C bondlength (according to MM2 parameter set)27 of r0 = 1�95 Åuntil �H ∼ −61� when the separation falls to ∼2.32 Å,the approximate maximum length of a stretched Ge–Cbond—and below which distance a stable Ge65–C11 bondcan be said to have formed via an apparently barrier-less radical–radical coupling misreaction. (Calculating theMorse parameter � = �ks/2De�
1/2 = 1�86× 1010 m−1 bytaking Ge–C bond stiffness27 ks = 270 N/m and Ge–Cpotential well depth28 De = 2�44 eV, a Ge–C bond becomes
Singlet Triplet
Fig. 22. Possible Ge65–Ge35 bonding pathology observed for trajectory (�H, �H, �H�= �+90�, −90�, 0�� at RH = 5�80 Å for Reaction II. (C= yellow,H= blue, Ge= white).
mechanically unstable5 when stretched past the inflectionpoint at r = r0 + ln�2�/� = 2�32 Å.) However, the sys-tem must lie in the near-equiergic triplet state between�H = −46� to −53� because the singlet energy is muchhigher, hence there is apparently no significant energy bar-rier blocking entrance to the Ge65–C11 pathology fromthis direction. Rotating the incoming tool to �H = 45� doesnot significantly alter the endoergic “reef” structure.Minor features evident in the second valley visible in
Figure 18 are mostly attributable to the atomic granular-ity of approaching handle atoms. For example, at (�H, �H,�H� = �−80�, −30�, 0�� atom C55 on the GeRad2 han-dle is forced to within 2.59 Å of atom C8 on the HAbsthandle, producing a large endoergicity for the Ge65–C11pathology, whereas at (�H, �H, �H� = �−80�, +30�, 0��handle atoms C55 and C8 remain 3.45 Å apart, yieldingan exoergic Ge65–C11 pathology.A second possible trajectory pathology of Reaction II
was predicted for the �H = −90� case in which structureoptimization in the singlet state leads to partial Ge65–Ge35 bonding (Fig. 22) with a computed separation dis-tance of ∼2.77 Å (vs. ∼3.93 Å in the triplet state). Thiswould represent a highly stretched but fully formed Ge–Ge bond, since the Morse parameter � = �ks/2De�
1/2 =1�6×10¹⁰ m−1 taking Ge–Ge bond stiffness ks ∼160 N/m(est.)27 and Ge–C potential well depth De = 1�95 eV,29 thenr = r0 + ln�2�/� = 2�84 Å given an equilibrium Ge–Gebond length of r0 = 2�41 Å.29 While typical singlet reac-tion energies are about +0.3 eV (slightly endoergic) andtriplet energies are lower, the competing desired Ge65–H28 abstraction reaction apparently fails to occur in thesecases. These results may be artifactual due to failure of theoptimization algorithm to locate the actual minimum of the
J. Comput. Theor. Nanosci. 7, 1–29, 2010 19

REVIEW
Optimal Tooltip Trajectories in a Hydrogen Abstraction Tool Recharge Reaction Sequence Tarasov et al.
H28 abstraction reaction so that the optimization falls intoa local minimum. Further details of this possible pathol-ogy have not been investigated in the present work becausethese trajectories lie outside the recommended (�H, �H�operating range of ∼ �±40�, ±80�� for Reaction II.A third class of trajectory pathologies involving
unwanted high-energy covalent bond formation betweenHAbstH-GeRad and GeRad2 tool handles during trajecto-ries involving close handle–handle proximity is possiblebut was not investigated in the present work because thesetrajectories also lie well outside the recommended (�H, �H�operating range of ∼ �±40�, ±80�� for Reaction II.
4.4. PES as a Function of Rotational Angle �H
Figure 23 shows the effects of GeRad2 tooltip rotationalangle �H on the 1-dimensional PES for Reaction II. At(�H, �H� = �0�, 0�� for RH = 5�80 Å, the PES has negli-gible variation (0.0042 eV) with changing �H and there isno apparent effect on this PES if ��H� is increased to 60�
at �H = 0�, +30�, or −30�. Due to the threefold symmetryof the GeRad2 tooltip, there are three critical values for�H (0�, 120� and 240�� that produce minimum net reac-tion energy. These critical values, as well as the shape ofthe PES, apparently do not vary significantly with �H atworkable values of �H. Within the recommended (�H, �H�range of ∼ �±40�, ±80�� for Reaction II, the variation innew reaction energy as a function of �H increases veryslowly with �H, reaching only �E�H = 0�20 eV by (�H,�H�= �+30�, 0��, 0.005 eV by (�H, �H�= �+30�, +60��,and 0.032 eV by (�H, �H�= �−30�, −60�� near the edgesof the operating envelope. At higher �H, energy variationincreases rapidly to �E�H = 2�30 eV by (�H, �H�= �+40�,0�� at the outermost edge of the recommended range, withthe desired H28 abstraction reaction now endoergic andfailing to occur at most values of �H. Besides becom-ing taller, the PES grows more symmetrical and wider atthe higher-energy peaks with the lower-energy valleys get-ting more sharply defined and narrower at larger �H. Most
Fig. 23. PES for Reaction II as a function of tooltip rotational angle �H, for RH = 5�80 Å at various combinations of �H and �H.
importantly, the three critical values for �H that produceminimum net reaction energy and ensure desired reactionexoergicity apparently do not vary with �H at workablevalues of �H. Thus by operating at or near these three crit-ical values (�H = 0�, 120�, and 240��, the experimentalistcan be assured of optimal reaction exoergicity through-out the entire recommended (�H, �H� working range of∼ �±40�, ±80�� for Reaction II.
4.5. Lateral Displacement Error Tolerance
To determine the maximum tolerable lateral misplacementerror of GeRad2 that will still result in a successful con-summation of Reaction II, we start by defining the UH-axisas a vector pointing from O′
H to C59 and the VH-axis (notshown) as a vector originating at O′
H and perpendicularto UH that points parallel and codirectional with a vectorfrom C66 to C74 (Fig. 24). We can then examine whetherthe Ge65–H28 bond still forms when GeRad2 is transla-tionally displaced within the UHVH plane away from itsintended position at any point within a particular approachtrajectory. The present work analyzes a representative reac-tion point (RH = 5�80 Å) along a single exemplar approachtrajectory: (�H, �H, �H�= �0�, 0�, 0��. The lateral displace-ment of GeRad2 from its intended trajectory is reportedas a displacement angle �H measured from UH and a dis-placement radial distance �rH measured from O′
H.Simulations began by examining small �rH, moving to
bigger �rH, simulating progressively larger displacementerror circles. At some �rH we would expect to find thatGe65 and H28 are too far apart to form the desired bondto consummate the abstraction. With GeRad2 positionedat RH = 5�80 Å, where tooltip and workpiece are just nearenough for the H28 abstraction to begin to occur, reac-tion failure first occurs at �rH = 0�5 Å but only for �H =150�–210�. At �rH = 0�6 Å the failure occurs at a greaterrange of �H; by �rH ≥ 0�7 Å, failure occurs at all angles�H = 0�–360� tested full circle at 30� increments. Thiserror tolerance is slightly less generous than the 0.5 Å
20 J. Comput. Theor. Nanosci. 7, 1–29, 2010
REVIEW
Tarasov et al. Optimal Tooltip Trajectories in a Hydrogen Abstraction Tool Recharge Reaction Sequence
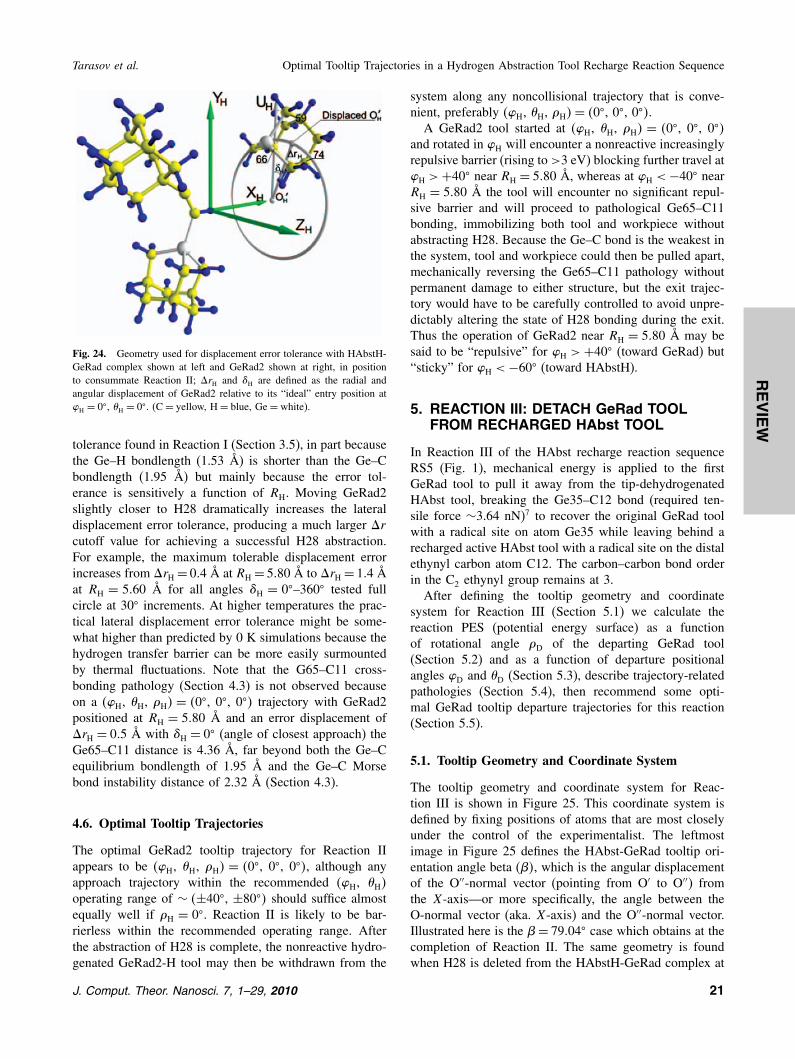
Fig. 24. Geometry used for displacement error tolerance with HAbstH-GeRad complex shown at left and GeRad2 shown at right, in positionto consummate Reaction II; �rH and �H are defined as the radial andangular displacement of GeRad2 relative to its “ideal” entry position at�H = 0�, �H = 0�. (C= yellow, H= blue, Ge= white).
tolerance found in Reaction I (Section 3.5), in part becausethe Ge–H bondlength (1.53 Å) is shorter than the Ge–Cbondlength (1.95 Å) but mainly because the error tol-erance is sensitively a function of RH. Moving GeRad2slightly closer to H28 dramatically increases the lateraldisplacement error tolerance, producing a much larger �rcutoff value for achieving a successful H28 abstraction.For example, the maximum tolerable displacement errorincreases from �rH = 0�4 Å at RH = 5�80 Å to �rH = 1�4 Åat RH = 5�60 Å for all angles �H = 0�–360� tested fullcircle at 30� increments. At higher temperatures the prac-tical lateral displacement error tolerance might be some-what higher than predicted by 0 K simulations because thehydrogen transfer barrier can be more easily surmountedby thermal fluctuations. Note that the G65–C11 cross-bonding pathology (Section 4.3) is not observed becauseon a (�H, �H, �H� = �0�, 0�, 0�� trajectory with GeRad2positioned at RH = 5�80 Å and an error displacement of�rH = 0�5 Å with �H = 0� (angle of closest approach) theGe65–C11 distance is 4.36 Å, far beyond both the Ge–Cequilibrium bondlength of 1.95 Å and the Ge–C Morsebond instability distance of 2.32 Å (Section 4.3).
4.6. Optimal Tooltip Trajectories
The optimal GeRad2 tooltip trajectory for Reaction IIappears to be (�H, �H, �H� = �0�, 0�, 0��, although anyapproach trajectory within the recommended (�H, �H�operating range of ∼ �±40�, ±80�� should suffice almostequally well if �H = 0�. Reaction II is likely to be bar-rierless within the recommended operating range. Afterthe abstraction of H28 is complete, the nonreactive hydro-genated GeRad2-H tool may then be withdrawn from the
system along any noncollisional trajectory that is conve-nient, preferably (�H, �H, �H�= �0�, 0�, 0��.
A GeRad2 tool started at (�H, �H, �H� = �0�, 0�, 0��and rotated in �H will encounter a nonreactive increasinglyrepulsive barrier (rising to>3 eV) blocking further travel at�H >+40� near RH = 5�80 Å, whereas at �H <−40� nearRH = 5�80 Å the tool will encounter no significant repul-sive barrier and will proceed to pathological Ge65–C11bonding, immobilizing both tool and workpiece withoutabstracting H28. Because the Ge–C bond is the weakest inthe system, tool and workpiece could then be pulled apart,mechanically reversing the Ge65–C11 pathology withoutpermanent damage to either structure, but the exit trajec-tory would have to be carefully controlled to avoid unpre-dictably altering the state of H28 bonding during the exit.Thus the operation of GeRad2 near RH = 5�80 Å may besaid to be “repulsive” for �H > +40� (toward GeRad) but“sticky” for �H <−60� (toward HAbstH).
5. REACTION III: DETACH GeRad TOOLFROM RECHARGED HAbst TOOL
In Reaction III of the HAbst recharge reaction sequenceRS5 (Fig. 1), mechanical energy is applied to the firstGeRad tool to pull it away from the tip-dehydrogenatedHAbst tool, breaking the Ge35–C12 bond (required ten-sile force ∼3.64 nN)7 to recover the original GeRad toolwith a radical site on atom Ge35 while leaving behind arecharged active HAbst tool with a radical site on the distalethynyl carbon atom C12. The carbon–carbon bond orderin the C2 ethynyl group remains at 3.After defining the tooltip geometry and coordinate
system for Reaction III (Section 5.1) we calculate thereaction PES (potential energy surface) as a functionof rotational angle �D of the departing GeRad tool(Section 5.2) and as a function of departure positionalangles �D and �D (Section 5.3), describe trajectory-relatedpathologies (Section 5.4), then recommend some opti-mal GeRad tooltip departure trajectories for this reaction(Section 5.5).
5.1. Tooltip Geometry and Coordinate System
The tooltip geometry and coordinate system for Reac-tion III is shown in Figure 25. This coordinate system isdefined by fixing positions of atoms that are most closelyunder the control of the experimentalist. The leftmostimage in Figure 25 defines the HAbst-GeRad tooltip ori-entation angle beta (��, which is the angular displacementof the O′′-normal vector (pointing from O′ to O′′) fromthe X-axis—or more specifically, the angle between theO-normal vector (aka. X-axis) and the O′′-normal vector.Illustrated here is the �= 79�04� case which obtains at thecompletion of Reaction II. The same geometry is foundwhen H28 is deleted from the HAbstH-GeRad complex at
J. Comput. Theor. Nanosci. 7, 1–29, 2010 21

REVIEW
Optimal Tooltip Trajectories in a Hydrogen Abstraction Tool Recharge Reaction Sequence Tarasov et al.
Fig. 25. Coordinate system for Reaction III: The image at left defines the HAbst-GeRad tooltip orientation angle beta (��, which is the angulardisplacement of the O′′-normal vector (pointing from O′ to O′′) from the X-axis (� = 0� upon alignment with X-axis, � = 79�04� in image at left).In the image at right, the (X, Y , Z) coordinate system from Reaction I is translated to O′′, defining the congruent (XD, YD, ZD� coordinate system.Displacement of the positionally controlled GeRad tooltip from O′′ to OD by a distance RD during Reaction III is described by the similarly-defined�D, �D, and �D displacement angles. (C= yellow, H= blue, Ge= white).
the end of Reaction I (� = 50�, � = 70�, � = 20�, R =4�85 Å) and the resulting structure is optimized with the3 control atoms on each handle fixed. Changing � altersthe energy of the HAbst-GeRad complex via some com-bination of bond-bending strain and handle–handle stericinteraction. Figure 26 shows that system energy rises with� and that the collinear (GeRad aligned with X-axis)configuration at � = 0� has the lowest energy (taken asEmin = 0 eV). The minimum system energy Emin at eachbend angle � occurs at a different O′′–O′ separation (Rmin�
Fig. 26. Minimum system energy Emin at each HAbst-GeRad bendangle � occurs at a particular O′′–O′ separation (=Rmin� which also pro-gressively rises with � in Reaction III. Emin and Rmin for each � wereidentified using structure optimizations at a series of separations at �D =20�. Inset chart shows energy versus tool displacement distance RD forthe collinear �= 0� trajectory.
which also progressively rises with �. Most values of �>90� are excluded due to tool handle proximity.In the rightmost image of Figure 25, the (X, Y , Z) coor-
dinate system from Reaction I is translated to O′′, definingthe congruent (XD, YD, ZD� coordinate system for GeRaddeparture. Movement of the positionally controlled GeRadtooltip from O′′ to the displaced origin OD by a distanceRD during Reaction III is described by the �D, �D, and �D
displacement angles that are defined similarly as for �, �,and � in Reaction I (Fig. 2, Section 3.1). Note that at thestart of Reaction III, C1 no longer lies exactly at O′ onthe X-axis line but has moved a distance 0.0205 Å fromthe X-axis line. Similarly, Ge35 has moved 0.067 Å awayfrom the O′′-normal vector—the vector that passes throughO′′ and lies perpendicular to the C30/C32/C34 plane. AfterReaction III is completed, C12 is displaced 0.71 Å fromorigin O′ in the final H28-removed configuration.Only four of the six possible degrees of freedom in
GeRad departure trajectories are considered here. Pitchand yaw rotations during GeRad retraction are beyond thescope of this present work because they would greatlyincrease the complexity and computational cost of theanalysis but are of uncertain utility because significantmotion in these dimensions is less likely to be readilyaccessible experimentally for Reaction III.
5.2. PES as a Function of Rotational Angle �D
The PES as a function of rotational angle �D (i.e., twirlingGeRad around its central axis, the O′′-normal vector) is
22 J. Comput. Theor. Nanosci. 7, 1–29, 2010

REVIEW
Tarasov et al. Optimal Tooltip Trajectories in a Hydrogen Abstraction Tool Recharge Reaction Sequence
Fig. 27. Energy as a function of �D at R = 4�85 Å, for � = 0� using(�, �� = �0�, 0�� and for � = 79�04� using (�, �� = �+50�, +70�� inReaction III.
shown in Figure 27. In the collinear configuration ofHAbst-GeRad at �= 0�, the energy variation for an entirerepeating cycle of rotation of the threefold-symmetricGeRad tooltip from �D = 0�–120� is less than 0.01 eV,rising at � = 79�04� to only ±0.06 eV (similar to resultsin Fig. 7), both below the 0.14 eV limit of computationalaccuracy (Section 2) for this method. The PES minimumfor the �= 79�04� configuration occurs near �D = 20�, thesetting mostly used in the following analyses, but choiceof �D has only limited impact on reaction energetics.Note that in Figure 27 the �= 0� PES curve lies about
∼0.4 eV higher in energy than the � = 79�04� curveeven though the � = 0� PES curve is ∼0.6 eV lower inFigure 26—the �= 0� curve in Figure 27 is taken at sub-optimal R= 4�85 Å whose energy lies ∼1 eV higher thanthe 4.15 Å optimal R for �= 0�.
5.3. PES as a Function of Positional Angles �D and �D
The peak PES as a function of positional angles �D and�D for � = 79�04� is shown in Figure 28. (For conve-nience, �D = −180� points are replotted at +180�.) Toobtain each point, representing a unique departure tra-jectory, the tools were locked at the indicated (�D, �D�rotational position with �D = 20�, then RD was increasedstepwise from 0 Å to as much as 7.1 Å using variable stepincrements of between 0.3–0.5 Å until either breakage ofthe Ge35–C12 bond (blue squares) or a reaction pathology(yellow squares; Section 5.4) occurred during the restrictedgeometry optimization at each step. Both singlet and tripletPES were calculated, but singlet–triplet transition proba-bilities at singlet–triplet PES approach points are difficultto estimate, so for convenience the endpoint of Reaction IIIis presumed to occur when the computed spin density ofGe35 reaches a significant (>0.5) level. Figure 28 showsthe maximum energy Emax of the system at the given �D
and �D (likely occurring near the last step yielding Ge35–C12 bond scission), along with the separation distance
Rmax at which Emax occurs. Emax varies from 4.8–9.7 eV,indicating significant differences among useful trajectoriesthat well exceed the expected DFT computational error.Rmax spans a relatively large range in part because ofthe mobility and extensibility of the Ge35–C12–C11–C1chain. Figure 29 shows a representative trajectory at (�D,�D, �D�= �0�, 0�, 20�� and �= 79�04� for Reaction III, atrajectory having the lowest Emax in Figure 28.The relatively high energies reported near the borderline
of pathological trajectories result in part from the forc-ing of large ethynyl deflection angles prior to Ge35–C12bond scission but may also include an artifactual compo-nent due to computational limitations, as follows. Reac-tion III imposes rotational forces on the HAbst tooltip,but full rotation is prevented by the fixed atoms in thebase, resulting in overall handle deformation and signif-icant bond stretching near the fixed atoms. For example,at (�D, �D� = �+150�, +30�� for RD = 6�6 Å just priorto bond scission the C6–C7 bond (1.83 Å, +19% strain)and the C6–C5 bond (1.80 Å, +17% strain) in the HAbsthandle are highly stretched, just below the Morse potentialinflection point at 1.87 Å (+21% strain) where the C–Cbond becomes mechanically unstable, driving up apparenttooltip system energy. However, in an actual DMS tool thetooltip base atoms are not fixed but are free to move andthus can evenly redistribute the bond strain from the front-line cage back into deeper cages, reducing both tooltipenergy and the risk of handle bond breakage in an actualtool during normal use.The probability of reaction pathology is minimized
when the mechanical dissociation of the Ge35–C12 bondcompels the remaining bonds to dissipate the least possi-ble energy. The lowest Emax and Rmax are found at (�D, �D,�D� = �0�, 0�, 20��, with Ge35–C12 bondbreaking occur-ring at a separation distance of RD ∼ 3�1 Å with a bondscission energy of ∼4.8 eV. This trajectory runs parallel tothe O-normal vector (i.e., to both +X and +XD coordinateaxes).The peak PES as a function of positional angles �D and
�D for �= 0� is shown in Figure 30, obtained and preparedsimilarly to Figure 28. Emax varies only moderately from4.9–6.2 eV across a broad range of useful trajectories (�D,�D, �D�= �±90�, ±60�, 20��. These energies are generallyhigher than the 4.8 eV values for the best trajectories at�= 79�04� because at �= 0� the system energy is reducedby ∼0.6 eV (much of it removed from the now-unstrainedGe35–C12 bond; Fig. 26), hence extra energy must bemechanically applied to the collinear Ge35–C12 bond toinduce this bond to break as compared to the � = 79�04�
case.
5.4. Trajectory Pathologies of Reaction III
At � = 79�04� (Fig. 28) there are 14 unusable trajec-tories (Table III) among the 60 unique trajectories at
J. Comput. Theor. Nanosci. 7, 1–29, 2010 23
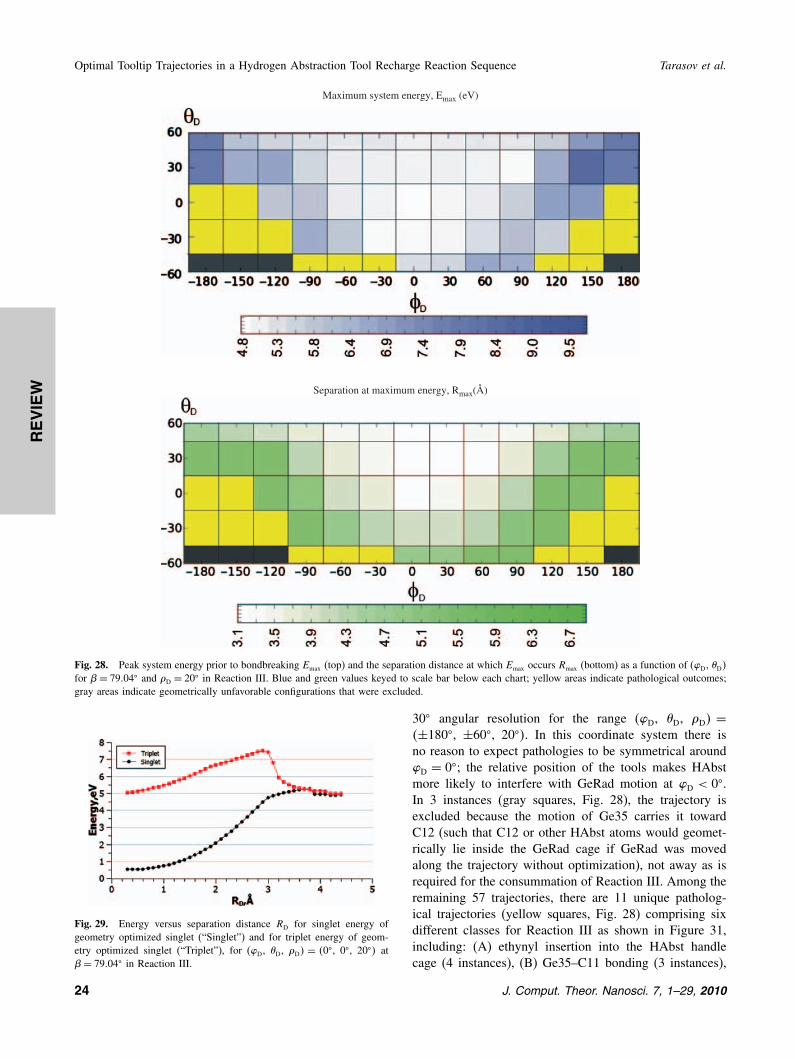
REVIEW
Optimal Tooltip Trajectories in a Hydrogen Abstraction Tool Recharge Reaction Sequence Tarasov et al.
Separation at maximum energy, Rmax(Å)
Maximum system energy, Emax (eV)
Fig. 28. Peak system energy prior to bondbreaking Emax (top) and the separation distance at which Emax occurs Rmax (bottom) as a function of (�D, �D�for �= 79�04� and �D = 20� in Reaction III. Blue and green values keyed to scale bar below each chart; yellow areas indicate pathological outcomes;gray areas indicate geometrically unfavorable configurations that were excluded.
Fig. 29. Energy versus separation distance RD for singlet energy ofgeometry optimized singlet (“Singlet”) and for triplet energy of geom-etry optimized singlet (“Triplet”), for (�D, �D, �D� = �0�, 0�, 20�� at�= 79�04� in Reaction III.
30� angular resolution for the range (�D, �D, �D� =�±180�, ±60�, 20��. In this coordinate system there isno reason to expect pathologies to be symmetrical around�D = 0�; the relative position of the tools makes HAbstmore likely to interfere with GeRad motion at �D < 0�.In 3 instances (gray squares, Fig. 28), the trajectory isexcluded because the motion of Ge35 carries it towardC12 (such that C12 or other HAbst atoms would geomet-rically lie inside the GeRad cage if GeRad was movedalong the trajectory without optimization), not away as isrequired for the consummation of Reaction III. Among theremaining 57 trajectories, there are 11 unique patholog-ical trajectories (yellow squares, Fig. 28) comprising sixdifferent classes for Reaction III as shown in Figure 31,including: (A) ethynyl insertion into the HAbst handlecage (4 instances), (B) Ge35–C11 bonding (3 instances),
24 J. Comput. Theor. Nanosci. 7, 1–29, 2010

REVIEW
Tarasov et al. Optimal Tooltip Trajectories in a Hydrogen Abstraction Tool Recharge Reaction Sequence
Maximum system energy, Emax (eV)
Separation at maximum energy, Rmax (Å)
Fig. 30. Peak system energy prior to bondbreaking Emax (top) and the separation distance at which Emax occurs Rmax (bottom) as a function of (�D,�D� for �= 0� and �D = 20� in Reaction III. Blue and green values keyed to scale bar below each chart; yellow areas indicate pathological outcomes;gray areas indicate geometrically unfavorable configurations that were excluded.
(C) Ge35–C2 bonding (1 instance), (D) C5–C6 bond breakin the HAbst handle cage (1 instance), (E) Ge35–C36shoulder separation in GeRad tooltip (1 instance), and(F) hydrogen abstraction by C12 after Ge35–C12 bondscission (1 instance). This leaves 46 unique nonpathologi-cal trajectories potentially available for Reaction III at 30�
angular resolution for the range (�D, �D, �D� = �±180�,±60�, 20��. It is possible but unlikely that additionalsignificant pathologies might be found using a smallerangular resolution, a smaller step size, or by extendingthe range of �D to ±90�; even a small reaction barrierto an unrecognized pathology might suffice to allow the
geometry optimization algorithm to avoid it, whereas in aphysical system thermal vibrations could surmount a smallbarrier and permit the pathology to occur. Alternatively,some existing pathologies may prove inaccessible if suf-ficient energy barriers are found at higher resolution (asubject for future study).Pathology D is the only trajectory that produces a bond-
ing alteration in the HAbst handle that is unrelated toethynyl reactivity and appears to be the only pathologydirectly related to the proximity of HAbst and GeRad han-dle atoms during the reaction. (The motion of GeRad han-dle atom C36 and its hydrogens apparently pushes HAbst
J. Comput. Theor. Nanosci. 7, 1–29, 2010 25

REVIEW
Optimal Tooltip Trajectories in a Hydrogen Abstraction Tool Recharge Reaction Sequence Tarasov et al.
Table III. Pathological departure trajectories (�D, �D� at �D = 20�, for�= 79�04� in Reaction III.
�D (deg) �D (deg) Pathology (Type) RD of pathol. Å
−180 −60 Ge35 motion toward C12 —−150 −60 Ge35 motion toward C12 —−120 −60 Ge35 motion toward C12 —
−180 0 Ge35–C2 bonding (C) 4.1−180 −30 Ge35–C11 bonding (B) 2.2−150 0 shoulder separation (E) 5.6−150 −30 Ge35–C11 bonding (B) 2.2−120 −30 C5–C6 bond breaking (D) 6.1−90 −60 Ethynyl insertion (A) 4.1−60 −60 Ethynyl insertion (A) 4.1−30 −60 Hydrogen abstraction (F) 6.6+120 −60 Ethenyl insertion (A) 3.6
+150 −30 Ge35–C11 bonding (B) 2.2+150 −60 Ethenyl insertion (A) 3.6
handle atom C5 away from the fixed C4 atom, althoughthis pathology could be artifactual since a fixed atom isinvolved and in a real handle this atom would be free tomove to relieve the strain.) Significant distortion of handle
Pathology A
ethynyl insertion
Pathology B
Ge35–C11 bonding
Pathology C
Ge35–C2 bonding
Pathology D
C5-C6 bond break
Pathology E
Ge35 shoulder separation
Pathology F
C12 hydrogen abstraction
Fig. 31. Six classes of pathological trajectory in Reaction III. (C= yellow, H= blue, Ge= white).
shapes is observed around the endpoint of many trajecto-ries but there are no handle collision problems as reportedabove for Reaction I (Section 3.3), probably because thestepwise procedure employed here allows handles to adjusttheir shape (sometimes to a significant extent).The details of two of the six pathologies are influenced
by choice of �D. For pathology E at (�D, �D� = �−150�,0��, the only pathology that yields bonding alterations inthe GeRad handle, one entire repeating cycle of rotation ofthe threefold-symmetric GeRad tooltip from �D = 0�–120�
was examined stepwise for RD ≥ 2�2 Å in 0.4 Å incrementsuntil the pathology occurred at a separation distance RD =Rpath. Table IV shows that Pathology E cannot be avoidedby choice of �D but occurs at different separations Rpath
ranging from 4.6–6.6 Å. From a similar study of pathologyF at (�D, �D� = �−30�, −60��, Table IV shows that out-right abstraction of a hydrogen atom from the GeRad cageoccurs at three �D settings within the �D = 0�–120� range,while at other �D settings the distance of closest approachbetween the distal ethynyl radical site at atom C12 andthe nearest H atom on the GeRad comes within R(H)min =1.68–1.94 Å. This is larger than the 1.09 Å equilibrium
26 J. Comput. Theor. Nanosci. 7, 1–29, 2010

REVIEW
Tarasov et al. Optimal Tooltip Trajectories in a Hydrogen Abstraction Tool Recharge Reaction Sequence
bondlength for C–H or the 1.46 Å Morse inflection pointseparation5 for C–H. However, the 1.68–1.94 Å range liesmostly within the 1.84 Å intercarbon distance for a tran-sitional linear C–H–C system in which both C–H bondsare stretched to their Morse inflection point limits (andthe Morse limit for C–C is 1.87 Å), hence the absence ofthermally-accessible abstraction events for Pathology F atthese alternative �D settings cannot be guaranteed. Analo-gous rotation of the HAbst tool appears equally unlikely tocure Pathology C at (±180�, 0��. It should also be notedthat since all known pathologies are clustered in the same(�D, �D� region, the avoidance of one class of pathologymay increase the susceptibility to another class.During Reaction III, GeRad moves relatively long dis-
tances (3.5 Å and more) and a lot of energy is put intothe system to break the Ge35–C12 bond. Optimizationruns initiated near an endpoint separation geometry canyield spurious pathological outcomes that disappear whenthe structure is stepped through a physically more realisticseries of smaller displacements, allowing atoms to adjusttheir positions in response to the more slowly changingconfiguration. For example, a (�D, �D�= �+150�, 0�� tra-jectory started at RD = 2�2 Å immediately proceeds toPathology B, whereas initiating the same trajectory step-wise from RD = 0 Å to 2.2 Å allows the C1–C11–C12angle to bend and other bonds to stretch to accommo-date GeRad movement while keeping the Ge35–C12 bondintact. Similarly, an ethynyl insertion into the GeRad cagethat was observed for a (�D, �D�= �−30�, −60�� trajectorystarted at RD = 2�2 Å (for most �D settings) disappearedusing stepwise calculations started from RD = 0 Å.Choice of �D does not significantly influence the overall
energetics of Reaction III but can affect the distribution ofpeak bond strains and thus slightly alter the probability ofa pathological outcome. Retraction of GeRad transmits atensile load from the Ge35–C12 bond to the Ge35–C36,
Table IV. Effect of �D on the separation distance Rpath at which theshoulder separation pathology E at (�D, �D� = �−150�, 0�) occurs andon the distance R(H)min between the C12 radical and the nearest H atomduring the abstraction pathology F at (�D, �D) = (−30�, 60�), for � =79.04� in Reaction III.
Pathology E Pathology F
�D (deg) Rpath (Å) R(H)min (Å)
0 6.1 1.8510 6.1 1.7220 5.6 abstraction30 5.1 1.6840 4.6 1.7950 4.6 1.9460 5.1 abstraction70 5.6 1.780 6.6 1.990 6.1 1.83100 6.1 1.76110 6.1 abstraction120 6.1 1.85
Table V. Pathological departure trajectories (�D, �D) at �D = 20�, for=0� in Reaction III.
RD of�D (deg) �D (deg) Pathology (Type) pathol. (Å)
−180 0 Ge35 motion toward C12 —−180 −30 Ge35–C11 bonding (B) 2.8−180 +30 Ge35–C11 bonding (B) 2.8−150 −30 Ge35–C11 bonding (B) 4.3−150 0 Ge35–C11 bonding (B) 3.3−150 +30 Ethynyl insertion (A) 5.3+150 −30 Ge35–C11 bonding (B) 4.3+150 0 Ge35–C11 bonding (B) 3.3+150 +30 Ge35–C11 bonding (B) 4.3
Ge35–C37 and Ge35–C38 shoulder bonds of the GeRadtool. The special case of a departure trajectory that is par-allel to the O′′-normal vector produces an approximatelyequal tensile force on all three shoulder bonds, but in allother cases the trajectory is imperfectly aligned with thisaxial line and generates an asymmetric stretch force dis-tribution that is necessarily more concentrated on just oneor two shoulder bonds rather than all three. The risk of ashoulder separation event (Pathology E) is slightly higherwhen the stretch force is concentrated on a single shoulderbond and slightly lower when that force is evenly dis-tributed over two shoulder bonds. For example, on the (�D,�D�= �0�, 0�� trajectory a setting of �D = 20� concentratesthe tensile force on a single Ge35–C38 shoulder bond,stretching it to 2.15 Å (+9% bond strain) immediatelyprior to Ge35–C12 bond scission; a setting of �D = 80�
distributes force evenly over the two Ge35–C37 and Ge35–C38 shoulder bonds, reducing their individual peak stretchto 2.09 Å (+6% bond strain) while producing only −1.3%bond compression in Ge35–C36 (cf. the 2.32 Å (+19%bond strain) Morse limit for Ge–C bond instability.)At � = 0� (Fig. 30) there are 9 unusable trajecto-
ries at 30� angular resolution in the range (�D, �D,�D� = �±180�, ±60�, 20��—one excluded trajectory and8 pathological trajectories including 1 instance of Pathol-ogy A and 7 instances of Pathology B (Table V)—leaving51 unique nonpathological trajectories potentially availablefor Reaction III.
5.5. Optimal Tooltip Trajectories
The optimal GeRad detachment trajectory for Reac-tion III appears to be (�D, �D, �D� = �0�, 0�, 20�� at�= 79�04�, with Ge35–C12 bondbreaking occurring neara separation distance of RD ∼ 3�1 Å with a bond scis-sion energy of ∼4.8 eV. This trajectory is aligned with theX and XD coordinate axes (paralleling the C1–C11–C12final equilibrium geometry of the recharged HAbst tool)and has the highest probability of reaction completion andsafety because it offers the lowest bond dissociation energyand the shortest tooltip travel distance hence the quick-est release (lowest Rmax�, and also occupies a position on
J. Comput. Theor. Nanosci. 7, 1–29, 2010 27

REVIEW
Optimal Tooltip Trajectories in a Hydrogen Abstraction Tool Recharge Reaction Sequence Tarasov et al.
the (�D, �D� peak PES that is maximally distant from allknown pathologies. Bond scission energies are similar foralternative trajectories that lie within ±30� of the opti-mal one, although the bond breaking separation distanceis ∼1 Å longer for �D = −30� trajectories as comparedto �D = +30� trajectories. It is desirable to have multipleviable trajectories available since in a particular experi-mental setup some range of (�D, �D, �D� settings might notbe accessible at all or might be easier to attain than oth-ers. The (0�, 0�, 20�� trajectory requires no experimentallychallenging rotational motions, only translational motions,while GeRad is still bonded to HAbst.The (0�, 0�, 20�� trajectory makes good use of the effec-
tive pre-weakening of the Ge35–C12 bond that occursat near-maximum bond bending at � = 79�04�. By con-trast, in the collinear configuration at � = 0� the systemenergy is reduced by 0.6 eV (much of it removed fromthe now-unstrained Ge35–C12 bond), which means thatthis extra amount of energy additionally must be mechan-ically applied to the collinear Ge35–C12 bond to inducethis bond to break.
6. CONCLUSIONS
The use of precisely applied mechanical forces toinduce site-specific chemical transformations is calledpositional mechanosynthesis, and diamond is an impor-tant early target for achieving mechanosynthesis exper-imentally. A key step in diamond mechanosynthesis(DMS) employs an ethynyl-based hydrogen abstractiontool (HAbst) for the site-specific mechanical dehydrogena-tion of the H-passivated diamond lattice surface, creatinga radical site that can accept adatoms via radical–radicalcoupling in a subsequent positionally controlled reactionstep. The tool, once used, may be recharged by remov-ing the abstracted hydrogen atom from the tool, using apositionally controlled reaction sequence involving threesequential reactions. In this paper we undertake the firststudy of tool-workpiece operating envelopes and optimaltooltip trajectories for positionally controlled DMS tools,in this case a complete three-reaction recharge reactionsequence for HAbstH/HAbst. The results of our study mayhelp to define equipment and tooltip motion requirementsthat are needed to execute the proposed reaction sequenceexperimentally.The optimal GeRad approach trajectory for Reaction I
continuously maintains an acceptably low net reactionenergy throughout the entire reaction process, allowingtool and workpiece to be positioned in the energy land-scape on a valley floor of adequate depth but maxi-mum width which permits successful consummation ofReaction I even in situations where tooltip placement errormay be significant. Examples include the (�, �, �� =�+40�, +70�, +40�� and (+50�, +70�, +20�� approachtrajectories that minimize demands on the reliability of an
experimental positional control system, since the controlscan be set once at the start of the reaction and held con-stant through its conclusion. Various alternative compound,low-barrier and other trajectories are also useful in certaincircumstances.The optimal GeRad2 approach trajectory for Reaction II
appears to be (�H, �H, �H� = �0�, 0�, 0��, although anyapproach trajectory within the recommended (�H, �H�operating range of ∼ �±40�, ±80�� should suffice almostequally well if �H = 0�. Reaction II is likely to be barrier-less within the recommended operating range.The optimal GeRad detachment trajectory for Reac-
tion III appears to be (�D, �D, �D� = �0�, 0�, 20�� at� = 79�04�, with Ge35–C12 bondbreaking occurring ata separation distance of RD∼3.1 Å with a bond scis-sion energy of ∼4.8 eV. This trajectory has the high-est probability of reaction completion and safety amongneighboring alternatives because it offers the lowest bonddissociation energy, the quickest release (lowest Rmax�, anda position on the (�D, �D� peak PES that is maximallydistant from all known pathologies.
Acknowledgments: Robert A. Freitas, Jr. acknowl-edges private grant support for this work from the LifeExtension Foundation, the Alcor Foundation, the KurzweilFoundation, and the Institute for Molecular Manufacturing.
References
1. D. M. Eigler and E. K. Schweizer, Nature 344, 524 (1990).2. N. Oyabu, O. Custance, I. Yi, Y. Sugawara, and S. Morita, Phys.
Rev. Lett. 90, 176102 (2003).3. N. Oyabu, O. Custance, M. Abe, and S. Moritabe, Absts. 7th
Intl. Conf. on Non-Contact Atomic Force Microscopy, Seattle,Washington, USA, September (2004), p. 34.
4. Y. Sugimoto, P. Pou, O. Custance, P. Jelinek, M. Abe, R. Perez, andS. Morita, Science 322, 413 (2008).
5. K. E. Drexler, Nanosystems: Molecular Machinery, Manufacturing,and Computation, John Wiley & Sons, New York (1992).
6. R. C. Merkle, Nanotechnology 8, 149 (1997).7. R. A. Freitas, Jr. and R. C. Merkle, J. Comput. Theor. Nanosci.
5, 760 (2008).8. B. Temelso, C. D. Sherrill, R. C. Merkle, and R. A. Freitas, Jr.,
J. Phys. Chem. A 110, 11160 (2006).9. S. M. Valone, M. Trkula, and J. R. Laia, J. Mater. Res. 5, 2296
(1990).10. M. Page and D. W. Brenner, J. Am. Chem. Soc. 113, 3270
(1991).11. C. B. Musgrave, J. K. Perry, R. C. Merkle, and W. A. Goddard III,
Nanotechnology 2, 187 (1991).12. X. Y. Chang, M. Perry, J. Peploski, D. L. Thompson, and L. M.
Raff, J. Chem. Phys. 99, 4748 (1993).13. S. B. Sinnott, R. J. Colton, C. T. White, and D. W. Brenner, Surf.
Sci. 316, L1055 (1994).14. D. W. Brenner, S. B. Sinnott, J. A. Harrison, and O. A. Shenderova,
Nanotechnology 7, 161 (1996).15. J. W. Lyding, K. Hess, G. C. Abeln, D. S. Thompson, J. S. Moore,
M. C. Hersam, E. T. Foley, J. Lee, Z. Chen, S. T. Hwang, H. Choi,P. H. Avouris, and I. C. Kizilyalli, Appl. Surf. Sci. 130, 221 (1998).
16. E. T. Foley, A. F. Kam, J. W. Lyding, and P. H. Avouris, Phys. Rev.Lett. 80, 1336 (1998).
28 J. Comput. Theor. Nanosci. 7, 1–29, 2010

REVIEW
Tarasov et al. Optimal Tooltip Trajectories in a Hydrogen Abstraction Tool Recharge Reaction Sequence
17. M. C. Hersam, G. C. Abeln, and J. W. Lyding, Microelectron. Eng.47, 235 (1999).
18. L. J. Lauhon and W. Ho, J. Phys. Chem. 105, 3987 (2000).19. J. Peng, R. A. Freitas, Jr., R. C. Merkle, J. R. Von Ehr, J. N. Randall,
and G. D. Skidmore, J. Comput. Theor. Nanosci. 3, 28 (2006).20. R. C. Merkle and R. A. Freitas, Jr., J. Nanosci. Nanotechnol. 3, 319
(2003).21. A. A. Granovsky, PC-GAMESS version 7.1 www (2009),
http://classic.chem.msu.su/gran/gamess/index.html (Some computa-tions used version 7.0).
22. M. W. Schmidt, K. K. Baldridge, J. A. Boatz, S. T. Elbert, M. S.Gordon, J. H. Jensen, S. Koseki, N. Matsunaga, K. A. Nguyen, S. Su,T. L. Windus, M. Dupuis, and J. A. Montgomery, J. Comput. Chem.14, 1347 (1993).
23. A. D. Becke, J. Chem. Phys. 98, 5648 (1993).24. C. Lee, W. Yang, and R. G. Parr, Phys. Rev. B. 37, 785 (1988).
25. J. B. Foresman and A. Frisch, Exploring Chemistry with Elec-tronic Structure Methods: A Guide to Using Gaussian, Second edn.,Gaussian Inc., Pittsburgh PA (1996).
26. J. Peng, R. A. Freitas, Jr., and R. C. Merkle, J. Comput. Theor.Nanosci. 1, 62 (2004).
27. HyperCube, Inc., HyperChem Computational Chemistry, Publica-tion HC70-00-04-00 (2002), MM2 (1991) parameter set (/run-files/mmpstr.txt and /runfiles/mmpben.txt) contributed by NormanAllinger.
28. M. Lesbre, P. Mazerolles, and J. Stage, The Organic Compounds ofGermanium, John Wiley & Sons, New York (1971).
29. C. D. Schaeffer, Jr., C. A. Strausser, M. W. Thomsen, andC. H. Yoder, Common bond energies and bond lengths, Data forGeneral, Inorganic, Organic, and Physical Chemistry, The WiredChemist (1989), http://www.wiredchemist.com/chemistry/data/bond_energies_ lengths.html.
Received: 6 May 2009. Accepted: 12 May 2009.
J. Comput. Theor. Nanosci. 7, 1–29, 2010 29