Embed Size (px)
Citation preview

Optimal Arbitrage Strategies∗
Jun Liu†
UC San Diego and CKGSB
Allan Timmermann‡
UC San Diego and CREATES
June 1 2010
Abstract
Riskless arbitrage is rarely encountered in practice, yet it is common in both academic stud-
ies and industry to use the riskless arbitrage strategy (holding a balanced long-short position in
the same number of shares) even when arbitrage opportunities are risky. This is almost never
optimal as the objective of the riskless arbitrage strategy (to offset future liabilities) differs from
the objective under risky arbitrage of optimally trading off risk and returns. We analyze risky
arbitrage in the context of a model with cointegrated asset prices where temporary mispricing
is captured by an error correction term. Absolute mispricing (under- or overpriced assets) is
determined by the conditional alpha associated with the error correction term while relative mis-
pricing is determined by mean reversion in the error correction term. Under riskless arbitrage,
only relative mispricing matters, whereas both absolute and relative mispricing matter for the
optimal strategy under risky arbitrage. This can give rise to some surprising insights. For exam-
ple, it can be optimal under risky arbitrage to take a long position in an asset that would be held
short under riskless arbitrage.
Key words: risky arbitrage, absolute mispricing, relative mispricing.
∗We thank Jun Pan and seminar participants at the CREATES workshop on Dynamic Asset Allocation and at Black-rock for helpful discussions and comments. Timmermann acknowledges support from CREATES, funded by the DanishNational Research Foundation.
†Jun Liu is from UCSD and is affiliated with Cheung-Kong Graduate School of Business (CKGSB). Rady Schoolof Management, Otterson Hall, 4S148, 9500 Gilman Dr, #0553, La Jolla, CA 92093-0553; ph: (858) 534-2022; email:[email protected].
‡Rady School of Management, Otterson Hall, 4S146, 9500 Gilman Dr, #0553, La Jolla, CA 92093-0553; ph: (858)534-0894; email: [email protected].

1 Introduction
Riskless arbitrage occurs when two assets trade at different prices but have the same payoff
with certainty at a future date.1 Risky arbitrage refers to the case where the two assets’ payoffs
may not be identical at the future date, possibly because of limits to arbitrage resulting from
transaction costs, limits on capital or capacity constraints on trading, e.g., Shleifer and Vishny
(1997), and Mitchell, Pedersen and Pulvino (2007). The riskless arbitrage strategy involves
shorting a certain number of shares of the highest priced asset and buying the same number of
shares of the lowest priced asset to offset future liabilities.2 It is often taken for granted that this
strategy is also optimal under risky arbitrage, the main difference being that an infinite amount
is invested under riskless arbitrage, while under risky arbitrage the risk-return trade-off limits
the investment to a finite amount.
In this paper we show that the riskless arbitrage strategy is almost never optimal under risky
arbitrage and that the optimal arbitrage strategy generally involves holding unbalanced long and
short positions. Specifically, when there is uncertainty about the future net payoff being zero,
investors’ utility and details of the risk-return trade-off associated with the arbitrage opportunity
influence investors’ optimal asset holdings. The riskless arbitrage strategy fails to be optimal
since it exposes the investor to unnecessary risk. It also causes underinvestment relative to the
optimal strategy for generating alpha. This is economically important since the optimal trad-
ing strategy can make more efficient use of the risky assets for purposes of controlling risk and
avoiding overly large leverage or short positions. In calibrated exercises we show that the opti-
mal arbitrage strategy can lead to significant improvements over the riskless arbitrage strategy.
While riskless arbitrage is almost never encountered in practice, risky arbitrage is far more
common. Examples of risky arbitrage include merger arbitrage (also called risk arbitrage), pairs
trading and arbitrage between the same stocks trading in different markets, see, e.g., Bondarenko
(2003) and Hogan et al. (2004). For example, some stocks of Chinese companies are traded si-
multaneously on the Hong Kong Stock Exchange (H shares) and on the Chinese stock exchanges
(A shares). H and A shares carry the same dividends and control rights, but the prices of A shares
can be twice as high as those of the corresponding H shares. It is reasonable to assume that H
shares are fairly priced while A shares are overpriced. In this case the riskless arbitrage strategy
of buying the underpriced stock while simultaneously selling the same number of shares of the
overpriced stock is clearly suboptimal−in fact, there may not be an underpriced stock.1 There are type-I and type-II arbitrage opportunities and arbitrages involving multiple assets. For exposition pur-
poses, we focus in this paper on type-I arbitrage involving two assets but our conclusions apply to more general cases.2 See, e.g., Shleifer and Vishny (1997), Liu and Longstaff (2004), Liu, Peleg and Subrahmanyam (2006), and Jurek
and Yang, 2007).
1

To model risky arbitrage, we follow earlier studies in the literature, e.g., Alexander (1999),
Gatev, Goetzmann and Rouwenhorst (2006) and Jurek and Yang (2007), in assuming that in-
dividual asset prices contain a random walk component, but that pairs of asset prices can be
cointegrated.3 This assumption captures the key point that risky arbitrage only exists in ex-
pectation and any mispricing may become more severe before disappearing.4 Compared to the
riskless arbitrage case, this corresponds to having a stochastic time for the elimination of pricing
errors. As a consequence, and in contrast to riskless arbitrage, risk-averse investors will not hold
infinite positions in a risky arbitrage strategy.
Our analysis emphasizes the importance of distinguishing between absolute and relative mis-
pricing. When the error correction term is positive, the instantaneous asset return has a positive
alpha and so the asset is underpriced in the short run. Conversely, when the error correction term
is negative, the instantaneous return has a negative alpha and the asset is overpriced in the short
run. Hence, the conditional alpha is associated with absolute mispricing. In the long run the
cointegrated variable reverts (in mean) to zero, so the relative price−which is the cointegrated
variable−goes to zero on average. Hence, the long run cointegrating relation and the associated
relative mispricing can be used to describe risky arbitrage. To summarize, absolute mispricing
is determined in the short run by the conditional alphas while relative mispricing is determined
in the long run by cointegration between asset prices. Moreover, under riskless arbitrage only
relative mispricing between two assets matters, whereas both absolute and relative mispricing
matter under risky arbitrage.
Our setup captures a variety of interesting cases. One asset can be mispriced while the other
is fairly priced. One asset can be underpriced while the other is overpriced. Finally, both assets
can be simultaneously underpriced or overpriced. Consider the case where one asset is fairly
priced while the other is overpriced. The riskless arbitrage strategy is short in the overpriced
asset and long the same number of shares in the fairly priced asset. In contrast, under risky
arbitrage the expected utility approach dictates that emphasis is placed on the mispriced asset
and the fairly priced asset will only be held to the extent that it hedges the idiosyncratic risk of
the mispriced asset. In this example the overpriced asset has a negative alpha because its price is
expected to decrease more than is justified by its market exposure, while the fairly priced asset
has zero alpha and will be held only if it can be used to hedge the risk exposure of the overpriced
asset. Thus the fairly priced asset will not be held if its return is independent of the overpriced3 Risky arbitrage could be described in many other ways, but these are unlikely to change the qualitative conclusions.4 Cointegration among asset prices captures cases of statistical arbitrage involving pairs of assets that are very close
substitutes, e.g., stock indexes traded through futures contracts or exchange traded mutual funds (Hasbrouk, 2003), forwhich mean reversion is likely to be very fast. It also includes cases where it is more difficult for investors to exploitmispricing and mean reversion is likely to be slow, e.g., Summers (1986).
2

asset after the market exposure is excluded. Therefore, the optimal risky arbitrage strategy is a
short position in the overpriced asset while holding none of the fairly priced asset. This is very
different from the riskless arbitrage strategy which must have a short position in the overpriced
asset and a long position (with the same number of shares) in the fairly priced asset.
In some cases our analysis produces surprising insights that are not achievable in a static
mean-variance Markowitz setting. Specifically, in the case with two underpriced assets, at short
horizons the optimal portfolio is long in both assets even though one asset can be relatively
more underpriced and have a higher alpha. In the short run, time is too scarce for the arbitrage
mechanism to be effective, and the investor will only focus on the absolute mispricing and so
holds positive amounts in both assets. At long horizons, as the price differential reverts to zero,
the optimal risky arbitrage strategy goes long in the relatively more underpriced asset and short
in the relatively less underpriced asset.
Our analysis generalizes existing results from the literature on risky arbitrage which assume
that the balanced strategy from riskless arbitrage should be used, see, e.g., Liu and Longstaff
(2006), Liu, Peleg, and Subrahmanyam (2006), and Jurek and Yang (2006). We show that this
need not hold in the case with two risky assets and a single risk factor and extend the results to
cover an arbitrary number of risky assets and risk factors. Furthermore, our results apply to any
form of arbitrage analysis, riskless or risky, which requires utility maximization. Indeed, in the
presence of market frictions and limits to arbitrage, our insights also apply to riskless arbitrage
since, as frictions become more important, riskless arbitrage effectively becomes risky arbitrage.
In summary, the key contributions of our paper are as follows. First, we derive the optimal
trading strategy in closed form under the assumption that risky arbitrage opportunities arise when
asset prices are cointegrated. Second, we show that the riskless arbitrage strategy is, in general,
suboptimal and the optimal arbitrage strategy is determined by both relative mispricing (risky
arbitrage) and absolute mispricing. Third, we derive theoretical results and use a calibration
exercise to demonstrate that the loss incurred from following the riskless arbitrage strategy can
be economically significant.
The remainder of the paper is organized as follows. Section 2 specifies our model for how as-
set prices evolve. Section 3 derives the optimal investment strategy in closed form and analyzes
some special cases of particular interest. Section 4 considers the utility loss from pursuing sub-
optimal strategies that impose fixed relative weights (including market neutrality), while Section
5 generalizes our setup to incorporate multiple risk factors and many assets. Section 6 concludes.
3

2 Asset Prices
Two assets with identical payoffs can trade at different prices. Examples include pairs of stocks
that have the same claim to dividends and identical voting rights but are traded in different
markets and two stocks that have the same payoff such as the target and acquirer stocks in a
merger. Yet, the prices of these assets can be quite different. A well-known example is the
case where the shares of Shell and Royal-Dutch traded at different prices despite being claims
on the same underlying assets. If the time of convergence of the two prices was known with
certainty, there would be a riskless arbitrage opportunity and investors would have shorted the
overpriced stock in the same amount as they would have been long in the underpriced stock. In
reality, however, while the two stock prices could be expected to converge over time, the date
where this would occur was not known ex ante, and so this is an example of risky arbitrage, i.e.
a self-financing trading strategy with a strictly positive payoff today but a zero expected future
cumulative payoff.
The trading strategy commonly used to exploit such price differences is the riskless arbitrage
strategy of holding a certain number of shares in the lowest priced asset while shorting an iden-
tical number of shares in the highest priced asset.5 While this strategy is optimal under riskless
arbitrage, it may not be so for arbitrage in the real world which invariably is risky. Although the
riskiness of arbitrages has been recognized, the optimality of the riskless arbitrage strategy is of-
ten taken for granted even when investing in risky arbitrage opportunities. This clearly overlooks
that, for all risky arbitrages, the trade-off between risk and return is an important determinant of
the optimal trading strategy.
In this section we use cointegration between asset prices to describe risky arbitrage. We ini-
tially focus on pairs of individual stocks and a single common risk factor. Section 5 generalizes
the model to allow for multiple common risk factors and an arbitrary number of assets. A special
case of our model is the type of pairs trading considered by Gatev et al. (2006) whereby a winner
stock is shorted and a loser stock is bought, but, as we shall see, our analysis is far more general
than this example.
2.1 Price Dynamics
We assume that there is a riskless asset which pays a constant rate of return, r. A risky asset
trading at the price Pmt represents the market index. We assume that this follows a geometric5 See, for example, Mitchell and Pulvino (2001).
4

random walk process, i.e.,dPmt
Pmt= (r + μm) dt+ σmdBt, (1)
where the market risk premium, μm, and market volatility, σm, are both constant and Bt is a
standard Brownian motion. The market index is fairly priced. Papers such as Dumas, Kurshev
and Uppal (2009) and Brennan and Wang (2006) assume that the market index is subject to
pricing errors. We make no such assumptions here and instead concentrate on mispricing in
(pairs of) individual asset prices.
In addition to the risk-free asset and the market index, we assume the presence of two risky
assets whose prices Pit, i = 1, 2, evolve according to the equations
dP1tP1t
= (r + βμm) dt+ βσmdBt + σdZt + bdZ1t − λ1xtdt; (2)
dP2tP2t
= (r + βμm) dt+ βσmdBt + σdZt + bdZ2t + λ2xtdt, (3)
where λi, i = 1, 2, β, b, and σ are constant parameters. Zt and Zit are standard Brownian
motions, and Bt, Zt, and Zit are all mutually independent for i = 1, 2.6 The variable xt
represents pricing errors in our model and is the difference between the logarithms of the two
asset prices, pit = lnPit,
xt = p1t − p2t = ln
µP1tP2t
¶. (4)
We make the key assumption that λ1 + λ2 > 0. This implies that xt is stationary and the
logarithms of the prices are cointegrated with cointegrating vector (1,−1). Following Engle
and Granger (1987), we refer to xt as the error-correction term. In common with most of the
literature, we take the price processes as exogenously given and so they are not affected by
arbitrageurs’ attempts at exploiting mispricing.7
In the specification in equations (2-3), βσmdBt represents exposure to the market risk while
σdZt + bdZit represents idiosyncratic risks. It is standard to assume that idiosyncratic risks
are independent across different stocks with the market risk representing the only source of
correlation among different assets. In our case, both assets are claims on similar fundamentals
and so the presence of common idiosyncratic risk, dZt, is to be expected. The two asset prices
are correlated both because of their exposure to the same market-wide risk factor (dBt) and
common idiosyncratic risk (dZt) but also due to the mean-reverting error-correction term (xt)
which will induce correlation between the two asset prices even in the absence of the two former
components.6 The presence of a common nonstationary factor is consistent with the equilibrium asset pricing model analyzed by
Bossaerts and Green (1989).7 See Kondor (2009) for an approach that endogenizes the price process.
5

The terms −λ1xt and λ2xt play a dual role in the above specification. First, they represent
mean excess returns over the normal mean return of r + βμm and thus capture each asset’s
absolute mispricing. They are the only source of mispricing in our model and thus the only
source of abnormal returns for investors. When −λ1xt > 0, asset one has a higher expected
return than justified by its risk, i.e., a positive alpha, and so asset one is underpriced. Conversely,
when−λ1xt < 0, asset one has a lower expected return than justified by the risk, i.e., a negative
alpha, and is overpriced. Similarly, when λ2xt > 0, asset two has a positive alpha and thus is
underpriced; when λ2xt < 0, asset two has a negative alpha and is overpriced.
Second, equations (2-4) constitute a continuous-time cointegrated system with −λ1xt and
λ2xt as the error correction terms. When λ1 + λ2 > 0, these terms produce mean reversion that
keeps mispricing stationary and pricing errors “small” compared to either of the integrated price
processes p1t, p2t. This ensures that, in the words of Chen and Knez (1995), “closely integrated
markets should assign to similar payoffs prices that are close”. When the terms −λ1xt and λ2xtare both absent, the risk premium is determined by βμm and only the market index and the
riskless asset will be held. Neither of the individual risky assets will be held because of their
extra idiosyncratic risk terms which go unrewarded.
Other statistical processes could be used to capture temporary deviations from equilibrium
prices, including non-linear relations or fractional cointegration, to name a few. Our styl-
ized model is meant to capture essential features of pricing errors while maintaining analyti-
cal tractability and allowing us to characterize the optimal trading strategy in closed form. For
tractability, and to make the assumption of integrated stock prices more realistic, the cointegrated
system is specified in terms of the logarithm of asset prices and not prices themselves.
Even though both asset prices are almost geometric Brownian motions, the difference be-
tween the two is stationary because of the error correction term which captures relative mispric-
ing between the two assets. The dynamics of this term satisfies
dxt = −λxxtdt+ bxdZxt, (5)
where
λx = λ1 + λ2,
bxdZxt = bdZ1t − bdZ2t, (6)
and bx =√2b. The assumption that the mean reversion coefficient, λx, is positive ensures that
xt is stationary. Mean reversion in xt captures the temporary nature of any mispricing.
Whereas the mispricing specified here is stationary over time, mispricing in Liu and Longstaff
(2004) and Liu, Peleg, and Subrahmanyam (2006) are expressed in terms of a Brownian bridge
6

and a generalized Brownian bridge. These specifications are not stationary and are useful to
describe cases where mispricing will be zero for sure at some future date. For example, on the
settlement date of a futures contract, the difference between the spot and futures price has to be
zero even though the individual spot and futures prices follow non-stationary processes (Brenner
and Kroner, 1995).
To gain intuition for the price dynamics in our model, we next discuss three special cases of
particular economic interest.
2.2 One Mispriced Asset
Consider the case in which only one of the assets is mispriced, while the other is always correctly
priced. Although intuition may suggest that only the mispriced asset should be traded, the
correlation between the two assets means that the correctly priced asset will in fact also be held.
For illustration, suppose that asset two is fairly priced while asset one is subject to mispricing.
The assets are identical in all other dimensions:
dP1tP1t
= (r + βμm) dt+ βσmdBt + σdZt + bdZ1t − λ1xtdt,
dP2tP2t
= (r + βμm) dt+ βσmdBt + σdZt + bdZ2t. (7)
We can interpret P2t as the fair price of both assets because it is not affected by the error-
correction term (λ2 = 0). However, asset one is mispriced due to the error-correction term
−λ1xt = −λ1(lnP1t − lnP2t) in the dynamics of P1t. Assuming that λ1 > 0, this drives
mispricing of asset one to zero. When P1t > P2t, the price of asset one is overvalued so the
error-correction term −λ1(lnP1t − lnP2t) is negative and will “pull” P1t down towards its fair
value P2t. Similarly, when P1t < P2t, the price of asset one is undervalued, and the error-
correction term −λ1(lnP1t − lnP2t) is positive which will “push” the price P1t up towards its
fair value P2t. This may be a good description of Chinese A shares traded on Chinese stock
exchanges (asset one) and Chinese H shares traded in Hong Kong (asset two).
2.3 One Underpriced and One Overpriced Asset
Another special case arises when the two assets are symmetrically affected by mispricing. This
case could cover stocks cross-listed on different exchanges such as ADRs or individual stocks
such as Royal/Dutch and Shell where both markets are fairly similar and there is a degree of
7

symmetry:
dP1tP1t
= (r + βμm) dt+ βσmdBt + σdZt + bdZ1t − λxtdt;
dP2tP2t
= (r + βμm) dt+ βσmdBt + σdZt + bdZ2t + λxtdt. (8)
In this case, when P1t > P2t, the term −λxt = −λ(lnP1t − lnP2t) in the dynamics of P1t will
pull P1t down towards P2t while the term λxt = −λ(lnP2t − lnP1t) in the dynamics of P2twill push P2t up towards P1t, thus keeping close the difference between P1t and P2t. A similar
conclusion holds when P1t < P2t.8
In the perfectly symmetric case there is no need to distinguish between which asset is un-
dervalued and which is overvalued since only relative mispricing is needed to set up a trade.
Conversely, in the more general asymmetric case, it becomes important to make this distinction.
For example, if asset one is mispriced while asset two is fairly priced, it becomes important
whether asset one is under- or overpriced.
2.4 Two underpriced (Overpriced) Assets
Both assets can be temporarily under- or overpriced, yet the price differentials still be expected
to revert to zero over the long run. To see this, consider the following dynamics,
dP1tP1t
= (r + βμm) dt+ βσmdBt + σdZt + bdZ1t + θλxtdt,
dP2tP2t
= (r + βμm) dt+ βσmdBt + σdZt + bdZ2t + λxtdt, (9)
where in the earlier notation λ1 = −θλ, λ2 = λ > 0, 0 < θ < 1, so λ1 + λ2 > 0. In
this case, when xt > 0, both assets have a positive expected excess return, namely θλxtdt and
λxtdt, respectively, so both are underpriced in absolute terms. However, since θ < 1, asset
two is more underpriced than asset one and thus has a higher expected return. In the long
run, the cointegration relation determines the evolution in the two prices with asset one’s price
expected to decline relative to that of asset two because asset one’s relative price is too high
when measured against the price of asset two.8 One could directly assume that P1t−P2t is stationary without separate specifications for P1t and P2t, as in Jurek and
Yang (2007). In this case, the two assets need not, strictly speaking, be cointegrated, because P1t and P2t are positiveand therefore cannot be integrated processes, but the specification still captures mean reversion in the mispricing.
8

3 Optimal Investment Strategy
We next use the asset pricing model from the previous section to characterize the optimal port-
folio choice for an investor with power utility. We denote the investor’s weight on the market
portfolio by φmt while the weights on the individual risky assets are given by φit, i = 1, 2.
The investor’s utility is assumed to be of the constant relative risk aversion form:
1
1− γEt
hW 1−γ
T
i, (10)
where WT is the value of the investor’s wealth at time T , which satisfies
dWt =Wt
µrdt+ φmt
µdPmt
Pmt− rdt
¶+ φ1t
µdP1tP1t− rdt
¶+ φ2t
µdP2tP2t− rdt
¶¶. (11)
The following proposition characterizes the investor’s optimal portfolio weights at time t ≤ T :
Proposition 1 Suppose asset prices evolve according to equations (1 - 3) and the investor has
constant relative risk aversion preferences, (10). Then the optimal weights on the market port-
folio, φ∗mt, and the individual assets, (φ∗1t, φ∗2t), are
φ∗mt =μmγσ2m
− (φ∗1t + φ∗2t)β,
⎛⎝ φ∗1t
φ∗2t
⎞⎠ =
⎛⎝ σ2 + b2 −σ2
−σ2 σ2 + b2
⎞⎠γ(2σ2 + b2)b2
⎛⎝ −λ1 + b2C
λ2 − b2C
⎞⎠ lnµP1tP2t
¶.
Here C is a function of time t only and satisfies a system of ordinary differential equations
(ODEs) which is given in Appendix A.
Proposition 1 is a special case of a more general result (Proposition 5) with multiple as-
sets and risk factors which we state in Section 5 and prove in Appendix A. The first term in
the expression for the market portfolio is the standard mean-variance portfolio weight and thus
depends on the market’s Sharpe ratio divided by the investor’s coefficient of risk aversion and
market volatility. The second term offsets the market exposure of the individual assets which is
linear in the portfolio weights, φ∗1t and φ∗2t, and proportional to their beta.
Turning to the expression for the holdings of the individual assets, note that parameters as-
sociated with the market index such as β, μm, and σm, do not appear in the expression for φ∗1tand φ∗2t . This is because the individual assets’ market exposure is hedged using the market
index. In contrast, asset-specific parameters such as the volatility of the common and indepen-
dent idiosyncratic risk components (σ, b), their sensitivity to the mispricing component (λ1 and
9

λ2), the size of the mispricing (ln(P1t/P2t) ) in addition to the investor’s attitude to risk (γ) and
investment horizon (through C), help determine the optimal holdings of assets one and two.
Proposition 1 implies that the riskless arbitrage strategy of going long and short in the same
number of shares is almost never optimal. To quantify the magnitude of deviations from the
riskless arbitrage strategy, we define the mismatch index, MIt,
MIt ≡|N∗1t +N∗
2t||N∗1t|
,
where N∗it = φ∗it/Pit, i = 1, 2, denotes the optimal number of shares of asset i. The index can
be rewritten in terms of portfolio weights:
MIt =|φ∗1t + φ∗2te
xt ||φ∗1t|
.
For the riskless arbitrage strategy, long and short positions are held simultaneously and φ∗1t =
−φ∗2t so the index equals zero only provided that xt = 0, i.e., P1t = P2t. This is an extremely
unlikely event in our model.
To gain economic intuition for Proposition 1, we next consider the special cases from Section
2.
3.1 One Mispriced Asset
Consider the scenario in which one of the assets is mispriced (λ1 > 0) while the other is correctly
priced (λ2 = 0) and unaffected by the error correction term. Except for the impact of the error-
correction term, both assets are identical. They share the same exposure to both market and
common idiosyncratic risk and have the same idiosyncratic volatility. The optimal portfolio
weights are then reduced to⎛⎝ φ∗1t
φ∗2t
⎞⎠ =ln³P1tP2t
´γ
⎛⎝−⎛⎝ σ2 + b2
−σ2
⎞⎠ λ1(2σ2 + b2)b2
+
⎛⎝ 1
−1
⎞⎠C
⎞⎠ . (12)
Terms proportional to C are the intertemporal hedging demands that generate horizon de-
pendence in the portfolio weights. For γ > 1, C is negative and its magnitude increases with
the horizon T − t.
Since there is no mispricing in asset two, one might expect that its portfolio weight should
be zero. This is true only if σ = 0, which implies that idiosyncratic returns on assets one and
two are completely independent. In this case asset two is dominated by the market index and
will not be held. Conversely, when σ > 0, the optimal portfolio weight of asset two is not zero
because this asset can be used to hedge idiosyncratic risk that is common to assets one and two.
10
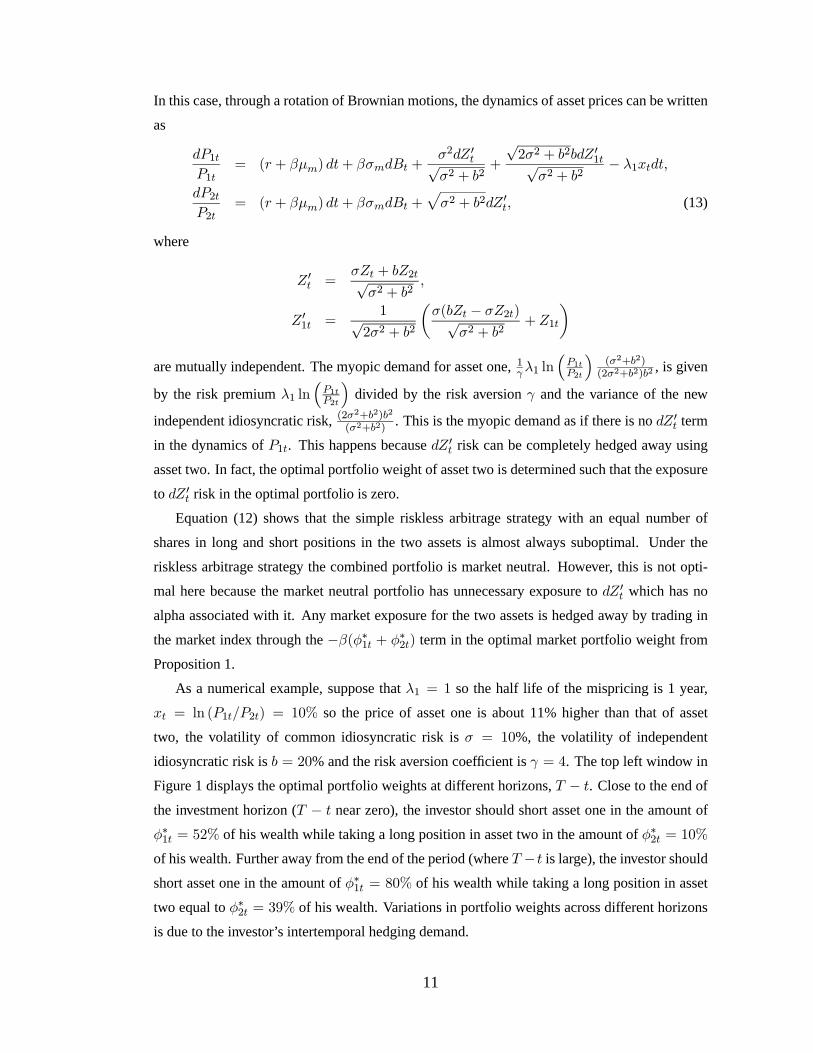
In this case, through a rotation of Brownian motions, the dynamics of asset prices can be written
as
dP1tP1t
= (r + βμm) dt+ βσmdBt +σ2dZ 0t√σ2 + b2
+
√2σ2 + b2bdZ 01t√
σ2 + b2− λ1xtdt,
dP2tP2t
= (r + βμm) dt+ βσmdBt +pσ2 + b2dZ 0t, (13)
where
Z 0t =σZt + bZ2t√
σ2 + b2,
Z 01t =1√
2σ2 + b2
µσ(bZt − σZ2t)√
σ2 + b2+ Z1t
¶are mutually independent. The myopic demand for asset one, 1γλ1 ln
³P1tP2t
´(σ2+b2)(2σ2+b2)b2
, is given
by the risk premium λ1 ln³P1tP2t
´divided by the risk aversion γ and the variance of the new
independent idiosyncratic risk, (2σ2+b2)b2
(σ2+b2) . This is the myopic demand as if there is no dZ 0t term
in the dynamics of P1t. This happens because dZ 0t risk can be completely hedged away using
asset two. In fact, the optimal portfolio weight of asset two is determined such that the exposure
to dZ 0t risk in the optimal portfolio is zero.
Equation (12) shows that the simple riskless arbitrage strategy with an equal number of
shares in long and short positions in the two assets is almost always suboptimal. Under the
riskless arbitrage strategy the combined portfolio is market neutral. However, this is not opti-
mal here because the market neutral portfolio has unnecessary exposure to dZ 0t which has no
alpha associated with it. Any market exposure for the two assets is hedged away by trading in
the market index through the −β(φ∗1t + φ∗2t) term in the optimal market portfolio weight from
Proposition 1.
As a numerical example, suppose that λ1 = 1 so the half life of the mispricing is 1 year,
xt = ln (P1t/P2t) = 10% so the price of asset one is about 11% higher than that of asset
two, the volatility of common idiosyncratic risk is σ = 10%, the volatility of independent
idiosyncratic risk is b = 20% and the risk aversion coefficient is γ = 4. The top left window in
Figure 1 displays the optimal portfolio weights at different horizons, T − t. Close to the end of
the investment horizon (T − t near zero), the investor should short asset one in the amount of
φ∗1t = 52% of his wealth while taking a long position in asset two in the amount of φ∗2t = 10%
of his wealth. Further away from the end of the period (where T − t is large), the investor should
short asset one in the amount of φ∗1t = 80% of his wealth while taking a long position in asset
two equal to φ∗2t = 39% of his wealth. Variations in portfolio weights across different horizons
is due to the investor’s intertemporal hedging demand.
11

The top left window of Figure 2 plots the MI index under this scenario. At the shortest
horizon the index is 0.7 and it declines smoothly to around 0.4 at the longest horizon. In this
case, the role of asset two is to hedge away common idiosyncratic risk and the investor is always
shorting more shares of asset one than he is buying shares of asset two.
3.2 One Underpriced and one Overpriced Asset
Next consider the case where λ1 = λ2 ≡ λ > 0. Both asset one and asset two are now mispriced
because error-correction terms are present in the dynamics of both P1t and P2t. While one asset
is overpriced, the other is underpriced. For example, if xt > 0, asset one has a negative alpha
(-λxt) and thus is overpriced while asset two has a positive alpha (λxt) and thus is underpriced.
In this case the optimal portfolio weights simplify to⎛⎝ φ∗1t
φ∗2t
⎞⎠ =
⎛⎝ −³ λγb2− C
γ
´³λγb2 −
Cγ
´ ⎞⎠ lnµP1tP2t
¶. (14)
Consider the first term of φ∗1t, i.e.,−λ ln (P1t/P2t) /γb2.9 The risk premium is−λ ln (P1t/P2t),γ is the risk aversion and b2 is the variance of the independent idiosyncratic risk. This is there-
fore the investor’s myopic demand as if there is no common idiosyncratic risk. The common
idiosyncratic risk, Z, does not matter here because it cancels out and only the independent idio-
syncratic risk components remain.
The second term of φ∗1t, C ln (P1t/P2t) /γ, is the investor’s intertemporal hedging demand
which takes into account that the risk premium, −λ ln (P1t/P2t), is time-varying. This term
introduces a horizon dependence in the portfolio weight. For γ > 1, C can be shown to be
negative and its magnitude increases with the horizon. Thus, when γ > 1 the intertemporal
hedging demand has the same sign as the myopic demand and the magnitude of the portfolio
weight increases with the horizon. In this case, φ∗1t < 0 if and only if P1t > P2t. Hence, the
investor will short asset one when it is overvalued relative to asset two, and vice versa. This
results is quite intuitive.
Because φ∗1t = −φ∗2t, the dollar value and portfolio weight of asset one is of equal magnitude
but of the opposite sign to that of asset two. However, because φ∗it = N∗itPit, in general N∗
1t 6=N∗2t, and the number of shares in the long position differs from the number of shares in the short
position and so the liability associated with the short position may not be fully offset.
Returning to our numerical example, suppose that λ = 1, so the half life of any mispricing
is one year, and assume again that ln (P1t/P2t) = 10%, while the remaining parameters are
9 Because φ∗1t = −φ∗2t, we focus only on φ∗1t.
12

unchanged. The top right window in Figure 1 shows that when the horizon, T − t, is near zero,
the investor should short asset one in an amount that is 63% of his wealth. When the horizon is
long (T − t is large), the investor should short asset one in an amount that is 114% of his wealth.
The difference between 114% and 63% is due to the intertemporal hedging demand, which has
been extensively discussed in the literature, see, e.g., Liu (2007). Since we can show that the
magnitude of C declines as the horizon decreases, the investor should monotonically reduce his
asset holding to the position of the myopic demand as the investment horizon is reduced.
The top right window in Figure 2 shows that the mismatch index, MIt, is just under ten
percent and does not vary with the investment horizon. The reason why the index does not equal
zero in this case is because the two asset prices are not identical, i.e., P1t 6= P2t. Hence, whereas
the value of the optimal holdings of assets one and two are identical, φ∗1t = φ∗2t, the number of
shares in the two assets need not be identical, i.e., N∗1t 6= N∗
2t.
3.3 Two Underpriced (Overpriced) Assets
For the case in which both assets are underpriced (xt > 0, λ > 0, 0 < θ < 1 in equation (9)),
the bottom left window in Figure 1 illustrates some interesting dynamics in asset holdings. We
assume that xt = 10%, λ = 1, and θ = 1/2. Otherwise the parameter values are identical to
before. At short horizons, the optimal portfolio is long in both assets (16% in asset one and 47%
in asset two) even though asset two is relatively more underpriced because it has a higher alpha.
In contrast, one asset would be held in a short position under the riskless arbitrage strategy. In
the short run, time is too scarce for the arbitrage mechanism to be effective, and the investor
will only focus on the absolute mispricing and so holds positive amounts in both assets. At
long horizons, as x is expected to revert to zero, the optimal portfolio is long in the relatively
more underpriced asset (asset two, which gains a weight of 80%) and short in the relatively less
underpriced asset (asset one, which gains a weight of -18%) and so relative mispricing plays a
key role.
The bottom right window of Figure 1 covers the case where the two assets are both over-
priced and assumes that xt = −10%, λ = 1, and θ = 0.95. At horizons approaching zero, both
assets are sold short (the positions in assets one and two are -40% and -42%, respectively). Con-
versely, at the longest horizon, asset two, which is both overpriced in an absolute and a relative
sense, is shorted by -93%, while asset one (which is relatively underpriced) is held long by an
amount equal to 12% of the investor’s wealth.
The bottom windows in Figure 2 plot the mismatch index for the cases with simultaneously
under- or overpriced assets. The plots show that the ratio of the optimal number of shares
in assets one and two can get arbitrarily large. This result arises because the position in the
13

numerator asset in the mismatch index can get very close to zero while the sum of the asset
positions differs from zero. In such cases, the balanced riskless arbitrage strategy is particularly
suboptimal.
These counterintuitive results, in which the sign of the optimal asset position can differ at
short and long investment horizons, only occur in a multiperiod model and will not happen in
the static mean-variance setting of Markowitz.
4 Utility loss from suboptimal strategies
We next address the size of the economic loss associated with suboptimal market neutral strate-
gies. We first provide a simple result for computing the wealth gain of the optimal investment
strategy relative to a suboptimal strategy of fixing the portfolio weights. We then show how to
compute the moments of the returns for the optimal (unconstrained) and market neutral strate-
gies.
4.1 Constrained Arbitrage Strategies
Many popular investment strategies assume that individual assets have constant relative weights.
In this section, we study investors’ optimal strategy under such a constraint which takes the form
φ1t = −κφ2t. Liu and Longstaff (2004) and Liu, Peleg, and Subrahmanyam (2006), among
others, directly specify the dynamics of the difference in asset prices and so one can view the
strategies studied in these papers to assume that κ = 1. Notice that unless xt = 0, this is slightly
different from the riskless arbitrage strategy which sets N1t = −N2t. Under fixed relative
weight constraints, the wealth dynamics is given by
dWt =Wt
µrdt+ φmt
µdPmt
Pmt− rdt
¶+ φ1t
µdP1tP1t− rdt
¶− κφ1t
µdP2tP2t− rdt
¶¶.
(15)
The optimal portfolio weights are given by the following proposition:
Proposition 2 The optimal portfolio weights under the fixed relative weight constraint φ1t =
−κφ2t are
φ∗mt =
μmγσ2m
− (1− κ)βφ∗1;
φ∗1t =
−(λ1 + κλ2) ln³P1tP2t
´+ (1 + κ)b2C ln
³P1tP2t
´γ³σ2(1− κ)2 + b2(1 + κ2)
´ .
Here C is a function of time t only and satisfies a system of ordinary differential equations
(ODEs) which is given in Appendix B.
14

Proposition 2 is a special case of a more general multivariate result (Proposition 6) which
is proved in Appendix B. Our first example of a constant relative portfolio weight scheme is
the market neutral strategy which sets κ = 1, i.e. φ1t = −φ2t, so φ1t + φ2t = 0. As pointed
out by Gatev et al. (2006), and confirmed empirically by these authors, paired stocks are often
selected to be market neutral. Under the market neutral strategy, the optimal portfolio weights
are characterized in closed form as follows:
Corollary 1 The optimal portfolio weights under the market neutral strategy (φ1t + φ2t = 0)
are
φ∗mt =
μmγσ2m
,
φ∗1t =
−(λ1 + λ2) ln³P1tP2t
´+ 2b2C ln
³P1tP2t
´2γb2
.
This is a popular investment strategy that is clearly not always optimal. If the investor really
prefers a market-neutral portfolio, it can be better obtained by combining the optimal individual
asset portfolio with the market index. Such a “market layover” strategy can potentially improve
the performance of the combined portfolio.
To gain intuition, consider again the case with mispricing only in asset one (λ1 = 1, λ2 = 0).
For this case we expect that the magnitude of the myopic demand for asset one in the uncon-
strained optimal portfolio exceeds that under the constrained optimal portfolio. To see why, no-
tice that shocks to asset one have two components: one that is perfectly correlated with shocks
to asset two (Zt) and one that is independent of shocks to this asset (Z1t). The unconstrained
allocation ensures that the perfectly correlated shock is completely hedged by taking an appro-
priate position in asset two. Hence the unconstrained optimal holding is determined by the risk
premium and the variance of the independent shock.
The portfolio constrained to have, say, suboptimal relative weights (1,-1), earns the same risk
premium as asset one because the risk premium of asset two is zero (λ2 = 0). Furthermore, the
size of the independent shock to asset two is the same as that for asset one, but is not completely
hedged. Thus the suboptimal portfolio earns the same risk premium but at a higher risk and so
the investor will hold less of asset one under the constrained strategy.
By the same token, because the unconstrained portfolio has the same risk premium as the
constrained portfolio but also has lower risk, for the intertemporal hedging demand the investor
would take a larger position in the unconstrained portfolio.
15

4.2 Wealth Gains
Differences between the optimal and suboptimal trading strategies, while interesting in their
own right, are not of economic significance unless we can demonstrate that they lead to sizeable
economic losses for sensible choices of parameter values. The following proposition allows us
to compare the wealth under the two investment strategies:
Proposition 3 The wealth gain of the optimal strategy over the constant relative weight strategy
assuming a given mispricing of x is
R = e1
1−γ ((A−A)+12x0(C−C)x).
Using this result, it is easy to assess the investor’s utility loss. Figure 3 shows the outcome of
an analysis using the parameter values from the four mispricing scenarios when the benchmark is
the optimal market neutral strategy which we compare to the unconstrained optimal strategy. We
plot the percentage loss in wealth from imposing the market neutrality constraint. In the scenario
with mispricing only in asset one, the loss in wealth rises from zero to more than four percent
at the one-year horizon. Under symmetric mispricing in both assets, the market neutral strategy
is optimal and so the loss in wealth is zero at all horizons. In the case with two underpriced
assets, the loss in wealth at the one-year horizon exceeds 10%, while in the scenario with two
overpriced assets it is 20% at the one-year horizon. These are substantial losses even for a 10%
mispricing and will of course grow even larger, the greater the initial mispricing.
A more comprehensive analysis is shown in Table 1 which reports the wealth gain as a
function of both x and T−t. Gains grow monotonically as a function of x and T−t and increase
from zero to over one hundred percent as we move from short horizons with little mispricing
(x = 0, T − t = 0) to longer horizons with greater mispricing (x = 0.5, T − t = 1). This
illustrates the potentially very large economic losses associated with imposing market neutrality
rather than using the optimal arbitrage strategy.
4.3 Moments of the Return Distribution
Moments of the return distributions associated with the optimal unconstrained or constrained
strategies provide another useful measure for evaluating how desirable the return properties are
for alternative investment strategies. For example, under standard risk aversion (Kimball, 1993),
investors prefer returns with a higher mean and a larger (more positive) skewness, while they
dislike variance and kurtosis (fat tails). The next proposition shows how to compute the moments
of the returns for the optimal (unconstrained) and the optimal market neutral strategies:
16

Proposition 4 The moments of the returns of the optimal trading strategy and the optimal mar-
ket neutral trading strategy are
E0[(W∗T/W0)
q] = ed(t)+12x0g(t)x
and
E0[(WT/W0)q] = ed(t)+
12x0g(t)x,
respectively, where d(t), g(t), d(t) and g(t) are defined in Appendix C.
This result, which is proved in Appendix C, allows us to evaluate all the moments of the
terminal wealth or, equivalently, the cumulated return distribution and hence provides a complete
characterization of the returns associated with a particular investment strategy. For example, for
a given investment horizon, T−t, expected returns (the first moment) can be computed by setting
q = 1, while risk is characterized by the standard deviation of returns which can be computed
as a by-product of the moments evaluated at q = 1 and q = 2.
An implication of Proposition 4 is that returns on the optimal unconstrained portfolio always
have a higher mean and a higher variance than returns on the optimal constrained portfolio. Table
2 provides a numerical illustration of these results by presenting moments of returns as a function
of x and T − t for both the optimal and the constrained strategy. The same parameter values as
in the earlier case with mispricing only in asset one are assumed here. Higher mispricing or a
longer investment horizon leads to higher expected returns for both the optimal and constrained
strategies, with the expected return differential increasing as x or T − t rises. A parallel pattern
is seen for the standard deviation of returns. Consistent with theory, both the mean and standard
deviation are higher for the optimal than for the constrained portfolio. Moreover, the Sharpe
ratio rises from about 0.2 to around 2 as x or T − t increase and is almost always higher for the
optimal than for the constrained portfolio strategy.
The coefficient of skew is always negative for the constrained portfolios while it turns pos-
itive for the unconstrained portfolio at long horizons, particularly when x is large. Except for
when x and T − t are both very small, the constrained portfolio is more left-skewed than the
optimal portfolio, making the optimal portfolio more desirable. Finally, both portfolios gener-
ate returns with a large positive coefficient of kurtosis, indicating fat tails, although there is no
particular pattern in the relative kurtosis of the two portfolios.
These results show that the optimal (unconstrained) portfolio has higher expected returns,
higher standard deviation and (in most cases) a higher skew than the optimal market-neutral
portfolio.
17

5 Generalization to Multiple Risk Factors and Multiple
Assets
To gain intuition for the portfolio choice problem in the presence of mean-reverting mispricing
and cointegrated asset prices, we have so far focused on the case with one common risk factor
and two risky assets. In the interest of establishing generality of our results, we next consider
the case with many risk factors and multiple assets. This framework allows for the possibility
that there may be more than just a single co-integrating vector and so there can also be multiple
error-correction terms that affect the dynamics of any mispricing.
Suppose that there are K common risk factors and K factor assets trading at prices P kmt,
k = 1, ...,K. In a direct generalization of (1), the dynamics of the prices of these common
factor assets is given by
dP kmt
P kmt
= (r + μkm)dt+ (σmdBmt)k, k = 1, ...,K, (16)
where μm is a constant K × 1 vector and σm is a K ×K constant matrix; dBmt is a vector of
standard Brownian motions of dimension K × 1. A superscript on a vector indicates the k0th
element.
Moreover, as a generalization of (2) and (3) we assume that there are N individual assets
with prices (for i = 1, ...,N )
dP it
P it
= (r + (βμm)i)dt+ (βσmdBmt)
i + (σdBt)i + (bdZt)
i − (λxt)idt. (17)
Here β is an N ×K matrix, σ is an N ×m matrix (m < N), b is a diagonal N ×N matrix, λ
is an N × h matrix. Bt is an m-dimensional standard Brownian motion; for each i = 1, ..., N ,
Zit is a one-dimensional standard Brownian motion. All Brownian motions, Bmt, Bt, and Zi
t ,
i = 1, ...,N , are independent of each other. Let α denote the h × N dimensional matrix of
cointegrating vectors, where h ≤ N gives the number of cointegrating vectors.10 Then xt =
α lnPt is an h-dimensional process of pricing errors which satisfies
dxt = (μx − λxxt)dt+ βxσmdBmt + σxdBt + bxdZt, (18)
10 In the earlier analysis we always assume that α = (1,−1).
18

where
μx = α(r + βμm)−1
2αD(βσmσ0mβ0 + σσ0 + bb0);
λx = αλ;
βx = αβ; (19)
σx = ασ;
bx = αb.
The notation D denotes the vector of the diagonal elements of a square matrix. The wealth
process for this general case is now given by
dWt =Wt
³(r+φ0mμm+φ
0(βμm−λxt))dt+φ0mσmdBmt+φ0βσmdBmt+φ
0σdBt+φ0bdZt
´.
Once again λx must satisfy conditions ensuring that xt is stationary, i.e., the eigenvalues of αλ
must be negative.
As before, the value function J(xt,Wt, t) takes the form
J(xt,Wt, t) =1
1− γEt
hW ∗1−γ
T
i,
where W ∗T is the wealth at time T associated with the optimal trading strategy.
The following proposition, which generalizes Proposition 1, gives the optimal portfolio
weights for the general case with multiple risk factors and multiple assets:
Proposition 5 The optimal portfolio weights with multiple common factors and risky assets are
φ∗mt + β0φ∗t =1
γ(σmσ
0m)−1μm +
β0x(B + Cα lnPt)
γ;
φ∗t =1
γ
³σσ0 + bb0
´−1³− λα lnPt + (σσ
0x + bb0α)(B + Cα lnPt)
´.
where B and C are an h× 1 dimensional vector function and an h× h dimensional symmetric
matrix function of time t respectively. They satisfy a system of Riccati ODEs given in Appendix
A.
Proposition 5 is proved in Appendix A. The first term in the expression for φ∗mt is again the
weight from the standard mean-variance case, while the second term represents the intertemporal
hedging demand. Turning to the expression for φ∗t , as in the earlier case with two risky assets,
the optimal demand for the risky assets can be decomposed into a myopic mean-variance portion
and an intertemporal hedging portion.
Finally, as a generalization of Proposition 2 we derive the optimal portfolio weights under
the fixed constant relative weights constraint, φ0κ = 0 :
19

Proposition 6 Under the constraint κ0φt = 0, the optimal portfolio weights with multiple com-mon factors and risky assets are
φ∗mt + β0φ
∗t =
1
γ(σmσ
0m)−1(μm + σmσ
0mβ
0x(B + Cα lnPt))
φ∗t =
1
γ(σσ0 + bb0)−1
³I − κ(κ0(σσ0 + bb0)−1κ)−1κ0(σσ0 + bb0)−1
´×³− λα lnPt + (σσ
0 + bb0)α0(B + Cα lnPt)´,
where B and C are an h× 1 dimensional vector function and an h× h dimensional symmetric
matrix function of time t, respectively. These functions satisfy a system of Riccati ODEs given in
Appendix B.
Proposition 6, which is proved in Appendix B, provides a closed-form expression for the
optimal portfolio holdings subject to the constraint that the relative weights are kept constant
through time. While the intuition for the expression is more complicated than that for Proposi-
tion 2, the components of the two expressions are very similar.
6 Conclusion
This paper studies optimal arbitrage strategies. Academic studies and industry practitioners have
generally used the very restrictive riskless arbitrage strategy which is designed to offset future
liabilities with certainty at a known future point in time. We show that this is not an optimal
strategy under risky arbitrage. We model risky arbitrage through a continuous time model with
cointegrated asset prices, derive the closed-form optimal strategy and show that it can generate
economically significant improvement in expected utility over the riskless arbitrage strategy.
The source of mispricing turns out to be important for the optimal strategy under risky arbi-
trage. At short horizons, absolute mispricing (alpha) determines the optimal investment, while
at long horizons relative pricing errors matter more. In some cases an underpriced asset, i.e., an
asset with a positive alpha, may be bought by investors with a short horizon but sold by investors
with a long investment horizon. This happens if the asset’s price is high relative to that of other
assets.
Our use of a cointegrated model for asset prices facilitates a closed-form characterization of
investors’ optimal trading strategies and thus provides a way to quantify the losses to investors
from using the riskless arbitrage strategy rather than the optimal strategy. However, it is impor-
tant to note that the suboptimality of the riskless arbitrage strategy holds more generally and is
not limited to the specific assumptions of our model.
20

AppendixThe general results on the optimal portfolio holdings are set out in Propositions 5 and 6, which we first
establish. Propositions 1 and 2 are special cases of these results and so we do not prove them separately
here.
A Proof of Proposition 5
We use the dynamic programming principle to solve the optimization problem in Proposition 5. To thisend we define the value function J(xt,Wt, t)
J(xt,Wt, t) =1
1− γEt
hW ∗1−γT
i,
where W ∗T is the wealth at time T associated with the optimal investment strategy. The dynamic pro-gramming principle implies that the value function J satisfies the multivariate HJB equation
0 = max Jt + (μx − λxx)0Jx +
1
2Tr³(βxσmσ
0mβ
0x + σxσ
0x + bxb
0x)Jxx0
´+³r + φ0mμm + φ0(βμm − λx)
´WJW
+³βxσmσ
0m(φm + β0φ) + σxσ
0φ+ αbb0φ´0WJxW
+1
2
³(φ0m + φ0β)σmσ
0m(φm + β0φ) + φ0σσ0φ+ φ0bb0φ
´W 2JWW .
We conjecture thatJ(x,W, t) =
1
1− γW 1−γeA(t)+B(t)
0x+ 12x
0C(t)x,
where A(t), B(t), and C(t) are a scalar function, an h×1 vector function, and an h×h symmetric matrix
function of time t, respectively.Substituting this into the HJB equation, we obtain the following expression
0 = max At +B0tx+
1
2x0Ctx+ (μx − λxx)
0(B + Cx)
+1
2Tr³βxσmσ
0mβ
0x + σxσ
0x + bxb
0x)((B + Cx)(B + Cx)0 + C)
´+³r + φ0mμm + φ0(βμm − λx))
´(1− γ)
+³βxσmσ
0m(φm + β0φ) + σxσ
0φ+ αbb0φ´0(B + Cx)(1− γ)
+1
2
³(φ0m + φ0β)σmσ
0m(φm + β0φ) + φ0σσ0φ+ φ0bb0φ
´(−γ)(1− γ). (A-1)
The first order conditions for the optimal values of φm + β0φ and φ are
μm + σmσ0mβ
0x(B + Cx)− σmσ
0mγ(φm + β0φ) = 0;
−λx+³σσ0x + bb0α0
´(B + Cx)−
³σσ0 + bb0
´φγ = 0.
These form a system of linear equations in φm and φ that can be solved to get
φ∗m =1
γ(σmσ
0m)−1μm +
β0x(B + Cx)
γ− β0φ∗,
φ∗ =1
γ
³σσ0 + bb0
´−1³− λx+
³σσ0x + bb0α0
´(B + Cx)
´.
21

The optimal portfolio weights given in the proposition are obtained from this using that xt = α lnPt.Substituting the optimal portfolio weights into equation (A-1), we have
0 = At +B0tx+
1
2x0Ctx+ (μx − λxx)
0(B + Cx)
+1
2Tr³βxσmσ
0mβ
0x + σxσ
0x + bxb
0x)((B + Cx)(B + Cx)0 + C)
´+(1− γ)r +
(1− γ)
2γ
¡μm + σmσ
0mβ
0x(B + Cx)
¢0(σmσ
0m)−1 ¡μm + σmσ
0mβ
0x(B + Cx)
¢+(1− γ)
2γ
³− λx+ (σσ0x + bb0α0)(B + Cx)
´0(σσ0 + bb0)−1
³− λx+ (σσ0x + bb0α0)(B + Cx)
´.
This is a quadratic equation in x which must hold for all values of x. Thus, the coefficients of all powersof x should be zero, which leads to the following system of ODEs
0 = At + μ0xB +1
2Tr³(βxσmσ
0mβ
0x + σxσ
0x + bxb
0x)(BB
0 + C)´
+(1− γ)r +(1− γ)
2γ
¡μm + σmσ
0mβ
0xB¢0(σmσ
0m)−1 ¡μm + σmσ
0mβ
0xB¢
+(1− γ)
2γB0(σσ0x + bb0α0)0(σσ0 + bb0)−1(σσ0x + bb0α0)B;
0 = Bt + Cμx − λ0xB + C(βxσmσ0mβ
0x + σxσ
0x + bxb
0x)B
+(1− γ)
γCβx
¡μm + σmσ
0mβ
0xB¢
+(1− γ)
γ
³− λ+ (σσ0x + bb0α0)C
´0³σσ0 + bb0
´−1(σσ0x + bb0α0)B;
0 = Ct − (λ0xC + Cλx) + C³βxσmσ
0mβ
0x + σxσ
0x + bxb
0x
´C
+(1− γ)
γCβxσmσ
0mβ
0xC
+(1− γ)
γ
³− λ+ (σσ0x + bb0α0)C
´0³σσ0 + bb0
´−1³− λ+ (σσ0x + bb0α0)C
´.
The boundary conditions in this case are A(T ) = B(T ) = C(T ) = 0.
B Proof of Proposition 6
For the constrained strategy we have κ0φt = 0. Market neutral strategies arise as a special case whenκ = β. The HJB equation then reduces to
0 = max Jt + (μx − λxx)0Jx +
1
2Tr³(βxσmσ
0mβ
0x + σxσ
0x + bxb
0x)Jxx0
´+³r + (φm + β0φ)0μm − φ0λx
´WJW
+³βxσmσ
0m(φm + β0φ) + σxσ
0φ+ αbb0φ´0WJxW
+1
2
³(φm + β0φ)0σmσ
0m(φm + β0φ) + φ0σσ0φ+ φ0bb0φ
´W 2JWW − φ0κL,
where L is the Lagrangian multiplier for the constraint. We again conjecture that
J(x,W, t) =1
1− γW 1−γeA(t)+B(t)
0x+ 12x
0C(t)x,
22

where A(t), B(t), and C(t) are a scalar function, an h × 1 dimensional vector function, and an h × hdimensional symmetric matrix function of time t, respectively. Substituting this conjecture into the HJBequation, we get
0 = max At + B0tx+
1
2x0Ctx+ (μx − λxx)
0(B + Cx)
+1
2Tr³(βxσmσ
0mβ
0x + σxσ
0x + bxb
0x)(C + (B + Cx)(B + Cx)0)
´+³r + (φm + β0φ)0μm − φ0λx
´(1− γ)
+³βxσmσ
0m(φm + β0φ) + σxσ
0φ+ αbb0φ´0(1− γ)(B + Cx)
+1
2
³(φm + β0φ)0σmσ
0m(φm + β0φ) + φ0σσ0φ+ φ0bb0φ
´(−γ)(1− γ)− φ0κL. (B-2)
The first order conditions for the optimal φm + β0φ and φ are
μm + σmσ0mβ
0x(B + Cx)− γσmσ
0m(φm + β0φ) = 0;
−λx+³σσ0xφ+ bb0α0
´(B + Cx)− γ(σσ0 + bb0)φ− κL = 0.
Thus, the optimal φm + β0φ is given by
(φm + β0φ) =1
γ(σmσ
0m)−1(μm + σmσ
0mβ
0x(B + Cx))
while the optimal φ is
φ =1
γ(σσ0 + bb0)−1
³− λx+ (σσ0 + bb0)α0(B + Cx)− κL
´,
where L is the Lagrangian multiplier for the constraint κ0φt = 0. Using the constraint
0 = κ0(σσ0 + bb0)−1³− λx+ (σxσ
0 + αbb0)0(B + Cx)− κL´,
the Lagrangian multiplier can be obtained as
L = (κ0(σσ0 + bb0)−1κ)−1κ0(σσ0 + bb0)−1³− λx+ (σxσ
0 + αbb0)0(B + Cx)´.
The optimal constrained portfolio weight φ is
φ =1
γ(σσ0 + bb0)−1
³I − κ(κ0(σσ0 + bb0)−1κ)−1κ0(σσ0 + bb0)−1
´³− λx+ (σσ0 + bb0)α0(B + Cx)
´=
1
γ(σσ0 + bb0)−1(b+ C1x),
where the last equality defines b and C1:
b =³I − κ(κ0(σσ0 + bb0)−1κ)−1κ0(σσ0 + bb0)−1
´(σσ0 + bb0)α0B;
C1 =³I − κ(κ0(σσ0 + bb0)−1κ)−1κ0(σσ0 + bb0)−1
´³− λ+ (σσ0 + bb0)α0C
´.
Substituting the optimal portfolio weight back in equation (B-2), we get
0 = At + B0tx+
1
2x0Ctx+ (μx − λxx)
0(B + Cx)
+1
2Tr³(βxσmσ
0mβ
0x + σxσ
0x + bxb
0x)(C + (B + Cx)(B + Cx)0)
´+ r(1− γ)
+1− γ
2γ
³(μm + σmσ
0mβ
0x(B + Cx))0(σmσ
0m)−1(μm + σmσ
0mβ
0x(B + Cx))
+(b+ C1x)0(σσ0 + bb0)−1(b+ C1x)
´.
23

Comparing the coefficient of various powers of x, we get the following system of ODEs:
0 = At + μ0xB +1
2Tr³(βxσmσ
0mβ
0x + σxσ
0x + bxb
0x)(C + BB0)
´+ r(1− γ)
+1− γ
2γ
³(μm + σmσ
0mβ
0xB)
0(σmσ0m)−1(μm + σmσ
0mβ
0xB) + b0(σσ0 + bb0)−1b
´;
0 = Bt + Cμx − λ0xB + C(βxσmσ0mβ
0x + σxσ
0x + bxb
0x)B
+1− γ
γ
³Cβx(μm + σmσ
0mβ
0xB) + C1(σσ
0 + bb0)−1b´;
0 = Ct − (λ0xC + Cλx) + C(βxσmσ0mβ
0x + σxσ
0x + bxb
0x)C
+1− γ
γ
³Cβx(σmσ
0m)−1β0xC + C1(σσ
0 + bb0)−1C1´.
C Proof of Proposition 4
We are interested in deriving the moments of the portfolio return process. In the interest of establishinggeneral results, again we analyze the case with general values of β, σ, b and λ. Given portfolio weightprocesses (φmt, φt), the wealth process is
dWt =Wt
³(r + φ0mtμm + φ0t(βμm − λxt))dt+ (φ
0mt + φ0tβ)σmdBmt + φ0t(σdBt + bdZt)
´.
Using Ito’s lemma, we have
d lnWt = (r + φ0mtμm + φ0t(βμm − λxt))dt+ (φ0mt + φ0tβ)σmdBmt + φ0t(σdBt + bdZt)
−12((φ0mt + φ0tβ)σmσ
0m(φmt + β0φt) + φ0t(σσ
0 + bb0)φt)dt.
Thus,
W qT = W q
0 exp³Z T
0
q(r + (φ0mt + φ0tβ)μm − φ0tλxt)dt+ q(φ0mt + φ0tβ)σmdBmt + qφ0t(σdBt + bdZt)
−q2((φ0mt + φ0tβ)σmσ
0m(φmt + β0φt) + φ0t(σσ
0 + bb0)φt)dt´.
We are interested in characterizingE0 [W
qT ] .
Using Girsanov’s theorem, we can write
E0[WqT ] = W q
0E0
hexp
³Z T
0
q(r + φ0mtμm + φ0t(βμm − λxt))dt+ q(φ0mt + φ0tβ)σmdBmt + qφ0t(σdBt + bdZt)
−q2((φ0mt + φ0tβ)σmσ
0m(φmt + β0φt) + φ0t(σσ
0 + bb0)φt)dt´i
= W q0E
0
hexp
³Z T
0
q(r + (φ0mt + φ0tβ)μm − φ0tλxt)dt
+q2 − q
2((φ0mt + φ0tβ)σmσ
0m(φmt + β0φt) + φ0t(σσ
0 + bb0)φt)dt´i, (C-3)
where EQq denotes the expectation under the equivalent martingale measure specified by the followingRadon-Nykodym derivative with respect to the physical measure, P :
dQq
dP= exp
³Z T
0
q(φ0mt+φ0tβ)σmdBmt+qφ
0t(σdBt+bdZt)−
q2
2((φ0mt+φ
0tβ)σmσ
0m(φmt+β
0φt)+φ0t(σσ
0+bb0)φt)dt´.
24

The standard Brownian motions under the Qq measure are
dBQq
mt = dBmt − qσ0m(φmt + β0φt)dt;
dBQq
t = dBt − qσ0φtdt;
dZQq
t = dZt − qb0φtdt.
The dynamics of the mispricing component, x, is
dxt = (μx−λxxt+qβxσmσ0m(φmt+β0φt)+qσxσ
0φt+qbxb0φt)dt+βxσmdB
mt+σxdZQq
t +bxdZQq
xt .
Suppose that φmt and φt are affine functions of xt. Then the expectation in equation (C-3) is a functionof x0 and f(x, t). According to the Feynman-Kac formula, the function f(x, t) satisfies
0 = ft + (μx − λxx+ qβxσmσ0m(φm + β0φ) + qσxσ
0φ+ qbxb0φ)0fx +
1
2Tr£(βxσmσ
0mβ
0x + σxσ
0x + bxb
0x)fxx0
¤+q(r + (φ0m + φ0β)μm − φ0λx)f +
q2 − q
2((φ0m + φ0β)σmσ
0m(φm + β0φ) + φ0(σσ0 + bb0)φ)f. (C-4)
with f(x, T ) = 1. We use these results to derive the optimal strategies.
C.1 Optimal (unconstrained) Strategy
Substituting the optimal portfolio weights φ∗, φ∗m into (C-4), we get
0 = ft +
µμx − αλx+
q
γβxσmσ
0m
£(σmσ
0m)−1μm + β0x(B + Cx)
¤¶0fx
+
µq
γ[σxσ
0 + bxb0]³σσ0 + bb0
´−1³− λx+ (σσ0x + bb0α0)(B + Cx)
´¶0fx
+1
2Tr [α(βσmσ
0mβ + σσ0 + bb0)α0fxx0 ] + qrf
+q
γ
³(σmσ
0m)−1μm + β0x(B + Cx)
´0μmf
− q
γ
³− λx+ (σσ0x + bb0α0)(B + Cx)
´0³σσ0 + bb0
´−1λxf
+q2 − q
2γ2(μ0m(σmσ
0m)−1 + (B + Cx)0βx)σmσ
0m
£(σmσ
0m)−1μm + β0x(B + Cx)
¤f
+q2 − q
2γ2
³− λx+ (σσ0x + bb0α0)(B + Cx)
´0³σσ0 + bb0
´−1׳− λx+ (σσ0x + bb0α0)(B + Cx)
´f.
The coefficients are quadratic in x and we can conjecture that f(x; q) = ed(t)+h(t)0x+ 1
2x0g(t)x and derive
an ODE for d, h, and g. Substituting the functional form of f into the above equation, we get
25
0 = dt + h0tx+1
2x0gtx+
µμx − αλx+
q
γβxσmσ
0m
£(σmσ
0m)−1μm + β0x(B + Cx)
¤¶0(h+ gx)
+
µq
γ[σxσ
0 + bxb0]³σσ0 + bb0
´−1³− λx+ (σσ0x + bb0α0)(B + Cx)
´¶0(h+ gx)
+1
2Trhα(βσmσ
0mβ + σσ0 + bb0)α0
³(h+ gx)(h+ gx)0 + g
´i+ qr
+q
γ
³(σmσ
0m)−1μm + β0x(B + Cx)
´0μm −
q
γ
³− λx+ (σσ0x + bb0α0)(B + Cx)
´0³σσ0 + bb0
´−1λx
+q2 − q
2γ2
³μm + σmσ
0mβ
0x(B + Cx)
´0(σmσ
0m)−1³μm + σmσ
0mβ
0x(B + Cx)
´+q2 − q
2γ2
³− λx+ (σσ0x + bb0α0)(B + Cx)
´0³σσ0 + bb0
´−1³− λx+ (σσ0x + bb0α0)(B + Cx)
´.
Setting the coefficients of the various powers of x to zero, we get the following system of ODEs
0 = dt +
µμx +
q
γβx£μm + σmσ
0mβ
0xB¤¶0
h
+
µq
γα(σσ0 + bb0)α0B
¶0h
+1
2Trhα(βσmσ
0mβ
0 + σσ0 + bb0)α0³hh0 + g
´i+ qr
+q
γμ0m(σmσ
0m)−1³μm + σmσ
0mβ
0xB´
+q2 − q
2γ2
³μm + σmσ
0mβ
0xB´0(σmσ
0m)−1³μm + σmσ
0mβ
0xB´
+q2 − q
2γ2B0(σσ0x + bb0α0)0
³σσ0 + bb0
´−1(σσ0x + bb0α0)B.
0 = ht +
µ−αλ+ q
γβxσmσ
0mβ
0xC
¶0h+ g0
µμx +
q
γβxσmσ
0m[(σmσ
0m)−1μm + β0xB]
¶+
µq
γα³− λ+ (σσ0x + bb0α0)C
´¶0h
+g0q
γα(σσ0x + bb0α0)B
+g0α(βσmσ0mβ
0 + σσ0 + bb0)α0h
+q
γCαβμm −
q
γλ0³σσ0 + bb0
´−1³(σσ0x + bb0α0)B
´+q2 − q
γ2Cβx(μm + σmσ
0mβ
0xB)
+q2 − q
γ2
³− λ+ (σσ0x + bb0α0)C
´0³σσ0 + bb0
´−1(σσ0x + bb0α0)B.
26

0 = gt +
µ−αλ+ q
γβxσmσ
0mβ
0xC
¶0g + g0
µ−αλ+ q
γβxσmσ
0mβ
0xC
¶+q
γ
³− λ+ (σσ0x + bb0α0)C
´0α0g +
q
γg0α³− λ+ (σσ0x + bb0α0)C
´+g0α
³βσmσ
0mβ
0 + σσ0 + bb0´α0g +
2q
γλ0³σσ0 + bb0
´−1λ
− q
γ
³Cαλ+ λ0α0C
´+
q2 − q
γ2C0βx(σmσ
0m)β
0xC
+q2 − q
γ2
³− λ+ (σσ0x + bb0α0)C
´0³σσ0 + bb0
´−1³− λ+ (σσ0x + bb0α0)C
´.
The expected portfolio return is given by f(x; 1) and the variance of the portfolio return is given by
f(x; 2)− f2(x; 1). Higher order moments can be derived for other values of q in a similar manner.
C.2 Constrained Strategy
The constrained strategy satisfies κ0φt = 0. Equation (C-4) then becomes
0 = ft + (μx − λxx+ qβxσmσ0m(φm + β0φ) + qσxσ
0φ+ qbxb0φ)0fx +
1
2Tr£(βxσmσ
0mβ
0x + σxσ
0x + bxb
0x)fxx0
¤+q(r + (φm + β0φ)0μm − φ0tλx)f +
q2 − q
2((φm + β0φ)0σmσ
0m(φm + β0φ) + φ0(σσ0 + bb0)φ)f.
As we have show in the proof of Proposition 6, the optimal value of φm + β0φ is given by
(φm + β0φ) =1
γ(σmσ
0m)−1³μm + σmσ
0mβ
0x(B + Cx)
´.
and the optimal value of φ is
φ =1
γ(σσ0 + bb0)−1
³I − κ(κ0(σσ0 + bb0)−1κ)−1κ0(σσ0 + bb0)−1
´³− λx+ (σσ0 + bb0)α0(B + Cxt)
´=
1
γ(σσ0 + bb0)−1(b+ C1xt).
Using the equations for φm + β0φ, φ and λx, βx, σx, and bx, we get
0 = ft + (μx − λxx+ qβxσmσ0m(φm + β0φ) + qα(σσ0 + bb0))0fx +
1
2Tr£α(βσmσ
0mβ
0 + σσ0 + bb0)α0fxx0¤
+q(r + (φm + β0φ)μm − φ0λx)f +q2 − q
2
³σmσ
0m(φm + β0φ)2 + φ0(σσ0 + bb0)φ
´f.
Substituting φm and φ into the above equation, we get
0 = ft +
µμx − αλx+
qβxγ
³μm + σmσ
0mβ
0x(B + Cx)
´+
q
γα(b+ C1x)
¶0fx
+1
2Tr£α(βσmσ
0mβ
0 + σσ0 + bb0)α0fxx0¤
+
µqr +
q
γμ0m(σmσ
0m)−1³μm + σmσ
0mβ
0x(B + Cx)
´− q
γ(b+ C1x)
0(σσ0 + bb0)−1λx
¶f
+q2 − q
2γ2
³(μm + σmσ
0mβ
0x(B + Cx))0(σmσ
0m)−1(μm + σmσ
0mβ
0x(B + Cx))
+(b+ C1xt)0(σσ0 + bb0)−1(b+ C1x)
´f.
27

If we conjecture that f = ed(t)+h(t)0x+ 1
2x0g(t)x, we can write the ODE for d, h, and g. We get the
following PDE
0 = dt + h0tx+1
2x0gtx+
µμx − αλx+
qβxγ
³μm + σmσ
0mβ
0x(B + Cx)
´+
q
γα(b+ C1x)
¶0(h+ gx)
+1
2Trhα(βσmσ
0mβ
0 + σσ0 + bb0)α0³(h+ gx)(h+ gx)0 + g
´i+qr +
q
γμ0m(σmσ
0m)−1³μm + σmσ
0mβ
0x(B + Cx)
´− q
γ(b+ C1x)
0(σσ0 + bb0)−1λx
+q2 − q
2γ2
³³μm + σmσ
0mβ
0x(B + Cx)
´0(σmσ
0m)−1³μm + σmσ
0mβ
0x(B + Cx)
´+(b+ C1x)
0(σσ0 + bb0)−1(b+ C1x)´.
Furthermore, we get the following system of ODEs
0 = dt +
µμx +
qαβ
γ(μm + σmσ
0mβ
0α0B) +q
γαb
¶0h+
1
2Trhα(βσmσ
0mβ
0 + σσ0 + bb0)α0³hh0 + g
´i+qr +
q
γμ0m(σmσ
0m)−1³μm + σmσ
0mβ
0α0B´
+q2 − q
2γ2
µ³μm + σmσ
0mβ
0α0B´0(σmσ
0m)−1³μm + σmσ
0mβ
0α0B´+ b0(σσ0 + bb0)−1b
¶;
0 = ht +
µ−λ0α0 + q
γσmσ
0mC
0αββ0α0 +q
γC01α
0¶h+ g0
µμx +
q
γβx(μm + σmσ
0mβ
0xB) +
q
γαb
¶+g0α(βσmσ
0mβ
0 + σσ0 + bb0)α0h
+q
γC 0αβμm −
q
γλ0(σσ0 + bb0)−1b+
q2 − q
γ2
³Cαβ(μm + σmσ
0mβ
0α0B) + C 01(σσ0 + bb0)−1b
´;
0 = gt +
µ−αλ+ q
γβxσmσ
0mβ
0xC +
q
γαC1
¶0g + g0
µ−αλ+ q
γβxσmσ
0mβ
0xC +
q
γαC1
¶+g0α(βσmσ
0mβ
0 + σσ0 + bb0)α0g
− q
γ(C 01(σσ
0 + bb0)−1λ+ λ0(σσ0 + bb0)−1C1) +q2 − q
γ2
³Cαβ(σmσ
0m)β
0α0C + C 01(σσ0 + bb0)−1C1
´.
The expected portfolio return is given by f(x; 1) and the variance of the portfolio return is given by
f(x; 2)− f2(x; 1). Again generalizations to higher order moments are straightforward.
28

References
[1] Alexander, Carol, 1999, Optimal Hedging Using Cointegration, Philosophical Transactions of the
Royal Society, Series A, 357, 2039-2058.
[2] Bondarenko, Oleg, 2003, Statistical Arbitrage and Securities Prices. Review of Financial Studies
16, 875-919.
[3] Bossaerts, Peter and Richard Green, 1989, A General Equilibrium Model of Changing Risk Premia:
Theory and Evidence. Review of Financial Studies 2, 467-493.
[4] Brennan, Michael J. and Ashley Wang, 2006, Asset Pricing and Mispricing. UCLA working paper.
[5] Brenner, Robin J. and Kenneth F. Kroner, 1995, Arbitrage, Cointegration, and Testing the Un-
biasedness Hypothesis in Financial Markets. Journal of Financial and Quantitative Analysis 30,
23-42
[6] Chen, Zhiwu and Peter J. Knez, 1995, Measurement of Market Integration and Arbitrage. Review
of Financial Studies 8, 287-325.
[7] Dumas, Bernard, Alexander Kurshev and Raman Uppal, 2009, Equilibrium Portfolio Strategies in
the Presence of Sentiment Risk and Excess Volatility. Journal of Finance 64, 579-629.
[8] Engle, Robert F., and Clive W.J. Granger, 1987, Co-Integration and Error Correction: Representa-
tion, Estimation, and Testing. Econometrica 55, 251-276..
[9] Gatev, Evan, William N. Goetzmann and K. Geert Rouwenhorst, 2006, Pairs Trading: Performance
of a Relative-Value Arbitrage Rule. Review of Financial Studies 19, 797-827.
[10] Hasbrouk, Joel, 2003, Intraday Price Formation in U.S. Equity Index Markets. Journal of Finance
58, 2375-2399.
[11] Hogan, Steve, Robert Jarrow, Melvyn Teo and Mitch Warachka, 2004, Testing market efficiency
using statistical arbitrage with applications to momentum and value strategies. Journal of Financial
Economics 73, 525-565.
[12] Jurek, Jakub and Halla Yang, 2007, Dynamic Portfolio Selection in Arbitrage. Harvard University
working paper.
[13] Kimball, Miles S., 1993, Standard Risk Aversion. Econometrica 61, 589-611.
[14] Khandani, Amir E., and Andrew Lo, 2007, What Happened to the Quants in August 2007? Evi-
dence from Factors and Transactions Data. MIT Working paper.
[15] Kondor, Peter, 2009, Risk in Dynamic Arbitrage: Price Effects of Convergence Trading. Journal of
Finance 64(2), 638-658.
29

[16] Liu, Jun, 2007, Portfolio Selection in Stochastic Environments, Review of Financial Studies 20,
1-39.
[17] Liu, Jun and Francis Longstaff, 2004, Losing Money on Arbitrages: Optimal Dynamic Portfolio
Choice in Markets with Arbitrage Opportunities, Review of Financial Studies 17, 611-641.
[18] Liu, Jun, Ehud Peleg, and Avanidhar Subrahmanyam, 2006, The Value of Private Information.
Forthcoming in Journal of Financial and Quantitative Analysis.
[19] Mitchell, Mark, and Todd Pulvino, 2001, Characteristics of Risk and Return in Risk Arbitrage.
Journal of Finance 56, 2135-2175.
[20] Mitchell, Mark, Lasse H. Pedersen and Todd Pulvino, 2007, Slow Moving Capital. American Eco-
nomic Review 97, 215-220.
[21] Shleifer, Andrei and Robert W. Vishny, 1997, The Limits of Arbitrage. Journal of Finance 52,
35-55.
[22] Summers, Lawrence, 1986, Does the Stock Market Rationally Reflect Fundamental Values? Journal
of Finance 41, 591-601.
30

0 0.2 0.4 0.6 0.8 1−1
−0.8
−0.6
−0.4
−0.2
0
0.2
0.4
T − t
Asset 1 overpriced
0 0.2 0.4 0.6 0.8 1−1.5
−1
−0.5
0
0.5
1
1.5
T − t
Over− and underpriced assets
0 0.2 0.4 0.6 0.8 1−0.2
0
0.2
0.4
0.6
0.8
1
1.2
T − t
Both assets underpriced
0 0.2 0.4 0.6 0.8 1−1
−0.8
−0.6
−0.4
−0.2
0
0.2
0.4
T − t
Both assets overpriced
Figure 1: Optimal portfolio weights in asset one (marked by ‘o’) and asset two (marked by ‘x’)as a function of the investment horizon, T − t. The plots assume the following parameter values:σ = 10%, b = 20%, γ = 4. In the plot in which asset one is overpriced, xt = 10%, λ1 = 1, λ2 = 0.In the plot with over- and underpriced assets, xt = 10%, λ1 = λ2 = 1. In the plot with twounderpriced assets, xt = 10%, λ1 = −0.5, λ2 = 1. Finally, in the plot with two overpriced assets,xt = −10%, λ1 = −0.95, λ2 = 1.
31

0 0.2 0.4 0.6 0.8 10.4
0.45
0.5
0.55
0.6
0.65
0.7
0.75
T − t
Asset 1 overpriced
0 0.2 0.4 0.6 0.8 10.0952
0.0952
0.0952
0.0952
0.0952
0.0952
0.0952
T − t
Over− and underpriced assets
0 0.2 0.4 0.6 0.8 10
50
100
150
200
250
T − t
Both assets underpriced
0 0.2 0.4 0.6 0.8 10
20
40
60
80
100
120
T − t
Both assets overpriced
Figure 2: Mismatch index for different investment horizons, T − t. The plots assume the followingparameter values: σ = 10%, b = 20%, γ = 4. In the plot in which asset one is overpriced,xt = 10%, λ1 = 1, λ2 = 0. In the plot with over- and underpriced assets, xt = 10%, λ1 = λ2 = 1.In the plot with two underpriced assets, xt = 10%, λ1 = −0.5, λ2 = 1. Finally, in the plot with twooverpriced assets, xt = −10%, λ1 = −0.95, λ2 = 1.
32

0 0.2 0.4 0.6 0.8 10
1
2
3
4
5
T − t
Asset 1 overpriced
0 0.2 0.4 0.6 0.8 1−1
−0.5
0
0.5
1
T − t
Over− and underpriced assets
0 0.2 0.4 0.6 0.8 10
2
4
6
8
10
12
T − t
Both assets underpriced
0 0.2 0.4 0.6 0.8 10
5
10
15
20
T − t
Both assets overpriced
Figure 3: Expected percentage loss in wealth from using the market neutral investment strategyinstead of the optimal arbitrage strategy. The plots assume the following parameter values: σ =10%, b = 20%, γ = 4. In the plot in which asset one is overpriced, xt = 10%, λ1 = 1, λ2 = 0.In the plot with over- and underpriced assets, xt = 10%, λ1 = λ2 = 1. In the plot with twounderpriced assets, xt = 10%, λ1 = −0.5, λ2 = 1. Finally, in the plot with two overpriced assets,xt = −10%, λ1 = −0.95, λ2 = 1.
33

Table 1. Wealth gains for the optimal versus the constrained strategy
Asset 1 overpriced Over- and underpriced assets
horizon, x 0 0.1 0.2 0.3 0.4 0.5 0 0.1 0.2 0.3 0.4 0.5
0.1 0.04 0.14 0.45 0.96 1.68 2.61 - - - - - -
0.2 0.16 0.36 0.95 1.95 3.37 5.22 - - - - - -
0.3 0.36 0.64 1.51 2.97 5.06 7.80 - - - - - -
0.4 0.62 0.99 2.11 4.01 6.73 10.34 - - - - - -
0.5 0.95 1.40 2.76 5.07 8.39 12.81 - - - - - -
0.6 1.34 1.86 3.44 6.13 10.01 15.21 - - - - - -
0.7 1.78 2.37 4.15 7.19 11.60 17.53 - - - - - -
0.8 2.27 2.92 4.89 8.25 13.14 19.76 - - - - - -
0.9 2.81 3.51 5.65 9.31 14.65 21.89 - - - - - -
1 3.39 4.14 6.43 10.36 16.11 23.94 - - - - - -
Both assets underpriced Both assets overpriced
horizon, x 0 0.1 0.2 0.3 0.4 0.5 0 -0.1 -0.2 -0.3 -0.4 -0.5
0.1 0.09 0.32 1.02 2.20 3.86 6.05 0.16 0.55 1.75 3.78 6.69 10.55
0.2 0.37 0.83 2.21 4.56 7.95 12.46 0.63 1.43 3.84 8.00 14.10 22.46
0.3 0.82 1.50 3.56 7.09 12.23 19.21 1.42 2.61 6.27 12.66 22.25 35.79
0.4 1.45 2.34 5.06 9.77 16.70 26.27 2.53 4.12 9.03 17.75 31.13 50.59
0.5 2.24 3.34 6.71 12.58 21.34 33.61 3.94 5.93 12.13 23.26 40.74 66.90
0.6 3.20 4.50 8.50 15.52 26.12 41.18 5.68 8.06 15.55 29.21 51.07 84.71
0.7 4.31 5.81 10.43 18.59 31.03 48.97 7.72 10.51 19.31 35.57 62.11 104.01
0.8 5.57 7.26 12.49 21.77 36.06 56.92 10.08 13.27 23.40 42.34 73.84 124.78
0.9 6.99 8.86 14.67 25.05 41.18 65.01 12.75 16.34 27.82 49.52 86.23 146.96
1 8.54 10.59 16.97 28.43 46.38 73.21 15.74 19.73 32.57 57.11 99.26 170.48
Note: This table shows how the wealth gains (measured in percentage terms) depend on the size of the mispricing component (x)
and the length of the investment horizon (T). The following model is assumed:dPmtPmt
= (r + µm)dt+ σmdBt
dP1tP1t
= (r + βµm)dt+ βσmdBt + σdZt + bdZ1t − λ1xtdtdP2tP2t
= (r + βµm)dt+ βσmdBt + σdZt + bdZ2t + λ2xtdt
where β = 1, σ = 0.1, b = 0.2, µm = 0.06, r = 0.03, σm = 0.15, xt = 0.1. The coefficient of relative risk aversion is set at
γ = 4. Under mispricing only in asset 1, λ1 = 1, λ2 = 0. Under mispricing in both assets, λ1 = λ2 = 1. When both assets
are underpriced, λ1 = −0.5, λ2 = 1. When both assets are overpriced, λ1 = −0.95, λ2 = 1, and the sign of xt is reversed.
34

Table 2: Moments of returns for the optimal unconstrained and market neutral strategiesA. Mean return
optimal weights constrained weights
horizon, x 0 0.1 0.2 0.3 0.4 0.5 0 0.1 0.2 0.3 0.4 0.5
0.1 0.0090 0.0139 0.0285 0.0534 0.0893 0.1373 0.0082 0.0111 0.0199 0.0346 0.0556 0.0833
0.2 0.0217 0.0308 0.0585 0.1064 0.1772 0.2748 0.0187 0.0241 0.0405 0.0685 0.1090 0.1632
0.3 0.0377 0.0506 0.0902 0.1596 0.2642 0.4127 0.0311 0.0387 0.0620 0.1020 0.1606 0.2405
0.4 0.0566 0.0730 0.1235 0.2132 0.3508 0.5509 0.0452 0.0549 0.0844 0.1355 0.2110 0.3155
0.5 0.0784 0.0979 0.1587 0.2676 0.4374 0.6897 0.0610 0.0725 0.1077 0.1690 0.2605 0.3888
0.6 0.1027 0.1252 0.1957 0.3230 0.5244 0.8291 0.0783 0.0915 0.1320 0.2028 0.3095 0.4608
0.7 0.1295 0.1549 0.2345 0.3797 0.6121 0.9693 0.0970 0.1118 0.1572 0.2371 0.3583 0.5317
0.8 0.1586 0.1868 0.2753 0.4378 0.7007 1.1105 0.1171 0.1333 0.1834 0.2719 0.4069 0.6019
0.9 0.1901 0.2209 0.3181 0.4975 0.7904 1.2528 0.1384 0.1561 0.2106 0.3073 0.4557 0.6716
1 0.2239 0.2572 0.3628 0.5588 0.8815 1.3963 0.1610 0.1800 0.2388 0.3434 0.5048 0.7411
B. Standard deviation
optimal weights constrained weights
0.1 0.0383 0.0501 0.0761 0.1081 0.1448 0.1866 0.0358 0.0436 0.0617 0.0845 0.1102 0.1386
0.2 0.0605 0.0737 0.1055 0.1485 0.2020 0.2684 0.0548 0.0634 0.0848 0.1139 0.1488 0.1897
0.3 0.0800 0.0934 0.1281 0.1786 0.2457 0.3347 0.0709 0.0794 0.1019 0.1342 0.1750 0.2254
0.4 0.0981 0.1115 0.1481 0.2045 0.2836 0.3941 0.0853 0.0935 0.1161 0.1502 0.1953 0.2533
0.5 0.1153 0.1287 0.1668 0.2285 0.3187 0.4503 0.0986 0.1065 0.1289 0.1641 0.2123 0.2765
0.6 0.1320 0.1456 0.1852 0.2517 0.3527 0.5051 0.1112 0.1188 0.1408 0.1767 0.2275 0.2971
0.7 0.1485 0.1623 0.2036 0.2749 0.3865 0.5597 0.1231 0.1305 0.1523 0.1888 0.2417 0.3160
0.8 0.1651 0.1792 0.2222 0.2985 0.4206 0.6148 0.1347 0.1419 0.1636 0.2005 0.2554 0.3340
0.9 0.1818 0.1964 0.2413 0.3226 0.4554 0.6709 0.1460 0.1531 0.1748 0.2123 0.2691 0.3517
1 0.1989 0.2140 0.2610 0.3474 0.4912 0.7283 0.1572 0.1643 0.1860 0.2242 0.2829 0.3695
C. Sharpe ratio
optimal weights constrained weights
0.1 0.1569 0.2164 0.3354 0.4664 0.5963 0.7199 0.1454 0.1858 0.2731 0.3740 0.4773 0.5791
0.2 0.2593 0.3363 0.4979 0.6763 0.8474 1.0015 0.2306 0.2849 0.4066 0.5486 0.6918 0.8286
0.3 0.3579 0.4445 0.6333 0.8426 1.0383 1.2060 0.3106 0.3737 0.5201 0.6931 0.8659 1.0268
0.4 0.4544 0.5463 0.7529 0.9834 1.1943 1.3672 0.3887 0.4578 0.6230 0.8214 1.0184 1.1982
0.5 0.5486 0.6432 0.8606 1.1050 1.3249 1.4980 0.4655 0.5389 0.7186 0.9380 1.1558 1.3513
0.6 0.6402 0.7354 0.9584 1.2111 1.4353 1.6055 0.5413 0.6176 0.8082 1.0451 1.2806 1.4899
0.7 0.7288 0.8232 1.0478 1.3040 1.5288 1.6939 0.6159 0.6940 0.8927 1.1437 1.3944 1.6155
0.8 0.8139 0.9066 1.1296 1.3856 1.6082 1.7667 0.6891 0.7683 0.9726 1.2346 1.4980 1.7292
0.9 0.8953 0.9855 1.2045 1.4574 1.6755 1.8265 0.7607 0.8404 1.0482 1.3183 1.5919 1.8317
1 0.9728 1.0599 1.2733 1.5207 1.7326 1.8753 0.8307 0.9102 1.1198 1.3955 1.6767 1.9234
D. Skew
optimal weights constrained weights
0.1 -0.2210 -0.5103 -0.4350 -0.2312 -0.0441 0.1189 -0.1514 -0.5068 -0.5878 -0.4380 -0.2668 -0.1126
0.2 -0.3375 -0.5174 -0.4655 -0.2586 -0.0459 0.1490 -0.2948 -0.5787 -0.7060 -0.5750 -0.3856 -0.2014
0.3 -0.3561 -0.4607 -0.4195 -0.2326 -0.0216 0.1812 -0.3686 -0.5861 -0.7356 -0.6453 -0.4680 -0.2795
0.4 -0.3295 -0.3853 -0.3429 -0.1769 0.0233 0.2238 -0.4010 -0.5689 -0.7239 -0.6752 -0.5230 -0.3434
0.5 -0.2813 -0.3050 -0.2549 -0.1048 0.0829 0.2770 -0.4090 -0.5405 -0.6909 -0.6773 -0.5547 -0.3914
0.6 -0.2226 -0.2249 -0.1648 -0.0248 0.1515 0.3381 -0.4022 -0.5066 -0.6469 -0.6601 -0.5667 -0.4235
0.7 -0.1594 -0.1472 -0.0771 0.0572 0.2246 0.4042 -0.3863 -0.4701 -0.5976 -0.6294 -0.5625 -0.4403
0.8 -0.0948 -0.0727 0.0062 0.1380 0.2988 0.4725 -0.3646 -0.4326 -0.5464 -0.5897 -0.5451 -0.4433
0.9 -0.0305 -0.0019 0.0842 0.2153 0.3717 0.5407 -0.3392 -0.3949 -0.4952 -0.5446 -0.5178 -0.4345
1 0.0324 0.0653 0.1567 0.2881 0.4416 0.6071 -0.3116 -0.3574 -0.4451 -0.4966 -0.4831 -0.4160
E. Kurtosis
optimal weights constrained weights
0.1 3.2951 3.9161 3.4520 3.0909 2.9615 2.9669 3.4148 3.9135 3.5912 3.1735 2.9492 2.8590
0.2 3.8821 4.1677 3.6592 3.1836 2.9858 2.9810 3.7344 4.2009 3.9251 3.3548 2.9801 2.7956
0.3 3.9945 4.1621 3.7618 3.2943 3.0722 3.0596 3.9077 4.2676 4.0890 3.5078 3.0502 2.7875
0.4 3.9918 4.0964 3.8085 3.4041 3.1926 3.1845 3.9736 4.2424 4.1475 3.6237 3.1363 2.8182
0.5 3.9552 4.0277 3.8348 3.5131 3.3349 3.3441 3.9803 4.1798 4.1423 3.7009 3.2218 2.8717
0.6 3.9156 3.9745 3.8597 3.6240 3.4928 3.5297 3.9554 4.1037 4.1006 3.7433 3.2967 2.9354
0.7 3.8859 3.9417 3.8922 3.7390 3.6619 3.7344 3.9146 4.0250 4.0396 3.7570 3.3556 2.9999
0.8 3.8706 3.9293 3.9358 3.8591 3.8391 3.9526 3.8664 3.9486 3.9701 3.7488 3.3971 3.0588
0.9 3.8710 3.9356 3.9907 3.9840 4.0216 4.1796 3.8160 3.8769 3.8985 3.7250 3.4219 3.1084
1 3.8863 3.9582 4.0559 4.1127 4.2069 4.4111 3.7660 3.8107 3.8287 3.6912 3.4321 3.1472
Note: This table shows the mean, standard deviation, Sharpe ratio, skew and kurtosis of portfolio returns for the optimal and theconstrained (fixed relative weights) portfolios as a function of the mispricing component (x) and the investment horizon (T). Themodel assumed in the calculations is given in equations (1)-(3). The table assumes the following parameter values:β = 1, σ = 0.1, b = 0.2, µm = 0.06, r = 0.03, σm = 0.15, γ = 4, λ1 = 1, λ2 = 0.
35