Embed Size (px)
Citation preview
ABB 08.03.07Sveinung Sletten, vice president external affairs, Petoro
Opportunities and challenges for the Norwegian Petroleum sector
• Petoro
• Opportunities and challengesfor the NCS
• Petoro’s strategy
• The Statoil-Hydro merger
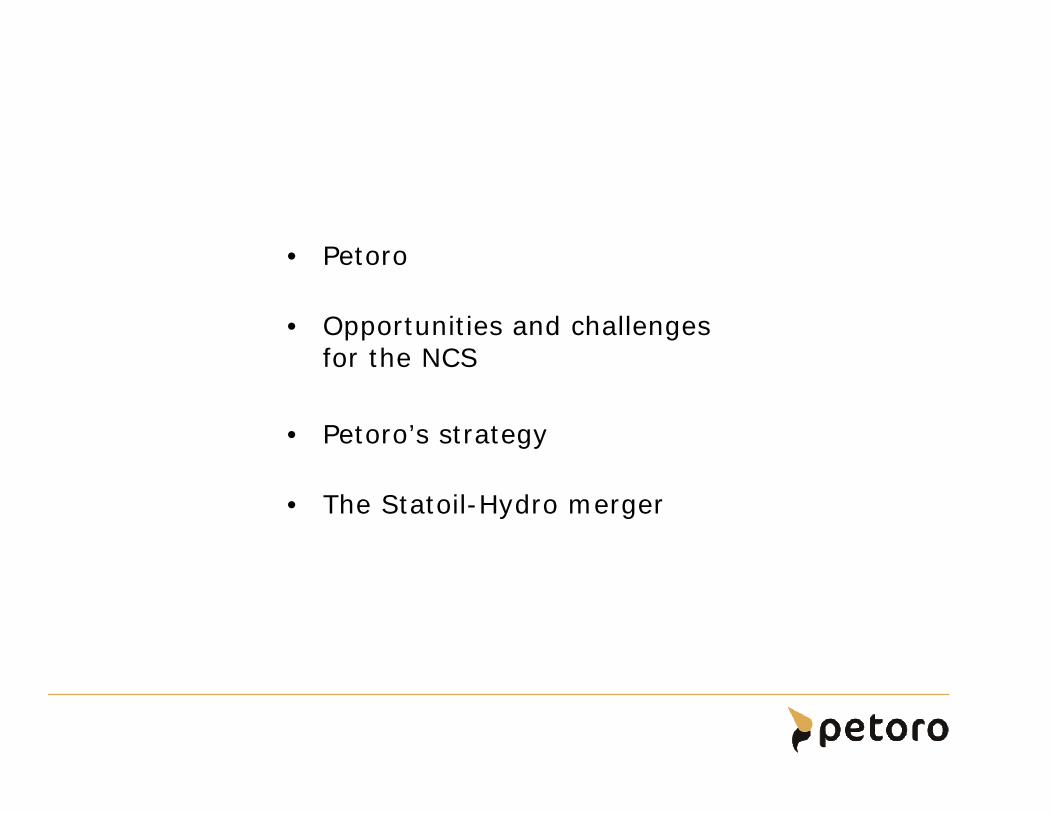
The net government cash flow from the petroleum activities
Source: Norwegian Public Accounts/National Budget
-50
0
50
100
150
200
250
300
350
1971 1974 1977 1980 1983 1986 1989 1992 1995 1998 2001 2004
Bill
NOK
2006
val
ue
Taxes Royalty and area fee
CO2 Statoil dividend
SDFI State net cash flow
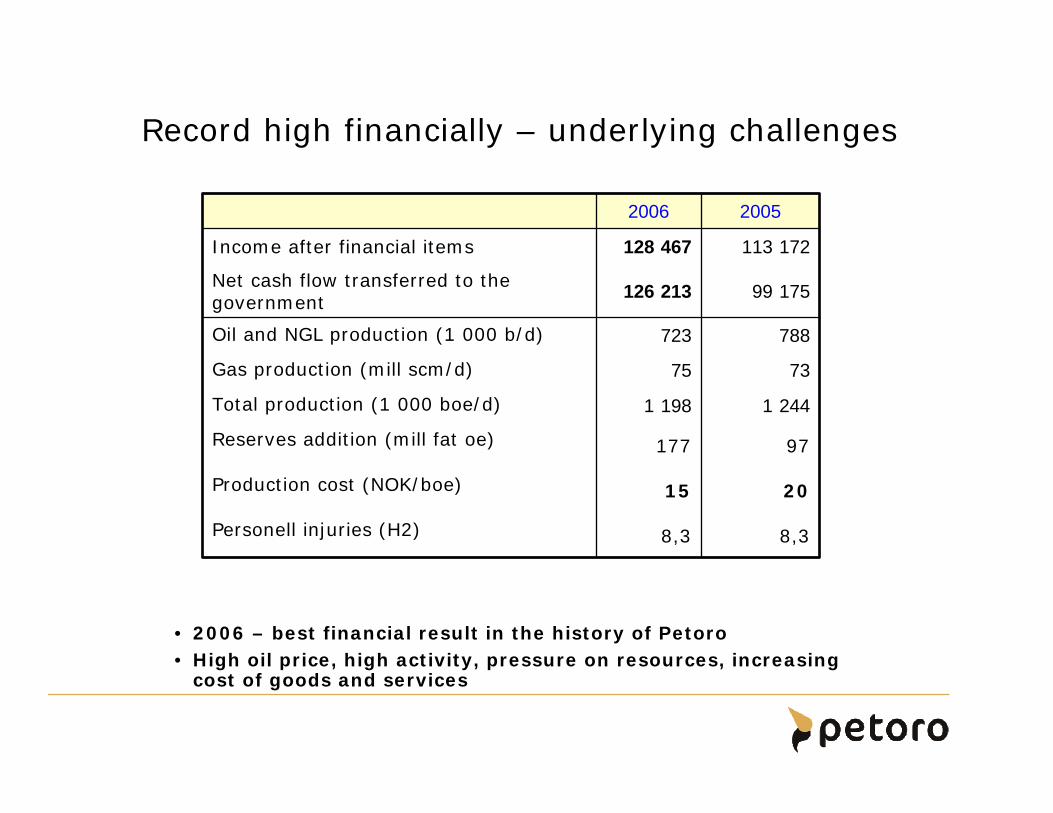
• 2006 – best financial result in the history of Petoro• High oil price, high activity, pressure on resources, increasing
cost of goods and services
Record high financially – underlying challenges
97177Reserves addition (mill fat oe)
2015Production cost (NOK/boe)
8,38,3Personell injuries (H2)
1 2441 198Total production (1 000 boe/d)
7375Gas production (mill scm/d)
788723Oil and NGL production (1 000 b/d)
99 175126 213Net cash flow transferred to the government
113 172128 467Income after financial items
20052006
12
6
19
24
256
6 2 °
6 0 °
5 8 °
T rondheim
Kristiansund
Ber genOslo
Stavanger
Harstad
5
5
1 23
4
1110987
15 16 17 18
26 27
32
31
29
3433 35
62026203
62046205
36
70 °
1 4 °
1 2 °
1 0 °
8 °
20 °22 °
2 4 °2 6 °
28 °30 °
18 °16 °
32 °
72 °
74 °
71207122
6 7 °
6 5 °
6 °
4 °2 °
TampenTampen
OsebergOseberg
TrollTroll
Norwegian SeaNorwegian Sea
Barents SeaBarents Sea
Southernmost NCSSouthernmost NCS
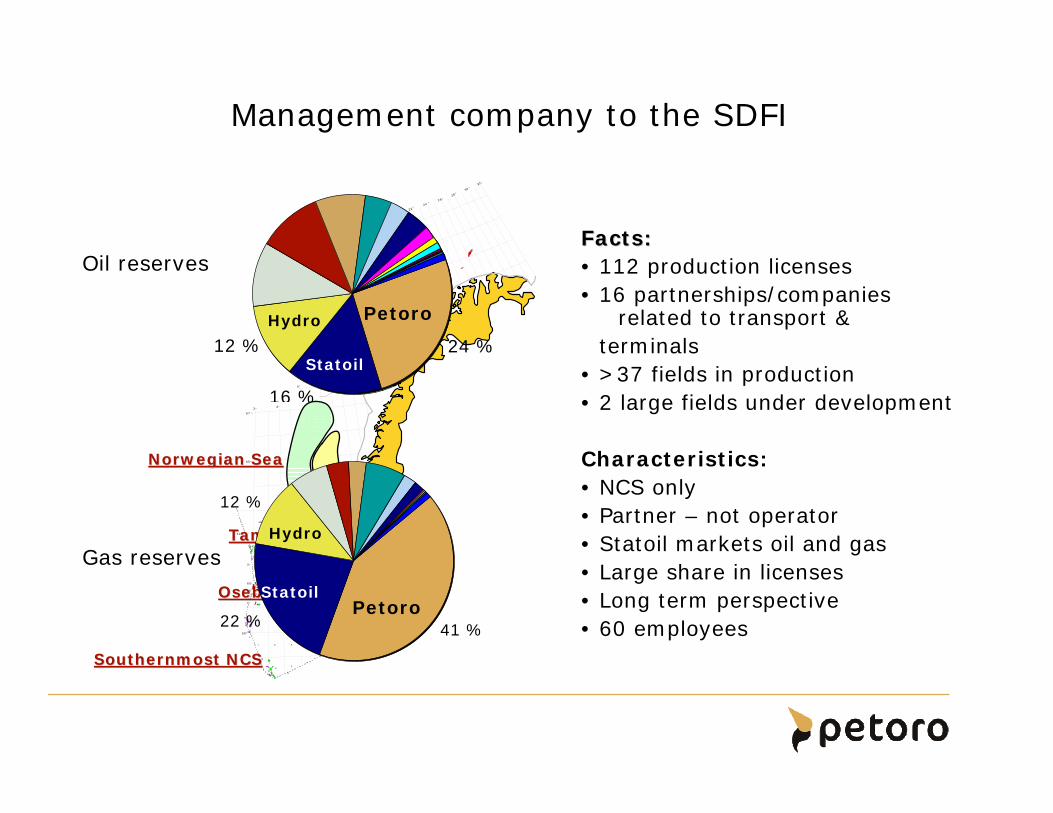
Management company to the SDFI
Facts:Facts:• 112 production licenses• 16 partnerships/companies
related to transport &terminals
• >37 fields in production• 2 large fields under development
Characteristics:• NCS only• Partner – not operator• Statoil markets oil and gas• Large share in licenses• Long term perspective• 60 employees
24 %
16 %
12 %
41 %22 %
12 %
Oil reserves
Gas reserves
PetoroStatoil
Hydro
PetoroHydro
Statoil
Opportunities and challenges
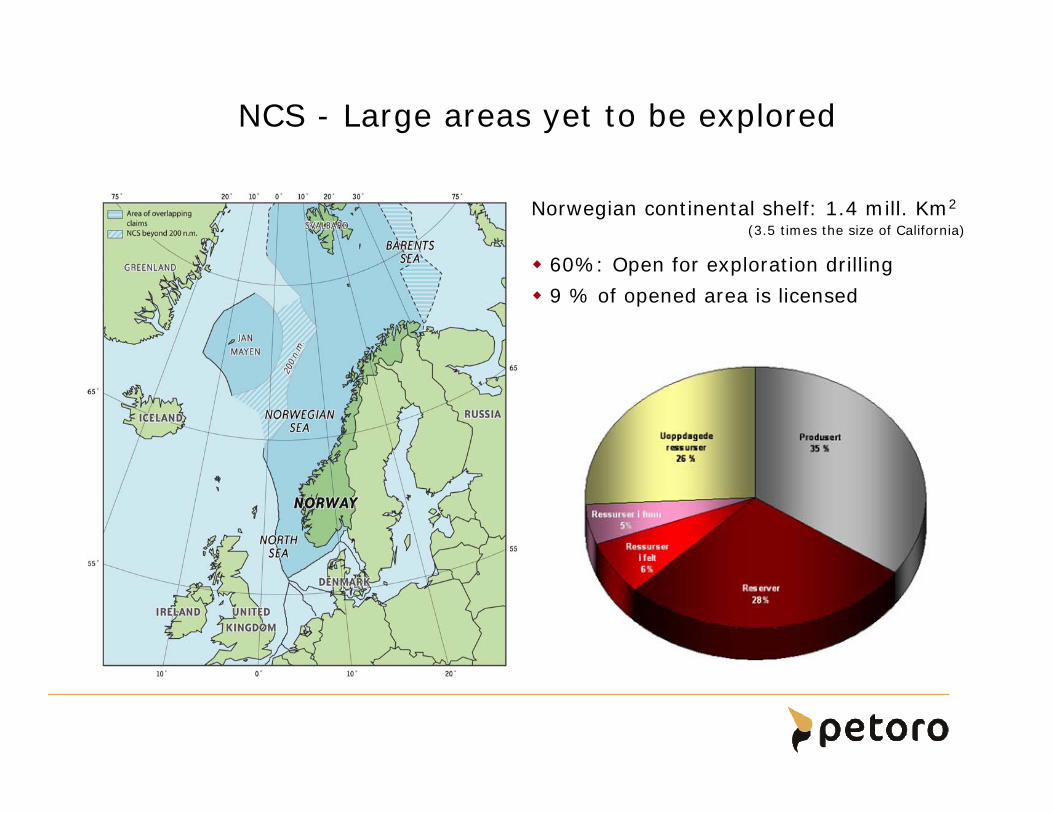
NCS - Large areas yet to be explored
Norwegian continental shelf: 1.4 mill. Km2
(3.5 times the size of California)
60%: Open for exploration drilling
9 % of opened area is licensed
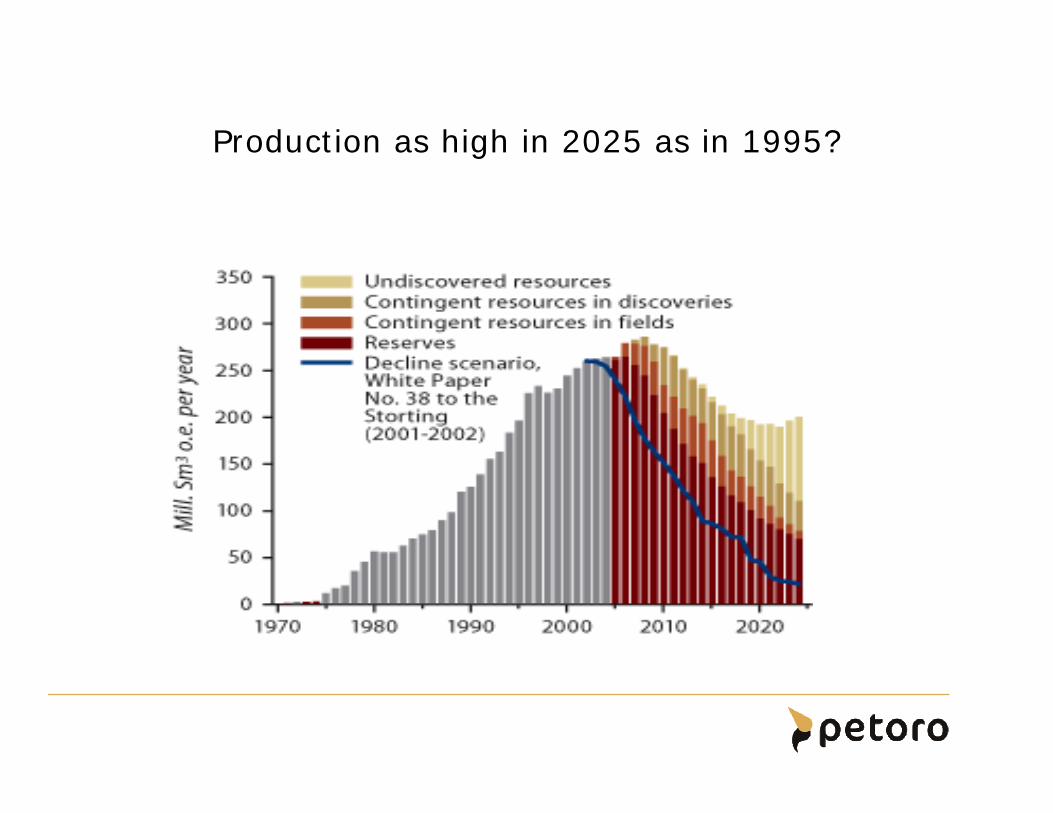
Production as high in 2025 as in 1995?

Source: NPD/MPE
Production level hinges on major fields
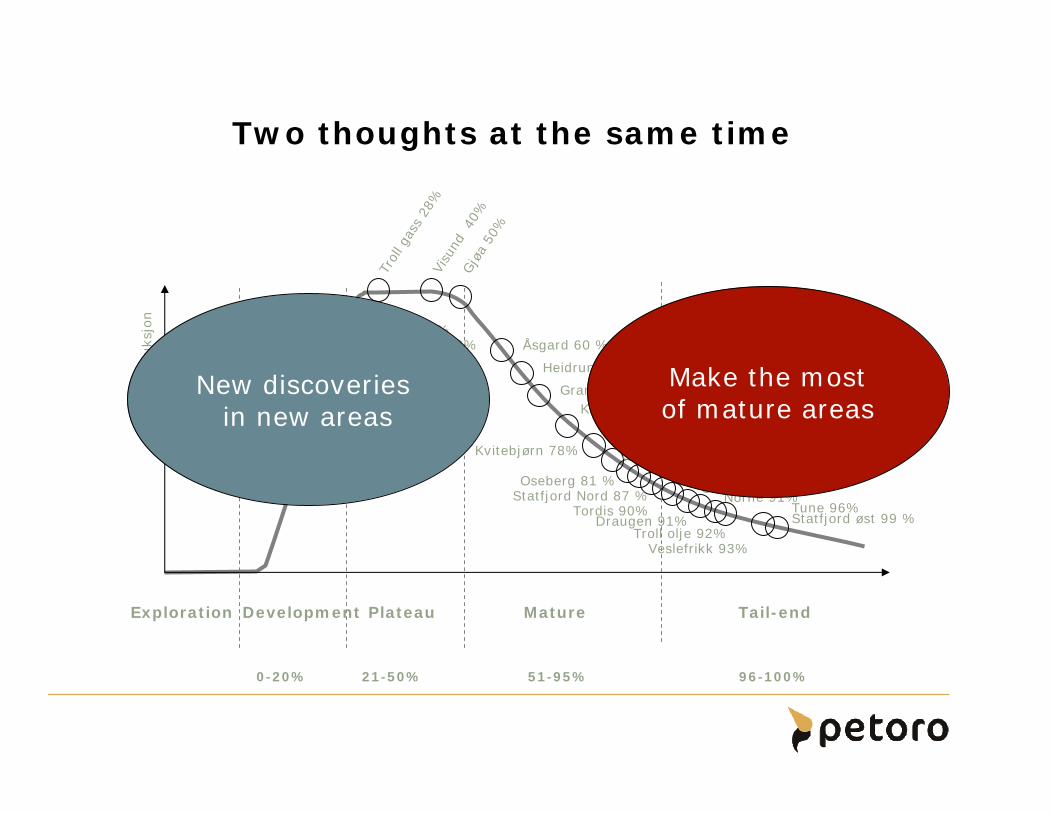
Two thoughts at the same timePr
oduks
jon
Exploration Development Plateau Mature Tail-end
0-20% 21-50% 51-95% 96-100%
Trol
l gas
s 28
%Vi
sund
40%
Gjø
a 50
%Statfjord Nord 87 %
Heidrun 64 %
Kristin 72%
Ormen Lange 13%Snøhvit 16 %
Åsgard 60 %
Statfjord øst 99 %
Oseberg 81 %
Tune 96%
Ekofisk 88%Gullfaks 89%
Grane 68 %
Kvitebjørn 78% Snorre 80%Vigdis 83%
Tordis 90%Draugen 91%
Norne 91%
Troll olje 92%Veslefrikk 93%
New discoveriesin new areas
Make the mostof mature areas
Trend: production decline, cost rise
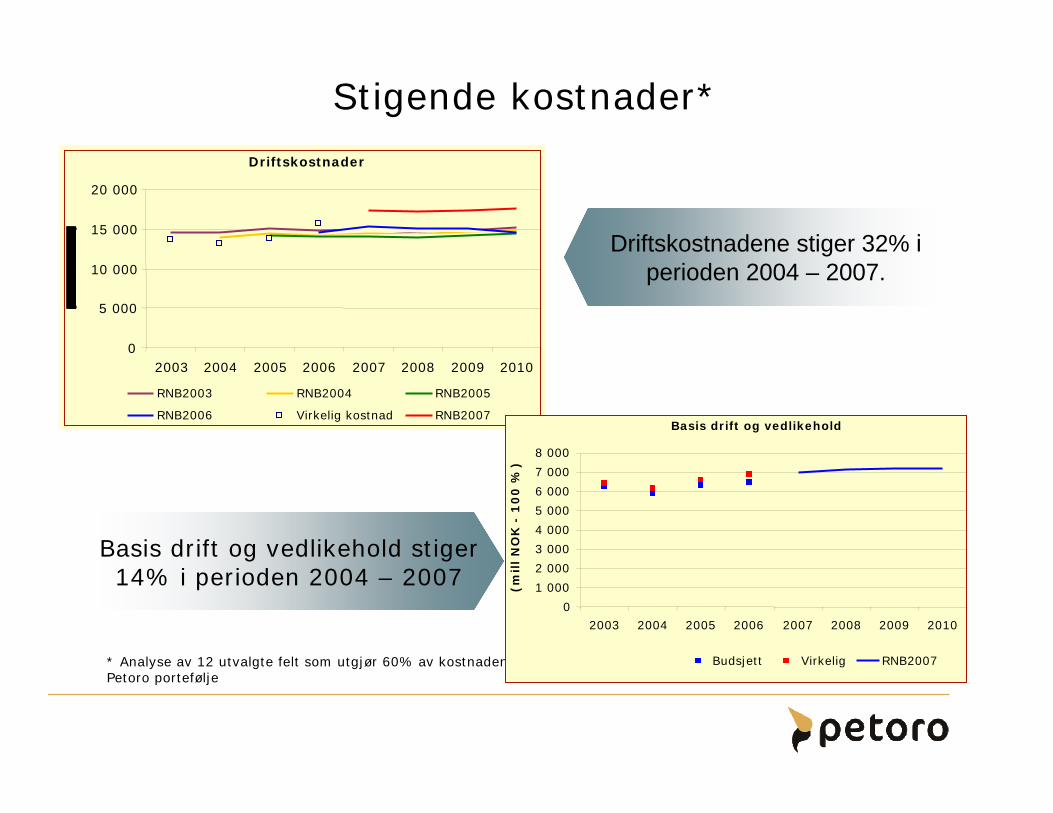
Stigende kostnader*
Driftskostnadene stiger 32% i perioden 2004 – 2007.
Basis drift og vedlikehold stiger 14% i perioden 2004 – 2007
* Analyse av 12 utvalgte felt som utgjør 60% av kostnadene i Petoro portefølje
Driftskostnader
0
5 000
10 000
15 000
20 000
2003 2004 2005 2006 2007 2008 2009 2010
RNB2003 RNB2004 RNB2005
RNB2006 Virkelig kostnad RNB2007Basis drift og vedlikehold
0
1 000
2 000
3 000
4 000
5 000
6 000
7 000
8 000
2003 2004 2005 2006 2007 2008 2009 2010
(mil
l N
OK
-1
00
%)
Budsjett Virkelig RNB2007
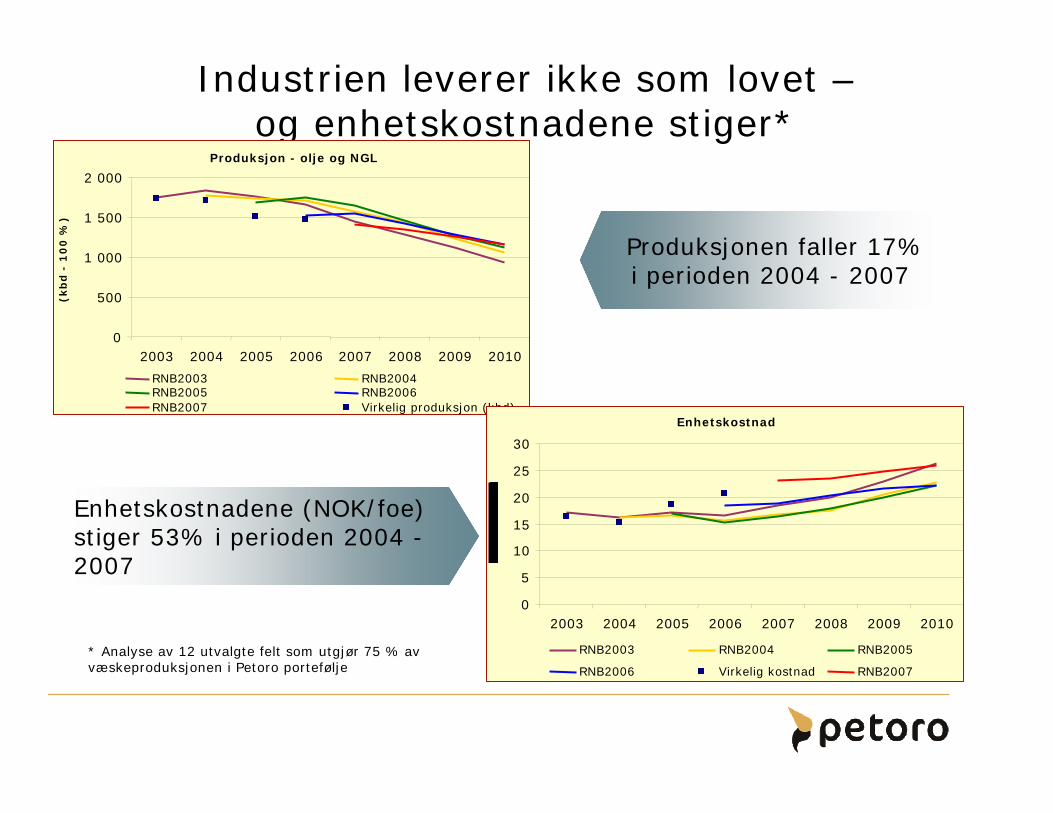
Industrien leverer ikke som lovet –og enhetskostnadene stiger*
Produksjonen faller 17% i perioden 2004 - 2007
Enhetskostnadene (NOK/foe) stiger 53% i perioden 2004 -2007
* Analyse av 12 utvalgte felt som utgjør 75 % av væskeproduksjonen i Petoro portefølje
Produksjon - olje og NGL
0
500
1 000
1 500
2 000
2003 2004 2005 2006 2007 2008 2009 2010
(kb
d-
10
0 %
)
RNB2003 RNB2004RNB2005 RNB2006RNB2007 Virkelig produksjon (kbd)
Enhetskostnad
0
5
10
15
20
25
30
2003 2004 2005 2006 2007 2008 2009 2010
RNB2003 RNB2004 RNB2005
RNB2006 Virkelig kostnad RNB2007
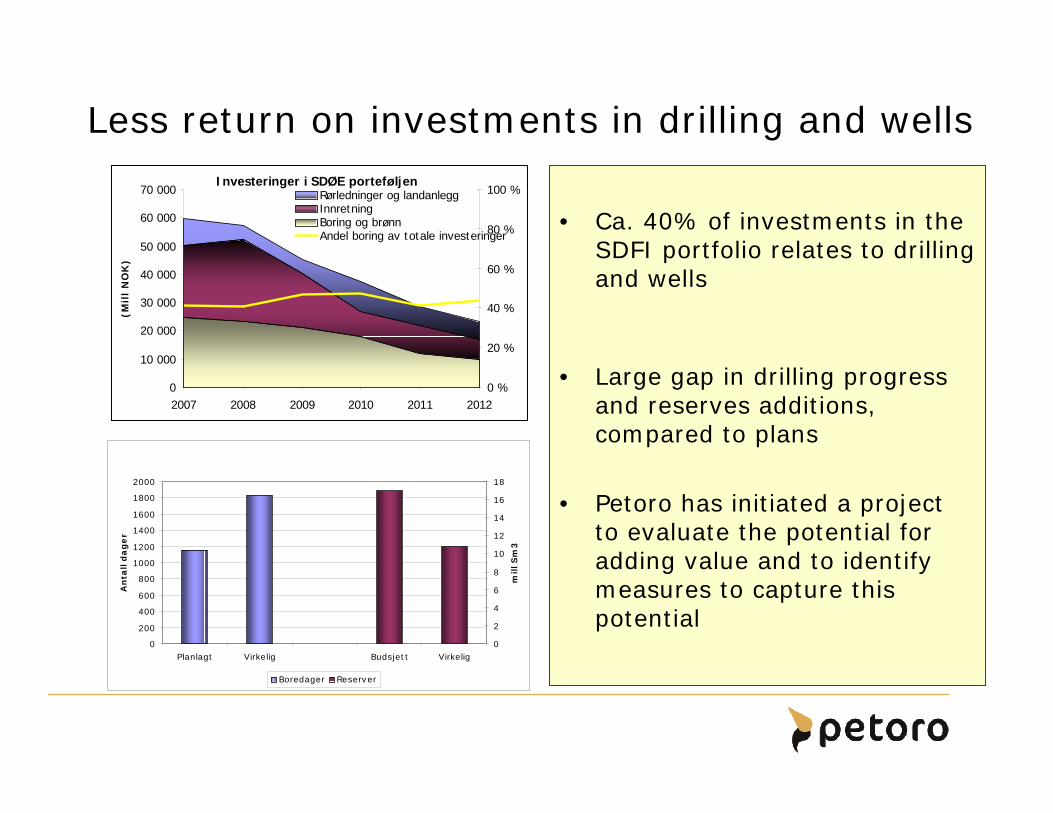
Less return on investments in drilling and wells
• Ca. 40% of investments in theSDFI portfolio relates to drilling and wells
• Large gap in drilling progress and reserves additions, compared to plans
• Petoro has initiated a projectto evaluate the potential for adding value and to identifymeasures to capture thispotential
Investeringer i SDØE porteføljen
0
10 000
20 000
30 000
40 000
50 000
60 000
70 000
2007 2008 2009 2010 2011 2012
(Mil
l N
OK
)
0 %
20 %
40 %
60 %
80 %
100 %Rørledninger og landanleggInnretningBoring og brønnAndel boring av totale investeringer
Oseberg
0
200
400
600
800
1000
1200
1400
1600
1800
2000
Planlagt Virkelig Budsjett Virkelig
An
tall d
ag
er
0
2
4
6
8
10
12
14
16
18
mill S
m3
Boredager Reserver
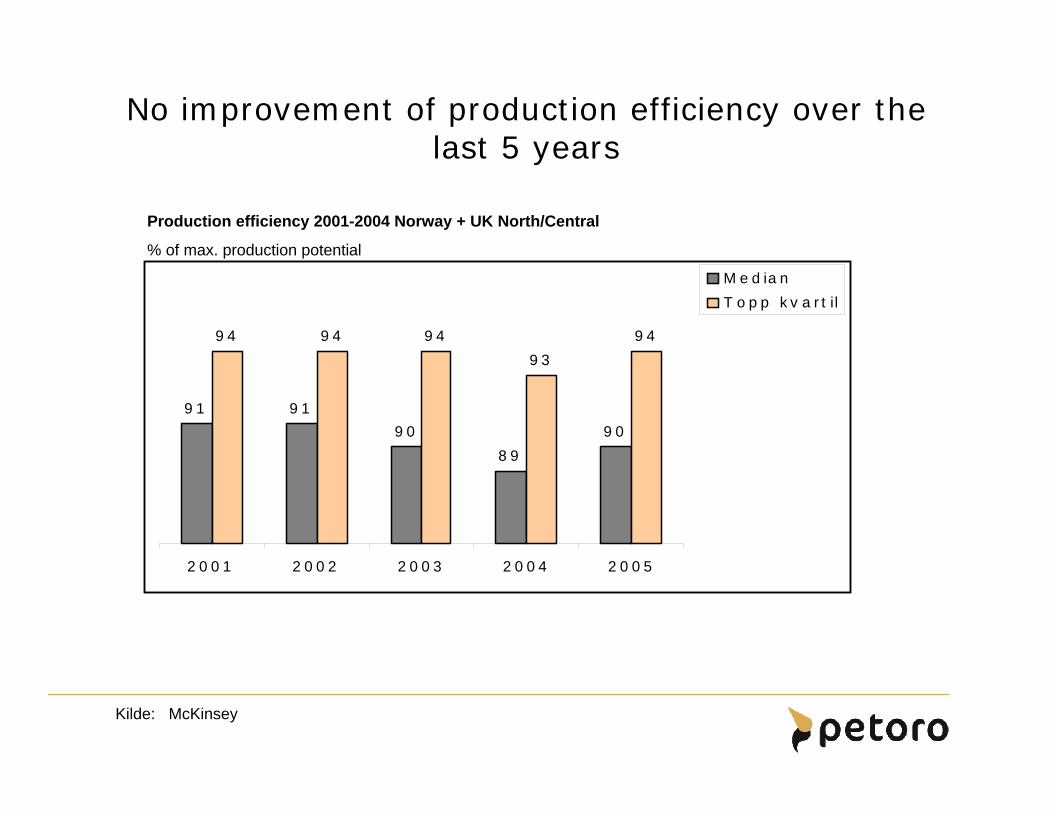
No improvement of production efficiency over thelast 5 years
Kilde: McKinsey
91 91
90
89
90
94 94 94
93
94
2001 2002 2003 2004 2005
M e d ia n
T o pp kv a rt il
Production efficiency 2001-2004 Norway + UK North/Central
% of max. production potential
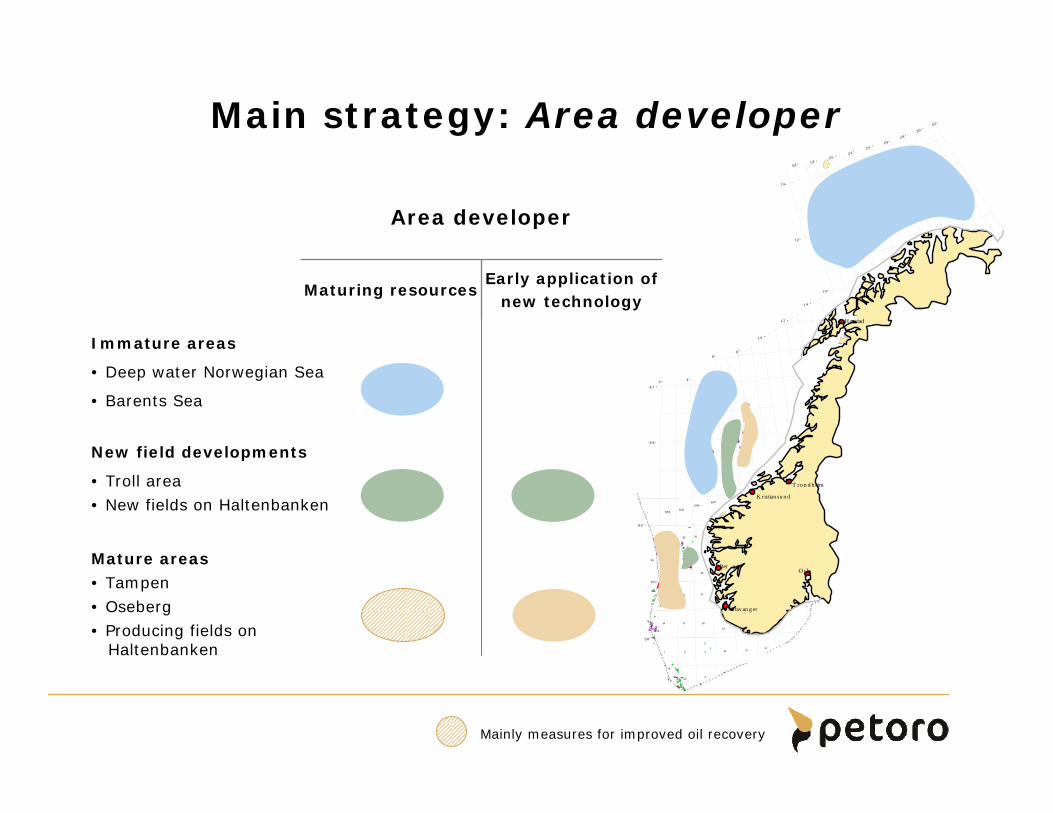
Petoro strategy: AREA DEVELOPER
MATURING RESERVES, EARLY APPLICATION OF TECHNOLOGY
Early application ofnew technology
Maturing resources
Area developer
Mature areas• Tampen • Oseberg• Producing fields on
Haltenbanken
New field developments
• Troll area• New fields on Haltenbanken
Immature areas
• Deep water Norwegian Sea
• Barents Sea
Main strategy: Area developer
12
6
19
24
256
6 2 °
6 0 °
5 8 °
T ro n d h eim
K ristian su n d
Ber g enOslo
Stav an g er
Harstad
5
5
1 23
4
1110987
15 16 17 18
26 27
32
31
29
3433 35
62026203
62046205
36
7 0 °
1 4 °
1 2 °
1 0 °
8 °
2 0 °2 2 °
2 4 °2 6 °
2 8 °30 °
1 8 °1 6 °
3 2 °
7 2 °
7 4 °
71207122
6 7 °
6 5 °
6 °
4 °2 °
Mainly measures for improved oil recovery
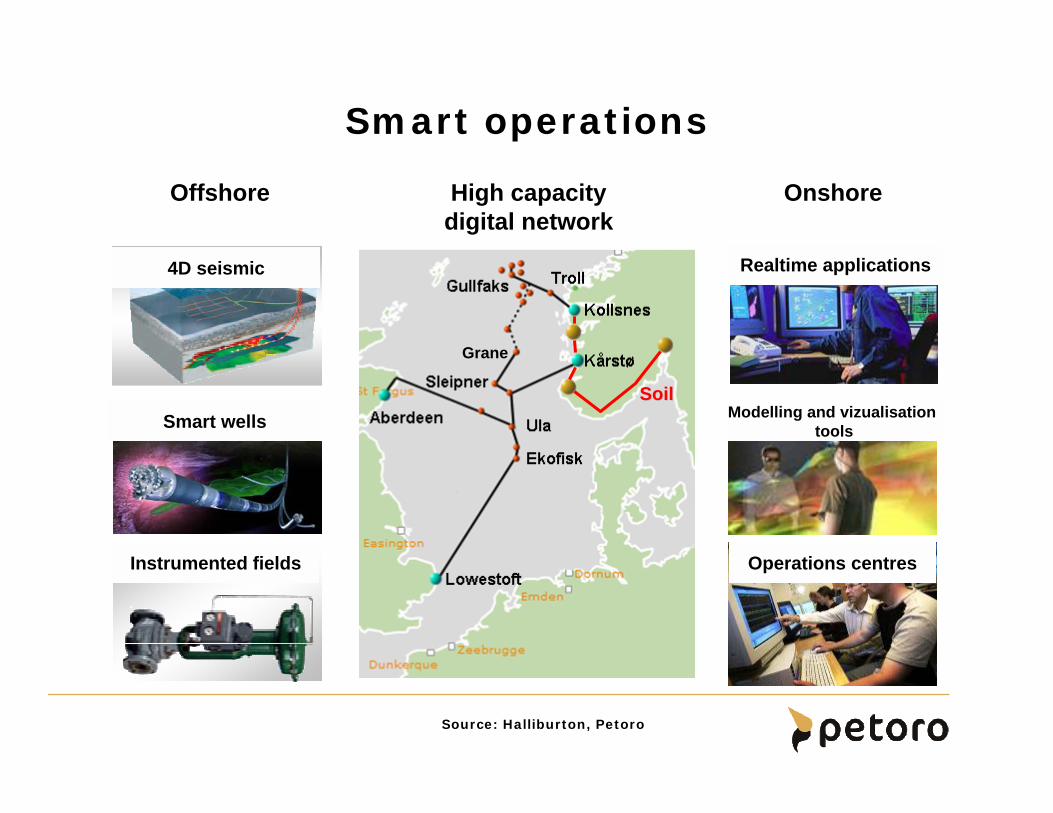
Smart operations
Offshore
4D seismic
Smart wells
Onshore
Operations centres
Modelling and vizualisation tools
Realtime applications
High capacitydigital network
SoilSoil
Grane
Instrumented fields
Source: Halliburton, Petoro
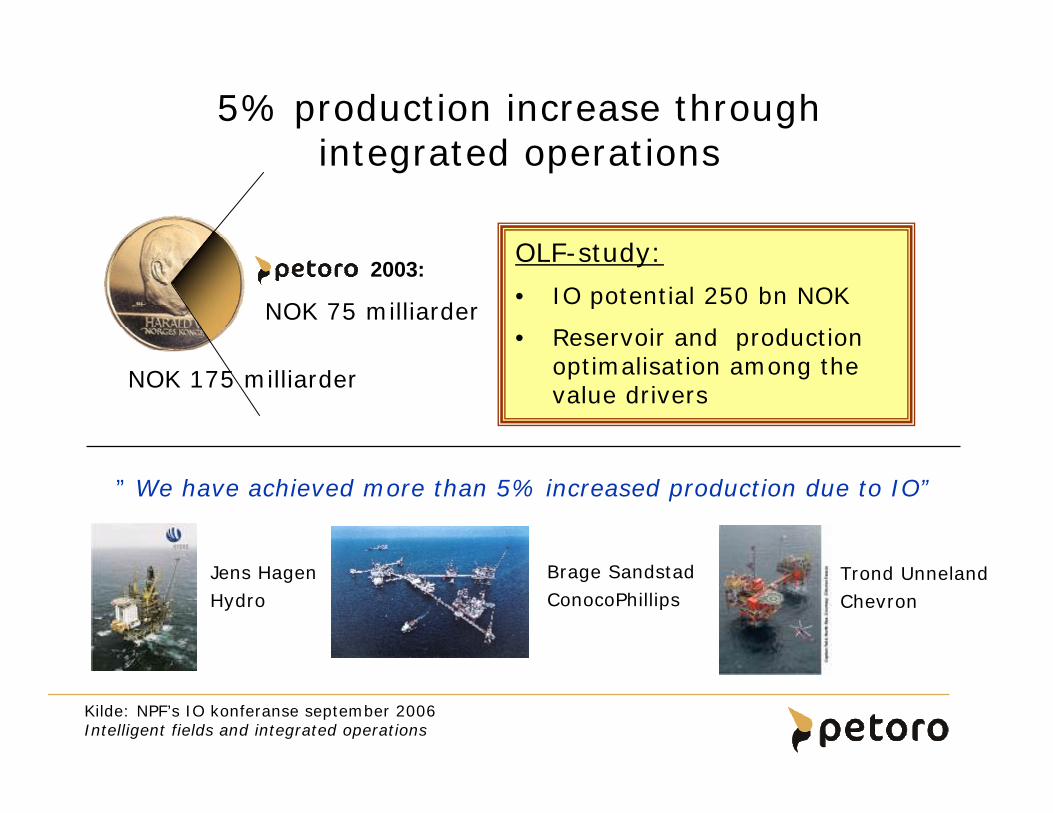
5% production increase throughintegrated operations
OLF-study:
• IO potential 250 bn NOK
• Reservoir and production optimalisation among the value drivers
Kilde: NPF’s IO konferanse september 2006Intelligent fields and integrated operations
” We have achieved more than 5% increased production due to IO”
Jens HagenHydro
Brage SandstadConocoPhillips
Trond UnnelandChevron
NOK 175 milliarder
NOK 75 milliarder
2003:
Statoil-Hydro merger
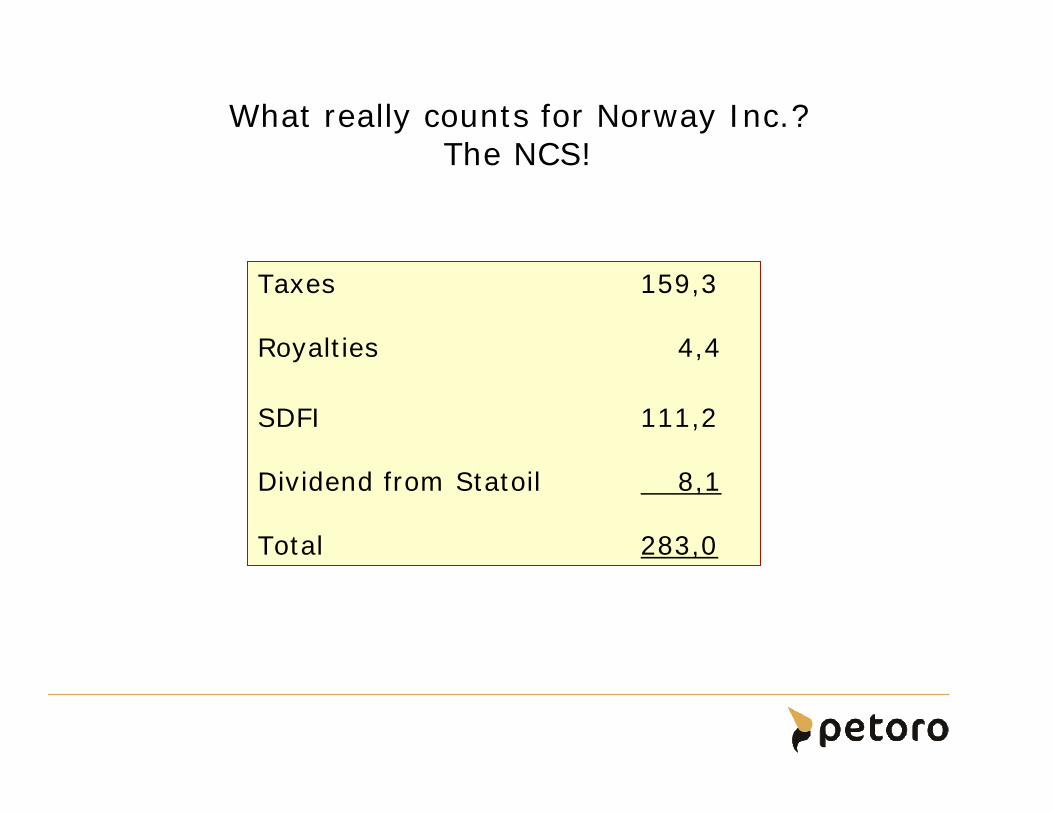
What really counts for Norway Inc.? The NCS!
Taxes 159,3
Royalties 4,4
SDFI 111,2
Dividend from Statoil 8,1
Total 283,0
12
6
19
24
256
62 °
60°
58°
Trondheim
Kristiansund
Ber genOslo
Stavanger
Harstad
5
5
1 23
4
1110987
15 16 17 18
26 27
32
31
29
3433 35
62026203
62046205
36
70°
14 °
12 °
10 °
8°
20 °22 °
24
18 °16°
72°
74°
71207122
67 °
65°
6°
4°2°
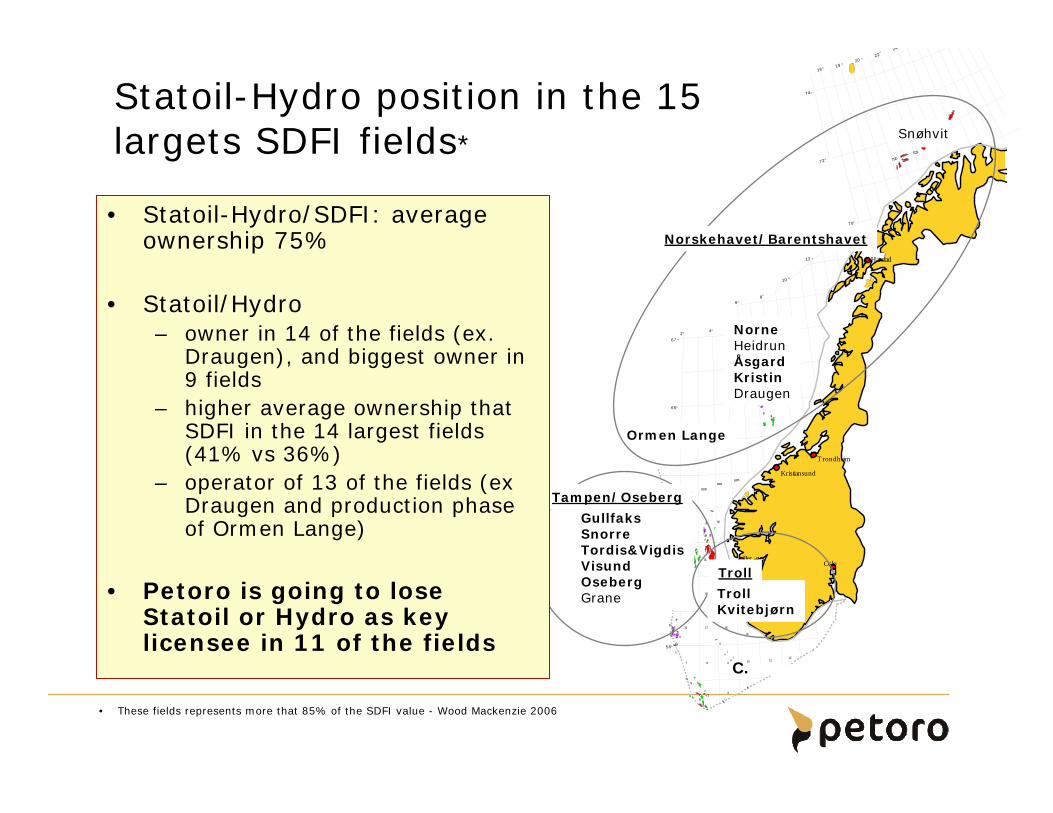
Statoil-Hydro position in the 15 largets SDFI fields* Snøhvit
C.
NorneHeidrunÅsgardKristinDraugen
GullfaksSnorreTordis&VigdisVisundOsebergGrane
Ormen Lange
Norskehavet/Barentshavet
TrollKvitebjørn
Tampen/Oseberg
Troll
• These fields represents more that 85% of the SDFI value - Wood Mackenzie 2006
• Statoil-Hydro/SDFI: averageownership 75%
• Statoil/Hydro– owner in 14 of the fields (ex.
Draugen), and biggest owner in 9 fields
– higher average ownership thatSDFI in the 14 largest fields(41% vs 36%)
– operator of 13 of the fields (ex Draugen and production phaseof Ormen Lange)
• Petoro is going to lose Statoil or Hydro as keylicensee in 11 of the fields
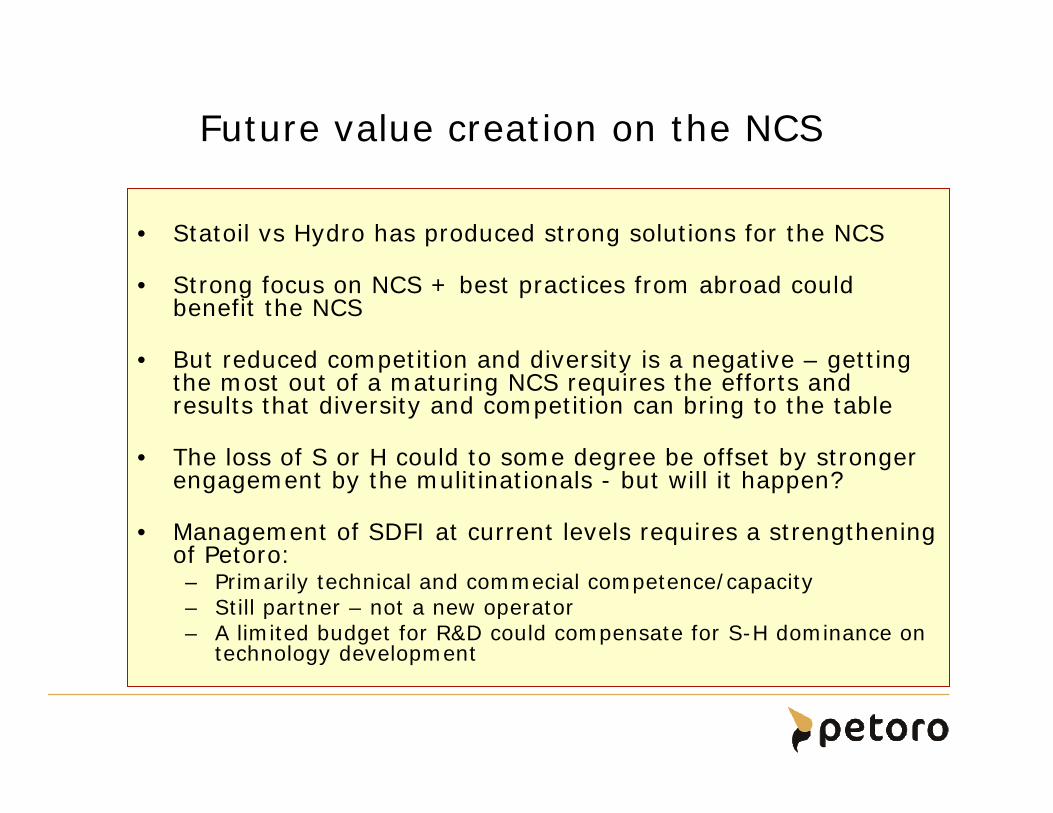
Future value creation on the NCS
• Statoil vs Hydro has produced strong solutions for the NCS
• Strong focus on NCS + best practices from abroad couldbenefit the NCS
• But reduced competition and diversity is a negative – gettingthe most out of a maturing NCS requires the efforts and results that diversity and competition can bring to the table
• The loss of S or H could to some degree be offset by strongerengagement by the mulitinationals - but will it happen?
• Management of SDFI at current levels requires a strengtheningof Petoro: – Primarily technical and commecial competence/capacity– Still partner – not a new operator– A limited budget for R&D could compensate for S-H dominance on
technology development
The best partner