Embed Size (px)
Citation preview
120 International Journal of Electronic Business Management, Vol. 6, No. 3, pp. 120-130 (2008)
OPERATIONAL RISK MANAGEMENT FRAMEWORK FOR SERVICE OUTSOURCING: CONSIDERATION OF RISK
DIMENSIONS AND THEIR APPLICATION INTO THE FRAMEWORK
Zaw Zaw Aung*
Department of Information Science and Control Engineering Nagaoka University of Technology
Niigata (940-2188), Japan
ABSTRACT
As outsourcing is becoming mandate for today’s business, there has been a variety of researches taking place. This paper discusses on managing operational risks in an organization where one or more business processes are being outsourced. We first review on changing nature of operational risks not only in outsourced process itself, but also among any other interrelated processes. Then a conceptual operational risk management framework is introduced. The framework combines the advantages of Key Risk Indicator Framework and Bayesian Network Causal Modeling concepts. The detailed development process is discussed in five phases along with the development tools and their applications. This paper concludes with the comparison of proposed framework with other existing operational risk models. Keywords: Operational Risk Management, Key Risk Indicators, Bayesian Network, Service Outsourcing
* Corresponding author: [email protected]
1. INTRODUCTION
This study was motivated by the concern of operational risks associated with outsourcing. As outsourcing is becoming mandate for survival of the organizations, firms are compulsively outsourcing more and more of their business processes and services. Many organizations fail to give substantial attention to outsourcing related operational risks’ complexity. Any form of failed outsourcing arrangements put the firm on substantial losses. Not just the financial loss, there are many forms of losses including losses in – capability, process knowledge, human resource, reputation – which will, at worst, never be recovered.
This study focuses on the development of proactive operational risk management framework. In current Banking industry, a wide range of studies are taking place attempting for effective modeling and measurement of operational risk exposure to meet the regulatory requirement set by Basel II [2]. In contrast, this study focuses on proactive risk monitoring and management. It targets on outsourcing service buyer organization and managing operational risks arisen from operational activities of in-house and outsourced processes.
Firstly, it reviews on the definition of operational risk and discuss on its risk types. Outsourcing associated operational risks are identified and grouped by risk event types, and then mapped each type to causal factors. After exploring and discussing potential risks, a proactive operational risk model is introduced. Critical Success Factor Methodology and Critical Activities Concept are applied in the process of identifying and selecting most important operational risks.
The basic concept of Bayes’ theorem on converting to and from of prior and posterior probability is the primary motivation on using them. Bayesian probabilistic network modeling approach is used to develop causal networks on risk factors. These networks enable responsive risk monitoring and proactive risk management as well as certain degree of risk estimation functionality.
There are several software packages for realizing a Bayesian network. Among them, Hugin expert (http://www.hugin.com) is a good combination of statistical content, computational efficiency and price. The software tool - Hugin Lite version 6.8 - is being used for Bayesian-KRI networks development and implementation of concepts. It includes easy-to-learn graphical interface and decision engine
Z. Z. Aung: Operational Risk Management Framework for Service Outsourcing 121
with all four API’s (Application Programming Interfaces). It has an expression builder for specifying known distributions and also allows the use of continuous nodes. This free trail version is limited to handle maximum 50 states and learn from maximum 500 cases. It has no limitation on trail time period. Therefore, this is perfect condition for academic
research and future adaptation for actual implementation. [1]
The five-phase process of Bayesian-KRI networks development is discussed in detail. The application of proposed framework is illustrated with a sample network reflecting actual business environments.
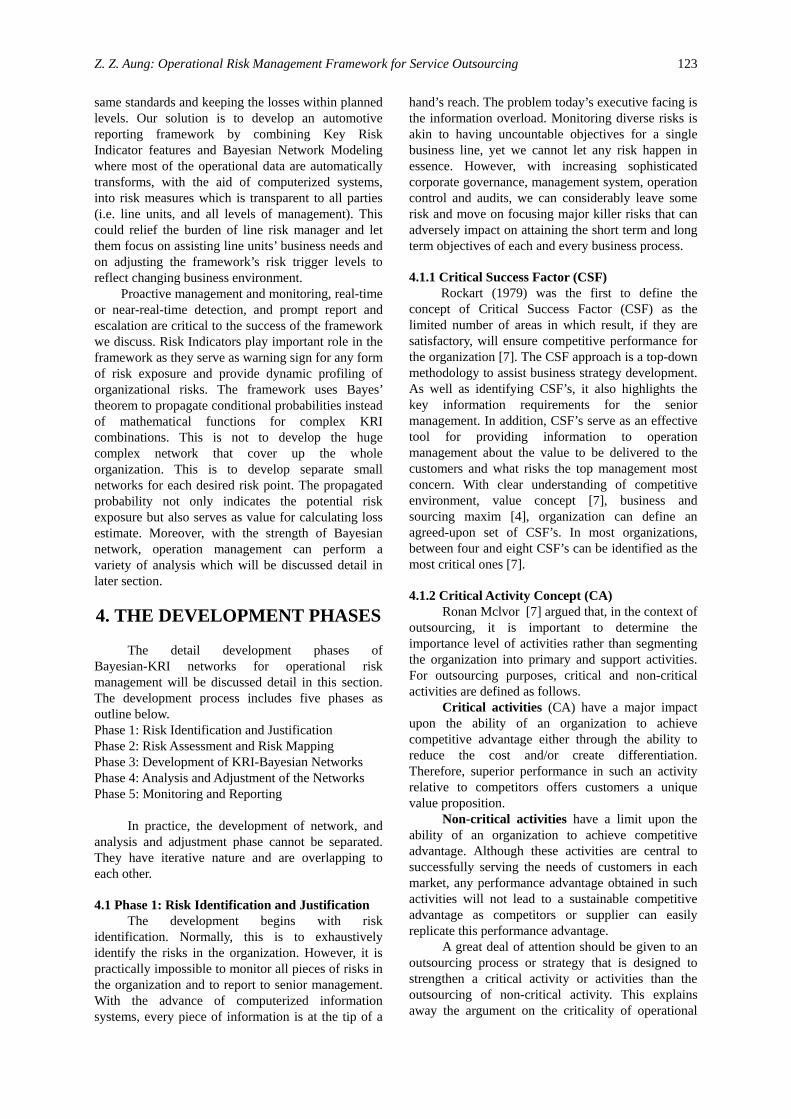
Table 1: Classification of operational risk by risk event type Event Type Examples
Damage to physical assets Terrorism, vandalism, earthquakes, fires, and floods
External fraud Regional security breaches, Competitor’s exploitation of trade secret at outsource provider’s site External
Risks Location related and business environment
Country risk, political risk, currency risk, visa restriction, travel restriction, Systemic vulnerability (external), pandemic risk, unexpected changes in competitive environment, service provider’s business changes (M&A, Structure, Strategy, etc.)
Clients, products and business practices
Noncompliance to law, policies or ethical standards of service buyer , Misuse of trust, Misuse of customer information, Sale of unauthorized products, Vendor’s exploitation of client's expertise
Internal fraud Data leakage, Employee theft, intentional misreporting, illegal trading of trade secret, IP
Conduct Risks
Employment practices and workplace safety
Aviation Accidents, Personnel Security, Workers’ compensation and discrimination claims, Violation of employee health and safety rules, and general liability
Business disruption and system failures
Provider's bankruptcy, Security & system vulnerability (increase in security holes), Systemic Vulnerability (internal), HW/SW failures, telecommunication problems and utility outages Process
Risks Execution, delivery, and process management
SLA management, Service debasement (failure in process and quality control), Exception handling, Seasonality handling, non-standardized measurement, Miscommunication, vendor dispute, inaccuracy in reporting, incomplete legal documentation
Remark: Risk examples are compiled from various sources. [2][3]
2. OPERATIONAL RISKS IN OUTSOURCING BUSINESS
According to Basel II: International Convergence of Capital Measurement and Capital Standards, operational risk is defined as the risk of loss resulting from inadequate or failed internal processes, people and systems, or from external events [3]. This study focuses on the framework that handles the risks arising from complexity of outsourcing processes. The definition and scope of the operational risk is, therefore, to be expanded and extended to cover business risk, systemic risk, a broader view on legal risks (compliance, privacy, data security, etc.), and the risks driven from the need of transparent communication and sound Service Level Agreement (SLA) management. 2.1 Classification of Operational Risks
It is also important that the definition considers the full range of materialized operational risks the organization is facing and captures the most significant causes of severe operational failures.
Table.1 provides the definitive yet, relatively, exclusive, classification of operational risk by event types. Most of these event types are derived from the operational risk event type suggested by Basel Committee on Banking Supervision [2]. But this study expands the scopes of these event types to reflect the nature of outsourcing business and non-financial industry. The reader can realize them by looking through the provided examples. A new event type “location-related and business environment” is added to cover risk events specific to offshore outsourcing. 2.2 Causal Factors
Nine causal factors to risk occurrence are to be defined. It is based on Basel II [2] defined four general causal categories - people, technology, processes and external factors. Brief description on each factors are provided below. 1. People: human factor related matters 2. Technology: IT and all communication system
including hardware and software

122 International Journal of Electronic Business Management, Vol. 6, No. 3 (2008)
3. External Factors: man-made or natural disaster, business environment and competition
4. Strategy/Policy: strategic change either in the management itself or in its counterparties
5. Corporate Governance: The structure, through which, the objectives of an organization are set, the means of attaining those objectives are provided, determines performance monitoring guidelines, and encouraging to use resources efficiently. Lack of due diligence and misaligned governance structure with business nature and changing environment could become a source of operational risk.
6. Organization Culture: An organization's beliefs, knowledge, attitudes, and customs. Culture may
result in part from senior managers' beliefs, but it also results from employees' beliefs. It can be supportive or unsupportive and positive or negative. It can affect employees' ability or willingness to adapt or perform well.
7. Management: Lack of effective management, coaching, empowerment, facilitation, motivation and leadership.
8. Process [business as normal]: Reporting, Control and audit issues.
9. Business Conditions [abnormal conditions or business failure]: Cost pressure, fail project or products, de-layering, downsizing, outsourcing, and process re-engineering.
Table 2: Mapping of risk event types with causal factors
Damage to Physical Assets External Factors External Fraud External Factors, Technology, Management External Location-related and Business Environment External Factors, Strategy/Policy Clients, Products and Business Practices People, Corporate Governance Internal Fraud Organizational Culture, Management, ProcessConduct Employment Practices and Workplace Safety People, Corporate Governance Business Disruption and System Failures Organizational Culture, Management, ProcessProcess Execution, Delivery, and Process Management Corporate Governance, Management
2.3 Mapping of Risk Event Type with Causal Factor
Table.2 depicts the mapping of risk event type and causal factors. By doing so, it becomes possible to group operational risk exposures on the basis of causal factor. It allows generation of condense report, based on causal factor, to senior management by department, by business line, by product or by region. Management can quickly reference on risk profile and clearly understand which part of the organization need to be improved (e.g. Management skill, technology, etc.).
3. CONCEPTUAL OPERATIONAL RISK
MANAGEMENT FRAMEWORK
After thorough discussion on potential risks of outsourcing business, the proposed operational risk management framework is defined as “A framework that can detect the most critical operational risks to the organization in timely manner and report effectively to all required individuals at different levels of management with adequate information for taking necessary actions.” This section is going to discuss the basic concept of the framework development.
According to James Lam, the relationship between line management and risk management can be characterized in terms of three organizational models [6].
Offense vs. Defense: Business units focus on revenue maximization and risk management focuses on loss minimization.
Policy and Policing: Business units can only operate within the risk policy established by risk management, and their activities are monitored by risk, audit, and compliant functions.
Partnership: Business units and risk management jointly evaluate and resolve risk management issues and share common goals and objectives.
From the perspective of outsourcing business, most of the organizations are still in the stage of Offense and Defense model, where outsourced service providers struggle to achieve targeted cost saving and profit margin while service buyers defend their reputation and business risk by strengthening SLA management and audit functions. Our suggested goal is to bring the Offense-and-Defense model into the combination of Policy-and-Policing Model and Partnership Model. This attempt is mandate for organizations that are dealing more advanced form of outsourcing, a combination of sourcing relationship deals - efficiency, enhancement and transformation [4]. These deals demand more advanced form of goal-sharing and risk-sharing activities where perfect alignment of risk and line functions plays critical role. One of its key challenges is defining the role of line risk manager. For instance, in financial service, line manager may argue for lower pricing and relaxed underwriting standards in order to increase volume, whereas risk managers may argue for maintaining the
Z. Z. Aung: Operational Risk Management Framework for Service Outsourcing 123
same standards and keeping the losses within planned levels. Our solution is to develop an automotive reporting framework by combining Key Risk Indicator features and Bayesian Network Modeling where most of the operational data are automatically transforms, with the aid of computerized systems, into risk measures which is transparent to all parties (i.e. line units, and all levels of management). This could relief the burden of line risk manager and let them focus on assisting line units’ business needs and on adjusting the framework’s risk trigger levels to reflect changing business environment.
Proactive management and monitoring, real-time or near-real-time detection, and prompt report and escalation are critical to the success of the framework we discuss. Risk Indicators play important role in the framework as they serve as warning sign for any form of risk exposure and provide dynamic profiling of organizational risks. The framework uses Bayes’ theorem to propagate conditional probabilities instead of mathematical functions for complex KRI combinations. This is not to develop the huge complex network that cover up the whole organization. This is to develop separate small networks for each desired risk point. The propagated probability not only indicates the potential risk exposure but also serves as value for calculating loss estimate. Moreover, with the strength of Bayesian network, operation management can perform a variety of analysis which will be discussed detail in later section. 4. THE DEVELOPMENT PHASES
The detail development phases of Bayesian-KRI networks for operational risk management will be discussed detail in this section. The development process includes five phases as outline below. Phase 1: Risk Identification and Justification Phase 2: Risk Assessment and Risk Mapping Phase 3: Development of KRI-Bayesian Networks Phase 4: Analysis and Adjustment of the Networks Phase 5: Monitoring and Reporting
In practice, the development of network, and analysis and adjustment phase cannot be separated. They have iterative nature and are overlapping to each other. 4.1 Phase 1: Risk Identification and Justification
The development begins with risk identification. Normally, this is to exhaustively identify the risks in the organization. However, it is practically impossible to monitor all pieces of risks in the organization and to report to senior management. With the advance of computerized information systems, every piece of information is at the tip of a
hand’s reach. The problem today’s executive facing is the information overload. Monitoring diverse risks is akin to having uncountable objectives for a single business line, yet we cannot let any risk happen in essence. However, with increasing sophisticated corporate governance, management system, operation control and audits, we can considerably leave some risk and move on focusing major killer risks that can adversely impact on attaining the short term and long term objectives of each and every business process. 4.1.1 Critical Success Factor (CSF)
Rockart (1979) was the first to define the concept of Critical Success Factor (CSF) as the limited number of areas in which result, if they are satisfactory, will ensure competitive performance for the organization [7]. The CSF approach is a top-down methodology to assist business strategy development. As well as identifying CSF’s, it also highlights the key information requirements for the senior management. In addition, CSF’s serve as an effective tool for providing information to operation management about the value to be delivered to the customers and what risks the top management most concern. With clear understanding of competitive environment, value concept [7], business and sourcing maxim [4], organization can define an agreed-upon set of CSF’s. In most organizations, between four and eight CSF’s can be identified as the most critical ones [7]. 4.1.2 Critical Activity Concept (CA)
Ronan Mclvor [7] argued that, in the context of outsourcing, it is important to determine the importance level of activities rather than segmenting the organization into primary and support activities. For outsourcing purposes, critical and non-critical activities are defined as follows.
Critical activities (CA) have a major impact upon the ability of an organization to achieve competitive advantage either through the ability to reduce the cost and/or create differentiation. Therefore, superior performance in such an activity relative to competitors offers customers a unique value proposition.
Non-critical activities have a limit upon the ability of an organization to achieve competitive advantage. Although these activities are central to successfully serving the needs of customers in each market, any performance advantage obtained in such activities will not lead to a sustainable competitive advantage as competitors or supplier can easily replicate this performance advantage.
A great deal of attention should be given to an outsourcing process or strategy that is designed to strengthen a critical activity or activities than the outsourcing of non-critical activity. This explains away the argument on the criticality of operational
124 International Journal of Electronic Business Management, Vol. 6, No. 3 (2008)
risk management for outsourced process. It can be argued that, once a process is outsourced, most part of operational risk management process can be transferred to outsource service provider and questions arise why we bother about operational risks, as most forms of losses can be incurred in SLA or contractual agreement.
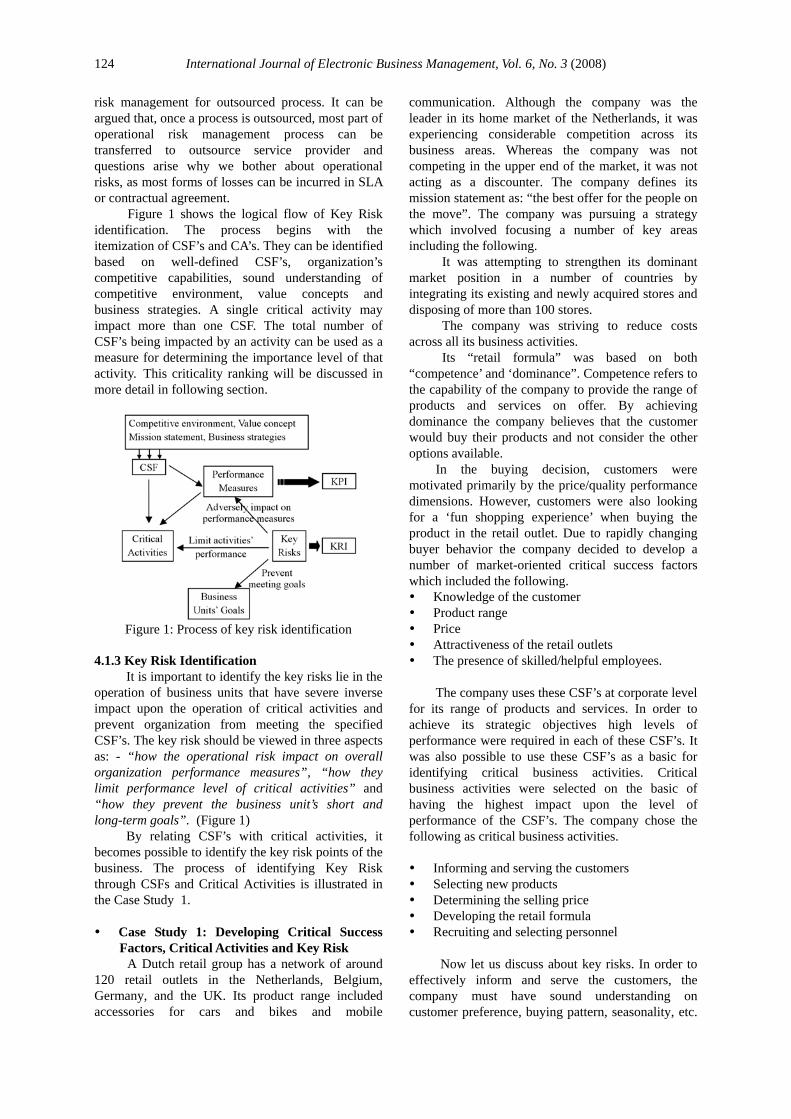
Figure 1 shows the logical flow of Key Risk identification. The process begins with the itemization of CSF’s and CA’s. They can be identified based on well-defined CSF’s, organization’s competitive capabilities, sound understanding of competitive environment, value concepts and business strategies. A single critical activity may impact more than one CSF. The total number of CSF’s being impacted by an activity can be used as a measure for determining the importance level of that activity. This criticality ranking will be discussed in more detail in following section.
Figure 1: Process of key risk identification
4.1.3 Key Risk Identification
It is important to identify the key risks lie in the operation of business units that have severe inverse impact upon the operation of critical activities and prevent organization from meeting the specified CSF’s. The key risk should be viewed in three aspects as: - “how the operational risk impact on overall organization performance measures”, “how they limit performance level of critical activities” and “how they prevent the business unit’s short and long-term goals”. (Figure 1)
By relating CSF’s with critical activities, it becomes possible to identify the key risk points of the business. The process of identifying Key Risk through CSFs and Critical Activities is illustrated in the Case Study 1. Case Study 1: Developing Critical Success
Factors, Critical Activities and Key Risk A Dutch retail group has a network of around
120 retail outlets in the Netherlands, Belgium, Germany, and the UK. Its product range included accessories for cars and bikes and mobile
communication. Although the company was the leader in its home market of the Netherlands, it was experiencing considerable competition across its business areas. Whereas the company was not competing in the upper end of the market, it was not acting as a discounter. The company defines its mission statement as: “the best offer for the people on the move”. The company was pursuing a strategy which involved focusing a number of key areas including the following.
It was attempting to strengthen its dominant market position in a number of countries by integrating its existing and newly acquired stores and disposing of more than 100 stores.
The company was striving to reduce costs across all its business activities.
Its “retail formula” was based on both “competence’ and ‘dominance”. Competence refers to the capability of the company to provide the range of products and services on offer. By achieving dominance the company believes that the customer would buy their products and not consider the other options available.
In the buying decision, customers were motivated primarily by the price/quality performance dimensions. However, customers were also looking for a ‘fun shopping experience’ when buying the product in the retail outlet. Due to rapidly changing buyer behavior the company decided to develop a number of market-oriented critical success factors which included the following. Knowledge of the customer Product range Price Attractiveness of the retail outlets The presence of skilled/helpful employees.
The company uses these CSF’s at corporate level
for its range of products and services. In order to achieve its strategic objectives high levels of performance were required in each of these CSF’s. It was also possible to use these CSF’s as a basic for identifying critical business activities. Critical business activities were selected on the basic of having the highest impact upon the level of performance of the CSF’s. The company chose the following as critical business activities.
Informing and serving the customers Selecting new products Determining the selling price Developing the retail formula Recruiting and selecting personnel
Now let us discuss about key risks. In order to
effectively inform and serve the customers, the company must have sound understanding on customer preference, buying pattern, seasonality, etc.

Z. Z. Aung: Operational Risk Management Framework for Service Outsourcing 125
Tracking and maintaining intensive customer data could increase privacy and information security risk exposure. Selecting new product requires sound knowledge on substitute products, strong supplier relationship and good-balance of research and development cost. Risk of information theft, supply chain and outsourcing risk, etc. are associated with this critical activity. The determining of recruiting and selecting personnel as a critical activity reflected the choice of the presence of skilled/helpful employees as a CSF. For example, the analysis undertaken emphasized the importance of human resource management to the success of the company. Condition in the labor market such as increasing labor costs and high labor turnover had made it difficult to recruit high-quality personnel. In addition, the trend towards extended opening hours across all its retail outlets led to lower sales per hour and increase in labor costs.[7][8] 4.2 Phase 2: Risk Assessment and Risk Mapping
The identified risk points in the Phase 1 are to be ranked with three-dimensional risk heat map. Traditionally, risks are assessed and ranked against two dimensions- probability and severity of the risk. It is suggested to add one more dimension for clear risk communication and for ease of KRI-Bayesian network developments.
Figure 2: Three dimensions for risk ranking
4.2.1 Three Dimensions for Risk Ranking
Probability refers to the likelihood of the risk occurrence. The definition may vary according to the nature of risk. For instance, for repetitive risk events, probability means the more or less frequency of the risk exposure whereas, for one-time risk event e.g. disastrous risk, it measures on the (degree) possibility of the occurrence of the event.
Severity refers to the amount and duration of the risk impact. For instance, how much loss in monetary suffer with risk occurrence, how many sectors or divisions are being impacted or how long the business is being impacted (from disaster). The degree of severity should be measured not only in monetary term but also in reputation, brand-power,
market share, and miss-opportunity measures. The level of severity need to be measured not only in impacted duration of the disaster but also in the duration required for full recovery of the operation and fixing intangible impacts (e.g. trust, morale, etc.). Based on the impact on CSF’s and critical activities, the level of severity should be assessed and ranked accordingly. The number of critical activities that are impacted by a risk point is a good indication of its severity.
The third is the “Complexity”. This new dimension is added for better handling of outsourcing risk and KRI development. Complexity of the risk is contributed by the degree of processes and their associated risks’ interdependency, detection/ measurement difficulty, and time constraint. The interdependency of the processes makes it impossible to isolate the effect of the deficient process or error prone activities. Firms normally outsource the most modular (least interdependent) process. However, as firms are transforming themselves from multiple outsourcing arrangements into strategic alignment where more and more value-creating processes are being outsourced, the interdependency issues need to be considered more seriously. As we discussed in previous phase, the proposed operational risk management framework focuses on critical activities, the interdependency between critical activities and other in-house or outsourced activities must be assessed seriously.
The scale for these dimensions should be in easily readable form. It is suggested to use general levels as: low, medium and high. Historical data can be used to rank probability and severity of each identified key risk. Some well structured questionnaire can be used to elicit the opinions of experts (process owners) in case of data scarcity.
For the complexity dimension, structural and dependency analysis can be done in addition to questionnaire. In order to obtain unbiased view on dependency, firstly, the practitioner should identify the pair of key risk and closely coupled critical activity. Then, the level of interconnectivity among CA’s can provide a good foundation for complexity ranking. 4.3 Phase 3: Development of KRI-Bayesian Networks
After identifying and ranking critical risk points, it is to construct risk monitoring networks based on underlying risk indicators using Bayesian Network methodology. Each network must be targeted at certain critical risk point and must be able to track the fulfillment of relating CSF’s. These networks may exist within single business line or may span across a set of business lines. Some of these networks may use a number of firm-wide composite KRI for tracking their own risk point. For instance, staff quality index,

126 International Journal of Electronic Business Management, Vol. 6, No. 3 (2008)
information security index for the whole firm may be used in some business-unit-specific risk point tracking network. (However, some index may vary depending on the nature of business unit.) 4.3.1 Triple-E for KRI Evaluation
Risk indicators are classified in respect of their application in the operational management. According to the nature of risk point, the perspective of monitoring on an operational activity may vary. We define three categories by their application. They are effectiveness, efficiency and exposure (Figure 3).
Figure 3: Triple-E for KRI evaluation
Effectiveness category contains KRI’s that
tracks the control effectiveness of the business process and activities. Examples include number of system failure, frequency of critical system back-ups, etc. Moreover, one application of KRI is to check the effectiveness of a taken action. (Example; In order to reduce transaction error, the management provides department-wide training to staff and monitor the transaction error rate. The changing index of error rate proves the effectiveness of control (taken action)). These KRI’s are the most simple to implement and most widely used among three categories.
Efficiency category contains KRI’s that monitor deficiency of the entities (people, process, management, etc.) and underperformance of the business activities. These KRI’s prevent loss and/or reduce the occurrence frequency by monitoring the risk sources internal to the firm. These KRI’s can also be the other side of Key Performance Indicators (KPI). Although the reason for the failure of meeting the specified performance level may include many factors (examples: Changing business environment, or the prior setting of performance may be too much higher than actual performance, etc.), these KRIs monitor the risks arising from internal or external of business activities that could adversely impact on achieving performance target. Moreover, today’s intense competitive business calls for the continuous improvement of the process and business performance. These KRIs also play major role of it.
Exposure category contains KRIs that monitor the vulnerability of business operations. These KRIs track vulnerability of the system and try to reduce the severity of the loss when they occur. The idea behind these KRI’s is “not putting all eggs in one basket”.
Management commitment, organization culture and corporate culture are important factors to these risks. These KRI’s can be a form of composite indicators that require tracking of more than one causal factor (i.e., underlying risk indicator). Scenario analysis plays major role for monitoring and controlling.
These categories are not mutually exclusive and KRI’s may exist between the ranges of two or all categories. However, any KRI falls within these three scopes. 4.3.2 Time Consideration for KRI Development
Figure 4 shows the time constraint consideration on risk event. Most risk events have prior causal event or are derived from the deficiency of the business activities. The problem is to detect them in timely manner and take action appropriately. It is also important to understand that the number of available mitigant options decrease as time flies (grey section represent for it). Depending on the type of risk occurrence, it is to decide whether to take preventive actions or response action in timely manner. Practitioners need to develop KRI networks that accurately detect and report potential risk exposure with enough leading time.
Figure 4: Consideration on time constraint
4.3.3 Causal Network Construction
This section will demonstrate the network development process with a selected risk point. For demonstration purpose, a pair of CSF and CA (“product range” and “quality of product selection: QPS”) is chosen from previous Case Study. Focusing on the risk point (QPS), a causal network is developed (Figure 5a).
The causal network includes underlying causal factors (knowledge about customers, supplier capabilities, etc.) as well as measurable impact (new product sale ratio). After getting an agreed-upon causal network structure, it is to transform them into measurable (traceable) KRI network (Figure 5b). It can be observed that all leaf-nodes fall within Triple-E ranges as listed below.
Z. Z. Aung: Operational Risk Management Framework for Service Outsourcing 127
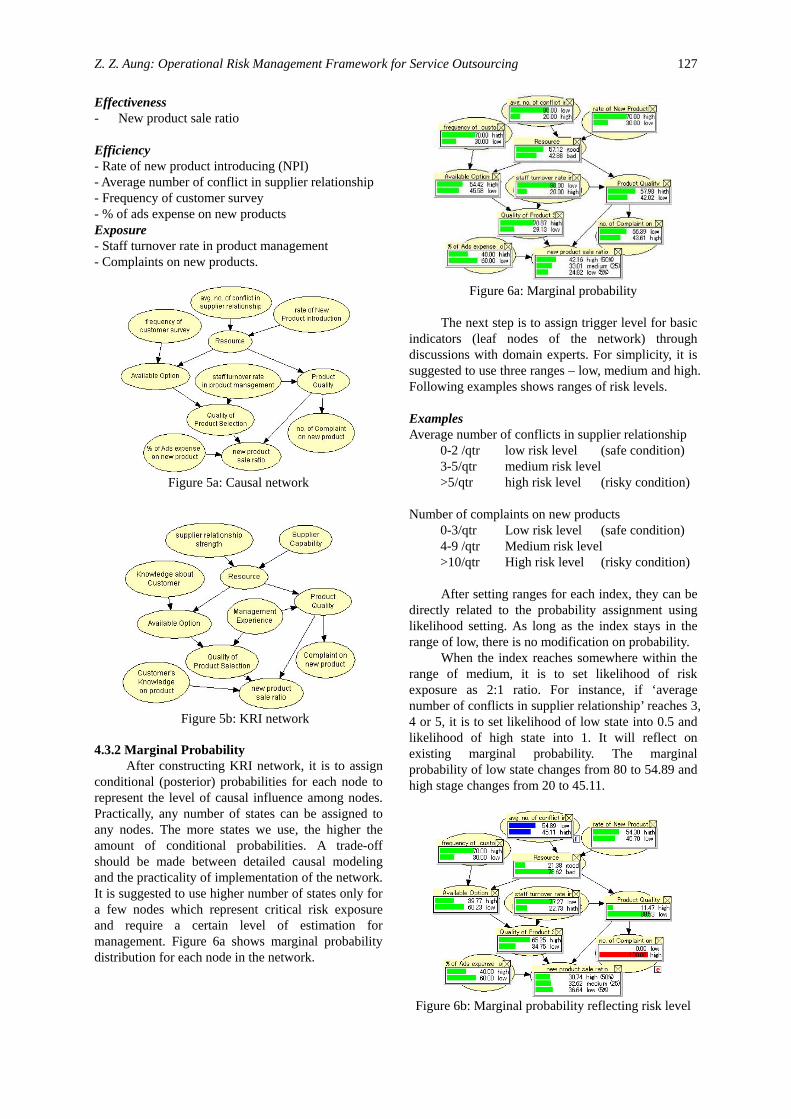
Effectiveness - New product sale ratio Efficiency - Rate of new product introducing (NPI) - Average number of conflict in supplier relationship - Frequency of customer survey - % of ads expense on new products Exposure - Staff turnover rate in product management - Complaints on new products.
Figure 5a: Causal network
Figure 5b: KRI network
4.3.2 Marginal Probability
After constructing KRI network, it is to assign conditional (posterior) probabilities for each node to represent the level of causal influence among nodes. Practically, any number of states can be assigned to any nodes. The more states we use, the higher the amount of conditional probabilities. A trade-off should be made between detailed causal modeling and the practicality of implementation of the network. It is suggested to use higher number of states only for a few nodes which represent critical risk exposure and require a certain level of estimation for management. Figure 6a shows marginal probability distribution for each node in the network.
Figure 6a: Marginal probability
The next step is to assign trigger level for basic
indicators (leaf nodes of the network) through discussions with domain experts. For simplicity, it is suggested to use three ranges – low, medium and high. Following examples shows ranges of risk levels. Examples Average number of conflicts in supplier relationship 0-2 /qtr low risk level (safe condition) 3-5/qtr medium risk level >5/qtr high risk level (risky condition) Number of complaints on new products 0-3/qtr Low risk level (safe condition) 4-9 /qtr Medium risk level >10/qtr High risk level (risky condition)
After setting ranges for each index, they can be
directly related to the probability assignment using likelihood setting. As long as the index stays in the range of low, there is no modification on probability.
When the index reaches somewhere within the range of medium, it is to set likelihood of risk exposure as 2:1 ratio. For instance, if ‘average number of conflicts in supplier relationship’ reaches 3, 4 or 5, it is to set likelihood of low state into 0.5 and likelihood of high state into 1. It will reflect on existing marginal probability. The marginal probability of low state changes from 80 to 54.89 and high stage changes from 20 to 45.11.
Figure 6b: Marginal probability reflecting risk level
128 International Journal of Electronic Business Management, Vol. 6, No. 3 (2008)
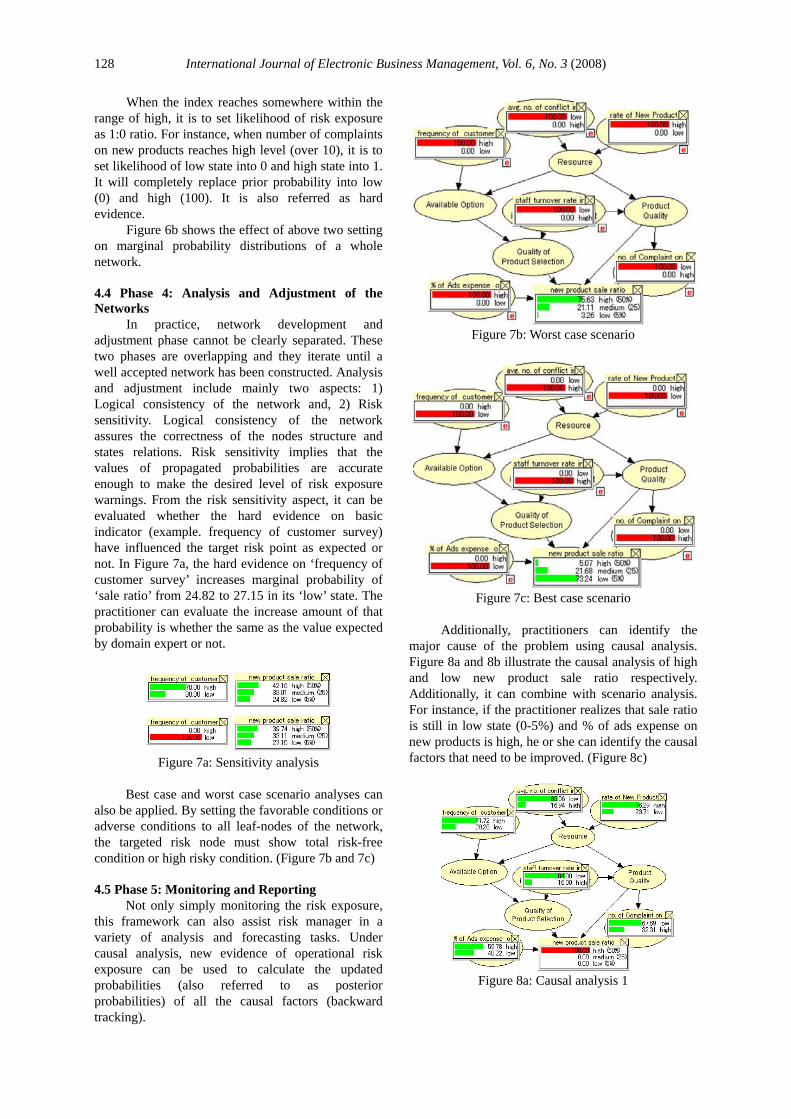
When the index reaches somewhere within the range of high, it is to set likelihood of risk exposure as 1:0 ratio. For instance, when number of complaints on new products reaches high level (over 10), it is to set likelihood of low state into 0 and high state into 1. It will completely replace prior probability into low (0) and high (100). It is also referred as hard evidence.
Figure 6b shows the effect of above two setting on marginal probability distributions of a whole network. 4.4 Phase 4: Analysis and Adjustment of the Networks
In practice, network development and adjustment phase cannot be clearly separated. These two phases are overlapping and they iterate until a well accepted network has been constructed. Analysis and adjustment include mainly two aspects: 1) Logical consistency of the network and, 2) Risk sensitivity. Logical consistency of the network assures the correctness of the nodes structure and states relations. Risk sensitivity implies that the values of propagated probabilities are accurate enough to make the desired level of risk exposure warnings. From the risk sensitivity aspect, it can be evaluated whether the hard evidence on basic indicator (example. frequency of customer survey) have influenced the target risk point as expected or not. In Figure 7a, the hard evidence on ‘frequency of customer survey’ increases marginal probability of ‘sale ratio’ from 24.82 to 27.15 in its ‘low’ state. The practitioner can evaluate the increase amount of that probability is whether the same as the value expected by domain expert or not.
Figure 7a: Sensitivity analysis
Best case and worst case scenario analyses can
also be applied. By setting the favorable conditions or adverse conditions to all leaf-nodes of the network, the targeted risk node must show total risk-free condition or high risky condition. (Figure 7b and 7c) 4.5 Phase 5: Monitoring and Reporting
Not only simply monitoring the risk exposure, this framework can also assist risk manager in a variety of analysis and forecasting tasks. Under causal analysis, new evidence of operational risk exposure can be used to calculate the updated probabilities (also referred to as posterior probabilities) of all the causal factors (backward tracking).
Figure 7b: Worst case scenario
Figure 7c: Best case scenario
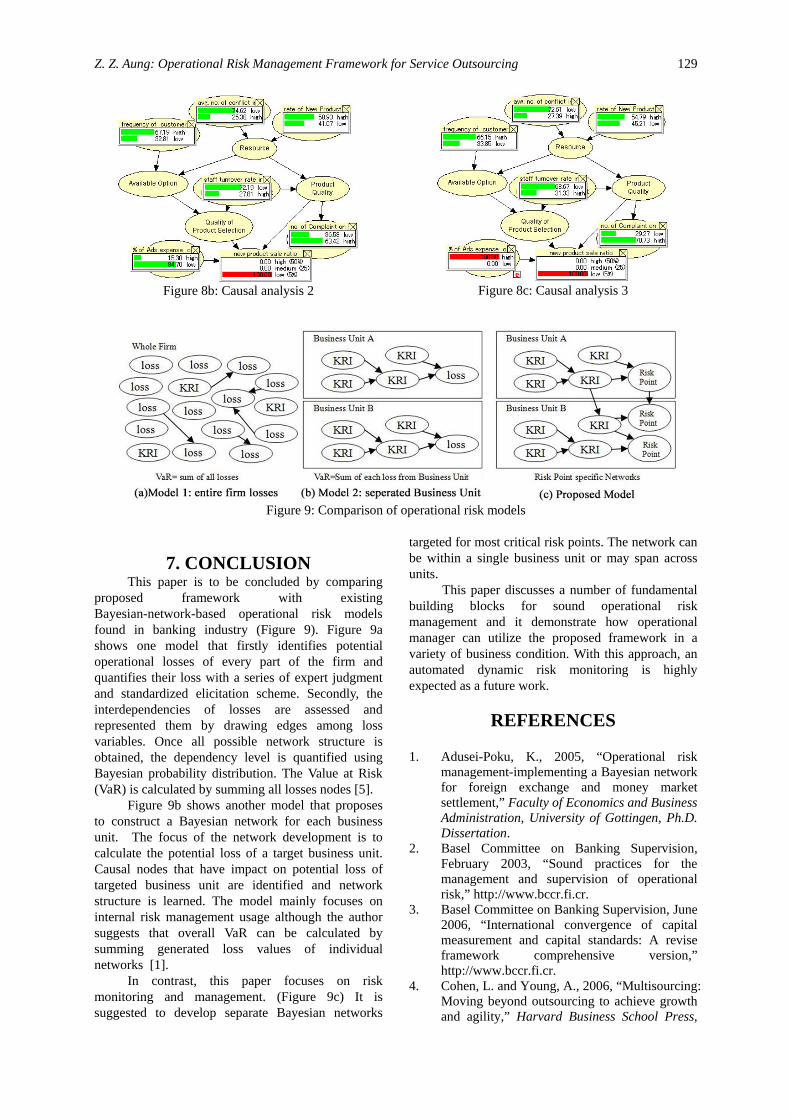
Additionally, practitioners can identify the
major cause of the problem using causal analysis. Figure 8a and 8b illustrate the causal analysis of high and low new product sale ratio respectively. Additionally, it can combine with scenario analysis. For instance, if the practitioner realizes that sale ratio is still in low state (0-5%) and % of ads expense on new products is high, he or she can identify the causal factors that need to be improved. (Figure 8c)
Figure 8a: Causal analysis 1
Z. Z. Aung: Operational Risk Management Framework for Service Outsourcing 129
Figure 8b: Causal analysis 2
Figure 8c: Causal analysis 3
Figure 9: Comparison of operational risk models
7. CONCLUSION This paper is to be concluded by comparing
proposed framework with existing Bayesian-network-based operational risk models found in banking industry (Figure 9). Figure 9a shows one model that firstly identifies potential operational losses of every part of the firm and quantifies their loss with a series of expert judgment and standardized elicitation scheme. Secondly, the interdependencies of losses are assessed and represented them by drawing edges among loss variables. Once all possible network structure is obtained, the dependency level is quantified using Bayesian probability distribution. The Value at Risk (VaR) is calculated by summing all losses nodes [5].
Figure 9b shows another model that proposes to construct a Bayesian network for each business unit. The focus of the network development is to calculate the potential loss of a target business unit. Causal nodes that have impact on potential loss of targeted business unit are identified and network structure is learned. The model mainly focuses on internal risk management usage although the author suggests that overall VaR can be calculated by summing generated loss values of individual networks [1].
In contrast, this paper focuses on risk monitoring and management. (Figure 9c) It is suggested to develop separate Bayesian networks
targeted for most critical risk points. The network can be within a single business unit or may span across units.
This paper discusses a number of fundamental building blocks for sound operational risk management and it demonstrate how operational manager can utilize the proposed framework in a variety of business condition. With this approach, an automated dynamic risk monitoring is highly expected as a future work.
REFERENCES 1. Adusei-Poku, K., 2005, “Operational risk
management-implementing a Bayesian network for foreign exchange and money market settlement,” Faculty of Economics and Business Administration, University of Gottingen, Ph.D. Dissertation.
2. Basel Committee on Banking Supervision, February 2003, “Sound practices for the management and supervision of operational risk,” http://www.bccr.fi.cr.
3. Basel Committee on Banking Supervision, June 2006, “International convergence of capital measurement and capital standards: A revise framework comprehensive version,” http://www.bccr.fi.cr.
4. Cohen, L. and Young, A., 2006, “Multisourcing: Moving beyond outsourcing to achieve growth and agility,” Harvard Business School Press,

130 International Journal of Electronic Business Management, Vol. 6, No. 3 (2008)
Boston, USA, pp. 29-32. 5. Giudici, P. and Bilotta, A., 2004, “Modeling
operational losses: A Bayesian approach,” Quality and Reliability Engineering International, John Wiley & Sons, pp. 407-417.
6. Lam, J., 2003, Enterprise Risk Management: From Incentive to Controls, Willey Finance, USA, pp. 70-81.
7. Mclvor, R., 2005, The Outsourcing Process: Strategies for Evaluation and Management, Cambridge University, Cambridge, UK, pp. 135-144.
8. Veen-Dirks, P. V. and Wijn, M., 2002, “Strategic control: Meshing critical success factors with the balance scorecard,” Long Range Planning, Vol. 35, No. 4, pp. 407-27.
ABOUT THE AUTHOR
Zaw Zaw Aung is a doctorate student from the Department of Information Science and Control Engineering at Nagaoka University of Technology, JAPAN. He received Master of Engineering Degree in Management and Information System Engineering field from the same University. His current research and teaching interests are in Risk Management, Business Continuity Planning and Critical Infrastructure Protection. (Received March 2008, revised June 2008, accepted July 2008)