Embed Size (px)
Citation preview

Operational NOAA/NESDIS Satellite Analysis Branch (SAB)
Requirements/Desires for the GPM EraSheldon J. Kusselson
NOAA/NESDIS/OSDPD/SSD/Satellite Analysis Branch (SAB)NOAA/NESDIS/OSDPD/SSD/Satellite Analysis Branch (SAB) [email protected]
Collaborators: Limin Zhao, NOAA/NESDIS/OSDPD/SSD, Precipitation Product Area Lead Matthew Seybold NOAA/NESDIS/OSDPD/SSD Tropical Product Area LeadMatthew Seybold, NOAA/NESDIS/OSDPD/SSD, Tropical Product Area Lead Ralph Ferraro and Bob Kuligowski, NOAA/NESDIS/STARMike Turk, NOAA/NESDIS/OSDPD/SSD, SAB Tropical Team Lead John Simko, NOAA/NESDIS/OSDPD/SSD, SAB Precipitation Team Lead
TRMM TMI 37GHz 0836 UTC 10 Aug AMSR-E TPW 12-23 UTC 10 Aug Blended Total Precipitable Water15-23 UTC 10 Aug
QMORPH 6h Rainfall Accumulations20-02 UTC May 18-19
1st NOAA Global Precipitation Mission (GPM) User’s WorkshopLevel 1 Level 2 Level 3 Level 4
6 12 25 38 50 62mm 0.1 0.25 0.5 0.75 1.0 1.5 2.0 2.5 3.0 4.0 in 6 12 25 38 50 62mm
1st NOAA Global Precipitation Mission (GPM) User’s Workshop August 18-19, 2010
College Park, Maryland ftp://satepsanone.nesdis.noaa.gov/Presentations/Conferences/GPM_Aug_2010.ppt1
NOAA/NESDIS/OSDPD/Satellite Services Division (SSD)/ Satellite Analysis Branch (SAB) Program Desires/Requirements
Observation Requirement
T/O Geographic Coverage
Vertical Resolution
Horizontal Resolution
Measurement Accuracy
Measurement Precision
Sampling Interval
Data Latency
ParameterProgram Desires/Requirements
Your name, affiliation, email
q
Precip. RateType: Rain/Snow
T Global ‐‐‐‐‐ ‐‐‐‐‐ 5 km 2.0 mm/h 1.0 mm/h 3 hr 2 hr
O Global ‐‐‐‐‐ ‐‐‐‐‐ < 3 km 1.0 mm/h 0.5 mm/h < 1 hr <0.5 hr
Total Precip T Global 22 km 1 0 mm 1 0 mm 3 hr 2 hr, ,Total Precip Water (TPW)
T Global ‐‐‐‐‐ ‐‐‐‐‐ 22 km 1.0 mm 1.0 mm 3 hr 2 hr
O Global ‐‐‐‐‐ ‐‐‐‐‐ < 11 km 1.0 mm 1.0 mm < 1 hr <0.5 hr
MW channel brit values
T Global ‐‐‐‐‐ ‐‐‐‐‐ 4 X 6 8 X14
km ‐‐‐‐‐‐ Deg K ‐‐‐‐‐‐ Deg K 3 hr 2 hrbrit values 85‐91GHz/ 36‐37GHz
8 X14
O Global ‐‐‐‐‐ ‐‐‐‐‐ 1 X 2 2 X 4
km ‐‐‐‐‐‐ Deg K ‐‐‐‐‐‐ Deg K < 1 hr <0.5 hr
MW T W Hemis 250 m 4 km 2.0 mm/hr 1.0 mm/h 3 hr 2 hrreflectivities (precip radar)
O Global 100 m < 2 km 1.0 mm/hr 0.5 mm/h <0.5 hr <0.5 hr
Comments/Other Desires:• Range of Rain Rates – minimum (T) 0 to 55 mm/hr; objective (O) 0 to 75 mm/hr
• Rain mask for TPW – min (T) only for moderate to heavy rain; objective (O) only for heavy rain
• Range of Total Precipitable Water – minimum (T) 1.0 to 75 mm; objective (O) 1.0 to 85 mm• Swath width – min (T) 250 km Precip Radar (PR) / 1700 km MW; objective (O) 700km PR / 2200km MW
g ( ) ; j ( )
2

NOAA/NESDIS SAB Operational Worldwide Tropical Analysis Support
Providing 24 x 7 x 365 worldwide classification of tropical disturbancesProviding 24 x 7 x 365 worldwide classification of tropical disturbances
- Current Analysis 10 Aug 2010 NASA TRMM 37GHz
Supporting NOAA NHC, DOD JTWC and RSMCs with position & intensity
• Geostationary IR/VIS/6.7μ Water Vapor• P-O microwave 85-91GHz / 36-37GHz
China S Korea0658 UTC
X
85 91GHz / 36 37GHz
- GPM Desires• Sampling min = 3h; obj = < 1h
0836 UTC
Xmin 3h; obj < 1h • Latency min = 2h; obj = < 30m • Horizontal Resolution (km)
i 4 6 / 8 14 bj 1 2 / 2 4 05W TS Dianmu min = 4x6 / 8x14; obj = 1x2 / 2x4
Future/ GPM era Product
McIDAS
Advanced Dvorak Technique (ADT) development- Combine GEO/LEO, numerical model data for more accurate position/intensity estimate
3

NOAA/NESDIS/SAB Precipitation Program
24 x 7 x 365 monitoring of heavy precipitation emphasizing 24 x 7 x 365 monitoring of heavy precipitation emphasizing satellite analysis, short term trends and rainfall estimates
Supporting NWS WFO/RFCs Satellite (SPENES) pp g
Priorities
• heavy rainfall / flash flooding
IM chat messages
graphical analysis
satellite rainfall
estimates
Satellite (SPENES) discussion messages
• moderate to heavy winter precipitation- West Coast winter storms - Great Lake snows
estimates
Supporting NWS NCEP HPCPriorites• excessive rainfall area• 0-6 hr rainfall guidance• excessive rainfall area
• precipitation trends
http://www.ssd.noaa.gov/PS/PCPN/• satellite rainfall estimates• satellite tropical rainfall
4

afternoon of Sep 9, 2009GOES 6.7μ water vaporBlended TPWGOES visibleMicrowave Rain Rates
Analysing different types of satellite data and products
<<<<<<<lower precip water values higher precip water values>>>>>>>>>>.25 .50 1.0 1.5 2.0 2.5 inches
6 12 18 25 32 38 44 50mm/hr
providing information to forecasters to help in the heavy precipitation/flash flood decision process
5

0800 utc March 14, 2010Operational Blended Total Precipitable Water (TPW) ProductOperational Blended Percent of Normal TPW Product
Level 3Level 4
• over water - blends TPW from low earth orbiting microwave satellites
l d GPS d t l d d GOES d fill i
0.25 0.50 1.0 1.5 2.0 2.5 inches• Produced by dividing TPW Product by a 1988-1999 climatology baseline through NASA Water Vapor Project
percent of normal
• overland - uses GPS data overland and GOES sounder fills in gaps- Kidder and Jones, 2007
A I t t
• Brown areas below normal; Aqua above normal; Yellow above 200%
• Can approximate 150% with 2 standard deviations above normal
Requirements in the GPM EraAccess on Internet
NOAA site at: http://www.osdpd.noaa.gov/bTPW
Best to use Mozilla Firefox Netscape
Requirements in the GPM Era
6
NWS AWIPS under: Satellite, Derived Products Imagery, Blended Total Precip Water
Best to use Mozilla - Firefox - Netscape
NWS AWIPS under: Satellite, Derived Products Imagery, Percent of Normal TPWLevel 2

Experimental Blended Rain RatesCIRA-NESDIS Exp Blended Rain Rate Product
bl d i i t f
http://cat.cira.colostate.edu
blends microwave rain rates from many different low-earth orbiting satellites
Future/GPM Era: Include GEO and other research type microwave satellites
mm/hr
0115 UTC 19 May Level 3
research type microwave satellites
NESDIS Support to NOAA/NWS
Experimental QMORPH Rain Rate Accumulations
5 in 4 3 2.5 2 1.5 1 0.75 0.50 0.25
6-hr QPF VALID 06z WED MAY 19 2010 THRU 12z WED MAY 19 2010 ISSUED:0553z WED MAY 19 2010 FORECASTER:SULLIVAN NOAA/NWS/NCEP/HPC inches
6h estimated rain accumulations ending 02 UTC 19 May
0.1 0
Max 0.75” to 1.0”Level 4
7

NOAA/NESDIS Operational Ensemble Tropical Rainfall Potential (eTRaP)
Ingredients for eTRaP 24h Forecast ending at 12 UTC 11 November 2009
WTNT21.KNHC.101431.AMSU
WTNT21.KNHC.101431.AMSU.11101023.00
WTNT21.KNHC.101431.
WTNT21.KNHC.101431. TRMM.11101259.00
WTNT21.KNHC.100834.AMSU
WTNT21.KNHC.100834.AMSU.11100821.06
WTNT21.KNHC.100251.AMSU.11100004.12
WTNT21.KNHC.100251.AMSU
WTNT21.KNHC.100251.AMSU.11092201.12
WTNT21.KNHC.100251.AMSU
WTNT21.KNHC.092053.AMSU.11091951.18
WTNT21.KNHC.092053.AMSU.11091511.18
Valid 12-18 UTC Nov 10
Valid 18-00 UTC Nov 10-11st
per
iod
Ingredients for eTRaP 24h Forecast ending at 12 UTC 11 November, 2009
WTNT21.KNHC.101431.AMSU.11101023.12
WTNT21.KNHC.101431.AMSU.11101023.06
WTNT21.KNHC.101431. TRMM.11101259.12
WTNT21.KNHC.101431. TRMM.11101259.06
WTNT21.KNHC.100834.AMSU.11100821.18
WTNT21.KNHC.100834.AMSU.11100821.12
WTNT21.KNHC.100251.AMSU.11100004.18
WTNT21.KNHC.100251.AMSU.11092201.18 Nov 10-11
Valid 00-06 UTC Nov 11
Valid 06 12 UTCTR
aP f
orec
as
WTNT21.KNHC.101431.AMSU.11101023.18
WTNT21.KNHC.101431. TRMM.11101259.18
06-12 UTC Nov 11
eT
Initialized 12utc/10 (most recent)
Initialized 06utc/10 (older)
Initialized 00utc/10 (still older)
Initialized180utc/09 (oldest)
1.0 0.85 0.70 0.55 latency weighting
http://www ssd noaa gov/PS/TROP/etrap html
Future/ GPM era eTRaP ProductGEO rain estimates storm rotation orographic enhancement
probability calibration climatology from R-clipper
http://www.ssd.noaa.gov/PS/TROP/etrap.html
probability calibration climatology from R clipper
Rain rate product Requirements in the GPM era
8

NOAA/NESDIS/OSDPD/Satellite Services Division (SSD)/ Satellite Analysis Branch (SAB) Program Desires/Requirements
Observation Requirement
T/O Geographic Coverage
Vertical Resolution
Horizontal Resolution
Measurement Accuracy
Measurement Precision
Sampling Interval
Data Latency
ParameterProgram Desires/Requirements
Your name, affiliation, email
q
Precip. RateType: Rain/Snow
T Global ‐‐‐‐‐ ‐‐‐‐‐ 5 km 2.0 mm/h 1.0 mm/h 3 hr 2 hr
O Global ‐‐‐‐‐ ‐‐‐‐‐ < 3 km 1.0 mm/h 0.5 mm/h < 1 hr <0.5 hr
Total Precip T Global 22 km 1 0 mm 1 0 mm 3 hr 2 hr, ,Total Precip Water (TPW)
T Global ‐‐‐‐‐ ‐‐‐‐‐ 22 km 1.0 mm 1.0 mm 3 hr 2 hr
O Global ‐‐‐‐‐ ‐‐‐‐‐ < 11 km 1.0 mm 1.0 mm < 1 hr <0.5 hr
MW channel brit values
T Global ‐‐‐‐‐ ‐‐‐‐‐ 4 X 6 8 X14
km ‐‐‐‐‐‐ Deg K ‐‐‐‐‐‐ Deg K 3 hr 2 hrbrit values 85‐91GHz/ 36‐37GHz
8 X14
O Global ‐‐‐‐‐ ‐‐‐‐‐ 1 X 2 2 X 4
km ‐‐‐‐‐‐ Deg K ‐‐‐‐‐‐ Deg K < 1 hr <0.5 hr
MW T W Hemis 250 m 4 km 2.0 mm/hr 1.0 mm/h 3 hr 2 hrreflectivities (precip radar)
O Global 100 m < 2 km 1.0 mm/hr 0.5 mm/h <0.5 hr <0.5 hr
Comments/Other Desires:• Range of Rain Rates – minimum (T) 0 to 55 mm/hr; objective (O) 0 to 75 mm/hr
• Rain mask for TPW – min (T) only for moderate to heavy rain; objective (O) only for heavy rain
• Range of Total Precipitable Water – minimum (T) 1.0 to 75 mm; objective (O) 1.0 to 85 mm• Swath width – min (T) 250 km Precip Radar (PR) / 1700 km MW; objective (O) 700km PR / 2200km MW
g ( ) ; j ( )
9
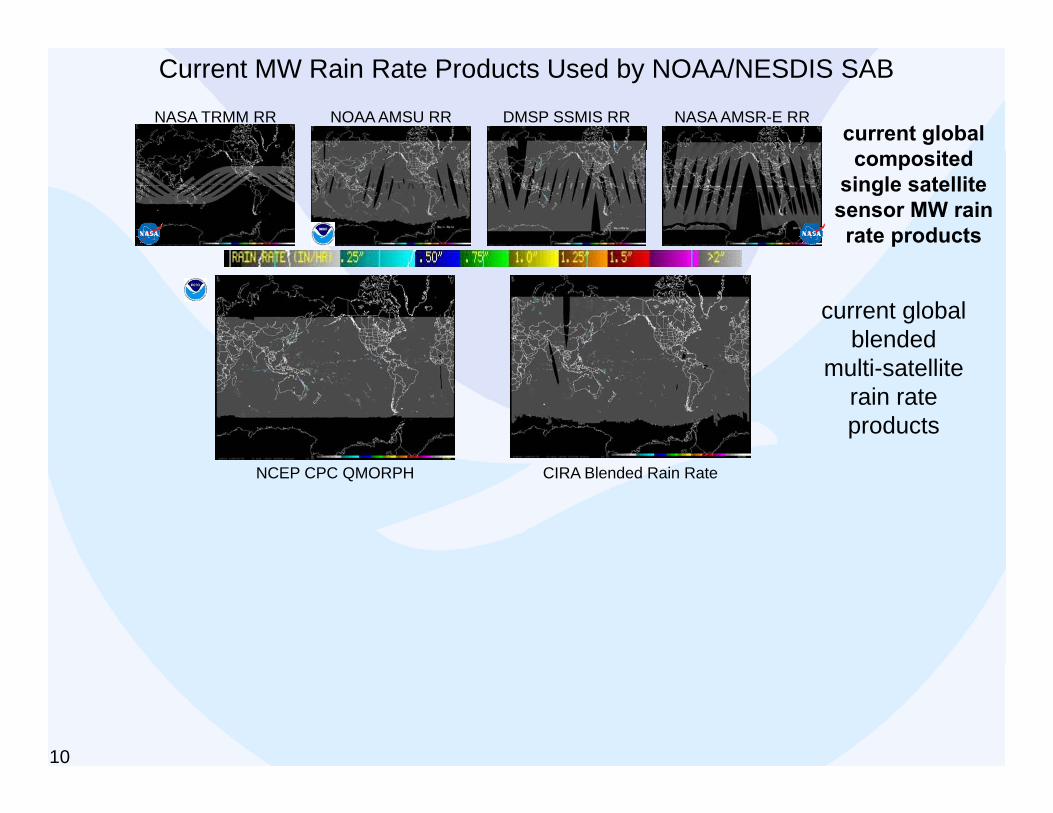
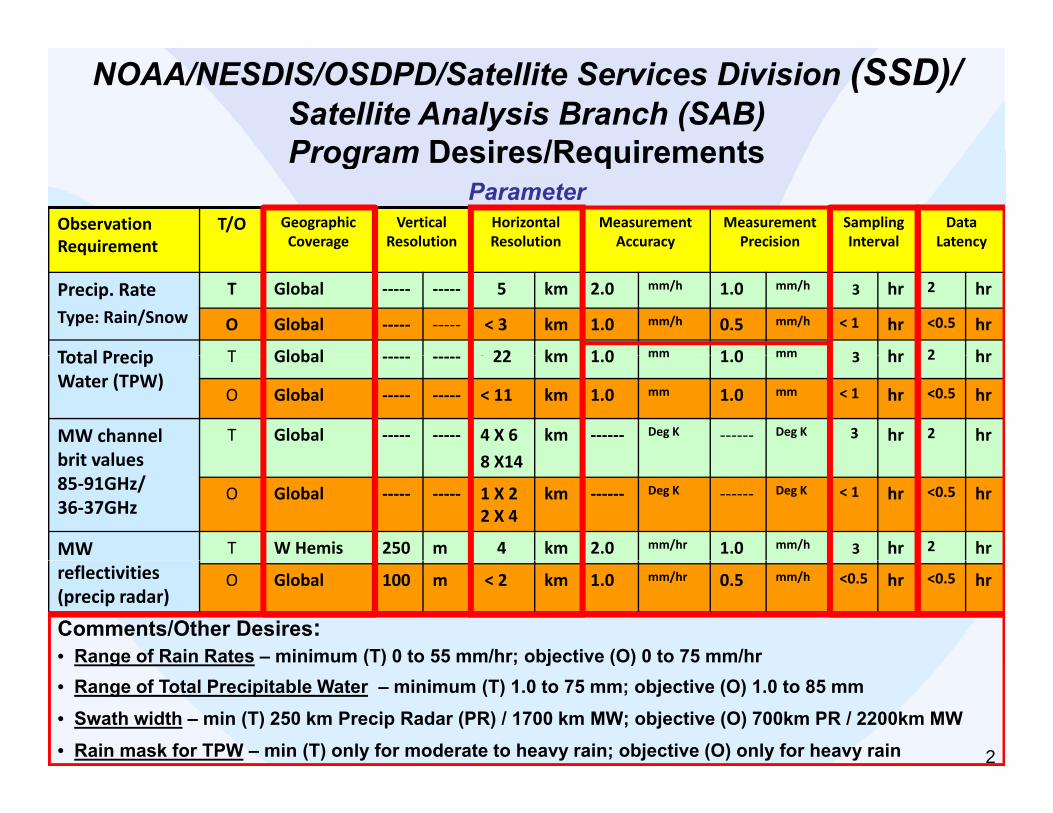
Current MW Rain Rate Products Used by NOAA/NESDIS SAB
NOAA AMSU RRNASA TRMM RR DMSP SSMIS RR NASA AMSR-E RRcurrent global composited
single satellite sensor MW rain rate products
current global blended
multi-satellite rain rate products
NCEP CPC QMORPH CIRA Blended Rain Rate
10

NOAA AMSU TPW DMSP SSMIS TPW NASA AMSR-E TPW current global composited
Current Mostly MW TPW Products Used by NOAA/NESDIS SAB
0.25 0.50 1.0 1.5 2.0 2.5 inches
composited single satellite
sensor MW TPW products
Current global blended multi-
satellite TPW product
Current global blended multi-
satellite TPW Anomaly
percent of normal
TPW Anomaly product
11